it 2. How to apply these fundamentals to realistic scenarios in sample applications where having observability is crucial 3. How Micrometer provides a unified API to instrument your code for various signals and backends 4. What is Micrometer’s new Observation API and how to use it 5. What signals to watch in your own application 6. Spring Boot’s built-in observability features and how to customize them 7. How to avoid common issues 8. How to integrate metrics with distributed tracing and logs 9. How to visualize and analyze observability data to identify issues and optimize performance 10. How to troubleshoot issues faster and more effectively 11. The latest developments around Observability
mastery) • A “secret” final branch 😈 [...] ab4ab30 Add org property 2456f04 Initial commit • slack.micrometer.io #springio2024 • Let us know! Problems? Please let us know!
We're using spring-boot-starter-parent 3.3 • The java.version property is 17 • We're using starters for: ◦ actuator, web, data-jpa, and security • We're using PostgreSQL for the datastore
• Dog and Owner JPA classes map to the schema • DogRepository and OwnerRepository are Spring Data repositories ◦ findByNameIgnoringCase is converted to JQL automatically • InfoLogger is an ApplicationRunner to log info at startup
• DogsController ◦ Simple controller used for testing • OwnerController ◦ Delegates to the OwnerService ◦ Deals with NoSuchDogOwnerException ◦ Note: Meta-annotated @RestController and @GetMapping
• SecurityConfiguration ◦ Defines our web security • SecurityProperties and UserProperties ◦ @ConfigurationProperties maps from values in src/main/resources/application.yml
Inspect application.yml ◦ Defines the database connection ◦ Configures JPA ◦ Enables JMX ◦ Configures server errors ◦ Exposes all actuator endpoints ◦ Enables actuators over HTTP ◦ Customizes a metric name ◦ Defines the in-memory user details
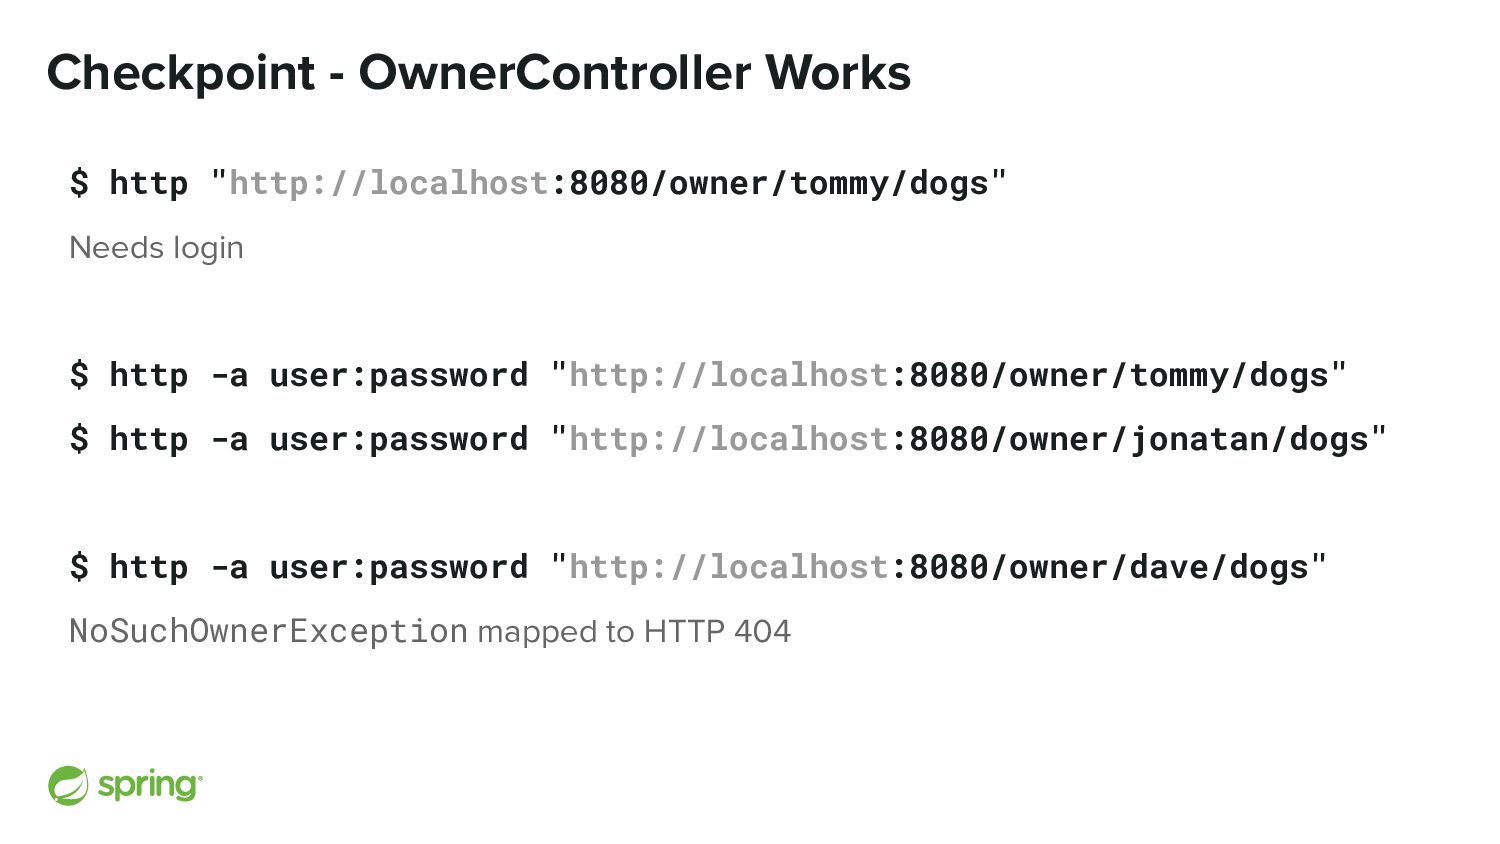
http -a user:password "http://localhost:8080/owner/tommy/dogs" $ http -a user:password "http://localhost:8080/owner/jonatan/dogs" $ http -a user:password "http://localhost:8080/owner/dave/dogs" NoSuchOwnerException mapped to HTTP 404
the following in a web browser: http://localhost:8080/actuator http://localhost:8080/actuator/metrics http://localhost:8080/actuator/metrics/http.server.requests
little and apps are going down there We need to deal with unknown unknowns We can’t know everything Things can be perceived differently by observers Everything is broken for the users but seems ok to you Why do we need Observability?
from production incidents Lower mean time to recovery (MTTR) Require less specialized knowledge Shared method of investigating across system Quantify user experience Don't guess, measure!
Max: 150 ms Distributed Tracing DB was slow (lot of data was requested) Error Logging Request failed (stacktrace?) Metrics The error rate is 0.001/sec 2 errors in the last 30 minutes Distributed Tracing DB call failed (invalid input)
it 2. How to apply these fundamentals to realistic scenarios in sample applications where having observability is crucial 3. How Micrometer provides a unified API to instrument your code for various signals and backends 4. What is Micrometer’s new Observation API and how to use it 5. What signals to watch in your own application 6. Spring Boot’s built-in observability features and how to customize them 7. How to avoid common issues 8. How to integrate metrics with distributed tracing and logs 9. How to visualize and analyze observability data to identify issues and optimize performance 10. How to troubleshoot issues faster and more effectively 11. The latest developments around Observability
Java) Simple API for logging libraries Logback Natively implements the SLF4J API If you want Log4j2 instead of Logback: - spring-boot-starter-logging + spring-boot-starter-log4j2 Logging with JVM/Spring: SLF4J + Logback
something that we can use to query: ◦ All of our apps (spring.application.org) ◦ Only one app (spring.application.name) ◦ Only one instance (we only have one instance/app) spring: application: name: dog-service org: petclinic
Grafana: http://localhost:3000 • Choose Explore, then Loki from the drop down • Search for application = dog-service • Search for org = petclinic • We will get back to our logs later
Like SLF4J, but for metrics API is independent of the configured metrics backend Supports many backends Comes with spring-boot-actuator Spring projects are instrumented using Micrometer Many third-party libraries use Micrometer
401 🧐 • Prometheus? http://localhost:9090/targets • Spring Security! 👀 • Let’s disable it, what could go wrong!? 😈 • Everyone, please don’t do this in prod! • Unless you want everyone to know about it. 😈
We want to see the latency distributions on our dashboards • We want to calculate percentiles (tp99?) management: metrics: distribution: percentiles-histogram: # all: true http.server.requests: true
• Let’s check /actuator/metrics /actuator/metrics/{metricName} /actuator/metrics/{metricName}?tag=key:value • Let’s write a Prometheus query (HELP.md) sum by (application) (rate(http_server_requests_seconds_count[5m])) • Let’s check the dashboards: go to Grafana, then Browse ◦ Spring Boot Statistics ◦ Dogs
Boot 3.x: Micrometer Tracing (Sleuth w/o Spring dependencies) Provide an abstraction layer on top of tracing libraries - Brave (OpenZipkin), default - OpenTelemetry (CNCF), experimental Instrumentation for Spring Projects, 3rd party libraries, your app Support for various backends
you are on Spring Boot 3.1 or above, this is not needed • If you are on 3.1 or lower, you need to set logging.pattern.level • We are on 3.3! logging: level: org.springframework.web.servlet.DispatcherServlet: DEBUG
it 2. How to apply these fundamentals to realistic scenarios in sample applications where having observability is crucial 3. How Micrometer provides a unified API to instrument your code for various signals and backends 4. What is Micrometer’s new Observation API and how to use it 5. What signals to watch in your own application 6. Spring Boot’s built-in observability features and how to customize them (to be continued…) 7. How to avoid common issues 8. How to integrate metrics with distributed tracing and logs 9. How to visualize and analyze observability data to identify issues and optimize performance 10. How to troubleshoot issues faster and more effectively 11. The latest developments around Observability (to be continued…)
it 2. How to apply these fundamentals to realistic scenarios in sample applications where having observability is crucial 3. How Micrometer provides a unified API to instrument your code for various signals and backends (to be continued…) 4. What is Micrometer’s new Observation API and how to use it 5. What signals to watch in your own application 6. Spring Boot’s built-in observability features and how to customize them (to be continued…) 7. How to avoid common issues 8. How to integrate metrics with distributed tracing and logs 9. How to visualize and analyze observability data to identify issues and optimize performance 10. How to troubleshoot issues faster and more effectively 11. The latest developments around Observability (to be continued…)
available if you request the OpenMetrics format • Your browser does not do this http :8081/actuator/prometheus / 'Accept: application/openmetrics-text;version=1.0.0' | grep trace_id
it 2. How to apply these fundamentals to realistic scenarios in sample applications where having observability is crucial 3. How Micrometer provides a unified API to instrument your code for various signals and backends (to be continued…) 4. What is Micrometer’s new Observation API and how to use it 5. What signals to watch in your own application (to be continued…) 6. Spring Boot’s built-in observability features and how to customize them 7. How to avoid common issues 8. How to integrate metrics with distributed tracing and logs 9. How to visualize and analyze observability data to identify issues and optimize performance 10. How to troubleshoot issues faster and more effectively 11. The latest developments around Observability (to be continued…)
abstract class to create/store Meters • Backends have implementations of MeterRegistry • SimpleMeterRegistry (debugging, testing, actuator) • SimpleMeterRegistry#getMetersAsString • CompositeMeterRegistry
events and report these every minute • The event happened 3 times in the first minute, 2 times in the second, and once in the third • Cumulative says: 3, 5, 6 (running total) • Delta says: 3, 2, 1 (difference)
• any resourceId (lots of resources) • requestId/txId/traceId/spanId/etc. • Request URL • Any (unsanitized) user input • Please always sanitize/normalize any user input! • Otherwise: DoS 😞 High Cardinality 🧐
In cases where it isn’t possible to avoid it, see: • MeterFilter.maximumAllowableMetrics(...); • MeterFilter.maximumAllowableTags(...); • MeterFilter.ignoreTags(...); • HighCardinalityTagsDetector
• Non-monotonic: can increase and decrease • “Asynchronous” • “Heisen-Gauge” • “State” should be mutable and “referenced” • Examples: queue size, number of threads, CPU temperature Never gauge something you can count with a Counter!
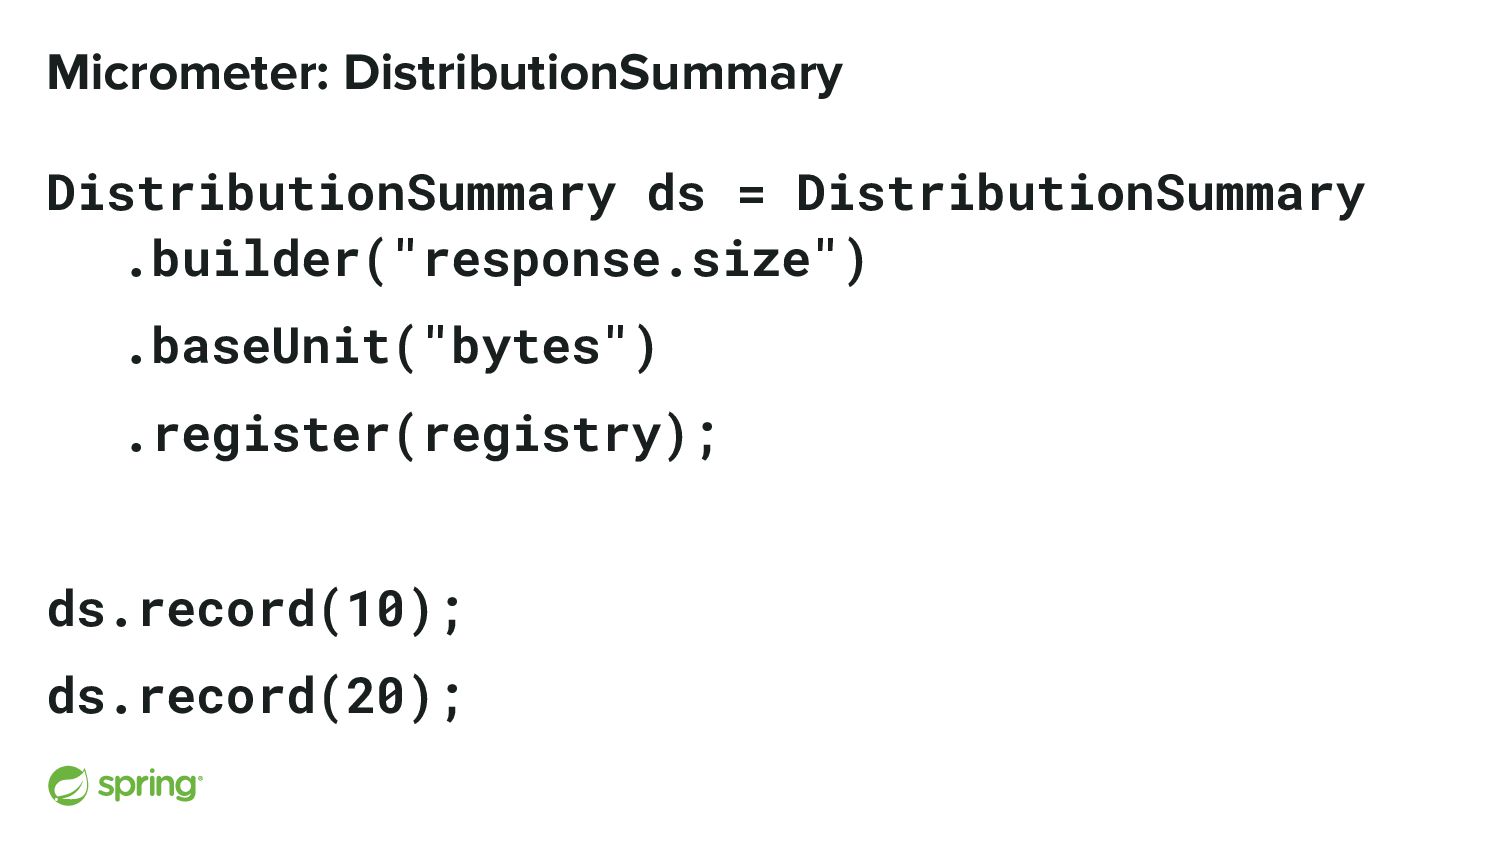
It has one method: record(amount) • Always reports count, sum, max • Can report: Histograms, SLOs, and Percentiles • Example: payload sizes of requests and responses
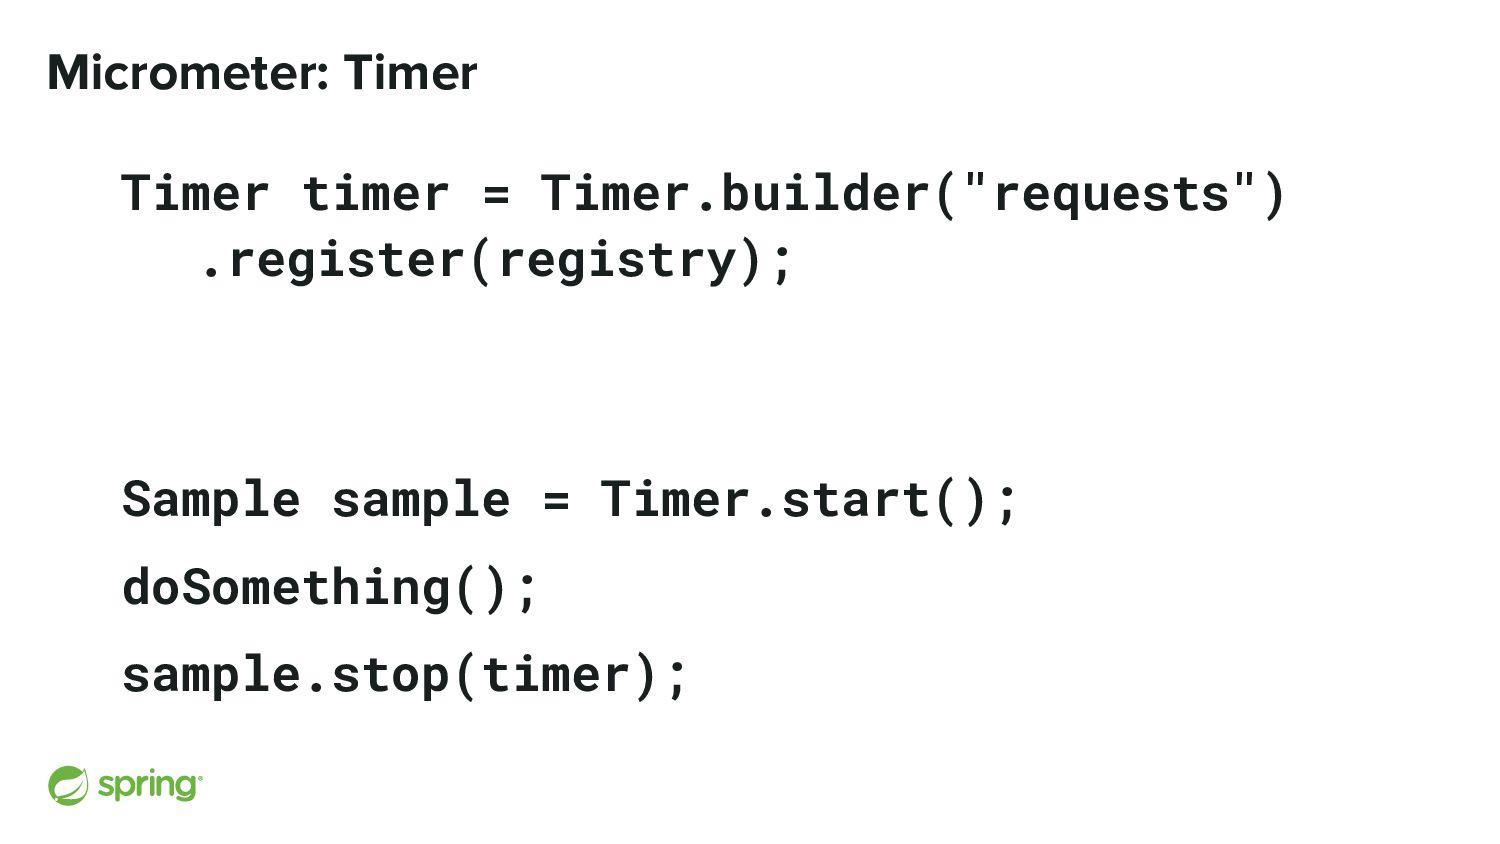
DistributionSummary but the unit is time • Multiple ways to record latency • Always reports count, sum, max • Can report: Histograms, SLOs, and Percentiles • Example: processing time of incoming requests Never count something that you can time with a Timer or summarize with a DistributionSummary!
Micrometer • wallTime [ms]: for the current time, not for elapsed time • monotonicTime [ns]: for measuring elapsed time • Testing: MockClock, you can set the time with it 😈 no Thread.sleep(...)
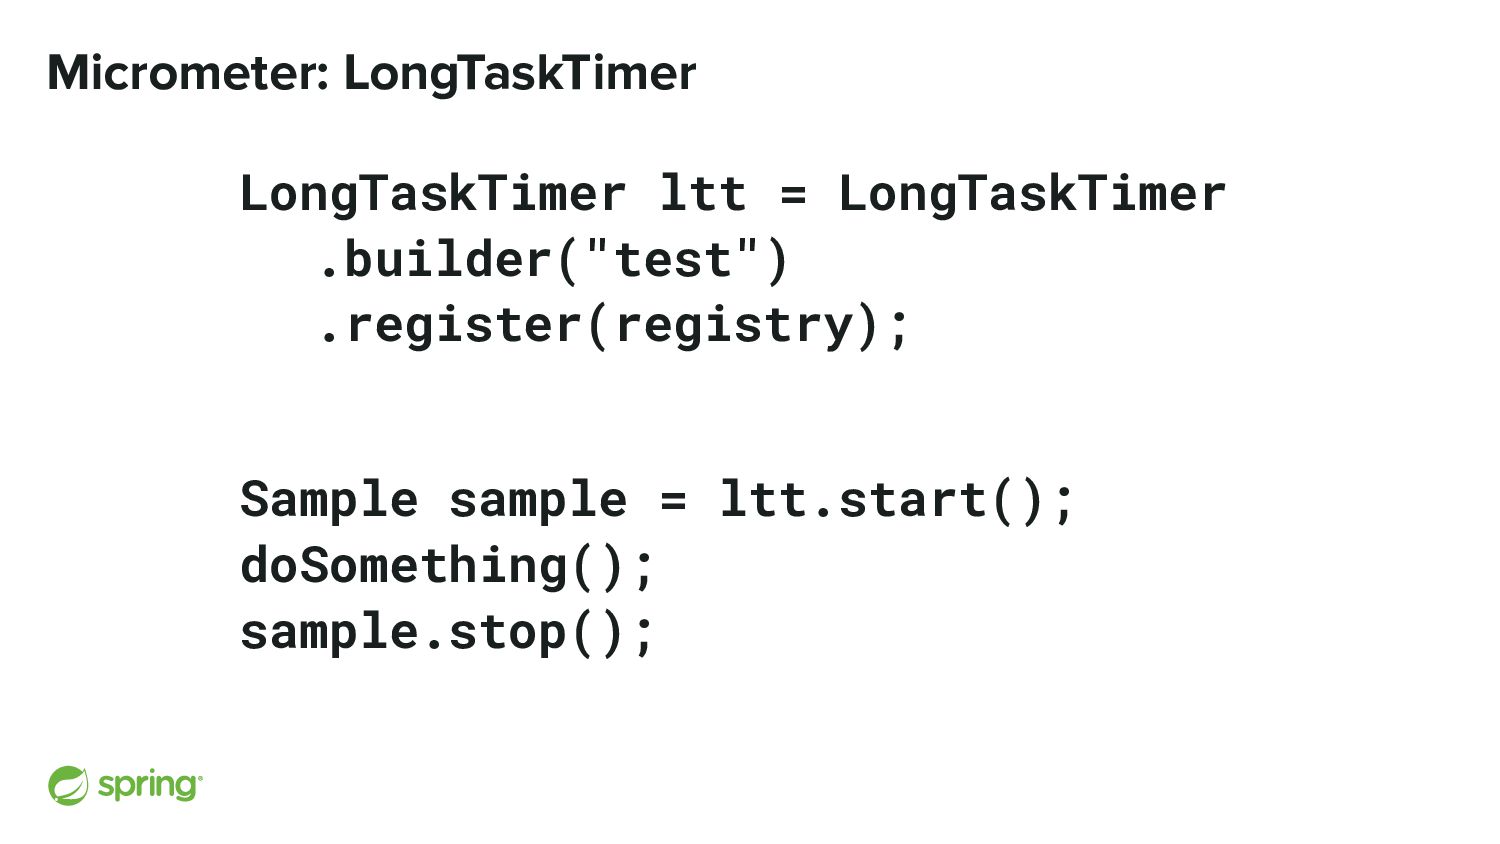
of active events • Timer records latency after the events finished • LongTaskTimer records latency of running events • Timer: past, LongTaskTimer: present • Always reports count, sum, max • Can report: Histograms, SLOs, and Percentiles • Example: processing time of in-progress requests
on the client side • Not aggregatable and only percentiles configured up-front are available • Use Histogram instead if you can Timer.builder("requests") .publishPercentiles(0.99, 0.999) .register(registry);
“frequency” of values in a certain range • Arbitrary percentiles are approximated on the backend • Aggregatable! Timer.builder("requests") .publishPercentileHistogram() .register(registry);
• Specific thresholds so you can count recordings above/below the threshold Timer.builder("requests") .serviceLevelObjectives(Duration.ofMillis(10)) .register(registry);
it 2. How to apply these fundamentals to realistic scenarios in sample applications where having observability is crucial 3. How Micrometer provides a unified API to instrument your code for various signals and backends 4. What is Micrometer’s new Observation API and how to use it 5. What signals to watch in your own application 6. Spring Boot’s built-in observability features and how to customize them 7. How to avoid common issues 8. How to integrate metrics with distributed tracing and logs 9. How to visualize and analyze observability data to identify issues and optimize performance 10. How to troubleshoot issues faster and more effectively 11. The latest developments around Observability
it 2. How to apply these fundamentals to realistic scenarios in sample applications where having observability is crucial 3. How Micrometer provides a unified API to instrument your code for various signals and backends 4. What is Micrometer’s new Observation API and how to use it 5. What signals to watch in your own application 6. Spring Boot’s built-in observability features and how to customize them 7. How to avoid common issues 8. How to integrate metrics with distributed tracing and logs 9. How to visualize and analyze observability data to identify issues and optimize performance 10. How to troubleshoot issues faster and more effectively 11. The latest developments around Observability
![Creating a MeterRegistry PrometheusMeterRegistry registry = new PrometheusMeterRegistry(PrometheusConfig.DEFAULT); // [...]](https://files.speakerdeck.com/presentations/d1bd8c06600141129f09b7a2f14728e2/slide_107.jpg)