Upgrade to Pro — share decks privately, control downloads, hide ads and more …

Data in IT: Reflections from three decades of l...

Data in IT: Reflections from three decades of learning

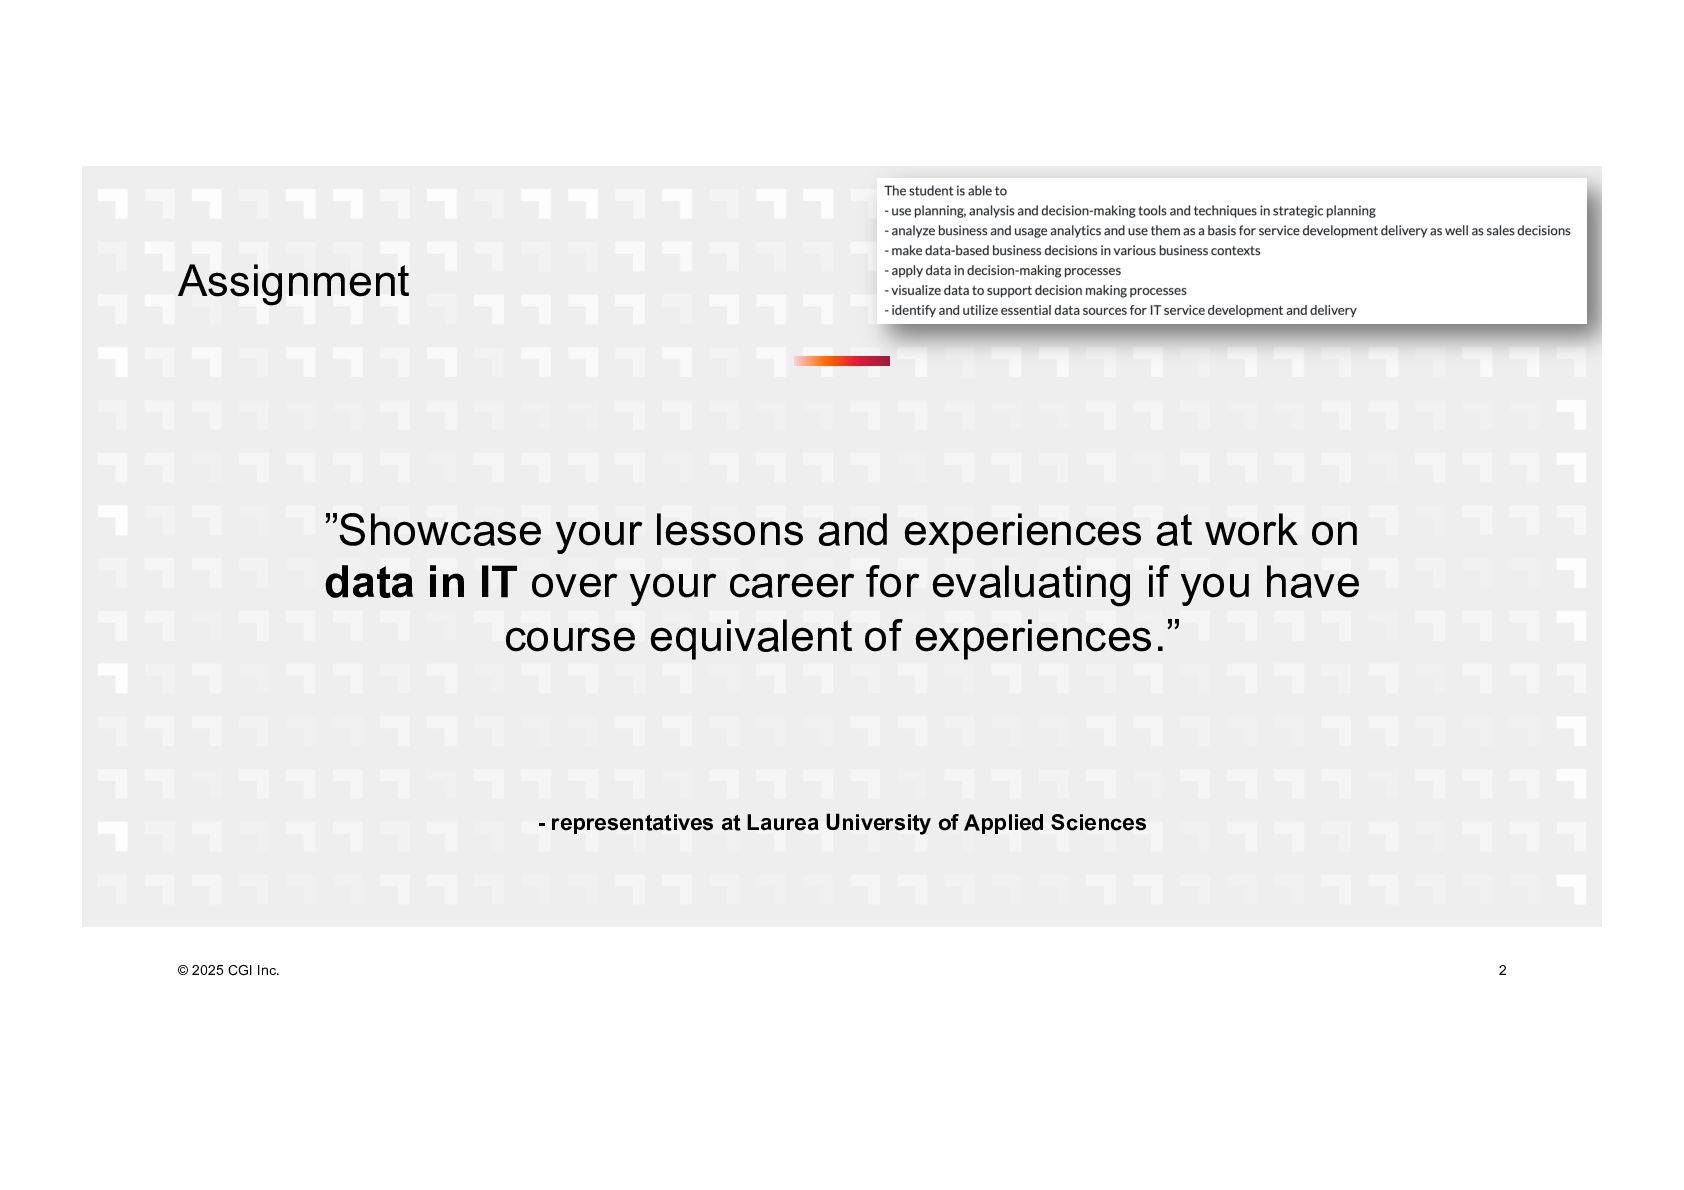
I was given an assignment to reflect on a themed slice of my learning at and for work. It was well received by the teachers, and has only pieces previously made public outside the reflection timeline so I chose to share it even if it was delivered to an audience of two.

Avatar for Maaret Pyhäjärvi

Maaret Pyhäjärvi

May 08, 2025
Tweet

Transcript

  1. © 2025 CGI Inc. 2 Assignment ”Showcase your lessons and

    experiences at work on data in IT over your career for evaluating if you have course equivalent of experiences.” - representatives at Laurea University of Applied Sciences
  2. © 2025 CGI Inc. 3 Insights over time 1 0

    / 1 9 9 7 0% L o c a liz a t io n t e s t in g 10/1998 Data entry Bug tracking, test management and time reporting systems enforcing data entry rules 10/2000 Reporting in numbers Bug tracking and test management systems as data sources ODC by IBM 0 9 / 2 0 0 1 15% P u b lic s p e a k in g 06/2002 Qualitative to quantitative Test process improvement checklists as data Integration and migration as test targets, test data 08/2008 Metrics AMA Paired Ask me Anything trainings on metrics 0 4 / 2 0 1 2 54% P ro d u c t d e v e lo p m e n t 11/2012 Code, commits, telemetry in scale Expanding data awareness to code size, complexity, change and user telemetry 09/2014 Strategic storytelling One with both numbers and story wins more often Data collection comes with opportunity cost 0 6 / 2 0 1 8 75% E n g in e e rin g m a n a g e m e n t 04/2020 Data integration platforms From manual data collection to real- time dashboards 04/2023 Productivity metrics Measurements for a better world, also on software 0 5 / 2 0 2 5 99% T e s t in g s e rv ic e s b u s in e s s d e v e lo p m e n t 2025 ˜ ˜ ˜ ˜ ˜ Financial data Measuring business success and driving process consistency with targets.
  3. © 2025 CGI Inc. 4 Quality reporting 2012 STORIES WITH

    DATA – PROUD CAREER MOMENTS SAMPLED 4 Numbers and trends secondary to capturing people’s perceptions.
  4. © 2025 CGI Inc. 5 Personally reporting and getting fixed

    2261 issues over a period of 2,5 years. Lowering login to logged failures rate from 17,8 to 0,5%. 5 Photo by Sarah Kilian on Unsplash 2014
  5. © 2025 CGI Inc. 6 Quality debt 2017 STORIES WITH

    DATA – PROUD CAREER MOMENTS SAMPLED 6 SHORT-TERM DEBT LONG-TERM DEBT PER SEVERITIES PER PRIORITIES PER SEVERITIES PER PRIORITIES TOTAL INCOMING DEBT CANDIDATE S TOTAL OUTGOING DEBT CANDIDATE S TRASHED - POTENTIALL Y AS JUST CLEANUP TOTAL CHANGE TO DEBT HIGH LOW HIGH LOW UNKN OWN HIGH LOW HIGH LOW UNKN OWN TOTAL FIXING DEBT UN- TESTED DEBT DEBT PERCEN TAGE TRUE SHOULD- AVOID DEBT PERCENTAGE November Sprint (11/2007) 285 171 18 -114 10 6 1 11 4 0 3 0 3 0 16 0 5,6% 0,4% December Sprint (12/2007) 218 154 23 -64 11 15 1 12 13 0 2 0 2 0 26 2 11,9% 0,5% January Sprint (01/2008) 190 201 38 11 9 17 3 17 6 1 8 0 9 0 29 6 15,3% 1,6% February Sprint (02/2008) 159 128 48 -31 20 11 6 19 6 0 4 0 4 0 33 2 20,8% 3,8% March Sprint (03/2008) 220 226 136 6 20 13 3 16 14 1 4 0 5 0 35 3 15,9% 1,4% April Sprint (03/2008) 239 330 149 91 29 34 14 39 10 0 0 0 0 0 53 10 22,2% 5,9% May Sprint (03/2008) 316 376 362 60 52 56 24 61 23 1 3 0 3 1 96 16 30,4% 7,6% TOTALS OVER PRODUCT LINE LIFECYCLE 18083 16962 -1121 280 312 76 396 120 176 353 3 516 10 535 57 3,0% 0,4% Trend: 6 month average debt percentage Looking at it now (start-of-June) 19,4% Looking at it start-of-April 38,2% Looking at it last July 26,0%
  6. © 2025 CGI Inc. 7 Test automation: satisfaction and maturity

    2019, 2021 STORIES WITH DATA – PROUD CAREER MOMENTS SAMPLED Increasing speed to release (from 2-4 releases to 9 releases) (from 1 release to 9 releases) Decreasing time to making release (from 5 days to 4 hours) (from 34 days to 2 days) Improving team productivity (11 team members, 2917 code changes out of 6583 for 3 teams) (significant investment) Shared platform work efficiency Sustainable test automation maintenance effort Finding relevant issues (new product in days, MANY timing issues and regressions) (new product in days, MANY new issues) High satisfaction of customers (167 support issues, 1 escalation for millions of customers) (new product, few customers) High test efficiency (213 708 tests in single working day) (~100 tests each night, green within day) Reasonable investment in test automation process improvement (ehh, none) (significant) 7
  7. © 2025 CGI Inc. 8 Testers classify systems Test targets

    Systems tested are often data-intensive, with variety of design choices for data. They come with significant uncertainty on quality. Production systems Someone else’s test targets become the systems we run our work and business on. User systems Integrations to non-work systems (e.g. social media) add to the systems processing data.
  8. © 2025 CGI Inc. 9 Production systems: data is localized

    for apps and distributed 9 Hour reporting Software development systems CRM and ERP systems HR systems Support systems Bug tracking Test management Version control Ticketing systems Financial reporting Inventory reporting Recruiting Telemetry
  9. © 2025 CGI Inc. 10 What else should we talk

    about? REVISITING THE CURRICULUM 1. use planning, analysis and decision-making tools and techniques in strategic planning SWOT, Balanced Scorecard à SPACE, GQM à OKRs. Risks, options, roadmaps. 2. analyze business and usage analytics and use them as a basis for service development delivery as well as sales decisions Financial numbers and user data drive reality. ARR for services. 3. make data-based business decisions in various business contexts TCO and ROI all the way. Costs, benefits but particularly opportunity costs. 4. apply data in decision-making processes Decision-making and goal-setting. Continuous search for patterns and anomalies in testing. 5. visualize data to support decision making processes Pivot tables and excel graphs to PowerBI to building with data visualization libraries 6. identify and utilize essential data sources for IT service development and delivery Types of data, systems as sources. Benchmarking. 10
  10. © 2025 CGI Inc. 11 Insights you can act on

    Founded in 1976, CGI is among the largest IT and business consulting services firms in the world. We are insights-driven and outcomes-focused to help accelerate returns on your investments. Across hundreds of locations worldwide, we provide comprehensive, scalable and sustainable IT and business consulting services that are informed globally and delivered locally. cgi.com