Upgrade to Pro
— share decks privately, control downloads, hide ads and more …
Speaker Deck
Features
Speaker Deck
PRO
Sign in
Sign up for free
Search
Search
VISUALIZING MARATHON 2012 - DESIGNER Q&A
Search
Moritz Stefaner
November 10, 2012
2.3k
0
Share
Embed
Copy iframe code
Copy JS code
Copy link
Start on current slide
VISUALIZING MARATHON 2012 - DESIGNER Q&A
Moritz Stefaner
November 10, 2012
More Decks by Moritz Stefaner
See All by Moritz Stefaner
Data Worlds — Boris Mueller & Moritz Stefaner - SAP UX Day 2016.pdf
moritzstefaner
1
280
"Weltbilder": course info
moritzstefaner
2
18k
What's the story? Visual Narratives
moritzstefaner
4
2.5k
emoto — Visualising the online response to London 2012
moritzstefaner
3
11k
Truth & Beauty Operations
moritzstefaner
2
470
OMG — It's all connected
moritzstefaner
2
4.8k
Featured
See All Featured
The World Runs on Bad Software
bkeepers
PRO
72
12k
HU Berlin: Industrial-Strength Natural Language Processing with spaCy and Prodigy
inesmontani
PRO
0
530
DevOps and Value Stream Thinking: Enabling flow, efficiency and business value
helenjbeal
1
260
Primal Persuasion: How to Engage the Brain for Learning That Lasts
tmiket
0
390
Discover your Explorer Soul
emna__ayadi
2
1.2k
Measuring & Analyzing Core Web Vitals
bluesmoon
9
880
Amusing Abliteration
ianozsvald
1
230
The Straight Up "How To Draw Better" Workshop
denniskardys
239
140k
How to make the Groovebox
asonas
2
2.3k
How Fast Is Fast Enough? [PerfNow 2025]
tammyeverts
3
660
Side Projects
sachag
455
43k
Odyssey Design
rkendrick25
PRO
2
730
Transcript
VISUALIZING MARATHON 2012 MORITZ STEFANER TRUTH & BEAUTY OPERATOR DESIGNER
Q&A Nov 10, 2012
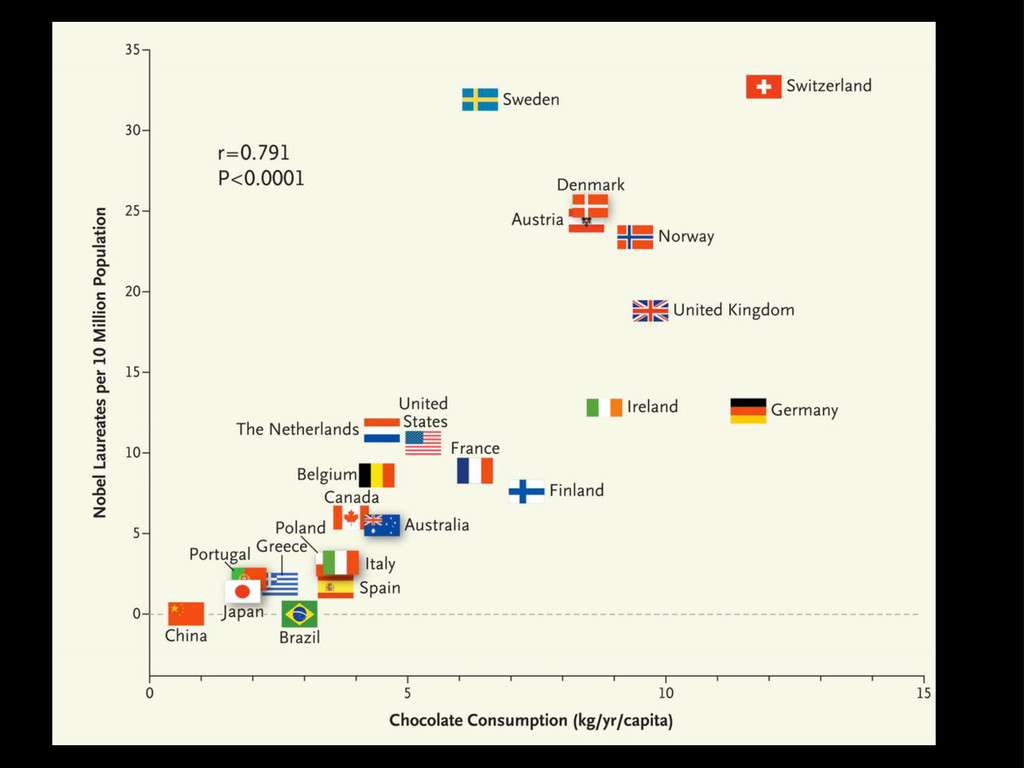
..even when all you have is numbers.. IT’S ALL ABOUT
RELATIONS
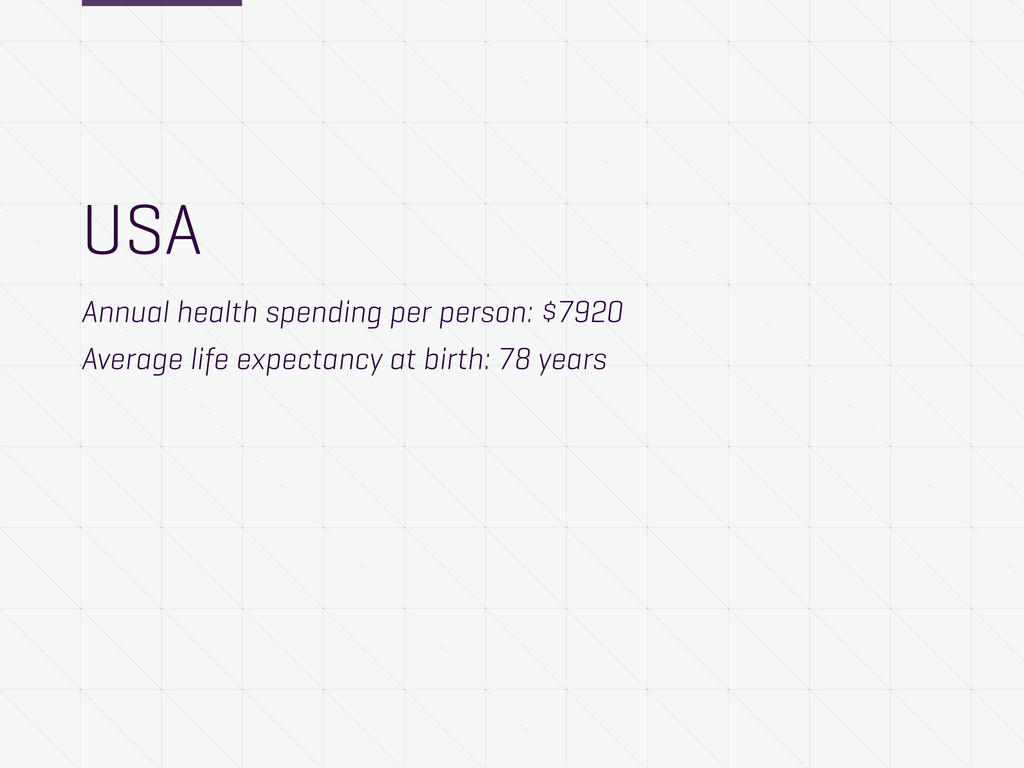
USA Annual health spending per person: $7920 Average life expectancy
at birth: 78 years
None
None
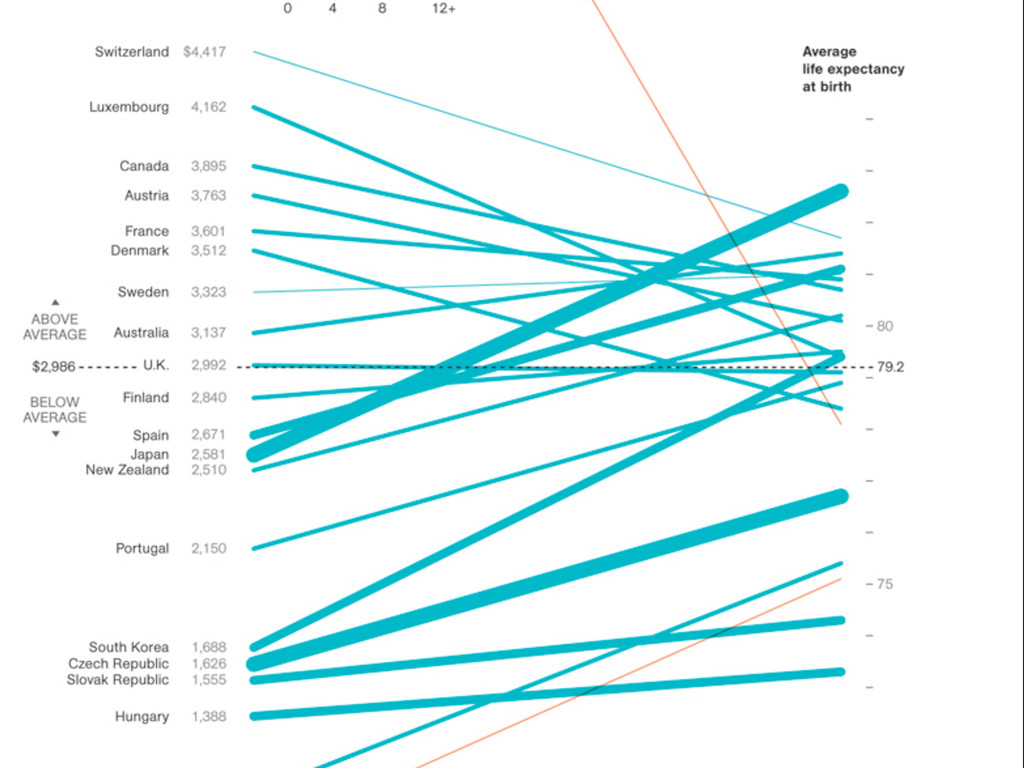
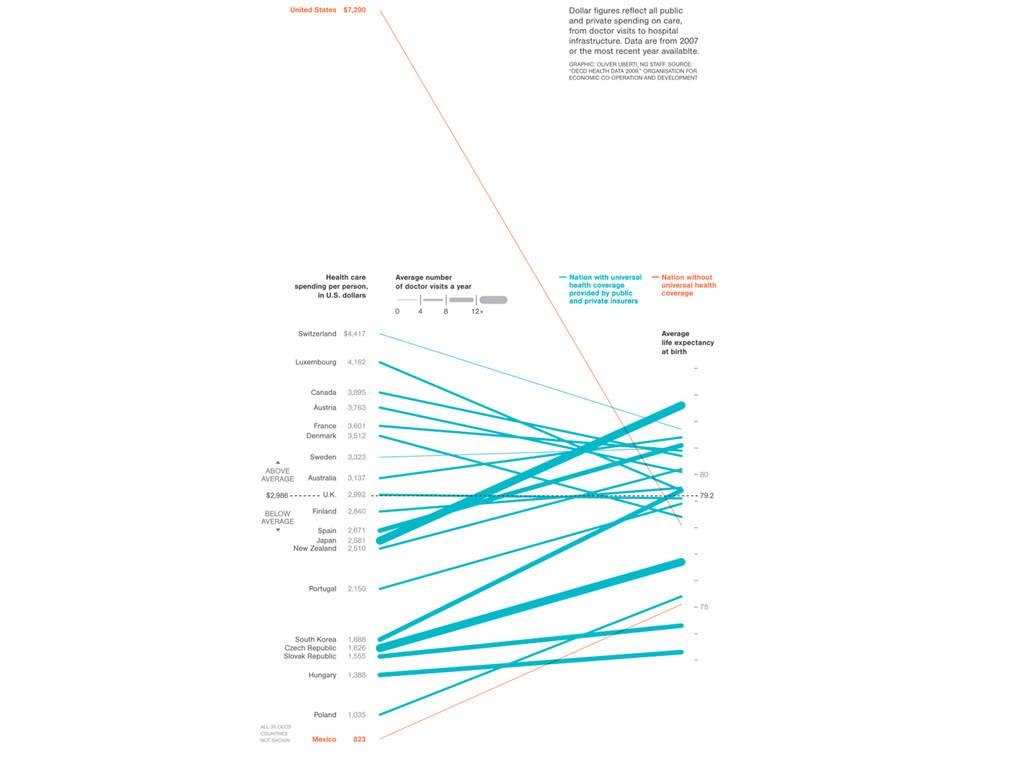
COMPARED TO WHAT?
None
None
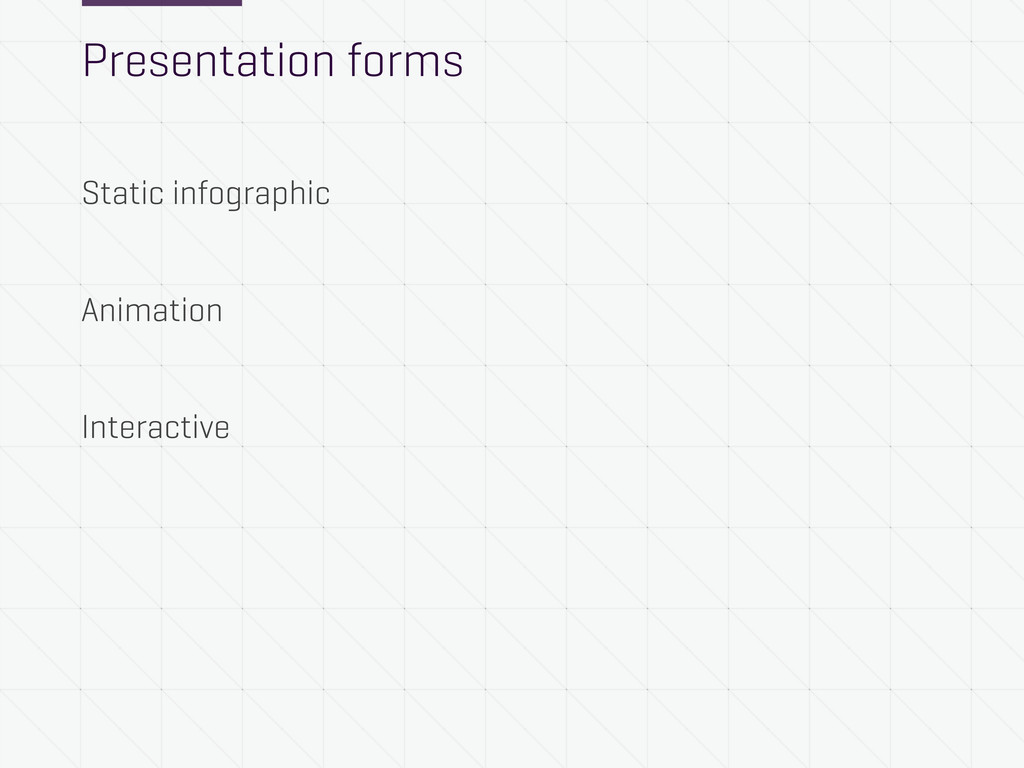
Presentation forms Static infographic Animation Interactive
Presentation forms Static infographic Animation Interactive ...that’s it?
None
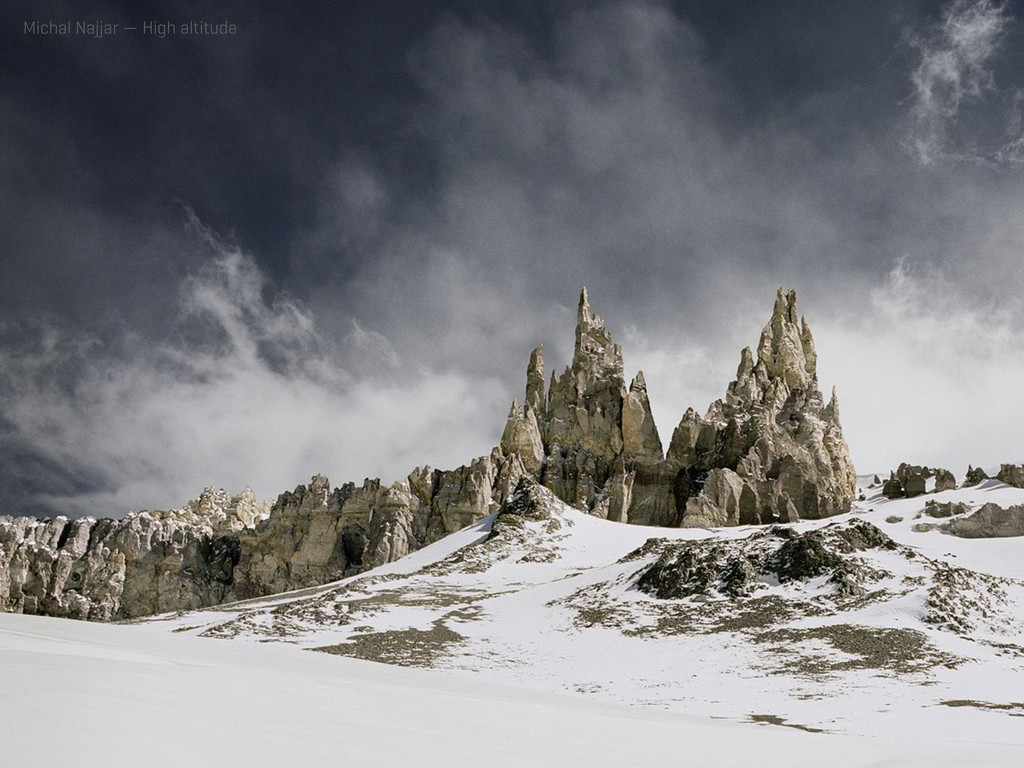
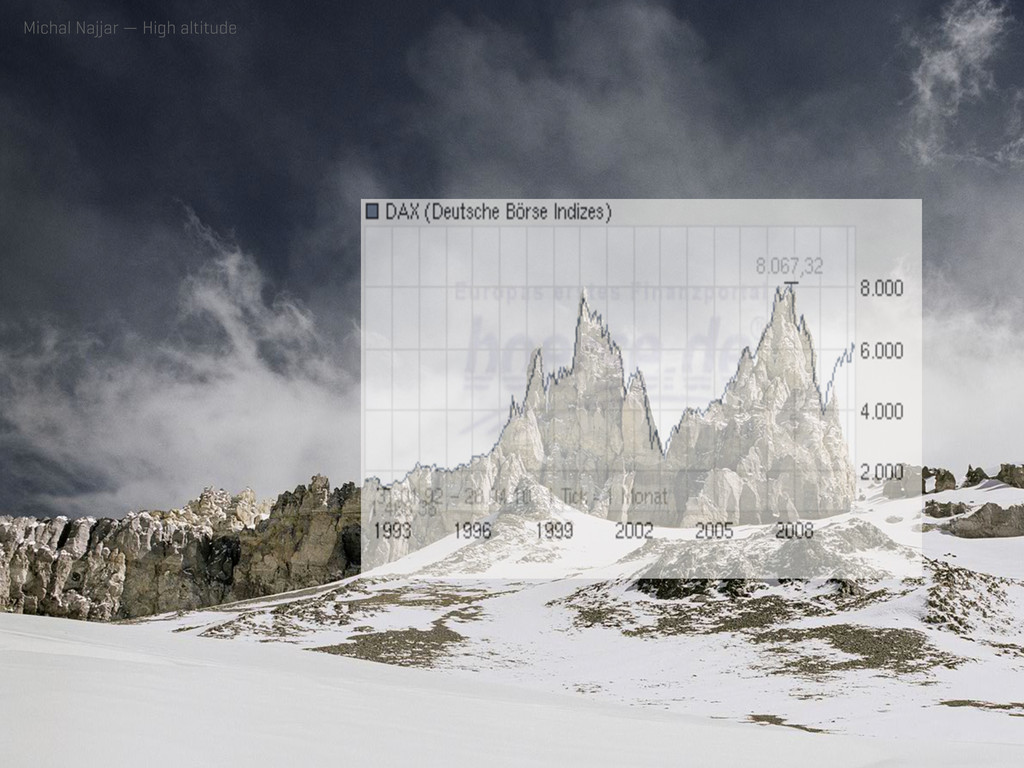
Michal Najjar — High altitude
Michal Najjar — High altitude
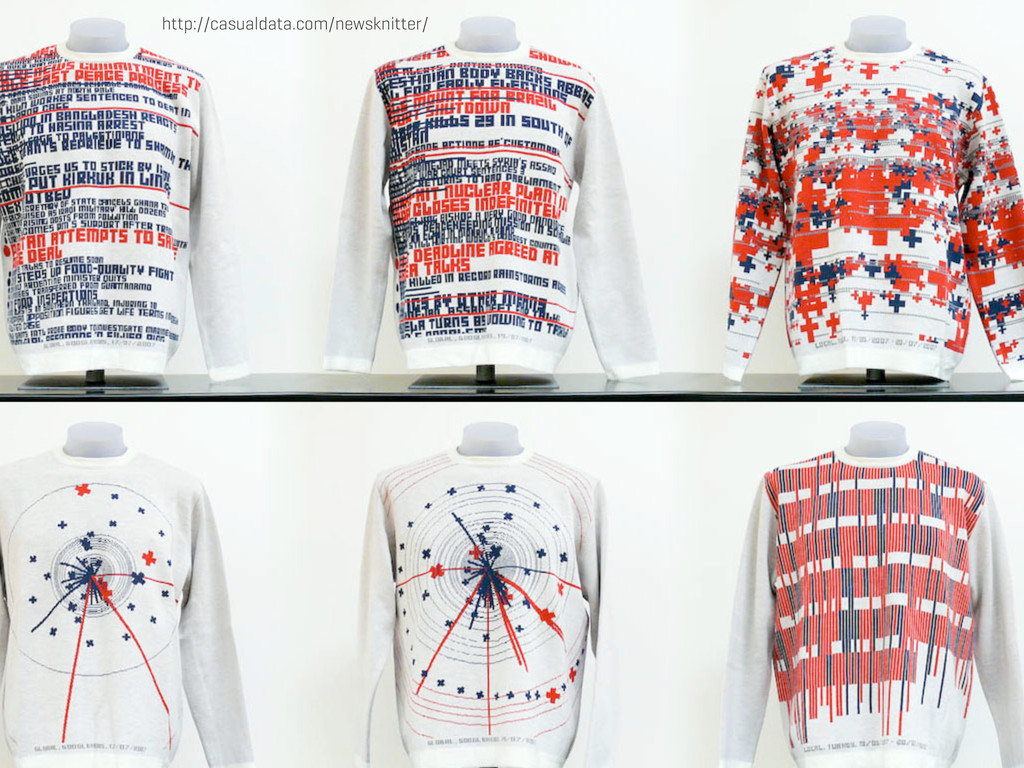
http://casualdata.com/newsknitter/
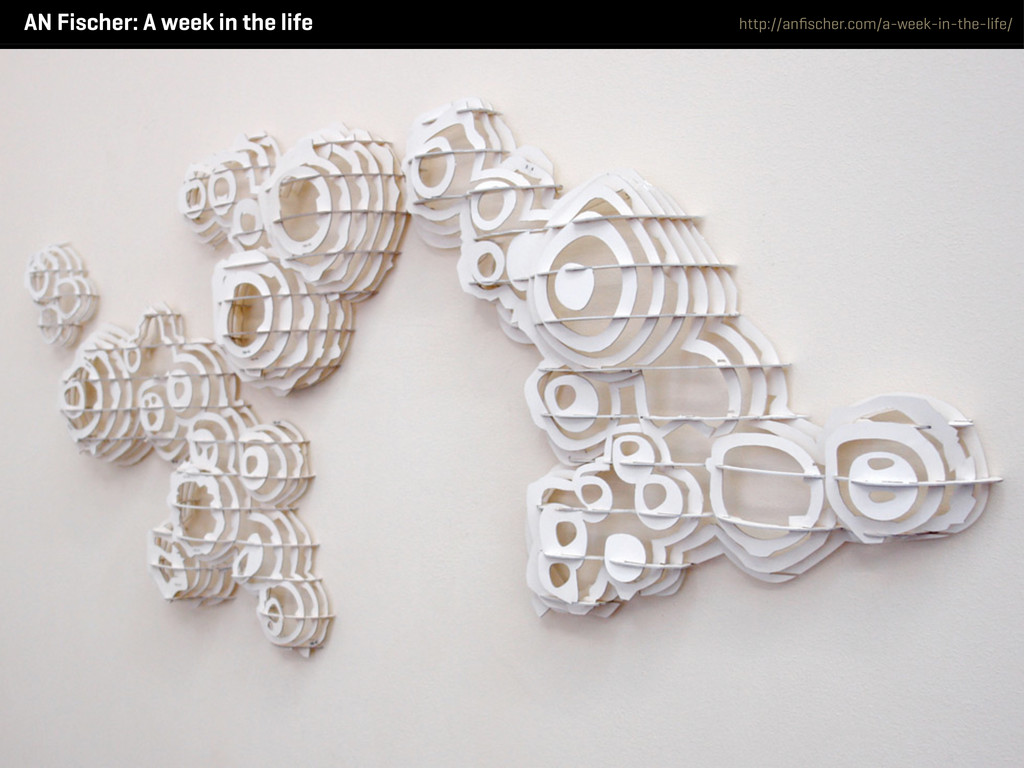
AN Fischer: A week in the life http://anfischer.com/a-week-in-the-life/
None
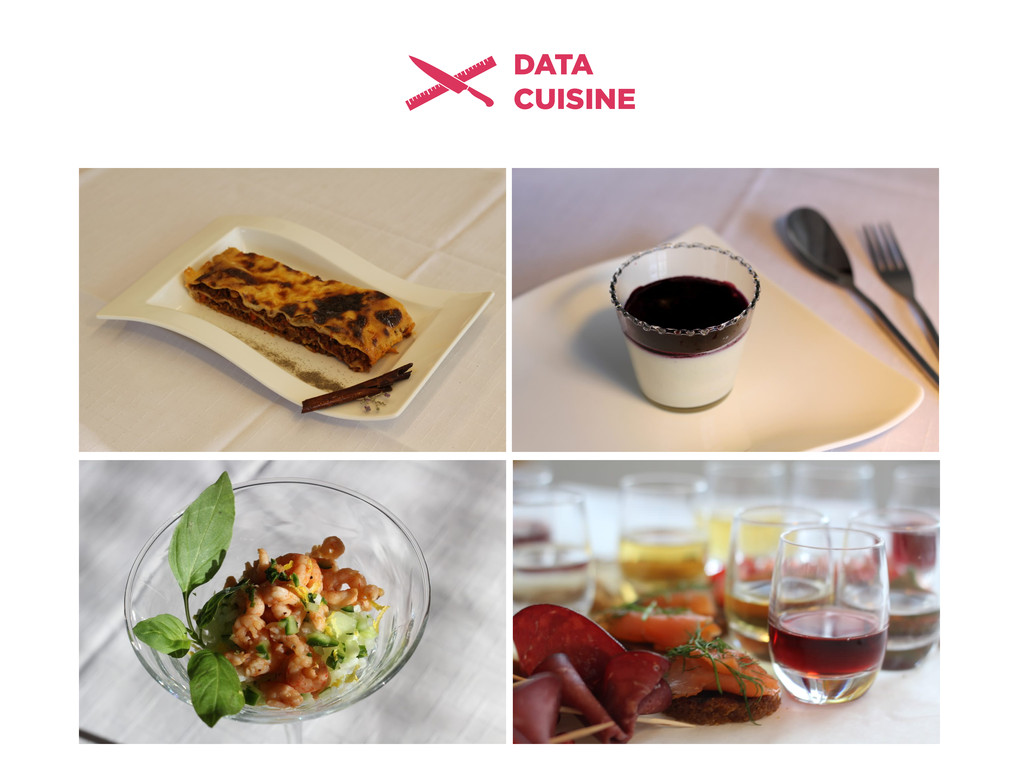
DATA CUISINE
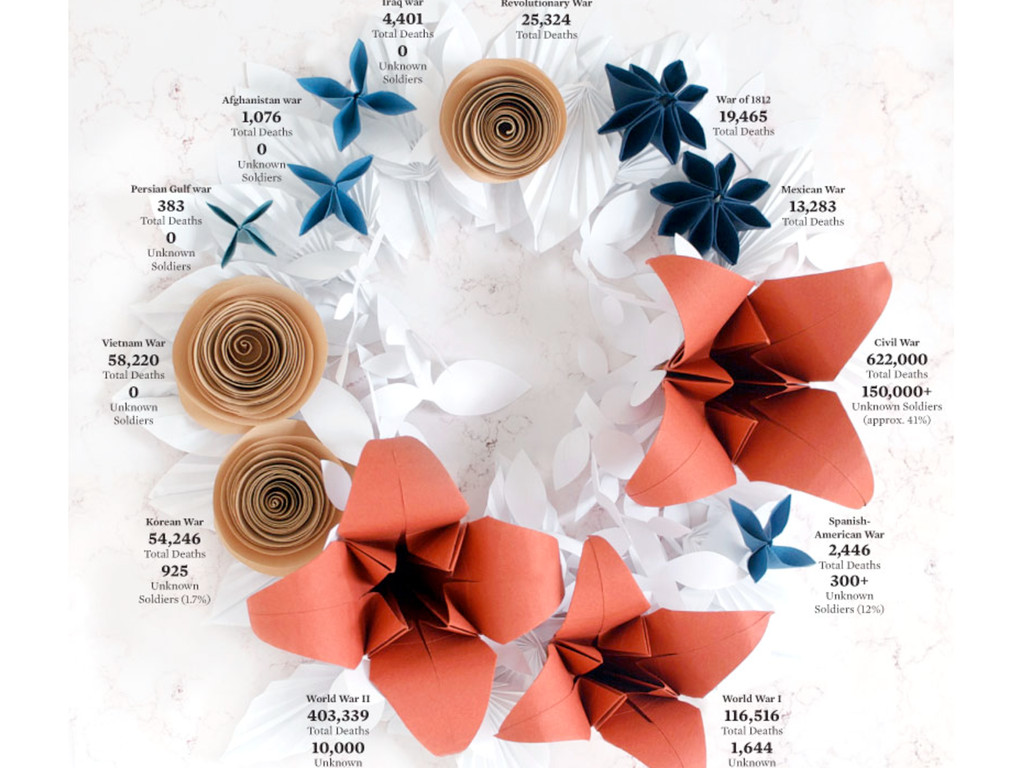
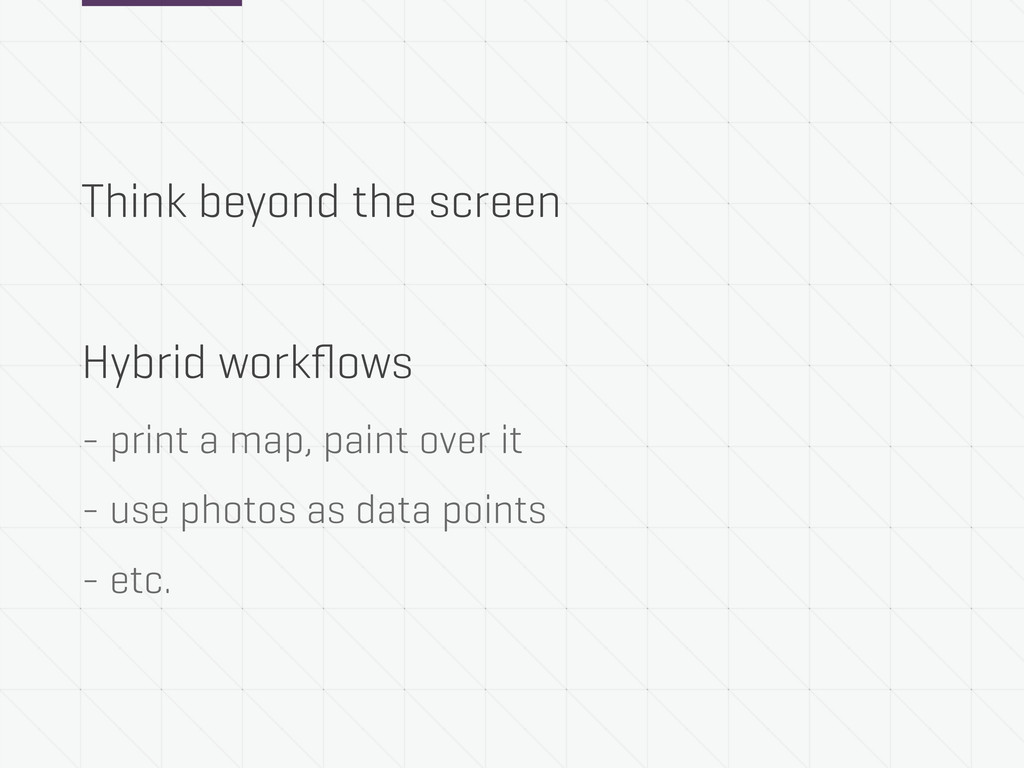
Think beyond the screen Hybrid workflows - print a map,
paint over it - use photos as data points - etc.