Upgrade to Pro — share decks privately, control downloads, hide ads and more …

Candidacy II Slides

Adina
July 06, 2020

Candidacy II Slides

Understanding young stellar flare activity with TESS

Adina

July 06, 2020
Tweet

More Decks by Adina

Other Decks in Science

Transcript

  1. Flare Statistics for Young Stars from a Convolutional Neural Network

    Analysis of TESS Data Adina Feinstein NSF Graduate Research Fellow Ben Montet (UNSW), Megan Ansdell (NASA HQ), Brian Nord (UChicago/KICP/Fermi), Jacob Bean (UChicago), Max Günther (MIT), Michael Gully-Santiago (UT Austin), Josh Schlieder (NASA GSFC) arXiv:2005.07710 ! 1
  2. Flares have been shown to increase atmospheric erosion, especially when

    they are still forming & contracting. (Lammer et al. 2007; Owen & Wu 2017) !4
  3. Flares have been shown to increase atmospheric erosion, especially when

    they are still forming & contracting. (Lammer et al. 2007; Owen & Wu 2017) !4
  4. Flares have been shown to increase atmospheric erosion, especially when

    they are still forming & contracting. (Lammer et al. 2007; Owen & Wu 2017) !4
  5. Flares have been seen to have long term effects on

    atmospheric chemical compositions. (Venot et al. 2016) !5 Metals & molecules
  6. Flares have been seen to have long term effects on

    atmospheric chemical compositions. (Venot et al. 2016) !5 Metals & molecules Different metals & molecules
  7. Similar studies with Kepler demonstrated a relationship between spectral type,

    rotation period, and flare energy. (Davenport, 2016) 1.66 1.13 0.86 0.73 0.62 0.47 0.28 Mass [MSun ] Maximum Log(Flare Energy [ergs]) 32 33 34 35 36 37 38 39 40 !8
  8. Similar studies with Kepler demonstrated a relationship between spectral type,

    rotation period, and flare energy. (Davenport, 2016) 1.66 1.13 0.86 0.73 0.62 0.47 0.28 Mass [MSun ] Maximum Log(Flare Energy [ergs]) 32 33 34 35 36 37 38 39 40 !8
  9. Similar studies with Kepler demonstrated a relationship between spectral type,

    rotation period, and flare energy. (Yang & Liu, 2019) (Davenport, 2016) 1.66 1.13 0.86 0.73 0.62 0.47 0.28 Mass [MSun ] Maximum Log(Flare Energy [ergs]) 32 33 34 35 36 37 38 39 40 !8
  10. Similar studies with Kepler demonstrated a relationship between spectral type,

    rotation period, and flare energy. (Yang & Liu, 2019) (Davenport, 2016) 1.66 1.13 0.86 0.73 0.62 0.47 0.28 Mass [MSun ] Maximum Log(Flare Energy [ergs]) 32 33 34 35 36 37 38 39 40 !8
  11. Analysis of the Pleiades (0.125 Gyr) and Praesepe (0.63 Gyr)

    showed a decrease in flare rate with age. (Ilin et al. 2019) 3000-3249 K 3250-3499 K 3500-3749 K 3750-4000 K Pleiades Praesepe !10
  12. In the same year, two papers presented conflicting results on

    where flares occur with relation to spots. !12
  13. In the same year, two papers presented conflicting results on

    where flares occur with relation to spots. (Doyle et al. 2018) !12
  14. In the same year, two papers presented conflicting results on

    where flares occur with relation to spots. (Doyle et al. 2018) !12
  15. In the same year, two papers presented conflicting results on

    where flares occur with relation to spots. (Doyle et al. 2018) (Roettenbacher et al. 2018) 1-5% increase > 5% increase !12
  16. In the same year, two papers presented conflicting results on

    where flares occur with relation to spots. (Doyle et al. 2018) (Roettenbacher et al. 2018) 1-5% increase > 5% increase !12
  17. In the same year, two papers presented conflicting results on

    where flares occur with relation to spots. (Doyle et al. 2018) (Roettenbacher et al. 2018) 1-5% increase > 5% increase Sample size: 32 Sample size: 119 !12
  18. The Transiting Exoplanet Survey Satellite (TESS) is a four+ year,

    nearly all-sky survey monitoring millions of stars. 27 days 54 days 81 days 108 days 189 days 351 days !14
  19. There is no one best way to determine the age

    of a star or group of stars. !15
  20. There is no one best way to determine the age

    of a star or group of stars. (Curtis et al. 2019) Gyrochronology !15
  21. There is no one best way to determine the age

    of a star or group of stars. (Curtis et al. 2019) Gyrochronology !15 Isochrone Fitting (Murphy et al. 2020)
  22. There is no one best way to determine the age

    of a star or group of stars. (Curtis et al. 2019) Gyrochronology !15 Isochrone Fitting (Murphy et al. 2020) (Schneider et al. 2019) Kinematics
  23. However, the outlier metrics used will bias studies towards identifying

    only the strongest flares. (Chang, Byun, & Hartman, 2015) !18
  24. However, the outlier metrics used will bias studies towards identifying

    only the strongest flares. (Chang, Byun, & Hartman, 2015) !18
  25. However, the outlier metrics used will bias studies towards identifying

    only the strongest flares. (Chang, Byun, & Hartman, 2015) :( !18
  26. Machine learning can be used when searching for signals with

    a characteristic shape. (Pearson et al. 2017) !19
  27. Machine learning can be used when searching for signals with

    a characteristic shape. (Pearson et al. 2017) !19
  28. We used the TESS flare catalog from Günther et al.

    (2020) as our training, validation, and test sets. !20
  29. Every light curve example receives a label that the neural

    network learns over several hundred epochs. !21
  30. The results of 10 stella models show good training demonstrated

    through the accuracy and loss metrics. (Feinstein et al. 2020) !22
  31. We ensure the neural network is classifying our light curves

    correctly by looking at the test set. !23
  32. The confusion matrix for the stella test set is used

    to visualize what the false cases look like. (Feinstein et al. 2020) !24
  33. The CNN is used as a sliding-box detector, where the

    probability will increase as the flare nears the center of the box. !25
  34. The CNN is used as a sliding-box detector, where the

    probability will increase as the flare nears the center of the box. !25
  35. https://GitHub.com/afeinstein20/stella Looking at some example light curves, the cadences “light

    up” when believed to be a flare. (Feinstein et al. 2020) ! 26
  36. We find a clear difference in flare rate at Gaia

    Bp -Rp = 2 (Teff ~ 4000K). (Feinstein et al. 2020) !28
  37. The coolest stars have stronger flares in relation to their

    luminosity. (Feinstein et al. 2020) !29
  38. Flares amplitudes and rates are higher the coolest stars across

    all ages, with noticeable evolution in other temperature bins. (Feinstein et al. 2020) !31
  39. Subdividing by age, it’s easier to see the differences in

    flare rate between cool (< 4000K) stars and hot stars. (Feinstein et al. 2020) !32
  40. Across 1500 stars, there seems to be no preference for

    where flares happen. They happen everywhere! (Feinstein et al. 2020) !34
  41. Across 1500 stars, there seems to be no preference for

    where flares happen. They happen everywhere! (Feinstein et al. 2020) !34
  42. What do we think these stellar surfaces look like? What

    we think we’re seeing: What a flare-phase relationship would’ve looked like: !35
  43. What do we think these stellar surfaces look like? What

    we think we’re seeing: What a flare-phase relationship would’ve looked like: The Sun: !35
  44. Flares have been shown to alter atmospheric chemistry and could

    partially affect mass-loss rates during formation. (Feinstein et al. 2020) !36
  45. Flares have been shown to alter atmospheric chemistry and could

    partially affect mass-loss rates during formation. (Feinstein et al. 2020) !36
  46. Flares have been shown to alter atmospheric chemistry and could

    partially affect mass-loss rates during formation. (Feinstein et al. 2020) !36
  47. Young planets are challenging to detect and occur on similar

    timescales to flares, so let’s “flip” stella! (David et al. 2019) !38
  48. Young planets are challenging to detect and occur on similar

    timescales to flares, so let’s “flip” stella! (David et al. 2019) !38
  49. There’s a huge (500 Myr!!) age range of missing planets.

    stella may be able to find them. (Exoplanet Archive, as of 6/25/2020) !39
  50. There’s a huge (500 Myr!!) age range of missing planets.

    stella may be able to find them. (Exoplanet Archive, as of 6/25/2020) !39
  51. We hope to search both the 2-minute and 30-minute TESS

    data for new young planet candidates. Photo credit: Ethan Kruse !41 (Feinstein et al. 2019)
  52. Summary • This is the first application of CNNs to

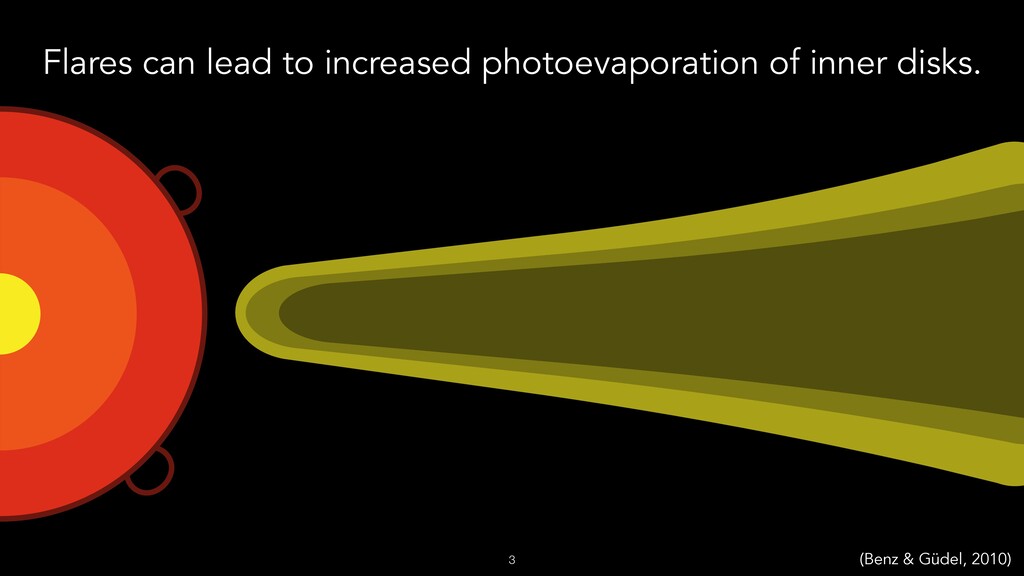
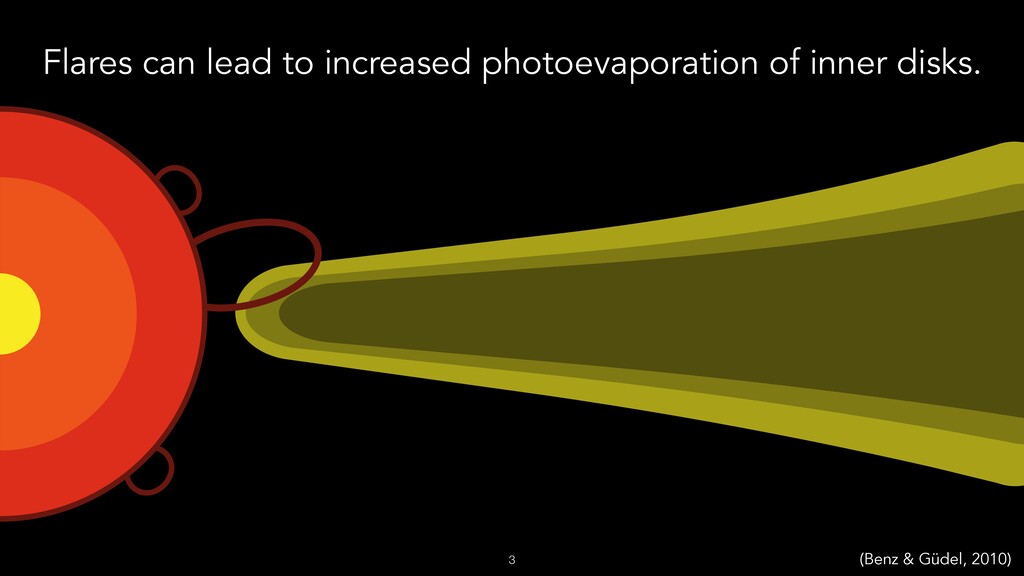
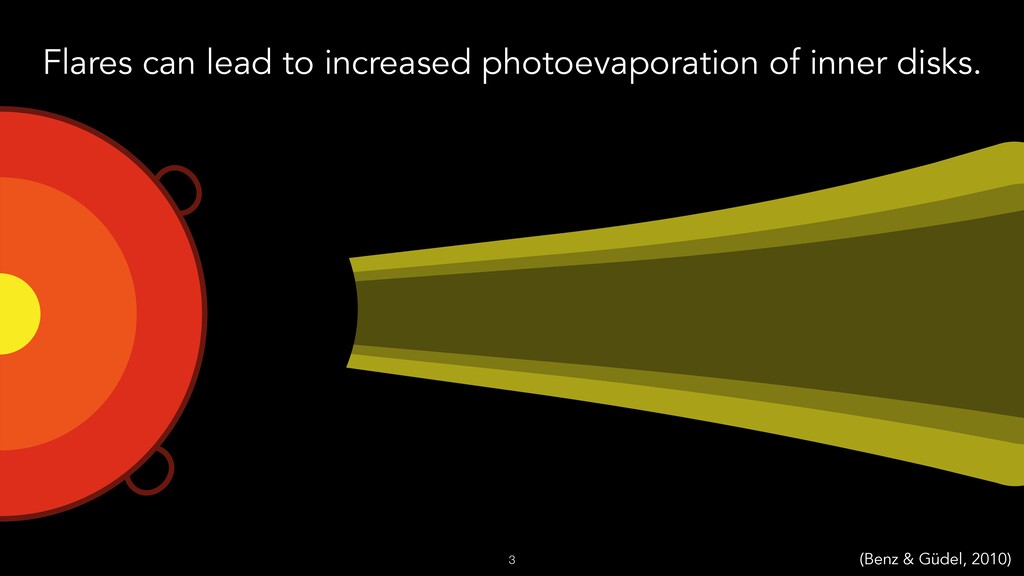
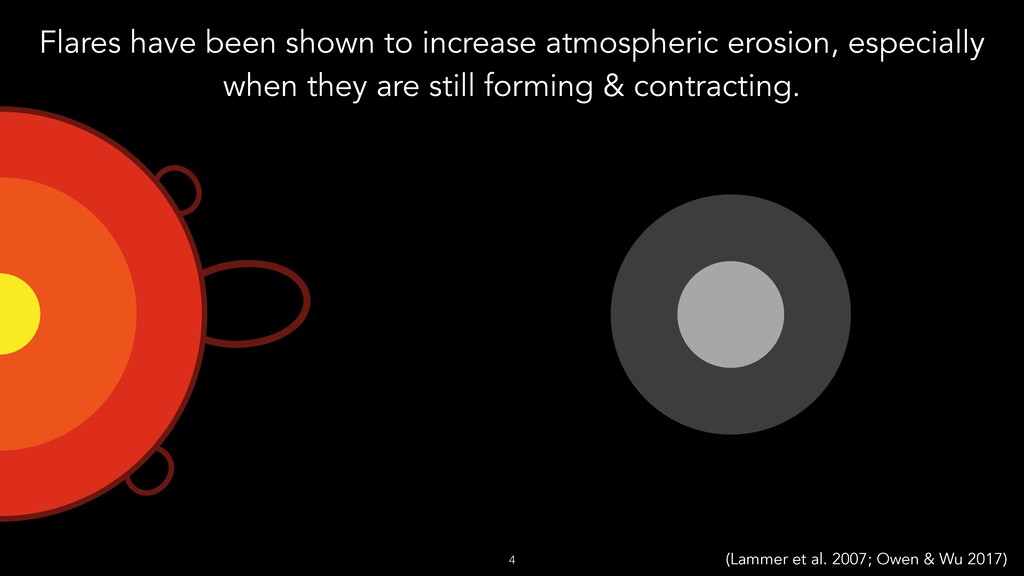
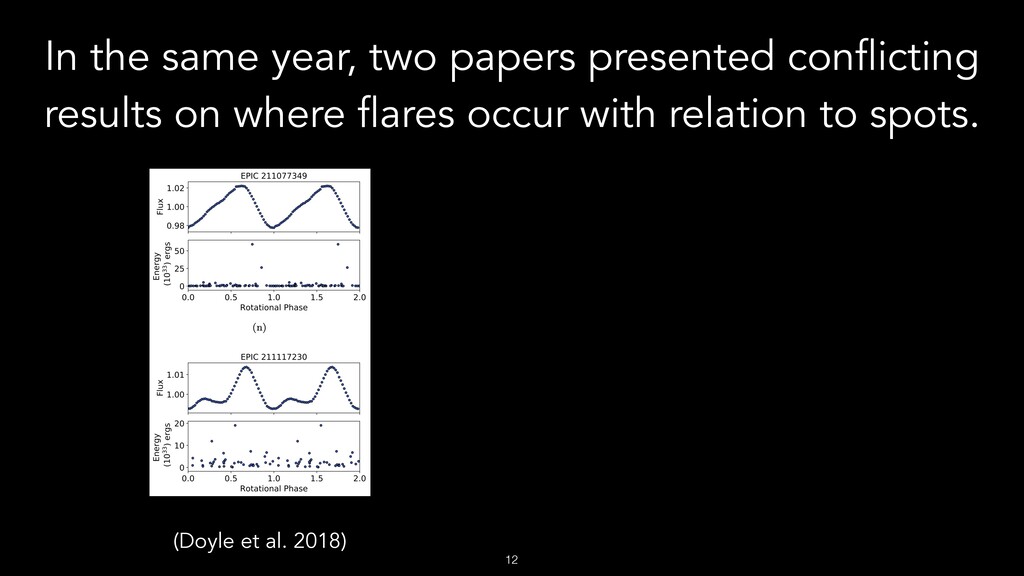
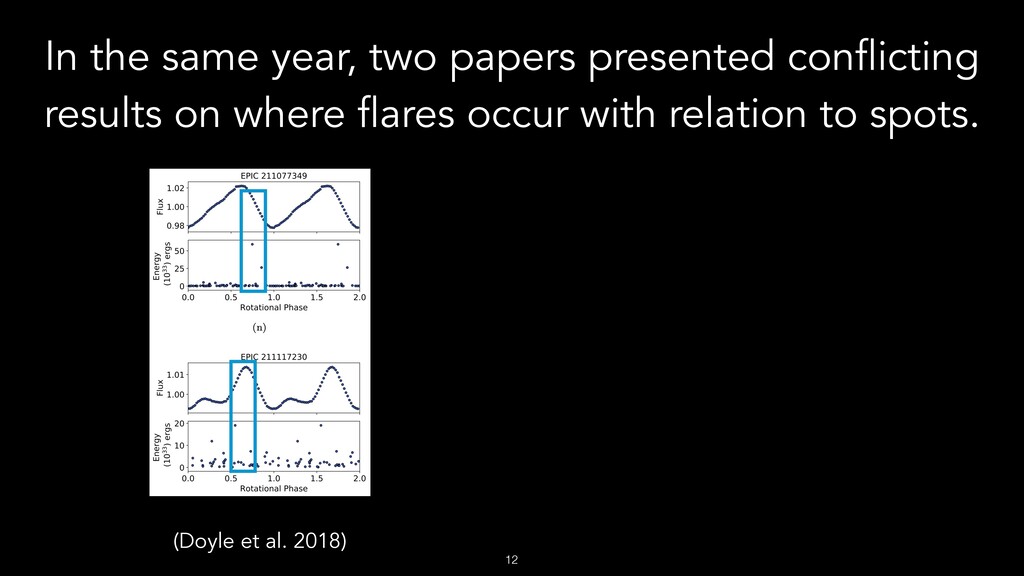
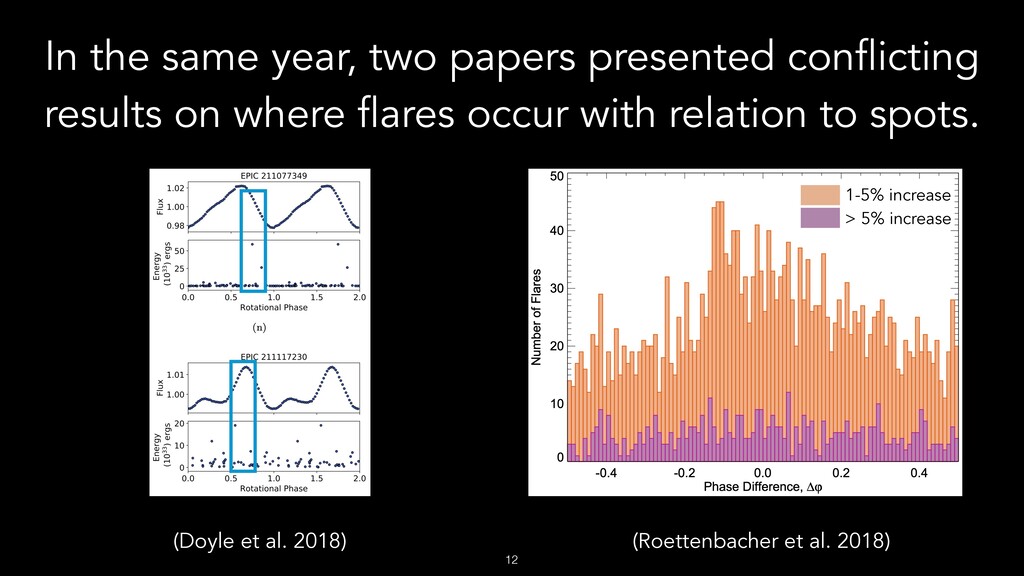
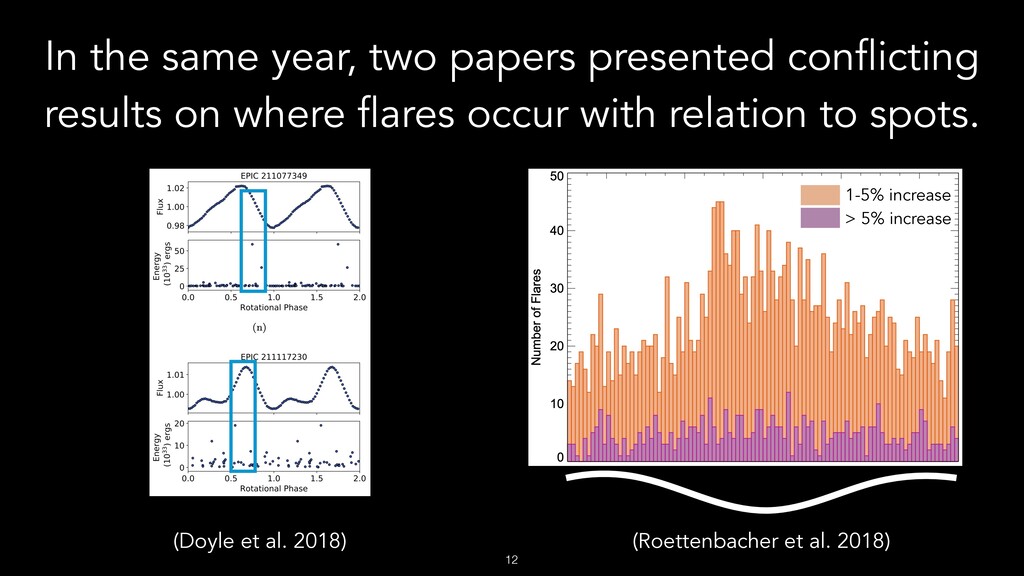
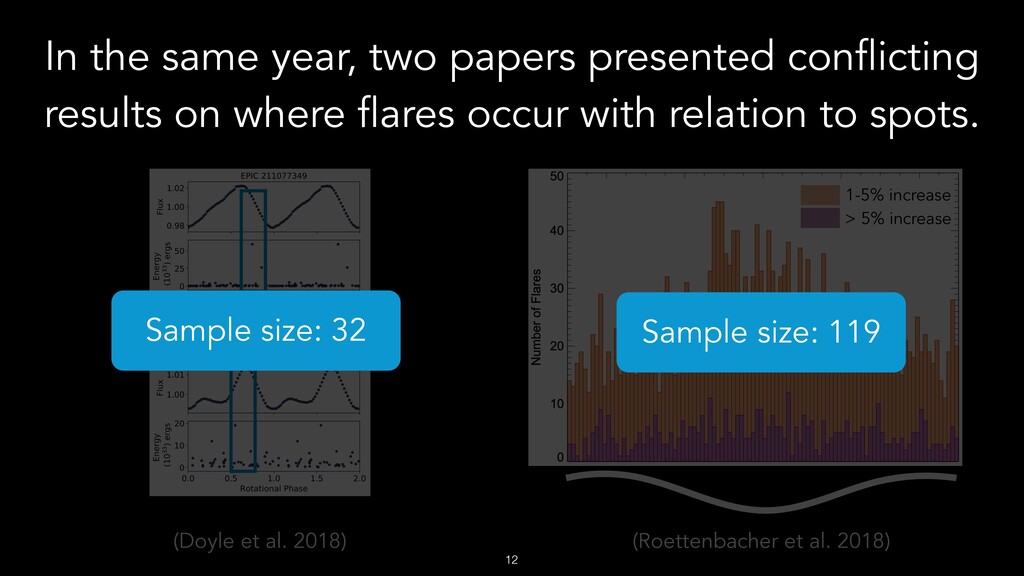
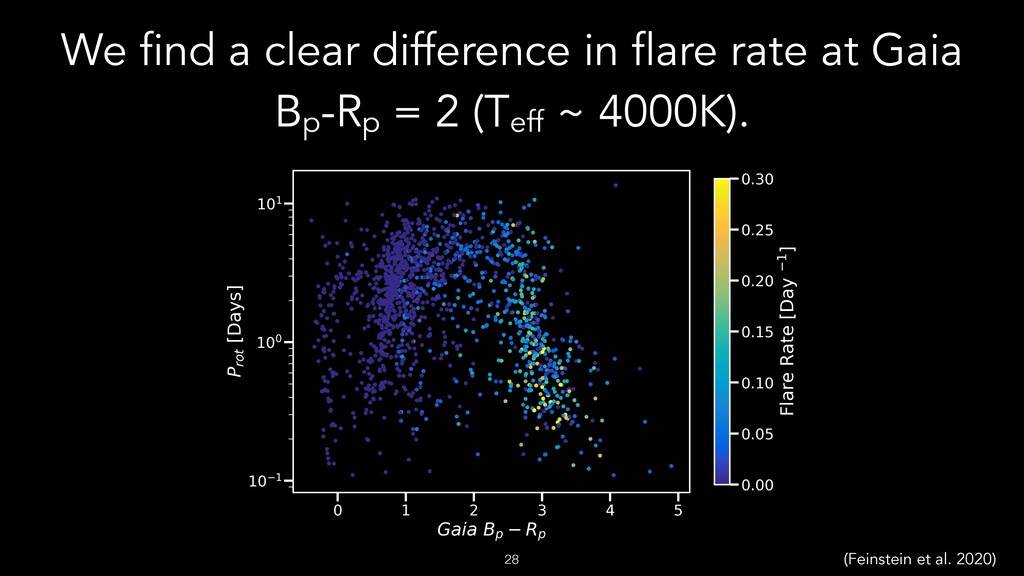
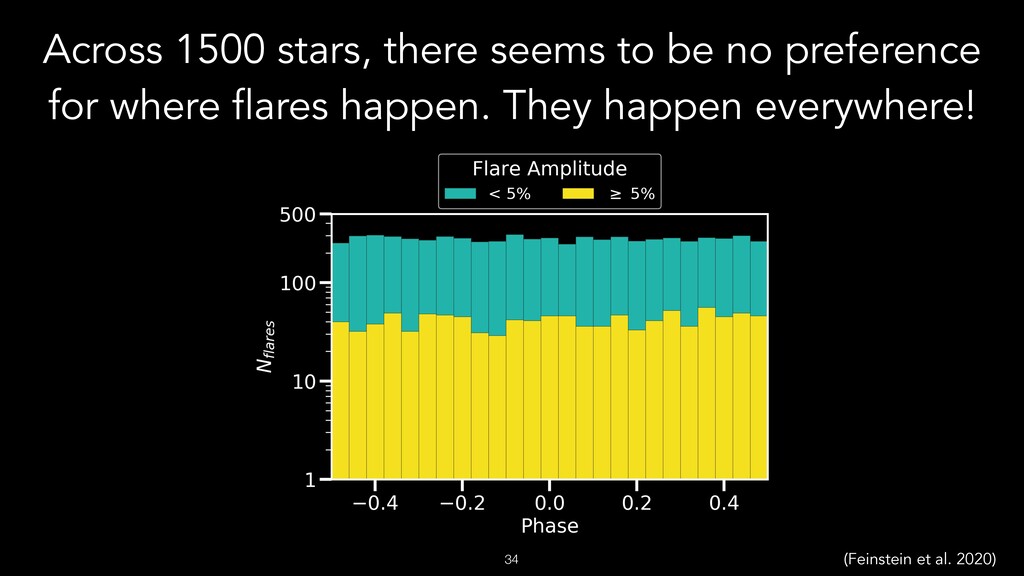
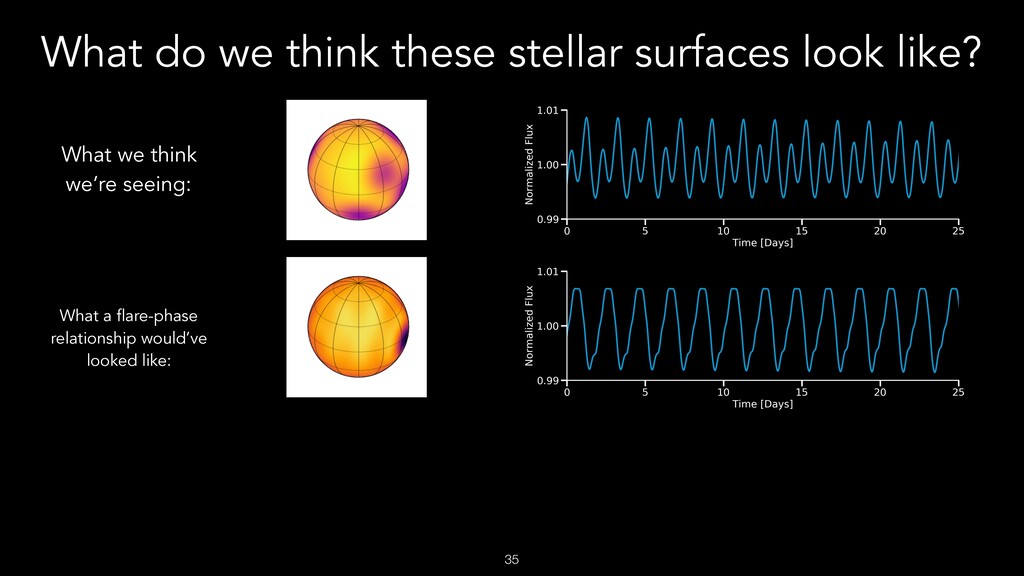
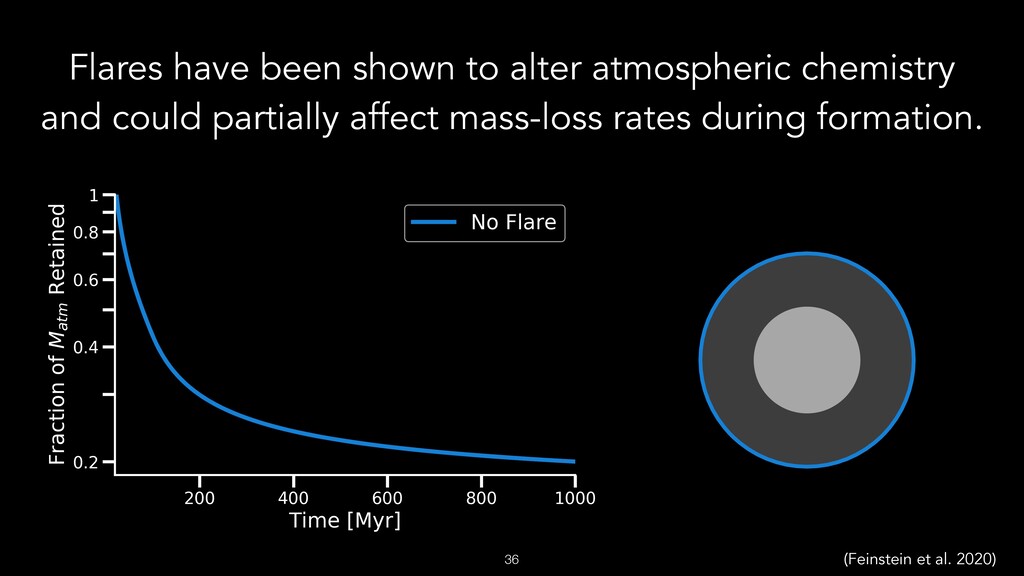
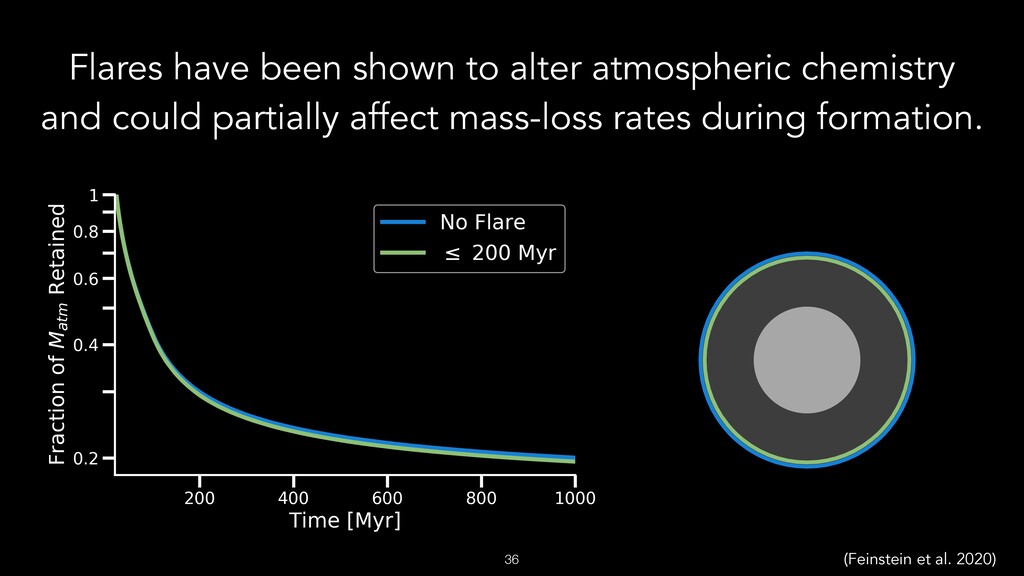
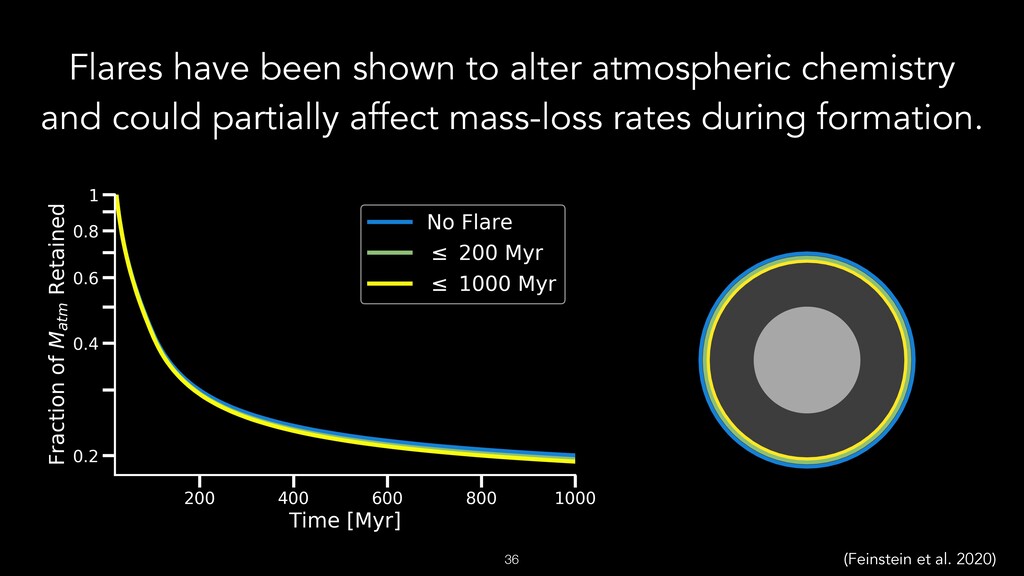
    find stellar flares. It provides a new statistical analysis of these events. • We find no phase preference for flares, indicating the surfaces of young stars have an overall very high spot coverage. • Cool stars (Teff < 4000 K) have high and consistent flare rates at all ages between 1-800 Myr, while hot stars show decline over time. • Flares have negative consequences for photoevaporative mass loss of exoplanet atmospheres. • Next — let’s find more young planets! !42