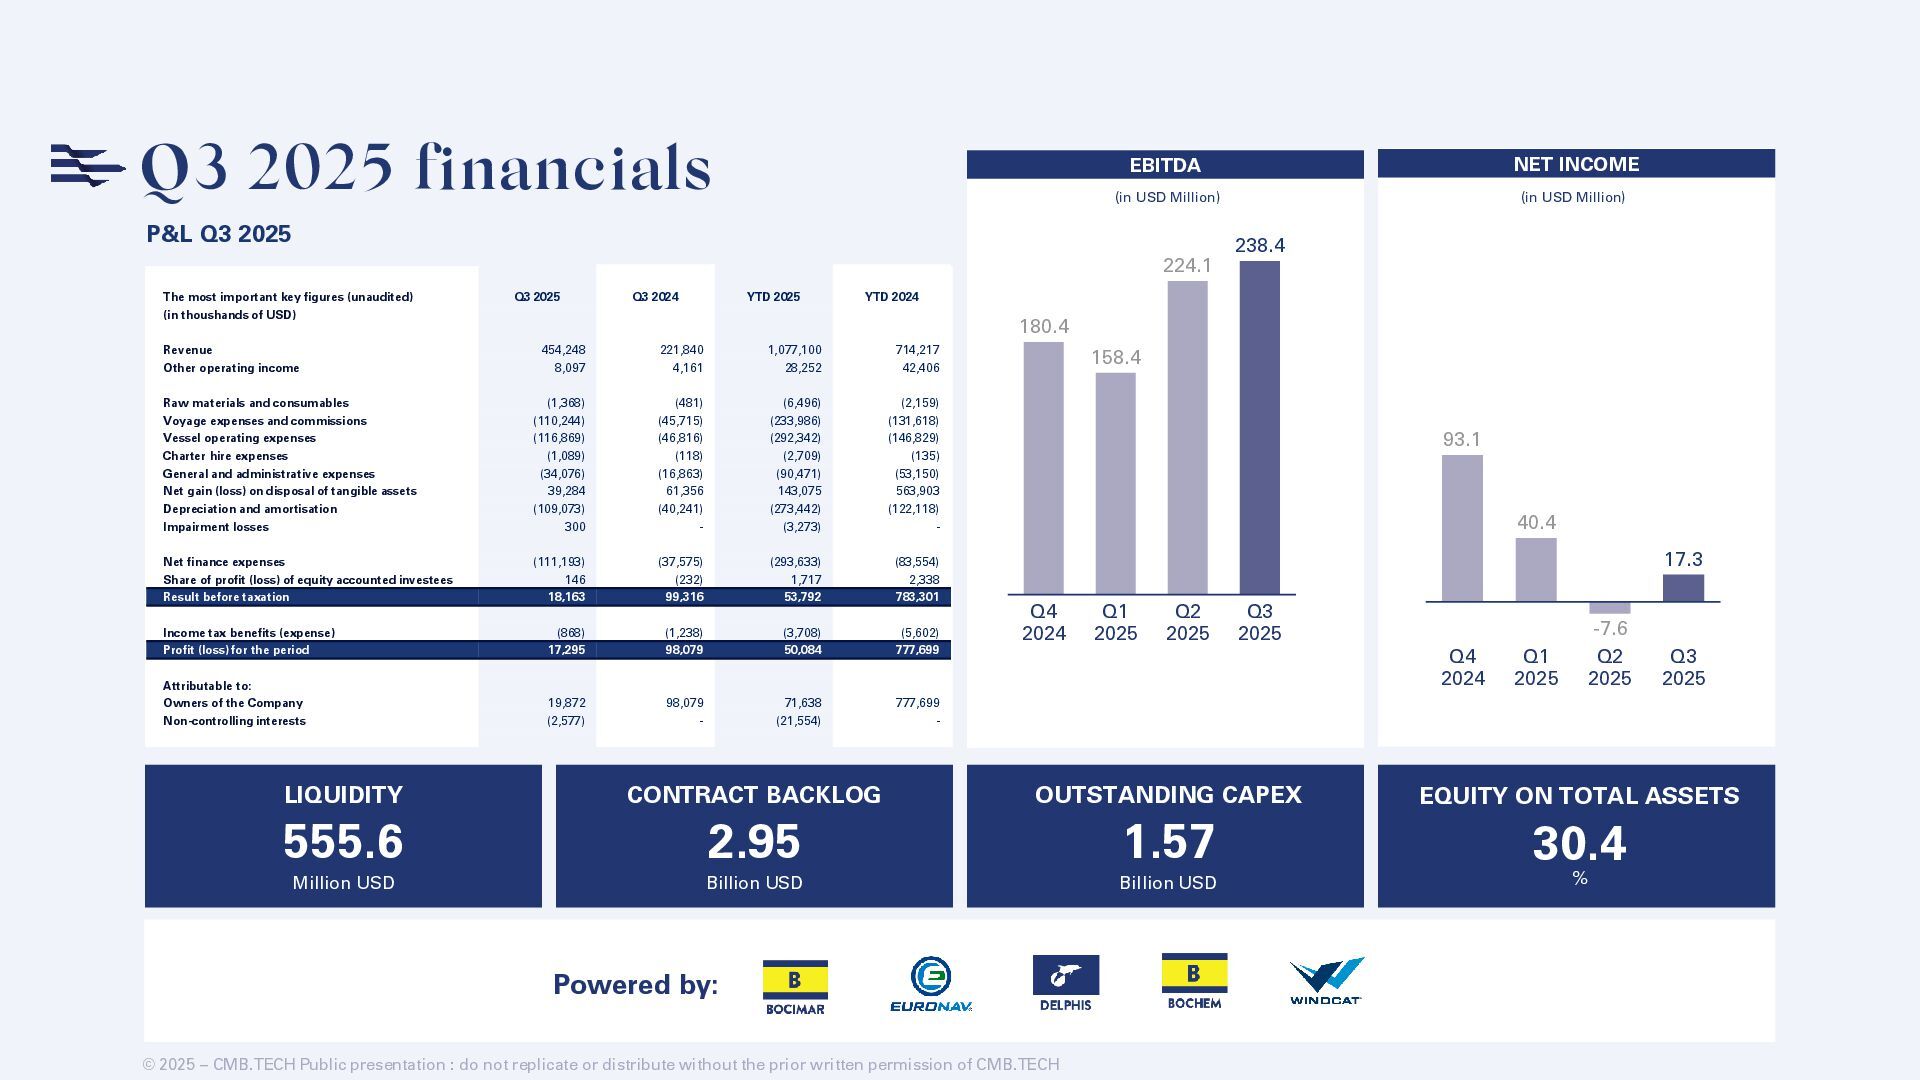
Q2 2025 Q3 2025 180.4 158.4 224.1 238.4 Q4 2024 Q1 2025 Q2 2025 Q3 2025 93.1 40.4 -7.6 17.3 (in USD Million) (in USD Million) LIQUIDITY 555.6 Million USD CONTRACT BACKLOG 2.95 Billion USD OUTSTANDING CAPEX 1.57 Billion USD EQUITY ON TOTAL ASSETS 30.4 % © 2025 – CMB.TECH Public presentation : do not replicate or distribute without the prior written permission of CMB.TECH P&L Q3 2025 The most important key figures (unaudited) Q3 2025 Q3 2024 YTD 2025 YTD 2024 (in thoushands of USD) Revenue 454,248 221,840 1,077,100 714,217 Other operating income 8,097 4,161 28,252 42,406 Raw materials and consumables (1,368) (481) (6,496) (2,159) Voyage expenses and commissions (110,244) (45,715) (233,986) (131,618) Vessel operating expenses (116,869) (46,816) (292,342) (146,829) Charter hire expenses (1,089) (118) (2,709) (135) General and administrative expenses (34,076) (16,863) (90,471) (53,150) Net gain (loss) on disposal of tangible assets 39,284 61,356 143,075 563,903 Depreciation and amortisation (109,073) (40,241) (273,442) (122,118) Impairment losses 300 - (3,273) - Net finance expenses (111,193) (37,575) (293,633) (83,554) Share of profit (loss) of equity accounted investees 146 (232) 1,717 2,338 Result before taxation 18,163 99,316 53,792 783,301 Income tax benefits (expense) (868) (1,238) (3,708) (5,602) Profit (loss) for the period 17,295 98,079 50,084 777,699 Attributable to: Owners of the Company 19,872 98,079 71,638 777,699 Non-controlling interests (2,577) - (21,554) - Powered by:
![[email protected] +32 498 61 71 11 JORIS DAMAN HEAD OF](https://files.speakerdeck.com/presentations/85f9899039584b3c8d498a3209e377fe/slide_30.jpg)