Upgrade to Pro — share decks privately, control downloads, hide ads and more …

Q1 2025 Earnings release

Q1 2025 Earnings release

This is the presentation of our earnings release of Q1 2024

Avatar for CMB.TECH

CMB.TECH PRO

July 24, 2025

Other Decks in Business

Transcript

  1. © 2025 – CMB.TECH 2 Forward-looking statements Matters discussed in

    this presentation may constitute forward-looking statements under U.S. federal securities laws, including the Private Securities Litigation Reform Act of 1995. Forward-looking statements reflect the Company’s current views with respect to future events and financial performance and may include statements concerning plans, objectives, goals, strategies, future events or performance, and underlying assumptions and other statements, which are other than statements of historical facts. All statements, other than statements of historical facts, that address activities, events or developments that the Company expects, projects, believes or anticipates will or may occur in the future, including, without limitation, the delivery of vessels, the outlook for tanker shipping rates, general industry conditions future operating results of the Company’s vessels, capital expenditures, expansion and growth opportunities, bank borrowings, financing activities and other such matters, are forward- looking statements. Although the Company believes that its expectations stated in this presentation are based on reasonable assumptions, actual results may differ from those projected in the forward-looking statements. Important factors that, in our view, could cause actual results to differ materially from those discussed in the forward-looking statements include the failure of counterparties to fully perform their obligations to us, the strength of the world economies and currencies, general market conditions, including changes in tanker vessel charter hire rates and vessel values, changes in demand for tankers, changes in our vessel operating expenses, including dry-docking, crewing and insurance costs, or actions taken by regulatory authorities, ability of customers of our pools to perform their obligations under charter contracts on a timely basis, potential liability from future litigation, domestic and international political conditions, potential disruption of shipping routes due to accidents and political events or acts by terrorists. We undertake no obligation to publicly update or revise any forward-looking statement contained in this presentation, whether as a result of new information, future events or otherwise, except as required by law. In light of the risks, uncertainties and assumptions, the forward- looking events discussed in this presentation might not occur, and our actual results could differ materially from those anticipated in these forward- looking statements.
  2. © 2025 – CMB.TECH 3 1. Q1 2025 financials &

    highlights 2. CMB.TECH & Golden Ocean proposed merger 3. MEPC ‘83 4. Marine division market update 1. TCE performance 2. Market outlook 5. Conclusion and Q&A Presentation topics
  3. Non public version - © 2023 – CMB.TECH nv 4

    1 BILLION USD CONTRACT BACKLOG ADDED Q1 2025 FINANCIALS & HIGHLIGHTS
  4. © 2025 – CMB.TECH 5 Q1 2025 financials(1) NET INCOME

    adj. EBITDA adj. Q2 2024 Q3 2024 Q4 2024 Q1 2025 146.4 115.8 109.3 111.9 Q2 2024 Q3 2024 Q4 2024 Q1 2025 184.4 98.1 93.1 40.4 Q2 2024 Q3 2024 Q4 2024 Q1 2025 69.7 36.7 22.0 -6.1 NET INCOME USD 483 million USD 416 million USD 122 million P&L Q1 2025 (in USD Million) Adjusted for capital gains (in USD Million) Liquidity 345.1 Million USD (excl. commercial paper) Contract backlog 2.94 Billion USD Outstanding CAPEX 2.2 Billion USD Equity on Total Assets 31.9 % Adjusted for capital gains (in USD Million) Powered by: (1) Subsequent the closing on March 12, 2025, of the acquisition of the GOGL shares held by Hemen, CMB.TECH became the de-facto controlling shareholder of GOGL. As from that date GOGL is fully consolidated as a subsidiary in the Group’s consolidated accounts. The provisional purchase price allocation resulted in the recognition of a goodwill amounting to USD 172 million. GOGL’s contribution to the consolidated result from March 12 till March 31 amounts to USD -6.6 million.
  5. © 2025 – CMB.TECH 6 Q1 2025 highlights ✓ Profit

    of USD 40.4 million in Q1 2025 (USD 0.21 per share) ✓ CMB.TECH buys Hemen stake in Golden Ocean ✓ Term sheet signed for a merger transaction between CMB.TECH and Golden Ocean ✓ Fortescue and CMB.TECH sign agreement for ammonia-powered ore carrier ✓ CMB.TECH and MOL sign landmark agreement for nine ammonia- powered vessels ✓ Delivery of 5 newbuilding vessels: Mineral Portugal, Mineral Osterreich, Mineral Suomi, Mineral Sverige, CTV Hydrocat 60 ✓ No dividend declared for Q1 2025 ✓ Sold three VLCCs in Q1 2025, Iris (2012, 314,000 dwt), Hakata (2010, 302,550 dwt) & Hakone (2010, 302,624 dwt) as part of its fleet rejuvenation strategy. The sales will generate a total capital gain of approximately 96.7 million USD (Q2 and Q3 2025) ✓ Previously announced sales generated a capital gain of USD 46.25 million: Suezmax Cap Lara (2007, 158,826 dwt), VLCC Alsace (2012 – 299,999 DWT), and Windcat 6 ✓ CMB.TECH increases its contract backlog by 921 million USD (to USD 2.94 billion USD) CMB.TECH a diversified and future-proof maritime group… …with a clear vision on value creation for stakeholders by taking actions today!
  6. © 2025 – CMB.TECH 7 Commercially attractive fleet growing by

    the month (*) Today: 01/05/2025 fleet on the water, (1) Age calculation: new building fleet set at 0 today 32 + 7 today 14 + 16 today 4 + 1 today 3+1 today 6 + 10 today 54 + 13 Q4’25 19 Q4’25 4 Q4’25 32 Q4’25 64 Q4’25 8 Q4’25 4 Q4’26 28 Q4’26 5 Q4’26 37 Q4’26 67 Q4’26 10 Q4’26 4 Q4’27 30 Q4’27 4 Q4’27 39 Q4’27 67 Q4’27 10 Q4’27 4 131 Q4’25 151 Q4’26 155 Q4’27 CMB.TECH’s strategy of diversification and decarbonisation was in full swing in Q1 2025: taken delivery of 5 newbuilding’s, and announced the additional sale of 3 older tankers Average age 8.9 years(1) Average age <1 years(1) Average age 1 years(1) Average age 8.9 years(1) Average age <1 years(1) Average age 3.8 years(1) 159 Q4’28 161 Q4’29 Other
  7. © 2025 – CMB.TECH 8 Q1 2025 Marine division highlights

    893.1 Contract backlog $ millions TANKERS 32 + 7 DRY-BULK 14 + 16 CONTAINER 4 + 1 CHEMICAL 6 + 10 OFFSHORE WIND 54 + 13 493.1 Contract backlog $ millions 502.5 Contract backlog $ millions 790.5 Contract backlog $ millions 95.1 Contract backlog $ millions P&L break- even TCE Q1 ’25 Q2 ’25 TCE- to-date 25,469 40,081 43,181 +14,613 P&L break- even TCE Q1 ’25 Q2 ’25 TCE- to-date 23,594 18,393 24,261 -5,201 P&L break- even TCE Q1 ’25 Q2 ’25 TCE- to-date 1,990 2,376 2,894 +386 (*) P&L break-even 2025, Q1 ’25 TCE and Q2 ’25 TCE-to-date is weighted average per division, and includes spot and time charter contracts (all in USD/day). TCE as per load to discharge in line with IFRS 15. P&L break- even TCE Q1 ’25 Q2 ’25 TCE- to-date 19,705 29,378 29,378 +9,673 P&L break- even TCE Q1 ’25 Q2 ’25 TCE- to-date 18,386 19,711 19,437 +1,325
  8. © 2025 – CMB.TECH 9 2.94 Billion USD marine division

    contract backlog (1) As of March 24, 2025 incl. subsequent acquisitions, fully owned vessels, and 100% of our JV owned 210,000 dwt Newcastlemax bulk carriers. The contract backlog excludes charterers’ extension options. Blue chip counter parties: Q4 2024 Q1 2025 Q2 2025 Q3 2025 Q4 2025 2026 2027 2028 2029 2030 2031 2032 2033 2034 2035 2036 2037 2038 2039 2040 2041 BC210K-64 BC210K-79 BC210K-80 CMA CGM Masai Mara CMA CGM Zingaro CMA CGM Etosha CMA CGM Dolomites 1,400 TEU Bochem Casablanca Bochem Shanghai Bochem New Orleans Bochem Brisbane CMYZ0121 CMYZ0122 Bitumen carrier CMJL #1 Bitumen carrier CMJL #2 NH3 ready Chemical #1 NH3 ready Chemical #2 NH3 ready Chemical #3 NH3 ready Chemical #4 NH3 fitted Chemical #1 NH3 fitted Chemical #2 Hydrotug 1 Cap Lara Cap Quebec Cap Pembroke Cap Porth Arthur Cap Corpus Christi 1044522 DH Shipbuilding 1044534 DH Shipbuilding Helios Fraternity Daishan Donoussa FSO Asia / FSO Afrca CTV CSOV 1 493.1 $ mio 502.5 $ mio 790.5 $ mio 15.6 $ mio 893.1 $ mio 95.1 $ mio CONTAINER VESSELS CHEMICAL TANKERS OTHERS OIL TANKERS OFFSHORE WIND and O&G DRY-BULK VESSELS
  9. Non public version - © 2023 – CMB.TECH nv 10

    CMB.TECH & Golden Ocean proposed merger A leading diversified maritime group Further reference made to CMB.TECH in this chapter of the presentation is forward-looking and describes the CMBT & GOGL pro-forma company and its business plans after the proposed all stock transaction
  10. © 2025 – CMB.TECH 11 A Leading Diversified Maritime Group

    201+51 Modern Eco Vessels (1) 3 billion Contract backlog (USD) $ 11.1 billion Fair Market Value(2) ~50% Through-out the cycle leverage target Listing 6.1 Average age (excl. CTV’s 9.79y) ~$ 14.9/s 1 x NAV per share estimation $ 2.2 billion CAPEX commitments NH3 171 54 28 (1)Data format: Fleet on the water + new building orders (2) Fair Market Value (FMV): average of broker valuations of Fearnleys and Clarkson Valuations Limited. Valuation GOGL 12/03/2025, and CMBT 28/03/2025. Fleet Finance THE diversified and future-proof maritime group 8.9 years Avg. age 3,257 FMV $ millions 6.3 years Avg. age 6,064 FMV $ millions <1 years Avg. age 810 FMV $ millions 1 years Avg. age 381 FMV $ millions 611 FMV $ millions <1 y Avg. CSOV 9.8 y Avg. CTV <3.7 years Avg. age 17 FMV $ millions (12+91)+18 32+7 6+10 4+1 54+13 4+1 container dry-bulk oil chemical off-shore wind Other
  11. © 2025 – CMB.TECH 12 CMBT & GOGL Combined Available

    Days (1) Assumptions: • Golden Ocean fleet included for 100% for FY 2025 (combined fleet) • Spot days and Time Charter (TC) days provide the total available days - aligned with newbuilding delivery schedules • OTHER: 61 x CTV’s, 2 x 5,000 DWT coaster, 2 x ferry, 1 x Tugboat, 1 x MPHUV NUKE/CAPESIZE KAMSAR/PANAMAX CHEMICAL/PRODUCT NEWBUILDING CSOV FSO VLCC SUEZMAX OTHER CONTAINER (1) Estimation of available days basis fleet on 15/04/2025, basis current time charter contracts and new building delivery schedule as per 15/04/2025. TOTAL (excl. other) Bulk (71%)  Oil (32%) 593 30.361 1.095 30.660 1.095 30.660 2025 2026 2027 2028 27,785 30,954 31,755 31,755 Time Charter (Days) Spot (Days) 0 11.680 0 11.680 0 11.680 0 11.680 2025 2026 2027 2028 11,680 11,680 11,680 11,680 636 4.109 303 5.337 0 6.496 0 6.570 2025 2026 2027 2028 4,745 5,640 6,496 6,570 2.545 4.390 2.237 5.212 1.095 6.570 1.095 6.570 2025 2026 2027 2028 6,935 7,449 7,665 7,665 1.564 730 2.291 733 2.920 730 3.471 732 2025 2026 2027 2028 2,294 3,024 3,650 4,203 730 0 730 0 730 0 730 0 2025 2026 2027 2028 730 730 730 730 1.460 0 1.613 0 1.825 0 1.825 0 2025 2026 2027 2028 1,460 1,613 1,613 1,613 60 185 0 1.341 0 2.055 0 2.190 2025 2026 2027 2028 245 1,341 2,055 2,190 12.020 10.063 6.493 17.610 5.502 18.953 3.274 21.181 2025 2026 2027 2028 22,082 24,103 24,455 24,455 2025 2026 2027 2028 55,874 62,431 65,856 66,618 12.5% 87.5% 11.8% 88.2% 11.6% 88.4% 12.3% 87.7% Bulk (65%)  Oil (22%) 349 27.436
  12. © 2025 – CMB.TECH 13 0,26 0,33 0,23 -0,11 0,04

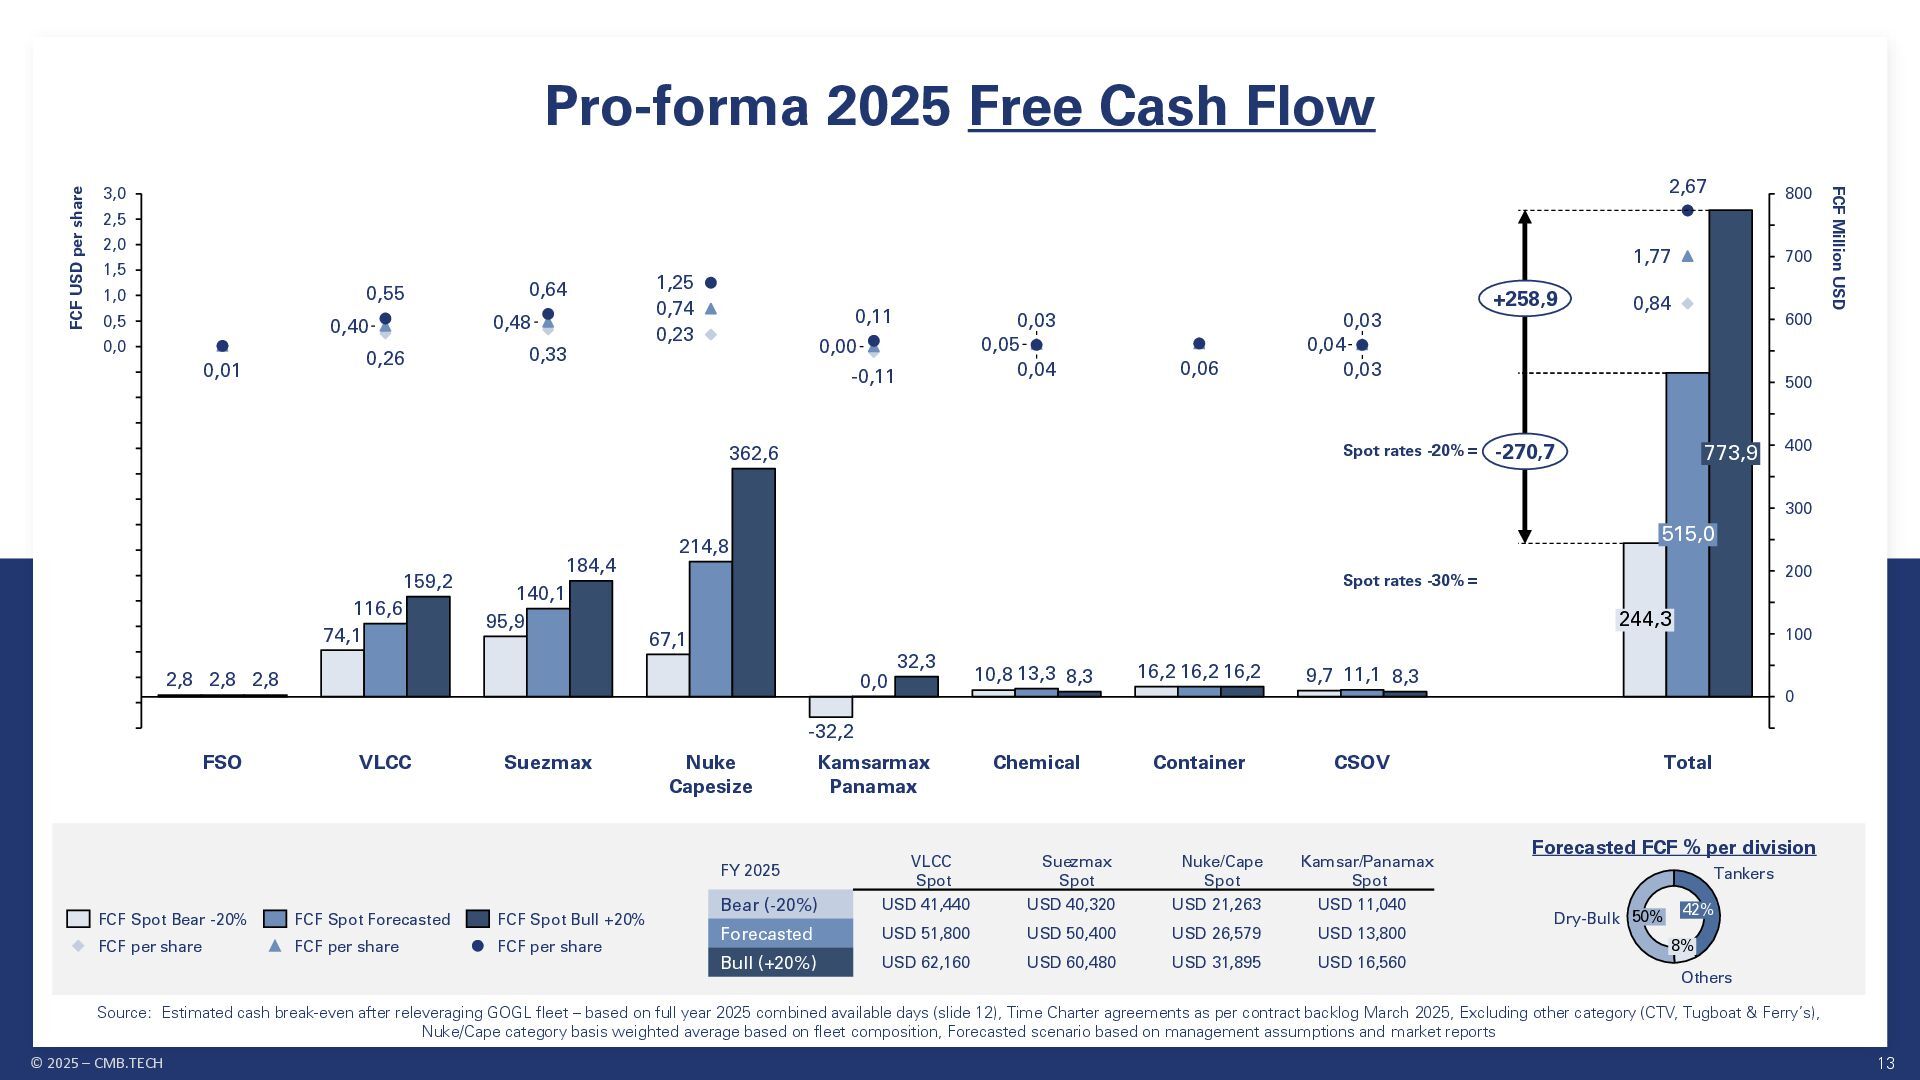
    0,06 0,03 0,84 0,40 0,48 0,74 0,00 0,05 0,04 1,77 0,01 0,55 0,64 1,25 0,11 0,03 0,03 2,67 0 100 200 300 400 500 600 700 800 0,0 0,5 1,0 1,5 2,0 2,5 3,0 Chemical Container CSOV Total 2,8 FCF Million USD FCF USD per share FSO VLCC Suezmax Nuke Capesize 2,8 2,8 74,1 116,6 159,2 95,9 140,1 184,4 Kamsarmax Panamax 214,8 362,6 -32,2 0,0 32,3 10,8 13,3 8,3 67,1 16,2 16,2 9,7 11,1 8,3 773,9 515,0 244,3 16,2 +258,9 -270,7 FCF Spot Bear -20% FCF per share FCF Spot Forecasted FCF per share FCF Spot Bull +20% FCF per share Pro-forma 2025 Free Cash Flow FY 2025 VLCC Spot Suezmax Spot Nuke/Cape Spot Kamsar/Panamax Spot Bear (-20%) USD 41,440 USD 40,320 USD 21,263 USD 11,040 Forecasted USD 51,800 USD 50,400 USD 26,579 USD 13,800 Bull (+20%) USD 62,160 USD 60,480 USD 31,895 USD 16,560 Source: Estimated cash break-even after releveraging GOGL fleet – based on full year 2025 combined available days (slide 12), Time Charter agreements as per contract backlog March 2025, Excluding other category (CTV, Tugboat & Ferry’s), Nuke/Cape category basis weighted average based on fleet composition, Forecasted scenario based on management assumptions and market reports 50% Dry-Bulk 42% Tankers 8% Others Forecasted FCF % per division Spot rates -20% = Spot rates -30% =
  13. © 2025 – CMB.TECH 15 CMB.TECH Strategy Supported by Regulations

    Modern eco fleet, NH3 dual fuel optionality & NH3 dual fuel fitted fleet H2 dual fuel optionality & H2 dual fuel fitted fleet MEPC 83 2028 ✓ EU ETS 2024 ✓ FuelEU 2025 ✓ € 2,400 per ton of VLSFO equivalent exceeding the limit EU ETS 2024 average auction price of € 65 per ton of CO2 Tier 1 deficit: $100 per tonne of CO2 eq on a WtW basis Tier 2 deficit: $380 per tonne of CO2 eq on a WtW basis Regulations: EU already in place, IMO 2028 CMB.TECH Strategy Source: FuelEU Maritime EU Regulation 2023/1805, EU ETS for Shipping as per amendments to Directive 2003/87/EC, Marine Environment Protection Committee, 83rd session (MEPC 83) 162 + 91 = 253 Vessels EU Green Deal and EU Fit for 55 IMO GHG strategy
  14. © 2025 – CMB.TECH 16 Tier 2 Compliant but Tier

    1 deficit: RU of $100 per tonne of CO2 eq on a WtW basis Tier 2 deficit: RU of $380 per tonne of CO2 eq on a WtW basis MEPC ’83 – Mid Term Measures (MTM) 0 10 20 30 40 50 60 70 80 90 100 GHG Fuel Intensity (WTW) in gCO2eq/MJ 2028 2029 2030 2031 2032 2034 2035 2036 2037 2038 2039 2040 2041 2042 2043 2044 2046 2047 2048 2049 2050 2045 2033 -4% -17% -6% -8% -19% -21% -39% -26% Tier 2 Non-Compliant: A ship that is not Tier 2 compliant can buy Tier 2 RUs or SUs and must pay for Tier 1 RUs BASE TARGET or Tier 2 Compliant: A ship that is compliant with Tier 2 must pay for Tier 1 RUs for any remaining Tier 1 deficit DIRECT COMPLIANCE TARGET & Over- Compliant: A ship that goes beyond Tier 1 can generate SUs below Tier 1 Tier 2 Tier 1 OR Direct Compliant: SU $ per tonne of CO2 eq surplus OR Compliant Reduction factors as per MEPC ’83 Extrapolated reduction factors as per 2023 IMO GHG Strategy X ✓ ✓ ✓ Tier 2 deficit Tier 1 deficit Direct Compliant RU=remedial unit SU=surplus unit $ SUs $ RUs IMO nzf ZNZ fuels fund $ RUs $ Source: Own data representation based on Marine Environment Protection Committee, 83rd session (MEPC 83) X ✓ ✓
  15. © 2025 – CMB.TECH 17 Impact of IMO MTM on

    Total Fuel Cost (incl. Penalties) Source: Own data representation based on MEPC 83, Maersk Mc-Kinney Moller 678 699 822 969 537 894 0 200 400 600 800 1,000 1,200 1,400 1,600 1,800 2,000 2,200 2,400 2,600 2,800 2030 822 507 2032 910 650 2034 1,152 2040 1,661 1,185 1,797 2042 1,743 1,143 2,012 2044 1,823 1,090 2,249 2046 1,900 1,031 2,510 2048 1,977 1,579 2,785 2050 2038 1,229 1,129 1,212 1,595 USD/tLSFOeq 702 1,366 2036 2028 1,014 718 474 958 0.0% -6.1% -8.1% -65.6% LSFO + bio-diesel (base case) LSFO + ZNZ LNG + bio-methane • Below graph compares the Total Fuel Cost of three options: 1. A base case using LSFO and the lowest cost between blending bio-diesel or paying the remedial unit penalty (RU); 2. LSFO and the lowest cost between ZNZ (zero /near-zero fuels) and paying the RU; 3. LNG and the lowest cost between blending bio-methane or paying the RU • Based on IMO Mid Term Measures with a two-tier Global Fuel Standard (GFS): RUs Tier I of 380 USD/tCO2e, RUs Tier II 100 USD/tCO2e (assumption made that the RUs remain constant after 2030) • No ZNZ fuel reward taken into consideration, WTW emissions, GFS intensity ref value of 93,3 gCO2e/MJ(average GFI of international shipping in 2008) • Fuel pricing basis: biofuel (LR/UMAS B100 Avg Price), ZNZ and LSFO (Maersk Mc-Kinney Moller Fuel Forecaster), ZNZ 90% fuel intensity reduction (9,43gCO2e/MJ). ZNZ fuels aligned with Sustainable Fuels Certification Scheme (SFCS) and provided on the Fuel Lifecycle Label (FLL) on the bunker delivery note Assumptions 2032: LSFO + ZNZ at par with LSFO + bio- diesel 2038: LSFO and ZNZ is 8% cheaper if compared to LNG + bio-methane NB ORDER NB DELIVERY END OF LIFE
  16. © 2025 – CMB.TECH 18 Newcastlemax consumption: 30 tonne VLSFO

    eq per day (360 days per year) IMO Mid Term Measures Life Cycle Fuel Cost Impact Source: Own data representation based on MEPC 83, Maersk Mc-Kinney Moller 0 2 4 6 8 10 12 14 16 18 20 22 24 26 28 30 32 2028 2030 2032 2034 2036 2038 2040 2042 2044 2046 2048 2050 7.37.6 5.8 7.5 7.8 5.1 8.9 8.9 5.5 10.5 9.8 7.0 12.4 11.0 9.7 14.7 12.2 13.3 17.1 13.1 Annual Fuel Cost in million USD 17.9 12.8 19.4 18.8 12.3 21.7 19.7 17.2 24.3 20.5 11.1 27.1 21.4 10.3 30.1 11.8 LSFO + bio-diesel (base case) LSFO + ZNZ LNG + bio-methane LSFO + bio-diesel/penalty: 296.7 mio USD Delivery in 2028 – 20 years operational life LSFO + ZNZ: 227.3 mio USD LNG + bio-methane: 295.1 mio USD -69.3 m$ -67.8 m$
  17. © 2025 – CMB.TECH 20 Marine Division Market Fundamentals Remain

    Intact Demand side • Tonne-mile crude oil: +0.1% in 2025 +0.6% in 2026 • World oil demand (IEA): +740 kb/d in 2025 +760 kb/d in 2026 TANKERS • OB/F VLCC 10.8%, Suezmax 17.2% • 2025 fleet growth of 0.7% versus crude tanker dwt demand growth of 0.8% • 17% of the VLCC & Suezmax fleet > 20 years Spot: 22 ships Time Charter: 8(+2) ships • Iron Tonne-mile Capesize: +0.0% in 2025 +5.3% in 2026 • China real GDP growth – including deescalated tariff effect: +4.6% in 2025 +3.8% in 2026 DRY-BULK • OB/F far below historic averages for Capesize 7.96% • 27% of Capes > 15 years • Capesize net fleet growth to average 1.4% year-on-year in both 2025 and 2026 Spot: 14 ships Time Charter: 0(+3) ships • TEU-mile: -0.4% in 2025 -2.5% in 2026 • ~8% of TEU-miles are now ‘freshly tariffed’, yet, 90-day suspension in place (May 12th) CONTAINER • The boxship fleet will grow by 6.3% in 2025, and 3.9% in 2026 • Historically high OB/F: 29.7% in 2025 (average over all sizes) Spot: 0 ships Time Charter: 4(+1) ships • Tonne-mile: +1.6% in 2025 +1.7% in 2026 • Global GDP growth adjusted for tariffs effect: +2.8% in 2025 +3.0% in 2026 CHEMICAL • OB/F ratio at 14.2% of the current core chemical tanker fleet • All time high average age of 15.4 y • 28% > 20 y • Rising share of product tanker swing tonnage Spot: 2 ships Time Charter: 4(+10) ships • Projecting 15% (+5.3 GW of capacity growth in Europe across 2025, and 22% (+8.9 GW) for 2026 • Offshore wind capacity in Europe will reach 158 GW (x4 today's level) by 2035 OFFSHORE WIND • European market is set for a significant increase in supply, with 14 CSOVs scheduled for delivery to owners in 2025 • Three CSOVs ordered so far this year Spot: 11 ships (Short) Time Charter: 44(+1) ships Commercial exposure on the water Supply side Supply / Demand balance POSITIVE POSITIVE CAUTIOUS CAUTIOUS POSITIVE Source: Own data representation based Clarksons, IEA, AXS Marine, Goldman Sachs, WTO, IMF, BRS
  18. © 2025 – CMB.TECH 22 Tankers • Trading fleet of

    12 VLCC and 18 Suezmax vessels on the water • Future-proof tonnage on order: 5 x ammonia powered ECO VLCC, and 2 x ECO Suezmax (NH3 ready) • Actual Q1 TCE for VLCC of 35,101 USD/day and actual Q2 quarter-to-date of 40,636 USD/day (64% fixed) • Actual Q1 TCE for Suezmax of 41,391 USD/day and actual Q2 quarter-to-date of 42,636 USD/day (59% fixed) • Sold three VLCCs in Q1 2025, Iris (2012, 314,000 dwt), Hakata (2010, 302,550 dwt) & Hakone (2010, 302,624 dwt) as part of its fleet rejuvenation strategy. The sales will generate a total capital gain of approximately 96.7 million USD (Q2 and Q3 2025) • Previously announced sales generated a capital gain of USD 46.25 million: Suezmax Cap Lara (2007, 158,826 dwt), VLCC Alsace (2012 – 299,999 DWT), and Windcat 6 KEY HIGHLIGHTS Q1 2025 PERFORMANCE 9,033 23,390 35,101 VLCC - spot +11,711 7,799 22,614 41,391 Suezmax - spot +18,777 9,033 23,390 46,135 VLCC -TC +22,745 7,799 22,614 31,328 Suezmax - TC +8,714 OPEX P&L break-even 2025 / day Actual Q1 2025 TCE / day TCE calculations: • Budget P&L break-even for 2025: includes OPEX, insurance, ship mgt fees, depreciation, interests, special expenses, arrangement fees & pool fees. OPEX as per 2025 budget • Suezmax Q1 2025 spot rates include time charter profit shares (profit share excluded from Q2 2025 to date) IN $ PER VESSEL PER DAY Spot rates to date for Q2 2025 VLCC 64% fixed at $40,636 per day Suezmax 59% fixed at $42,636 per day World Oil Demand Oil Supply, OPEC Oil Supply, non- OPEC OECD Total Crude Oil Stocks US Crude Oil Exports China Oil Imports Global Crude Oil Floating Storage +2.2% +1.3% +1.7% -5.1% -0.2% -1.8% +25.8% YoY (May 2025) Tanker Fleet Supply +0.5% Source: Own data representation based on Breakwave Advisors CRUDE OIL DEMAND GROWING BUT SLOWER
  19. © 2025 – CMB.TECH 23 Long-Term Tankers Market Attractiveness Favourable

    Supply Side Fundamentals Even though we are expecting a slow down in global economy this year, demand for oil is still expected to rise. Coupled with low OB/F % and ageing fleet, the tanker market remain positive in our view… Demand (Oil) Still Expected To Stay Strong 45 27 8 10 27 57 32 26 30 23 42 8 4 Suezmax Deliveries Suezmax Orderbook 2012 2013 2014 2015 2016 2017 2018 2019 2020 2021 2022 2023 2024 Orders + 244 Suezmax >20 years by 2030 116 Today’s new building orders do not cover the rapidly ageing fleet - and tanker contracting has fallen since mid-2024 due to market uncertainty Tariff impact on GDP & oil Additional upside Lower oil prices to boost inventory levels and demand Any change of today’s status quo on Iran sanction would be positive for VLCC Sanctions on Iran? 2011 Oil demand growth: 0.9% Global GDP growth: 2.8% Fleet carrying Iranian oil to be replaced by conventional tankers Decrease More oil to be moved on conventional tankers from Saudi Arabia Increase # of vessels 244 2022 2023 2024 2025 2026 0 101 102 103 104 105 106 mb/d 0,80 Global Oil demand Global Oil production Updated USTR Proposal Manageable impact Source: Own data representation based Clarksons, IEA, Morgan Stanley
  20. © 2025 – CMB.TECH 24 OPEC Booster Accelerated unwinding of

    voluntary cuts of OPEC+ leads to falling oil prices, leading to lower bunker fuel costs and potential re-stocking of oil inventories that stand at the absolute bottom of the 5-year range (OECD oil inventories) 1. Group cuts: 2.0 mb/d 2. Voluntary 1st cuts: 1.6 mb/d 3. Voluntary 2nd cuts: 2.2 mb/d OPEC+ cut refresher (various stages in 2022) • Agreement to gradually unwind voluntary cuts • Gradual monthly increases over 18 months of ~130 kb/d (until September 2026) Unwinding voluntary cuts (December 2024) Delayed several times through-out 2024 Delayed unwinding voluntary cuts (various stages 2023- 24) • OPEC+ will accelerate oil output hikes • 411 kbd in May, 411 kbd July confirmed • Market sources talking about bringing back the full 2.2 million bpd November 2025 Accelerated unwinding (May 2024) OPEC + changes Updated Brent oil price forecast and updated Supply-Demand balance 0 56 58 60 62 64 66 $ /bbl Q2 2025 Q3 2025 Q4 2025 Q1 2026 Q2 2026 Q3 2026 Q4 2026 -8.0% New (after acceleration) Previous (prior to acceleration) -0,5 -0,4 -0,8 0,2 0,7 -0,8 -0,6 -0,4 -0,2 0,0 0,2 0,4 0,6 0,8 1,0 1,2 1,4 -3 -2 -1 0 1 80 81 83 84 82 85 -4 81,9 81,4 2022 83,1 82,7 2023 83,6 82,8 mbd 83,9 84,1 2025 84,3 2024 2026 85,0 Demand (Non-)OPEC supply Implied balance Brent oil price Crude and condensate balance Source: Own data representation based on Morgan Stanley, OPEC
  21. © 2025 – CMB.TECH 26 Dry bulk • As of

    April 23rd, 14 super-eco 210,000 DWT Newcastlemaxes on the water exposed to supportive freight markets • Future-proof tonnage on order – with another 14 Newcastlemaxes to be delivered by Q2 2027 (~1 per month) • Five Newcastlemax still to be delivered in 2025 • Q1 2025 TCE actuals at 18,393 USD/day • CMB.TECH Newcastlemax fleet outperformed Q1 5TC Baltic Capesize Index by 41.5% (USD 12.998 USD /day) • Q2 TCE quarter to date rates at 24,261 USD/day (75% fixed) • Fortescue and CMB.TECH sign agreement for ammonia-powered Newcastlemaxes • CMB.TECH and MOL sign landmark agreement for three ammonia-powered Newcastlemaxes KEY HIGHLIGHTS Q1 2025 PERFORMANCE TCE calculations: • Budget P&L break-even for 2025: includes OPEX, insurance, ship mgt fees, depreciation, interests, special expenses, arrangement fees & pool fees. OPEX as per 2025 budget • OPEX as per 2025 budget 5,684 23,594 18,393 24,261 Newcastlemax bulk carrier -5,201 OPEX P&L break-even 2025 / day Actual Q1 2025 TCE / day Q2 to date TCE / day IN $ PER VESSEL PER DAY Source: Own data representation based on Clarksons Research, Breakwave Advisors, Bloomberg Newcastlemax Q2 TCE to date: 75% fixed at $24,261 per day China Steel Production China Steel Inventories China Iron Ore Inventories China Iron Ore Imports China Coal Imports Brazil Iron Ore Exports Australia Iron Ore Exports +1.1% -22.6% -5.8% -5.7% -5.3% +1.2% -1.6% YoY (May 2025) Dry-Bulk Fleet Supply +2.6% DRY-BULK SEABORNE TRADE IS STILL GROWING
  22. © 2025 – CMB.TECH 27 Q1 2025 – Strength of

    Atlantic Iron Ore trade Brazil Iron Ore Export performed strong in Q1 2025… • In 2024, the structural strength in the Capesize segment was primary driven by Atlantic Fronthaul mineral ore trade • Comparing the Atlantic to the Pacific loading's tonnage ratio for Capesize vessels, a gradual shift can be noticed over the last years from the Pacific to the Atlantic – increasing to a ratio of 3.0 in Q1 2025 (i.e. 3 loading in the Atlantic versus 1 loading in the Pacific). The ratio was turbo charged with the continual influx of Guinean bauxite in Q1 2025 • Vale (VALE), iron ore production during the first quarter was down 4% y/y due to licensing restrictions and heavier rainfall in Brazil. That said, iron ore sales and exports grew by 4% due to the Company drawing down inventories. Vale's FY25 iron ore production guidance remains unchanged at between 325 - 335 Mt, which would imply a ramp into the back half of the year …whilst the seasonal dryer and stronger period only starts in H2 0.80 0.00 0.85 0.90 0.95 1.00 1.05 1.15 1.20 1.10 0.75 January February March April May June July August September 30-days moving average (million ton per day) November December October +19.6% 2022 2023 2024 2025 0 20 40 60 80 100 120 140 160 180 200 220 240 260 0.00 0.05 0.10 0.15 0.20 0.25 0.30 0.35 0.40 0.45 0.50 0.55 0.60 15 days precipitation accumulation (mm) 15-day loading rate Brazil (million ton per day) 01/01/2025 15/01/2025 01/02/2025 15/02/2025 01/03/2025 15/03/2025 01/04/2025 15/04/2025 01/05/2025 15/05/2025 01/06/2025 15/06/2025 15 days precipitation accumulation (mm) 15-day moving average intake Source: Own data representation based AXS Marine Brazil Iron Monitor and Weather Dashboard, BRS, Deutsche Bank Today
  23. © 2025 – CMB.TECH 28 Q1 2025 – Guinea Bauxite

    Trade as Ton-Mile Booster Bauxite export performed again strongly in Q1 2025… • Bauxite export market share in 2024: Guinea 142.9 M (70.1%), Australia 44.4M (21.8%), Brazil 4.9M (2.4%) • Bauxite import countries market share in 2024: China 171.2 M (85.5%), UAE 6.9 M (3.4%), India 4.M (2.3%) Canada 3.7 M (1.9%) • Market participants are expecting Chinese imports of bauxite to remain high for the foreseeable future on the back of strong demand in Q2 from new alumina capacity commissioning, and supply remaining strong from Guinea and Australia. In addition, Capesize represent around 60% of global bauxite trade with China as the dominant importer, which is favorable for the ton-miles within the Capesize segment • Bauxite prices spiked at $115/mt in January and in combination with low alumina inventories in China triggered strong demand in Q1. On top, port congestion spiked hit a record in early March …ahead of the seasonal May-September slump Source: Own data representation based AXS Marine Brazil Iron Monitor and Weather Dashboard, BRS 8 9 10 11 12 13 14 15 16 17 18 0 7 January February March April May June July August September Guinea Bauxite Export Volume (million ton per month) November December October +7.8% +42.4% +26.0% 2022 2023 2024 2025 0 50 100 150 200 250 300 350 400 450 500 550 0.00 0.05 0.10 0.15 0.20 0.25 0.30 0.35 0.40 0.45 15 days precipitation accumulation (mm) 15-day loading rate Guinea (million ton per day) 01/05/2024 01/06/2024 01/07/2024 01/08/2024 01/09/2024 01/10/2024 01/11/2024 01/12/2024 01/01/2025 01/02/2025 01/03/2025 01/04/2025 01/05/2025 01/06/2025 15 days precipitation accumulation (mm) 15-day moving average intake Today Rapid and continued growth in market share from Guinea
  24. © 2025 – CMB.TECH 29 Q1 2025 – Pacific Iron

    Ore Trade Disappointed Australia iron ore export underperformed during Q1 2025... • Australian cargo volumes dipped in Q1 2025 due to weather-related port disruptions. As the cyclones dissipated, loadings in Pacific gradually resumed by March • Anecdotally, Rio Tinto (RIO) reported that iron ore production/exports were down during the quarter, primarily due to above shown heavy rains in Western Australia. As such, iron ore shipments were down 9% y/y and the Company set its FY25 production guidance range at the low end of 323-338 Mt. Yet, there is a mitigation plan in place to offset some of the shipment losses …due to unusual heavy rain Western Australia…and improved as of end Q1 2025 2.15 2.20 2.25 2.30 2.35 2.40 2.45 2.50 2.55 2.60 2.65 2.70 0.00 2.10 January February March April May June July August September October November 30-days moving average export from Australia (million ton per day) December -13.6% -8.8% 2023 2024 2025 0 10 20 30 40 50 60 70 80 90 0.0 0.5 1.0 1.5 2.0 2.5 3.0 15 days precipitation accumulation (mm) 15-day average loading West Australia (million tons per day) 01/01/2025 15/01/2025 01/02/2025 15/02/2025 01/03/2025 15/03/2025 01/04/2025 15/04/2025 01/05/2025 15/05/2025 01/06/2025 15/06/2025 15 days precipitation accumulation (mm) 15-day moving average intake Source: Own data representation based AXS Marine Australia Iron Monitor and Weather Dashboard, Deutsche Bank Today
  25. © 2025 – CMB.TECH 30 Long-Term Dry Bulk Market Attractiveness

    Thanks to supportive market dynamics, adding Golden Ocean’s fleet of 91 eco vessels will enable CMB.TECH to become the preferred partner for large scale industrials and future-proof dry-bulk shipping 41 48 58 57 45 111 212 251 214 103 94 88 104 75 51 80 113 88 50 56 32 150 2006 2007 2008 2009 2010 2011 2012 2013 2014 2015 2016 2017 2018 2019 2020 2022 2023 2024 2021 2004 2005 Orders +101 Capesize Bulkcarrier Deliveries Lowest OB/F ratio since 1996: Capesize Bulkcarrier Orderbook Historical high average age of 11.5 years Consistent low OB/F ratio, ageing fleet and constraint order book as a proxy of future earnings potential (and vessel values) = + Dry docking congestion due to Special Survey (over 25% of fleet over next 3 years) CII, EU ETS, Fuel EU: environmental legislating will impact Cape speed & availability 0 20 40 60 80 100 120 140 160 180 2006 2008 2010 2012 2014 2016 2018 2020 2022 2024 2026 $/tonne 56 USD/tonne The 62%Fe Iron Ore Index is at ~$100/t Today Vale est. Break-Even Price BHP/Rio Tintio est. Break-Even Price Iron Ore Spot Price CFR N China Chinese domestic iron ore declines further: cheaper to import high grade overseas iron ore A wave of new supply, mostly from Australia, Brazil and Guinea – with a cost curve (CFR) below iron ore price forecast Iron ore price forecast at $90/tonne in Q4 2025 and $80/tonne in Q42026 Creating a positive sentiment for global mining of iron ore – a supportive environment for seaborne tonne-mile trade (-0.6% in 2025, +0.3% in 2026) = X X + Bauxite trade growth ~4.1% per year over 2024/26 Continued growth in coal (India & China) Grain trade to grow ~2.4% per year over 2024/26 (tonne-mile adj.) + 2025 OB/F ratio at ~8% 2027 order book at 150 and NB options pushed to 2028 X X # of vessels Today: 572 Capes > 15 years By 2030: +823 Capes > 20 years (40% of the fleet) Iron ore price Source: Own data representation based Clarksons, Morgan Stanley, Goldman Sachs, AXS Marine Positive Supply Story (Tonnage) Supportive Demand (Ton & Mile)
  26. © 2025 – CMB.TECH 31 Long-Term View for Capes/Nukes Source:

    Own data representation based Clarksons Fleet utilization • Global iron ore trade continues to be a key driver of dry bulk demand, with ton-mile growth expected to accelerate meaningfully over the medium term (eg. Simandou, S11D expansion) . Iron ore ton-miles to expand at an average annual rate of approximately 5% in both 2026 and 2027 • The combination of increased volumes, longer distances traveled, operational inefficiencies (dry-docking, port congestion, regulation) directly enhances utilization rates and earnings potential for Capesize operators • CMB.TECH is ideally positioned: 14 super-eco Newcastlemaxes on the water today (additional 14 to be delivered 2025/26), and in combination with the potential Golden Ocean merger (59 Nukes/Capes, 32 Kamsar/Panamaxes Demand Growth -2 0 2 4 6 8 10 12 14 2021 2022 2024 2025 2026 2027 2023 84 85 86 87 88 89 2017 90 91 2018 92 2019 2020 Utilization % 84,6 85,7 85,7 Growth % 91,2 89,0 85,8 87,7 84,3 88,0 88,7 87,8 Net fleet growth (%) Demand growth (%) Utilization (%) 1,2 6,4 6,4 5,3 4,9 -5 -4 -3 -2 -1 0 1 2 3 4 5 6 7 8 2021 2022 2023 2024 2025 2026 2027 Growth % -4,4 -0,2 Total ton-mile growth (%) Other ton-mile growth (%) Iron Ore ton-mile growth (%)
  27. © 2025 – CMB.TECH 33 Containers Q1 2025 PERFORMANCE •

    4 x super-eco 6,000 TEU ice class container feeder vessels on the water. Newbuilding program of the 6,000 TEU ice class completed and all operational under a 10-year time charter contract to CMA CGM • 1 x 1,400 TEU dual fuel NH3 on order to be delivered in July 2026 (Qingdao Yangfan Shipbuilding) – under 15-year time charter contract • U.S. container imports from China remain significant at ~12 million TEU in 2024, but early 2025 saw a sharp frontloading surge (+9% YoY) followed by a 50% drop in bookings from China, partially offset by Southeast Asia. On May 12, 2025 U.S.-China agreement to suspend part of tariffs for 90 days eased trade tensions, reducing the expected drag on U.S. container imports and GDP, and improving the global trade and shipping outlook • Red Sea rerouting remains the key driver of the container freight market outlook, currently providing a ~11% uplift to TEU-mile demand. The situation is clearly uncertain, but a return to widespread boxship routings through the region looks unlikely in the short term, however, this imposes a downside risk in the medium to long-term IN $ PER VESSEL PER DAY 5,106 19,705 29,378 6000 TEU container vessel +9,673 OPEX P&L break-even 2025 / day Actual Q1 2025 TCE / day Source: Own data representation based on Clarksons TCE calculations: • Budget P&L break-even for 2025: includes OPEX, insurance, ship mgt fees, depreciation, interests, special expenses, arrangement fees & pool fees. OPEX as per 2025 budget • OPEX as per 2025 budget KEY HIGHLIGHTS SUNSET APPROACHING? 0 1.000 2.000 3.000 4.000 5.000 Q1-2020 Q2-2020 Q3-2020 Q4-2020 Q1-2021 Q2-2021 Q3-2021 Q4-2021 Q1-2022 Q2-2022 Q3-2022 Q4-2022 Q1-2023 Q2-2023 Q3-2023 Q4-2023 Q1-2024 Q2-2024 Q3-2024 Q4-2024 Q1-2025 SCFI Comprehensive Container Freight Rate Index Delphis has no spot exposure
  28. © 2025 – CMB.TECH 35 Chemical Q1 2025 PERFORMANCE •

    Trading fleet of six chemical tankers on the water • Newbuilding orderbook: • 2 x chemical tankers (NH3 ready): 2025 • 2 x product tankers (CH₃OH fitted): 2026 • 4 x chemical tankers (NH3 ready): 2028 // 2 x chemical tankers (NH3 fitted): 2029 • Favorable long-term contract exposure: 2 x Pool, 6 x 10-year TC, 6 x 7-year TC • Current spot rates for chemical tankers remain 20–25% below last year’s exceptionally high levels. • Looking further ahead, the MR market is expected to be a key focus, as the limited chemical tanker order book and stable demand fundamentals make swing-tonnage from MR product tankers a crucial factor for chemical earnings in 2025/2026 IN $ PER VESSEL PER DAY 5,999 18,386 20,521 25K DWT chemical tanker Pool +2,135 OPEX P&L break-even 2025 / day Actual Q1 2025 TCE / day 1 YEAR TC 19,999 DWT CHEMICAL TANKER (STAINLESS STEEL) 5,999 18,386 19,306 25K DWT chemical tanker TC +920 TCE calculations: • Budget P&L break-even for 2025: includes OPEX, insurance, ship mgt fees, depreciation, interests, special expenses, arrangement fees & pool fees. OPEX as per 2025 budget • OPEX as per 2025 budget Source: Own data representation based on Clarksons, SEB KEY HIGHLIGHTS 0 5.000 10.000 15.000 20.000 25.000 Q1-2020 Q2-2020 Q3-2020 Q4-2020 Q1-2021 Q2-2021 Q3-2021 Q4-2021 Q1-2022 Q2-2022 Q3-2022 Q4-2022 Q1-2023 Q2-2023 Q3-2023 Q4-2023 Q1-2024 Q2-2024 Q3-2024 Q4-2024 Q1-2025 USD/day 1 Year Timecharter Rate 19,999 dwt Stainless Steel Chemical Tanker Bochem has only limited spot exposure
  29. © 2025 – CMB.TECH 37 Offshore wind and oil &

    gas TCE calculations: • CSOV TCE rate is based on forecast time charter rate (incl. other income) • Budget P&L break-even for 2025: includes OPEX (incl. insurance and ship mgt fees), depreciation, interests, special expenses, arrangement fees & pool fees • OPEX as per 2025 budget • Most key vessel segments remain fully utilised in Europe, attributed to strong demand from both offshore wind and oil and gas industries • CTV • Windcat has 54 CTVs on the water, 7 additional CTVs on order – all with H2 dual fuel fitted engines • Windcat CTV market operates mainly under short term time charter contracts (3 months up to 5 years), resulting in a contract backlog of $ ~86 mio (March 2025) • After a busy end Q4 2024, the new year started more quietly, as a number of projects will only start later this year (from June / July). Typical seasonal market with highest utilisation over the summer period. Long-term awareness by charterers that there could be a lack of vessels in 2026, and in the following years – hence supportive for long-term rate trends • CSOV • Windcat has six CSOV on order – with the first delivery in Q2 2025 • The CSOV market is sold out for H1 2025, with tight availability expected to persist into Q3 2025 until newbuilds arrive and vessels return from summer campaigns • While OEMs for turbines and cables, along with contractors and developers, remain key charterers, several pending oil and gas tenders were finalised during Q1 2025 IN $ PER VESSEL PER DAY 15,292 42,022 50,912 CSOV +8,890 Forecast TCE / day 1,553 1,990 2,376 2,894 CTV +386 Source: Own data representation based on Clarksons OPEX P&L break-even 2025 / day Actual Q1 2025 TCE / day Q2-to-date TCE/day Q1 2025 PERFORMANCE KEY HIGHLIGHTS Utilization Q1: 75.6%
  30. © 2025 – CMB.TECH 38 Marine Division NB delivery fleet

    list Hull Type Yard Date BC210k-49 Newcastlemax CSSC Qingdao Beihai Shipbuilding Co., Ltd Q2 2025 BC210k-50 Newcastlemax CSSC Qingdao Beihai Shipbuilding Co., Ltd Q2 2025 YN 552205 CSOV Ha Long Shipbuilding Co., Ltd, Vietnam Q2 2025 BC210k-51 Newcastlemax CSSC Qingdao Beihai Shipbuilding Co., Ltd Q2 2025 BC210k-43 Newcastlemax CSSC Qingdao Beihai Shipbuilding Co., Ltd Q2 2025 Hydrocat 58 CTV Dok en Scheepsbouw Woudsend Q2 2025 Windcat 60 CTV Dok en Scheepsbouw Woudsend Q2 2025 YN 552206 CSOV Ha Long Shipbuilding Co., Ltd, Vietnam Q3 2025 BC210k-52 Newcastlemax CSSC Qingdao Beihai Shipbuilding Co., Ltd Q3 2025 Windcat 61 CTV Dok en Scheepsbouw Woudsend Q3 2025 Windcat 62 CTV Dok en Scheepsbouw Woudsend Q3 2025 Windcat 63 CTV Dok en Scheepsbouw Woudsend Q3 2025 CMYZ0121 25K DWT ch. tanker China Merchants Jinling Shipyard, YangZhou Q4 2025 BC210k-44 Newcastlemax CSSC Qingdao Beihai Shipbuilding Co., Ltd Q4 2025 YN 552207 CSOV Ha Long Shipbuilding Co., Ltd, Vietnam Q4 2025 BC210k-53 Newcastlemax CSSC Qingdao Beihai Shipbuilding Co., Ltd Q4 2025 Windcat 64 CTV Dok en Scheepsbouw Woudsend Q4 2025 Hull Type Yard Date CMYZ0122 25K DWT ch. tanker China Merchants Jinling Shipyard, YangZhou Q1 2026 Windcat 65 CTV Dok en Scheepsbouw Woudsend Q1 2026 TK300K-1 VLCC CSSC Qingdao Beihai Shipbuilding Co., Ltd Q1 2026 BC210k-45 Newcastlemax CSSC Qingdao Beihai Shipbuilding Co., Ltd Q1 2026 DQS-02 Coaster Dung Quat Shipyard Q1 2026 BC210k-54 Newcastlemax CSSC Qingdao Beihai Shipbuilding Co., Ltd Q1 2026 TK300K-2 VLCC CSSC Qingdao Beihai Shipbuilding Co., Ltd Q2 2026 BC210k-55 Newcastlemax CSSC Qingdao Beihai Shipbuilding Co., Ltd Q2 2026 HN5105 Suezmax tanker Daehan Shipbuilding Co., LTD Q2 2026 YN 552208 CSOV Ha Long Shipbuilding Co., Ltd, Vietnam Q2 2026 BC210k-46 Newcastlemax CSSC Qingdao Beihai Shipbuilding Co., Ltd Q2 2026 HN5106 Suezmax tanker Daehan Shipbuilding Co., LTD Q2 2026 DQS-04 Coaster Dung Quat Shipyard Q2 2026 TK300K-3 VLCC CSSC Qingdao Beihai Shipbuilding Co., Ltd Q3 2026 BC210k-56 Newcastlemax CSSC Qingdao Beihai Shipbuilding Co., Ltd Q4 2026 BC210k-63 Newcastlemax CSSC Qingdao Beihai Shipbuilding Co., Ltd Q4 2026 CV1300-01 1400 TEU container Qingdao Yangfan Shipbuilding Q4 2026 YN 552209 CSOV Ha Long Shipbuilding Co., Ltd, Vietnam Q4 2026 BC210k-64 Newcastlemax CSSC Qingdao Beihai Shipbuilding Co., Ltd Q4 2026 TK300K-4 VLCC CSSC Qingdao Beihai Shipbuilding Co., Ltd Q4 2026 CMYZ0161 17K DWT bitumen. tanker China Merchants Jinling Shipyard, YangZhou Q4 2026 CMYZ0162 17K DWT bitumen. tanker China Merchants Jinling Shipyard, YangZhou Q4 2026 BC210k-79 Newcastlemax CSSC Qingdao Beihai Shipbuilding Co., Ltd Q1 2027 YN 552210 CSOV Ha Long Shipbuilding Co., Ltd, Vietnam Q1 2027 BC210k-80 Newcastlemax CSSC Qingdao Beihai Shipbuilding Co., Ltd Q2 2027 TK300K-5 VLCC CSSC Qingdao Beihai Shipbuilding Co., Ltd Q2 2027 (*) Indicative NB delivery times – basis situation 31/01/2025 2 x Suezmax 5 x VLCC 16 x Newcastlemax 2 x 5.000 dwt coasters 1 x 1400 TEU 2 x 25k dwt chemical 2 x 17k dwt bitumen 6 x CSOV 7 x CTV (2025/26)
  31. © 2025 – CMB.TECH 40 Conclusion • Profit of USD

    40.4 million in Q1 2025 (USD 0.21 per share) • Term sheet signed for a merger transaction between CMB.TECH and Golden Ocean • Discretionary dividend policy – no dividend declared for Q1 2025 • Large exposure to favorable tanker and dry-bulk fundamentals • Long-term contracts for futureproof tonnage gains further traction • Chemical and container market exposure locked in at favorable long- term contracts • Increasing demand for offshore wind and offshore oil & gas supply vessels – first CSOV on the water in June 2025 • MEPC ’83 boosts the business case of NH3 and H2 dual fueled vessels • Decarbonisation optionality provides additional upside potential • Fortescue and CMB.TECH sign agreement for ammonia-powered ore carrier • CMB.TECH and MOL sign landmark agreement for nine ammonia-powered vessels SHAREHOLDERS POSITIVE OUTLOOK 2025 AND BEYOND STRONG PORTFOLIO Powered by:
  32. Non public version - © 2023 – CMB.TECH nv 41

    • If you would like to ask a question, please raise your hand. • Introduce yourself & unmute before asking your question. • If you can’t unmute, please use the Q&A section to ask your question. • For telephone participants, please type *5 to raise your hand and *6 to unmute. • If you have any follow-up questions, please send an e-mail to [email protected]. Q&A 41 © 2025 – CMB.TECH