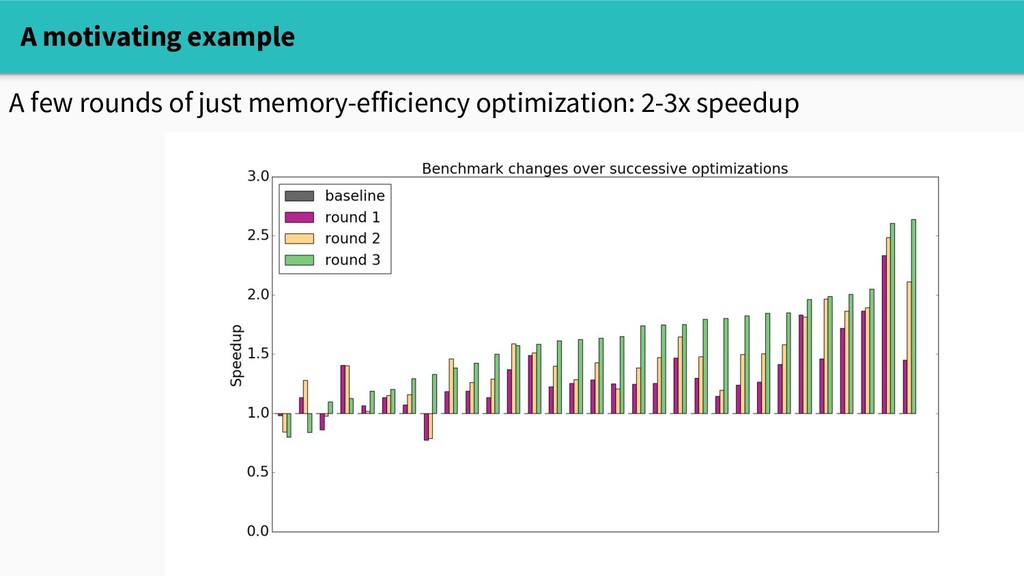
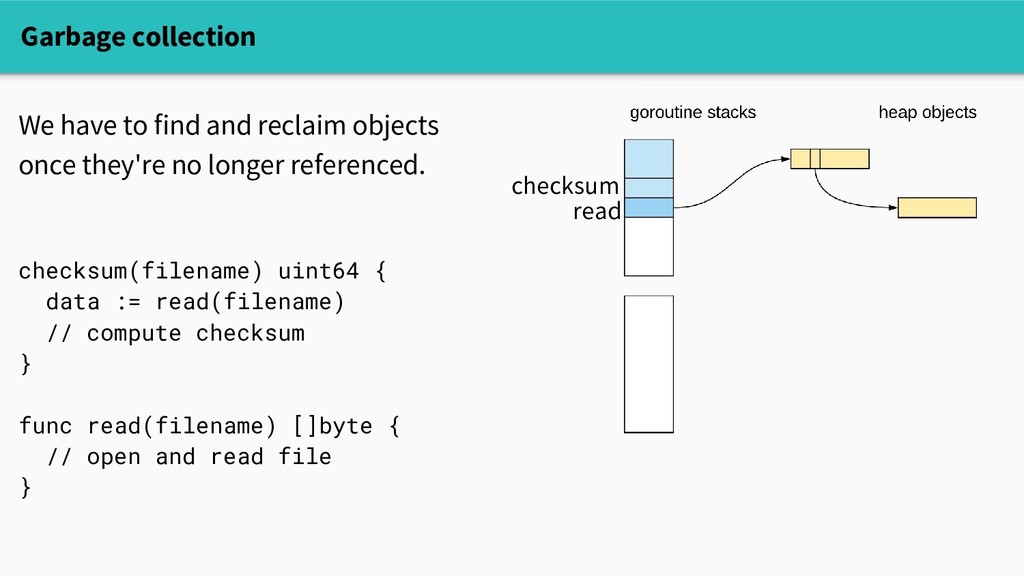
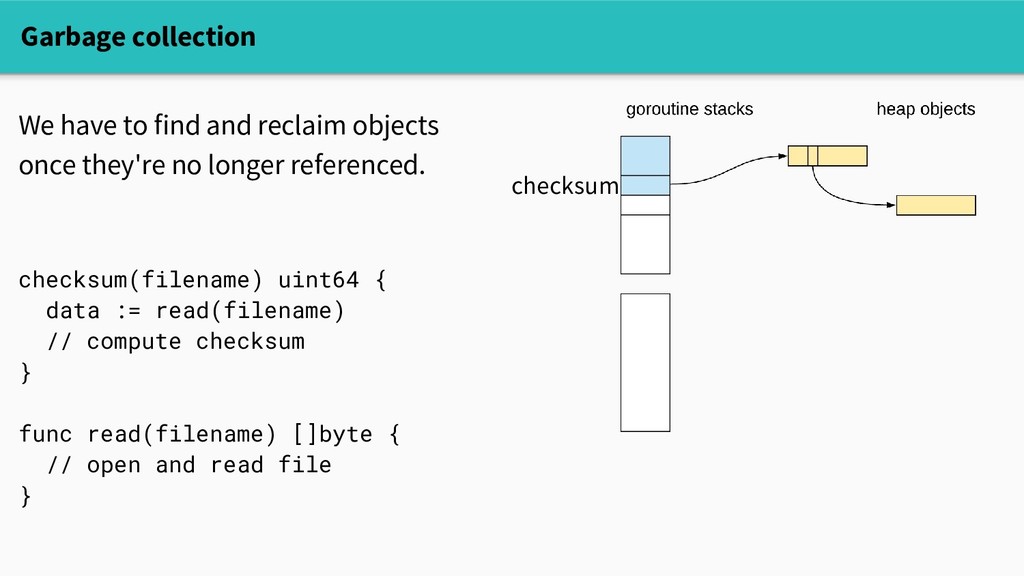
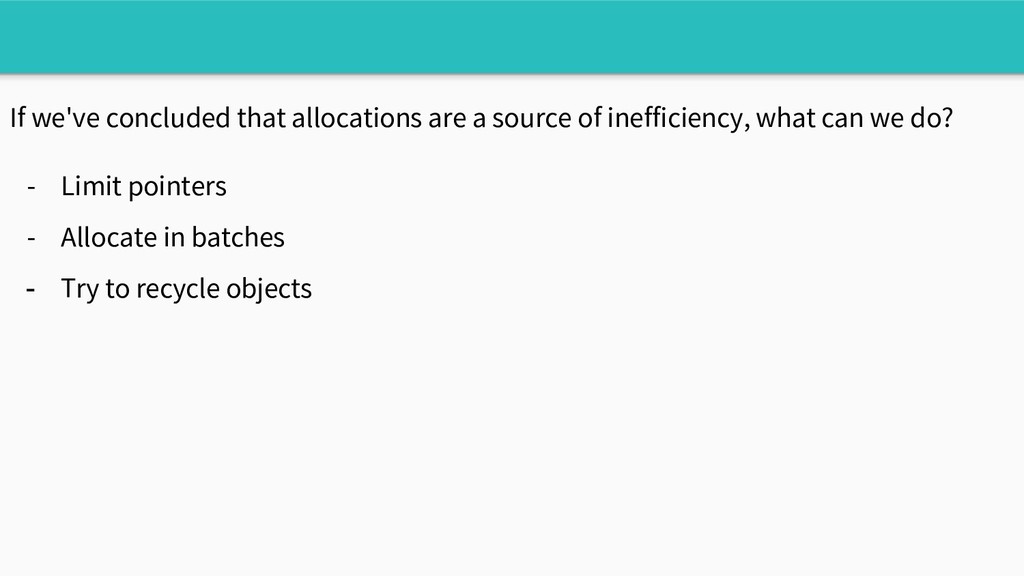
The runtime does a lot of sophisticated work on behalf of you, the programmer - And yet, dynamic memory allocation is not free - A program's allocation patterns can substantially affect its performance!
affect its performance! - However, those patterns are often syntactically opaque. - Equipped with understanding and the right set of tools, we can spend our time more wisely.
affect its performance! - However, those patterns are often syntactically opaque. - Equipped with understanding and the right set of tools, we can spend our time more wisely. - Moreover, the runtime's internals are inherently interesting!
its mind How do the allocator and garbage collector work? II. Bring your binoculars Tools for understanding allocation patterns III. Delicious treats for the ravenous allocator Strategies for improving memory efficiency
much smarter than me, maybe even smarter than you! And they're always cooking up new stuff A Caveat The Go runtime team discusses the design of the garbage collector.
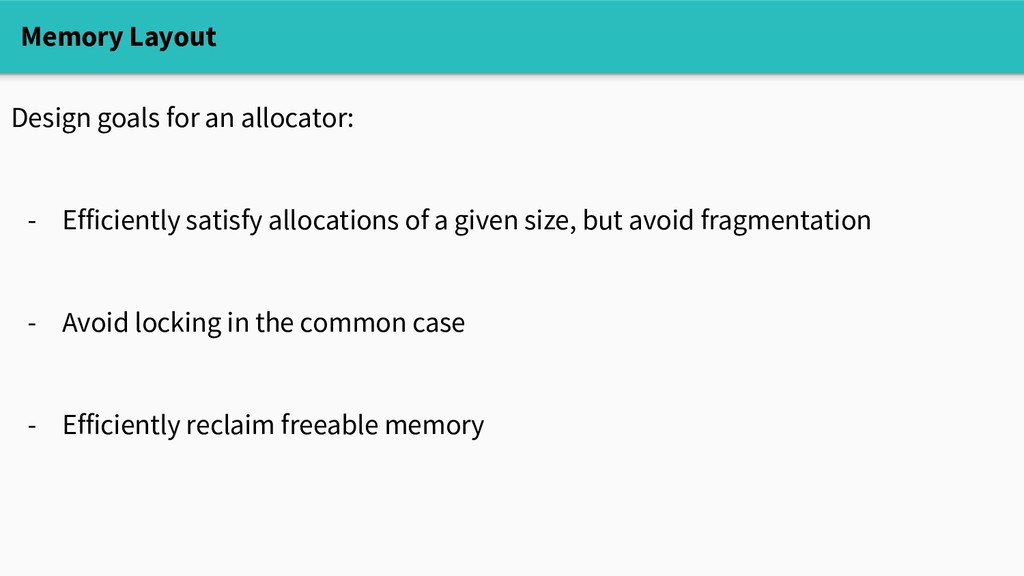
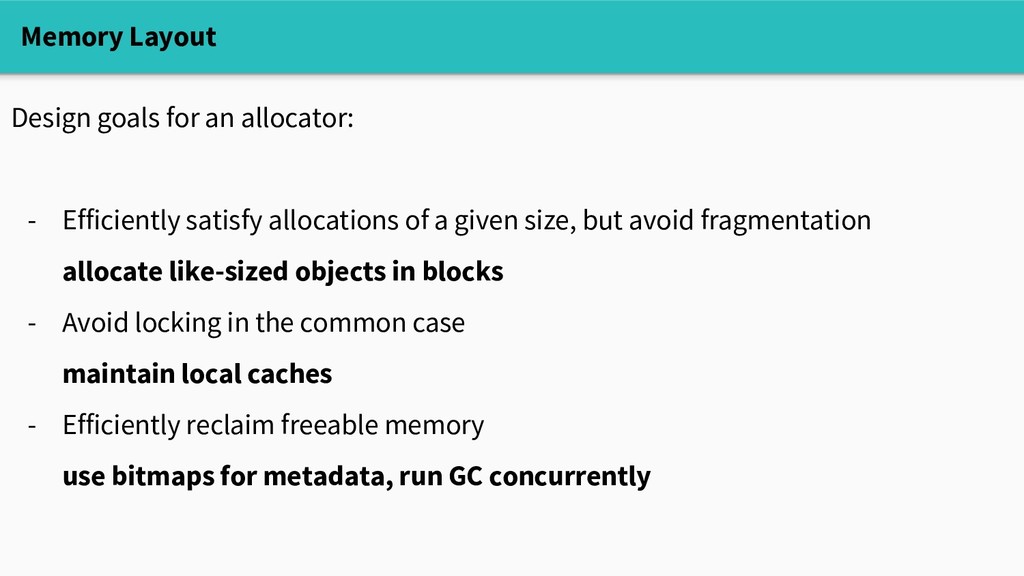
allocations of a given size, but avoid fragmentation allocate like-sized objects in blocks - Avoid locking in the common case - Efficiently reclaim freeable memory
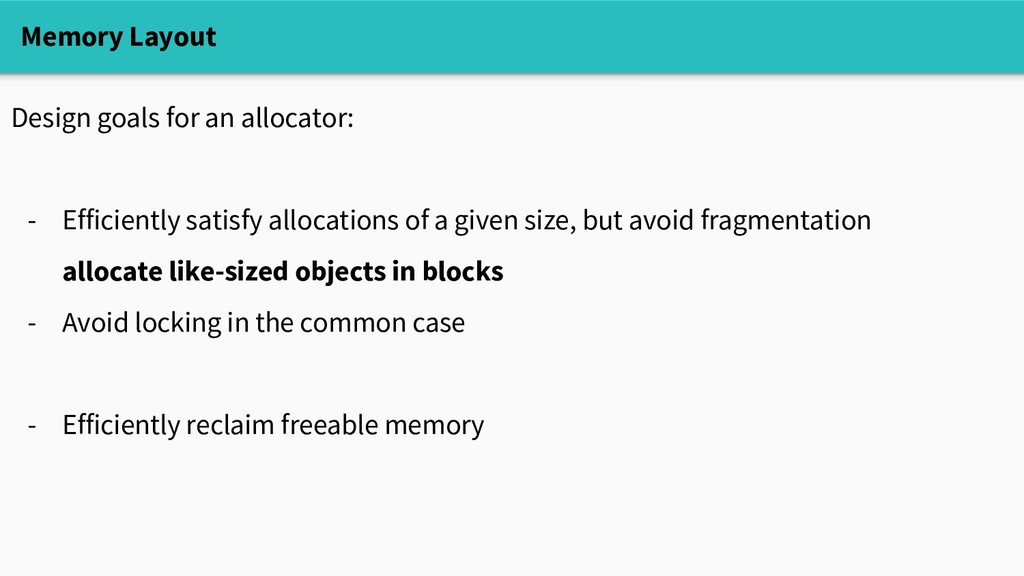
allocations of a given size, but avoid fragmentation allocate like-sized objects in blocks - Avoid locking in the common case maintain local caches - Efficiently reclaim freeable memory
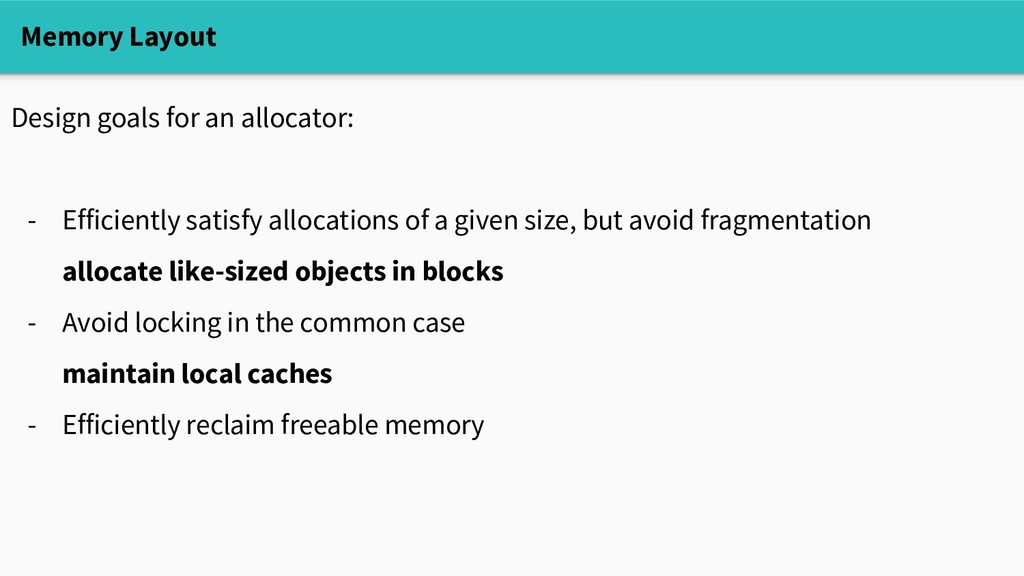
allocations of a given size, but avoid fragmentation allocate like-sized objects in blocks - Avoid locking in the common case maintain local caches - Efficiently reclaim freeable memory use bitmaps for metadata, run GC concurrently
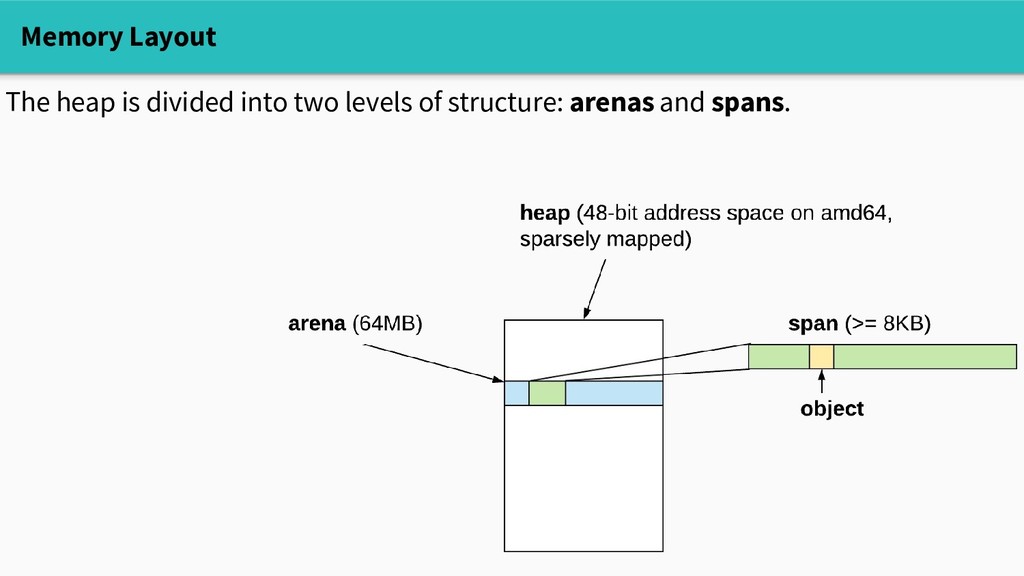
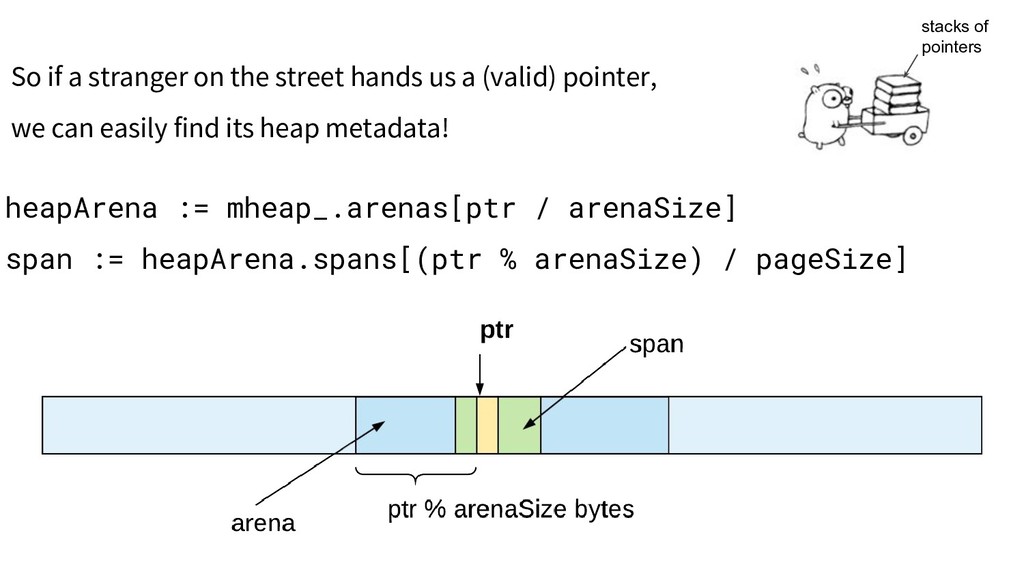
structure: arenas and spans. Arenas are big chunks of aligned memory. On amd64, each arena is 64MB, so 4 million arenas cover the address space, and we keep track of them in a big global array (mheap.arenas)
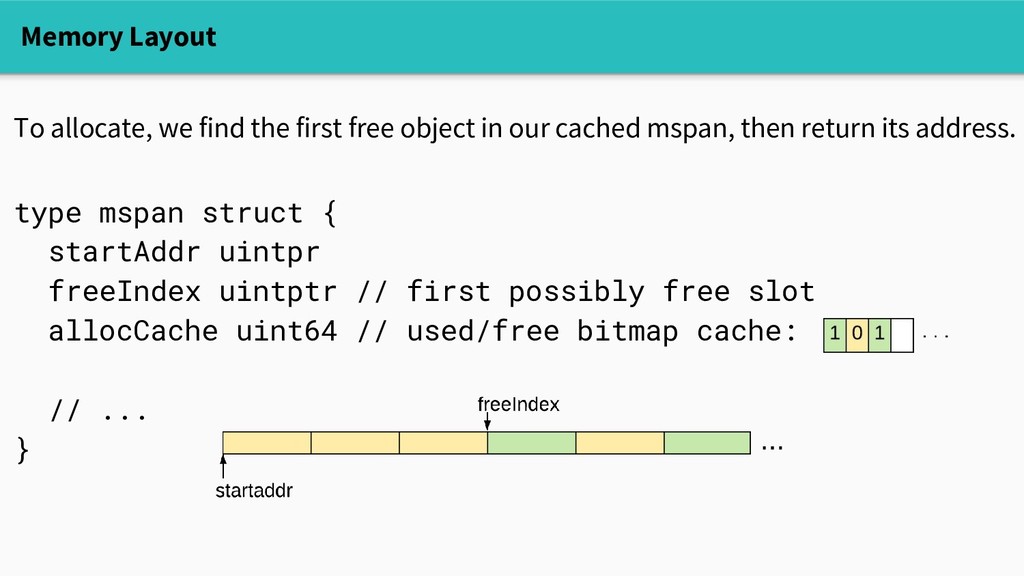
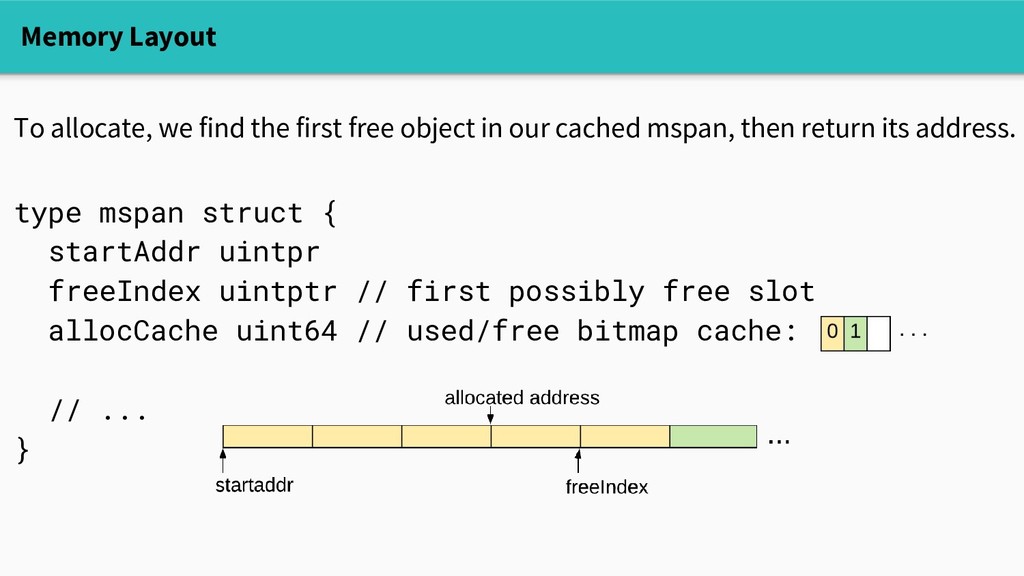
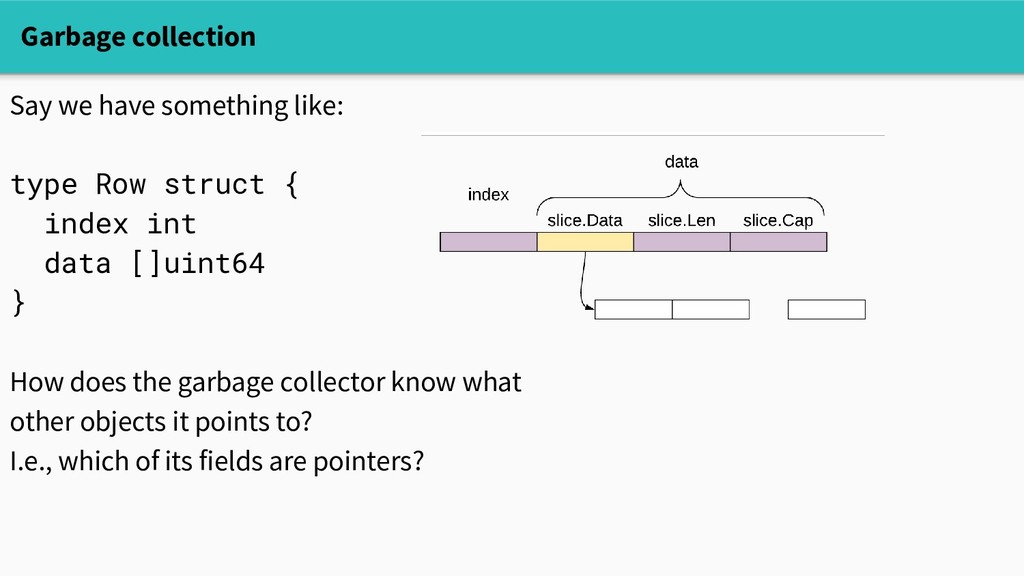
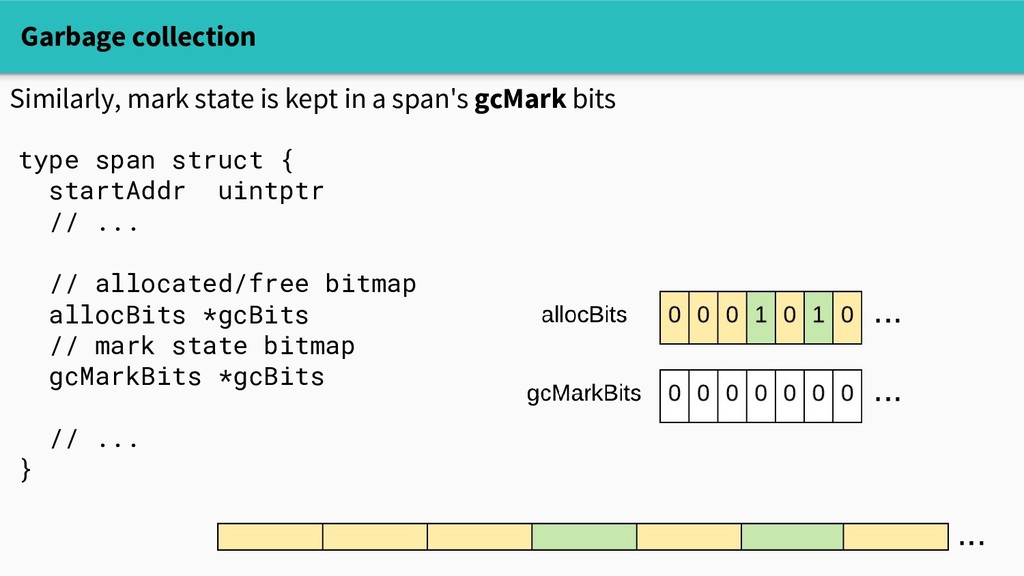
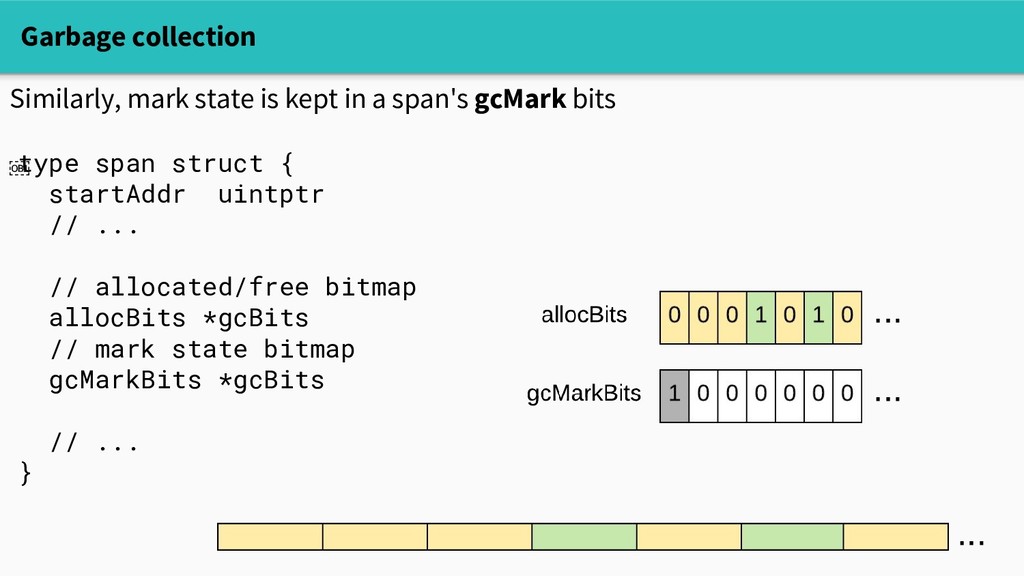
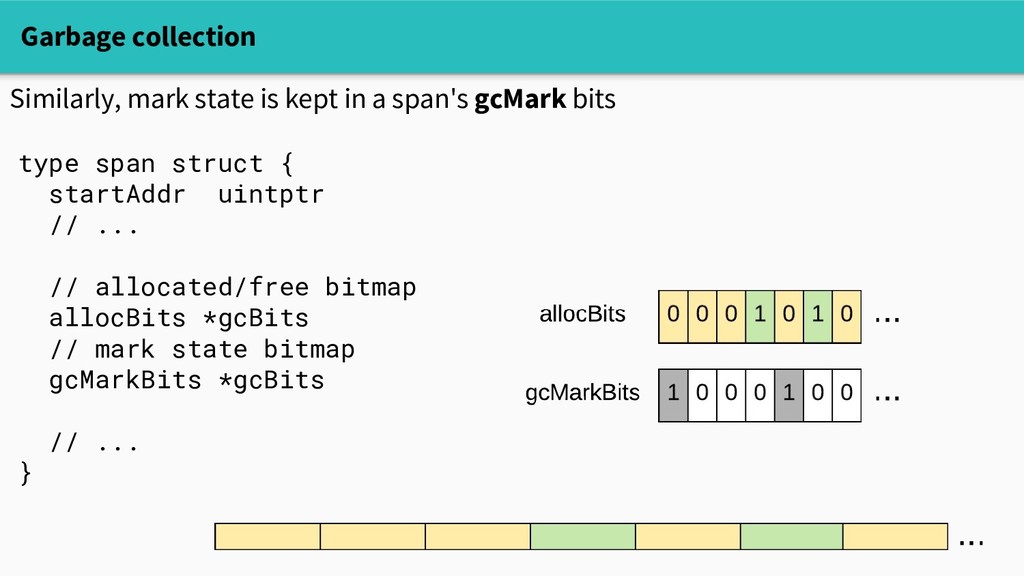
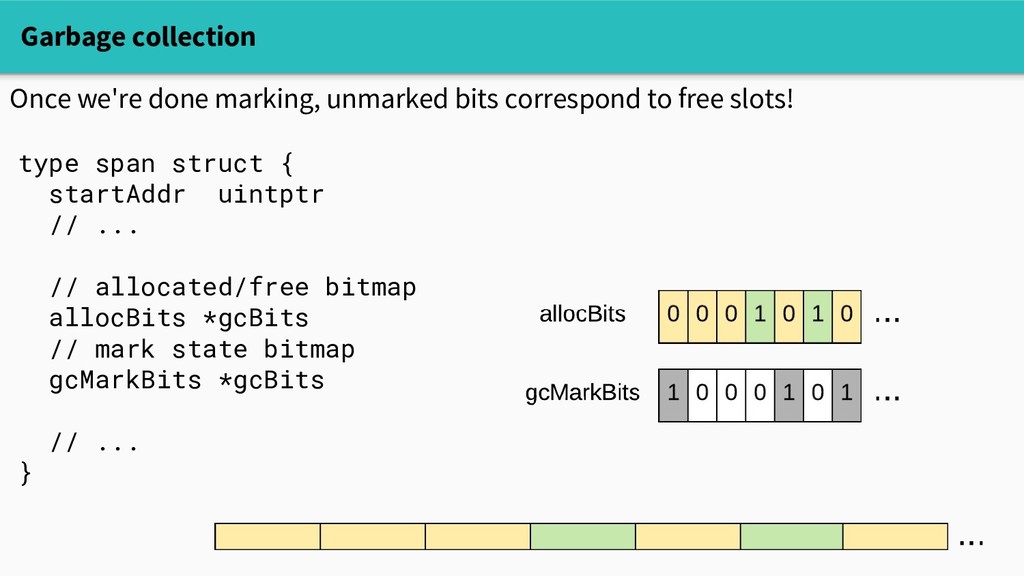
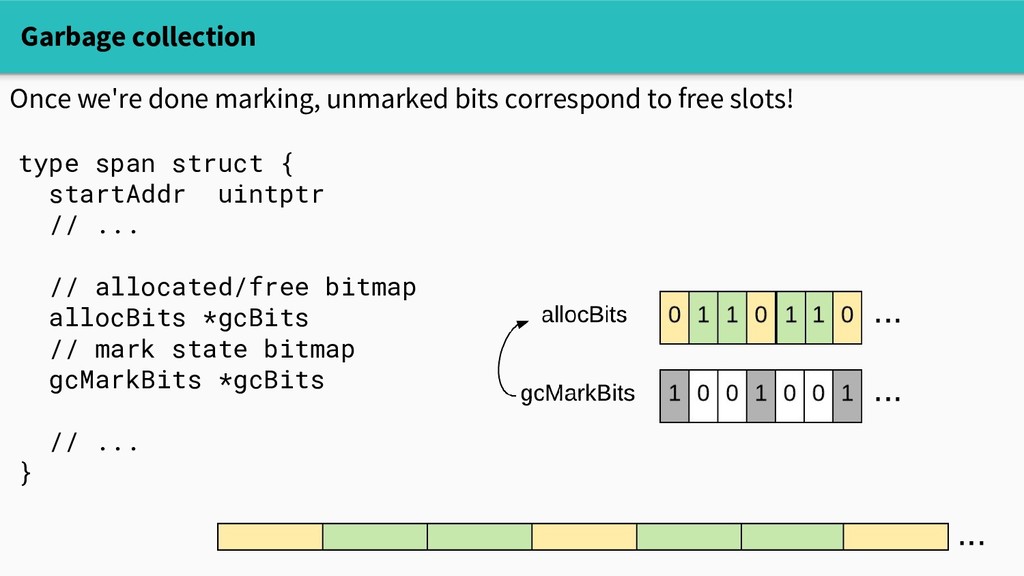
practical, so heap objects live in spans. Small objects (<=32KB) live in spans of a fixed size class. type span struct { startAddr uintptr npages uintptr spanclass spanClass // allocated/free bitmap allocBits *gcBits // ... }
practical, so heap objects live in spans. Small objects (<=32KB) live in spans of a fixed size class. - There are ~70 size classes - Their spans are 8KB-64KB - So we can compactly allocate small objects with at most a few MB overhead
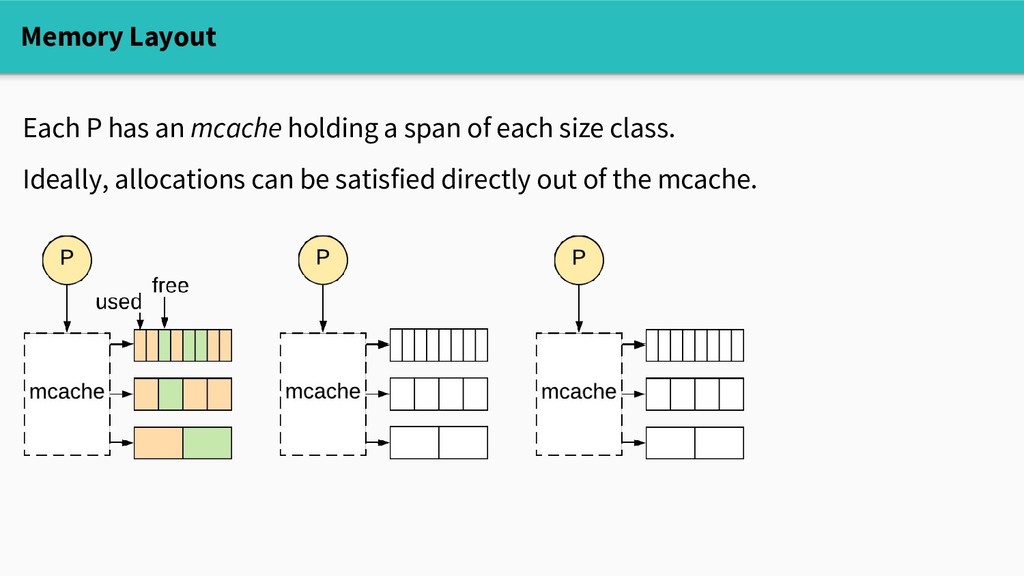
1. Find a cached span with the right size (mcache.mspan[sizeClass]) (if there's none, get a new span, cache it) 2. Find the next free object in the span 3. If necessary, update the heap bitmap (so the garbage collector knows which fields are pointers) and require no locking!
satisfy allocations of a given size, but avoid fragmentation allocate like-sized objects in blocks ✓ Avoid locking in the common case maintain local caches ? Efficiently reclaim free memory
satisfy allocations of a given size, but avoid fragmentation allocate like-sized objects in blocks ✓ Avoid locking in the common case maintain local caches ? Efficiently reclaim free memory What about garbage collection?
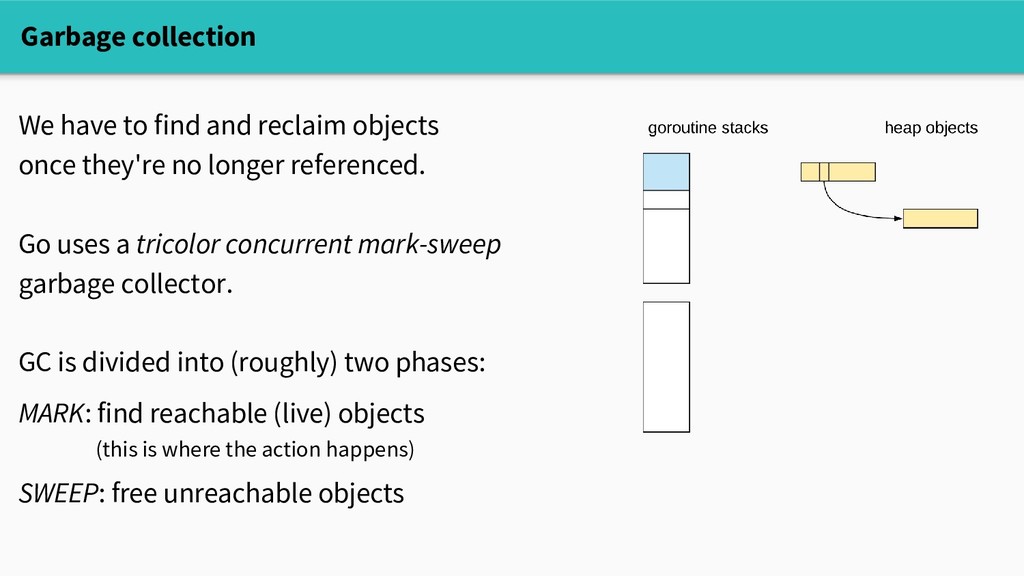
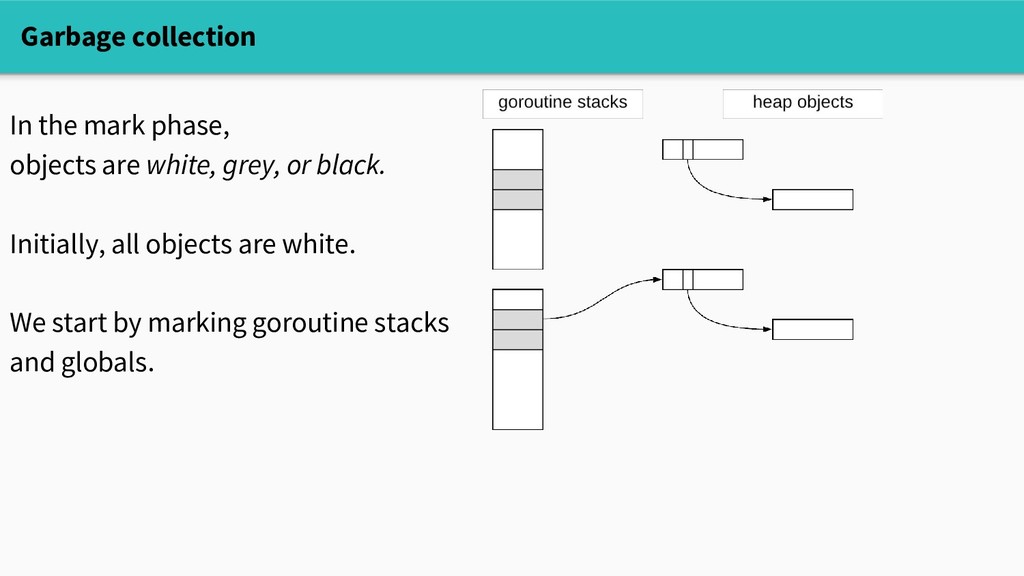
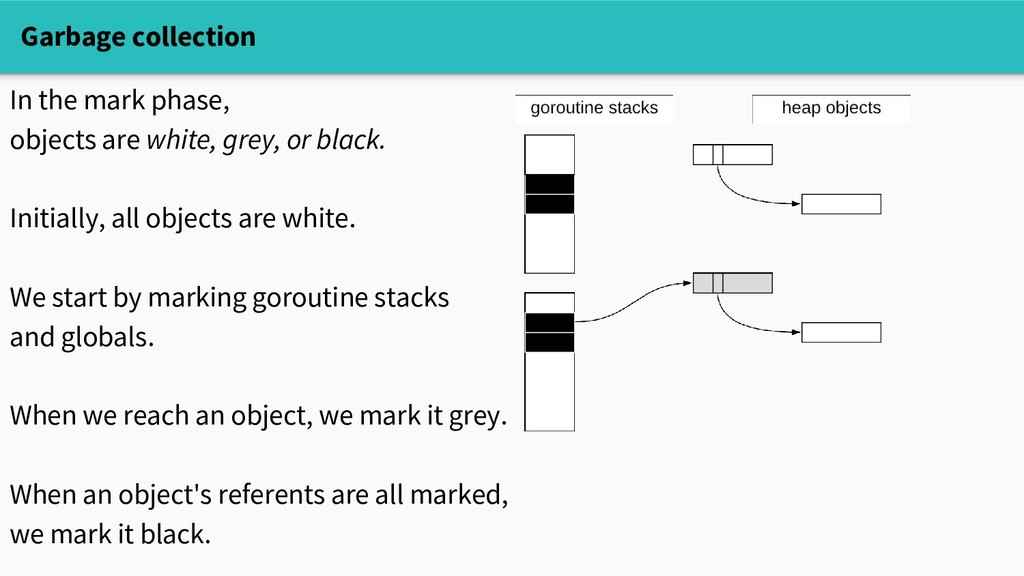
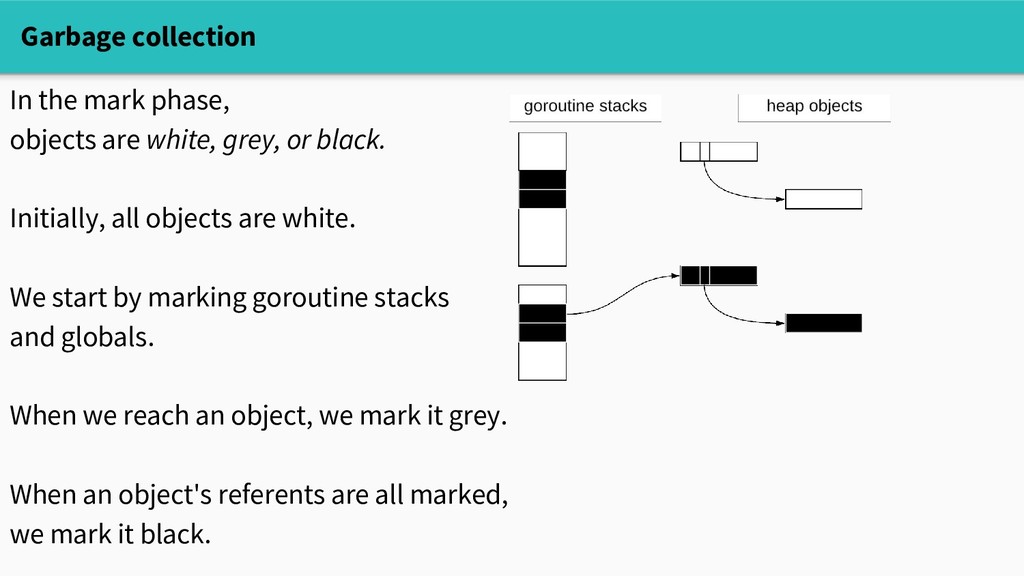
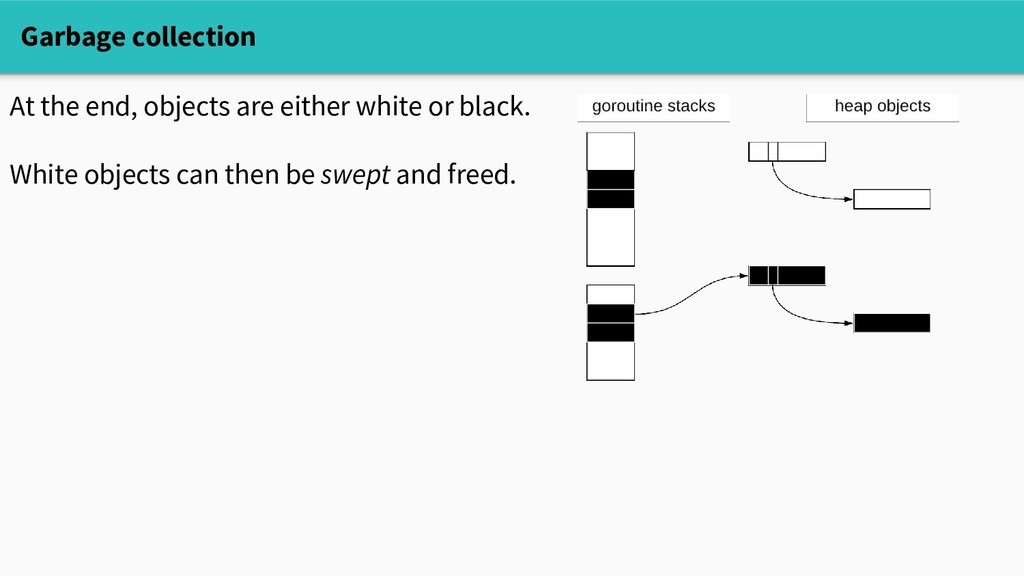
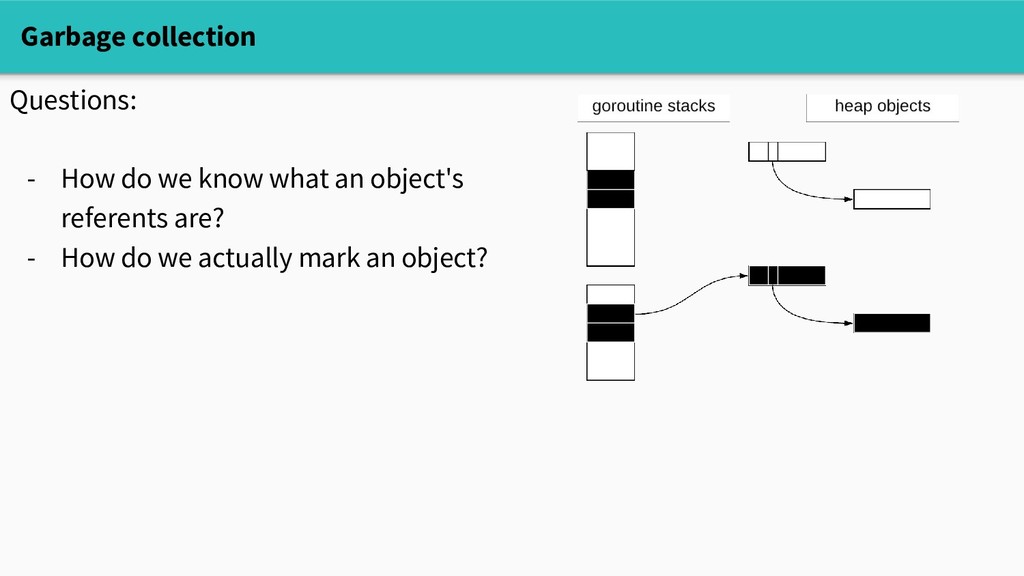
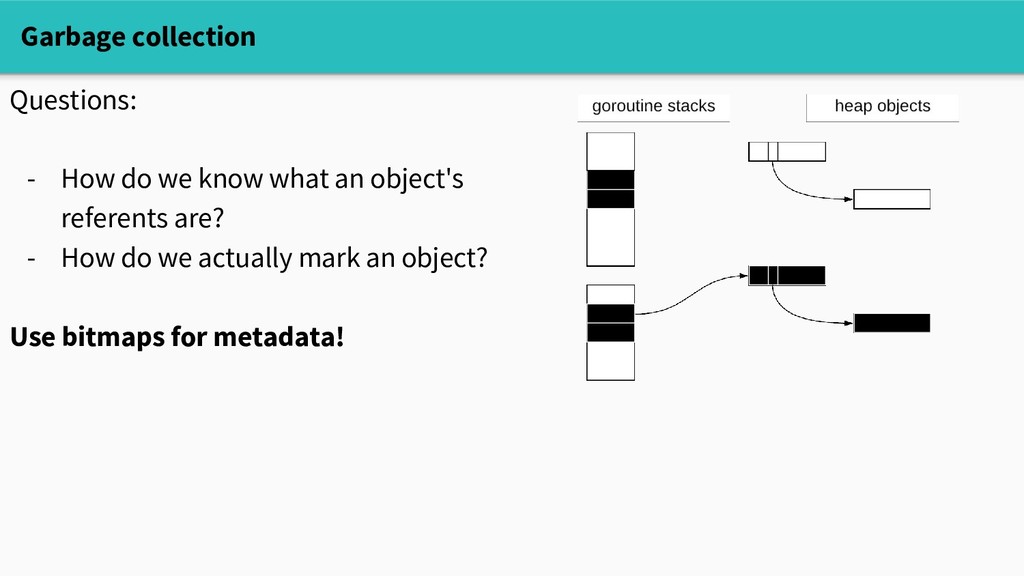
they're no longer referenced. Go uses a tricolor concurrent mark-sweep garbage collector. GC is divided into (roughly) two phases: MARK: find reachable (live) objects (this is where the action happens) SWEEP: free unreachable objects
or black. Initially, all objects are white. We start by marking goroutine stacks and globals. When we reach an object, we mark it grey. When an object's referents are all marked, we mark it black.
or black. Initially, all objects are white. We start by marking goroutine stacks and globals. When we reach an object, we mark it grey. When an object's referents are all marked, we mark it black.
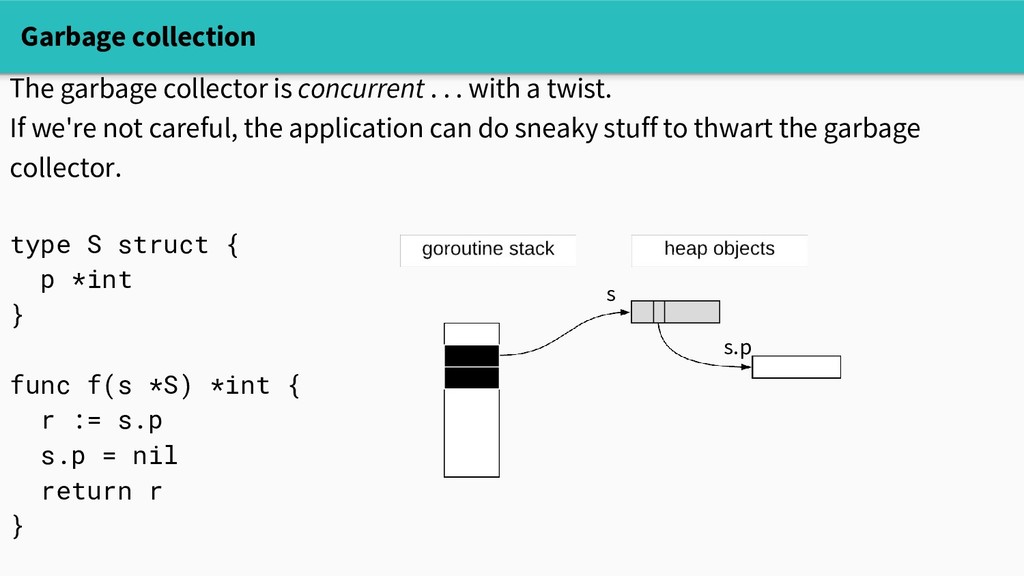
with a twist. If we're not careful, the application can do sneaky stuff to thwart the garbage collector. type S struct { p *int } func f(s *S) *int { r := s.p s.p = nil return r } s s.p
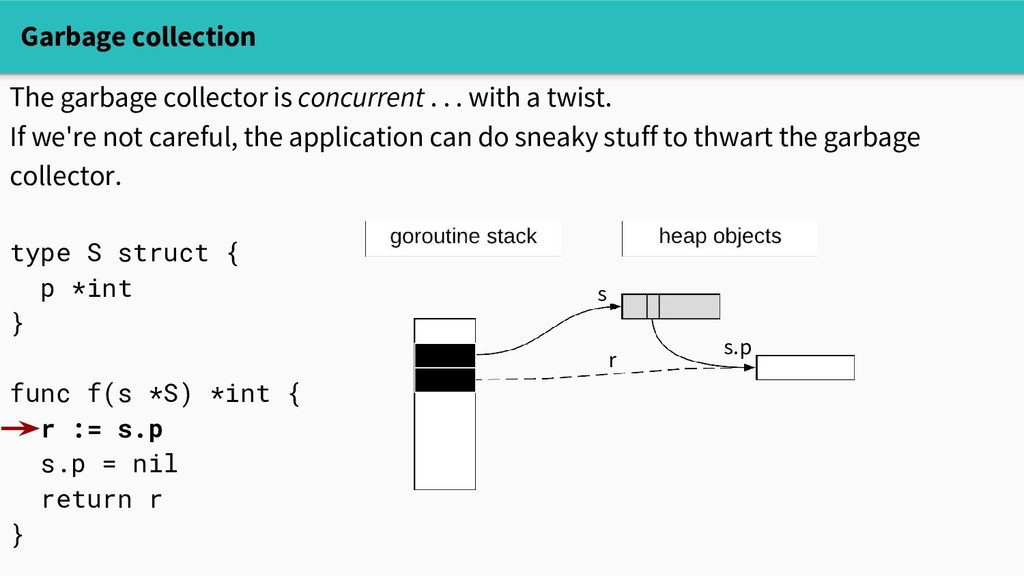
with a twist. If we're not careful, the application can do sneaky stuff to thwart the garbage collector. type S struct { p *int } func f(s *S) *int { r := s.p s.p = nil return r } s s.p r
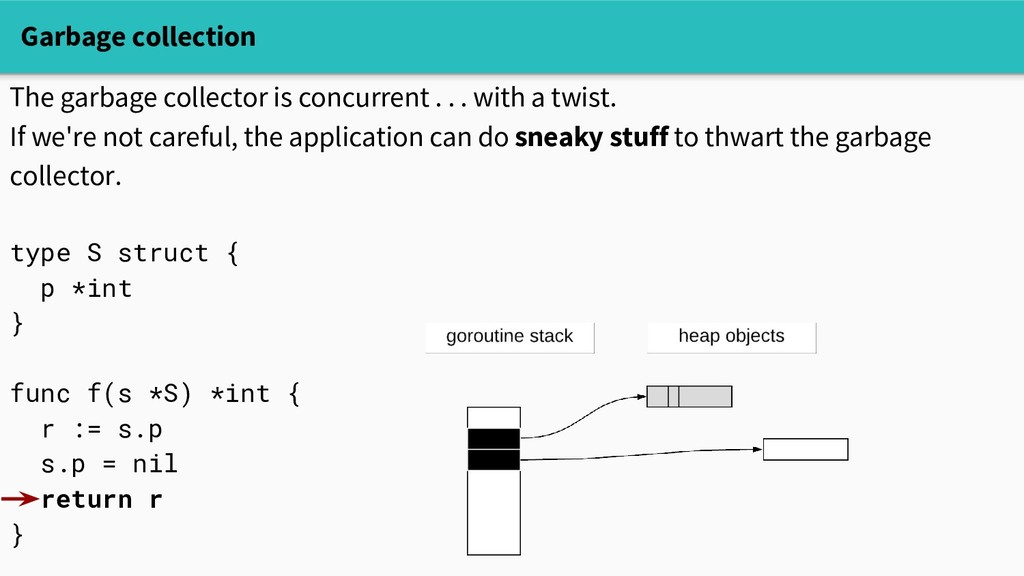
with a twist. If we're not careful, the application can do sneaky stuff to thwart the garbage collector. type S struct { p *int } func f(s *S) *int { r := s.p s.p = nil return r } s r
with a twist. If we're not careful, the application can do sneaky stuff to thwart the garbage collector. type S struct { p *int } func f(s *S) *int { r := s.p s.p = nil return r }
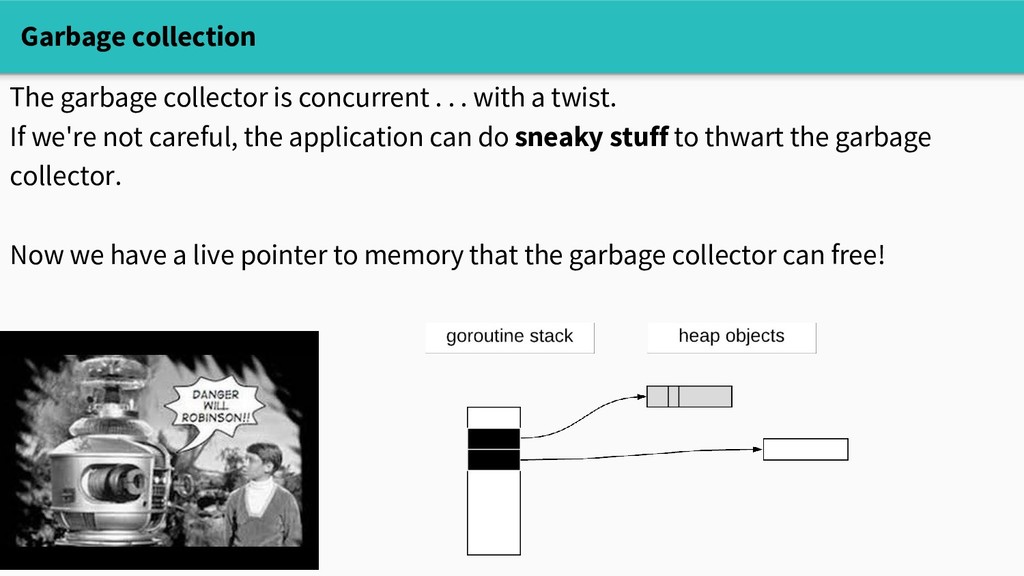
with a twist. If we're not careful, the application can do sneaky stuff to thwart the garbage collector. Now we have a live pointer to memory that the garbage collector can free!
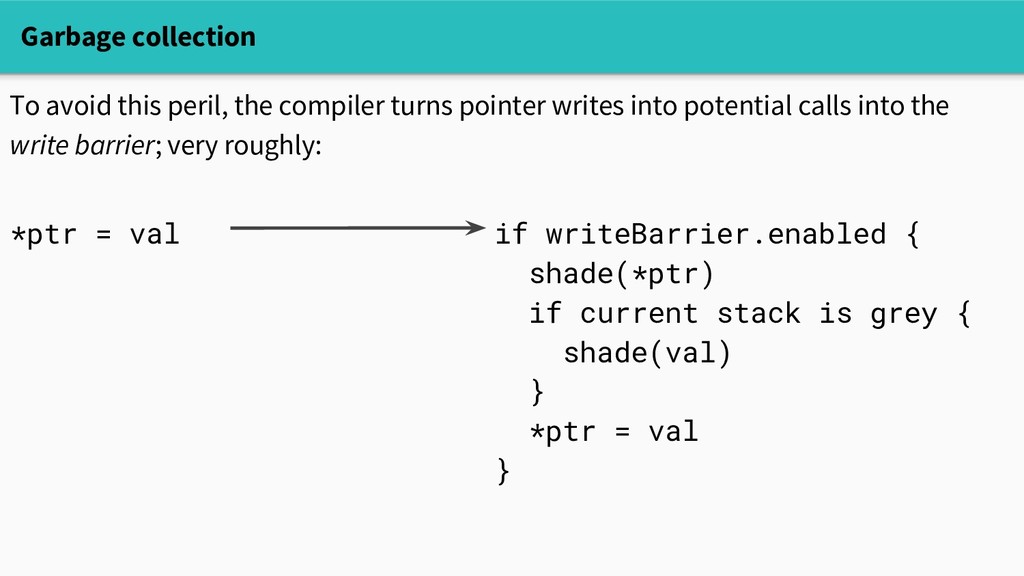
writes into potential calls into the write barrier; very roughly: if writeBarrier.enabled { shade(*ptr) if current stack is grey { shade(val) } *ptr = val } *ptr = val
writes into potential calls into the write barrier; very roughly: if writeBarrier.enabled { shade(*ptr) if current stack is grey { shade(val) } *ptr = val } *ptr = val
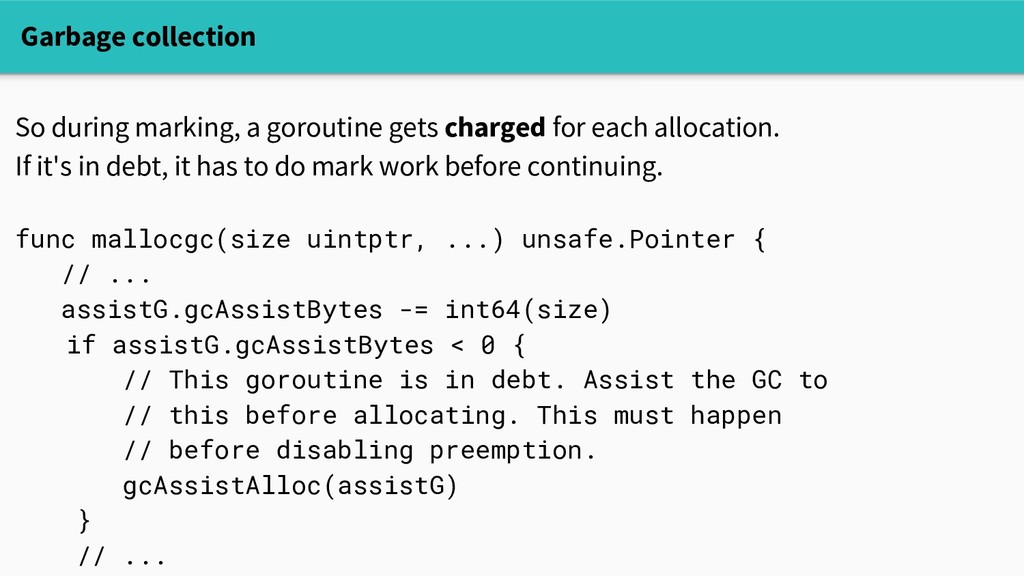
each allocation. If it's in debt, it has to do mark work before continuing. func mallocgc(size uintptr, ...) unsafe.Pointer { // ... assistG.gcAssistBytes -= int64(size) if assistG.gcAssistBytes < 0 { // This goroutine is in debt. Assist the GC to // this before allocating. This must happen // before disabling preemption. gcAssistAlloc(assistG) } // ...
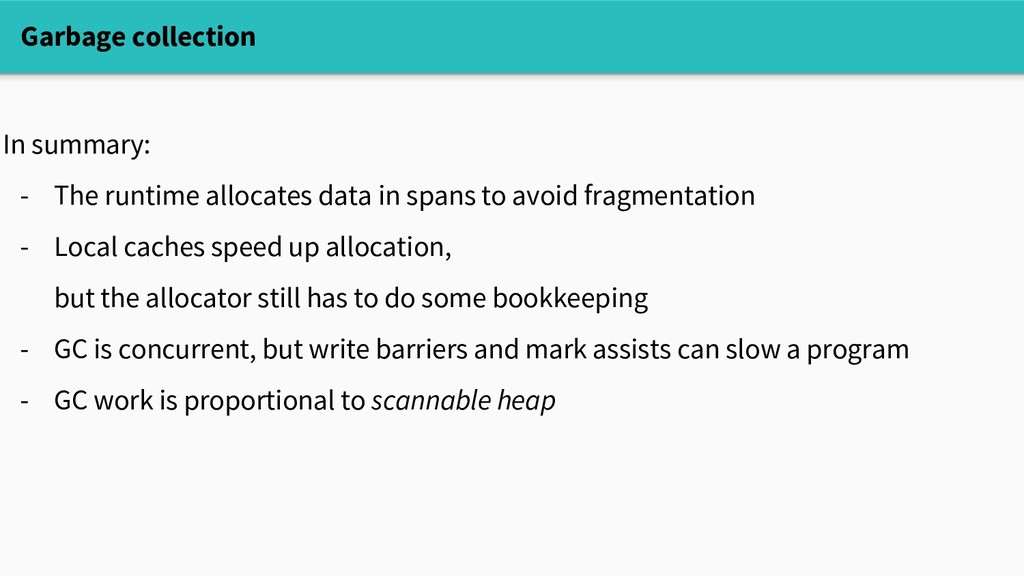
spans to avoid fragmentation - Local caches speed up allocation, but the allocator still has to do some bookkeeping - GC is concurrent, but write barriers and mark assists can slow a program - GC work is proportional to scannable heap
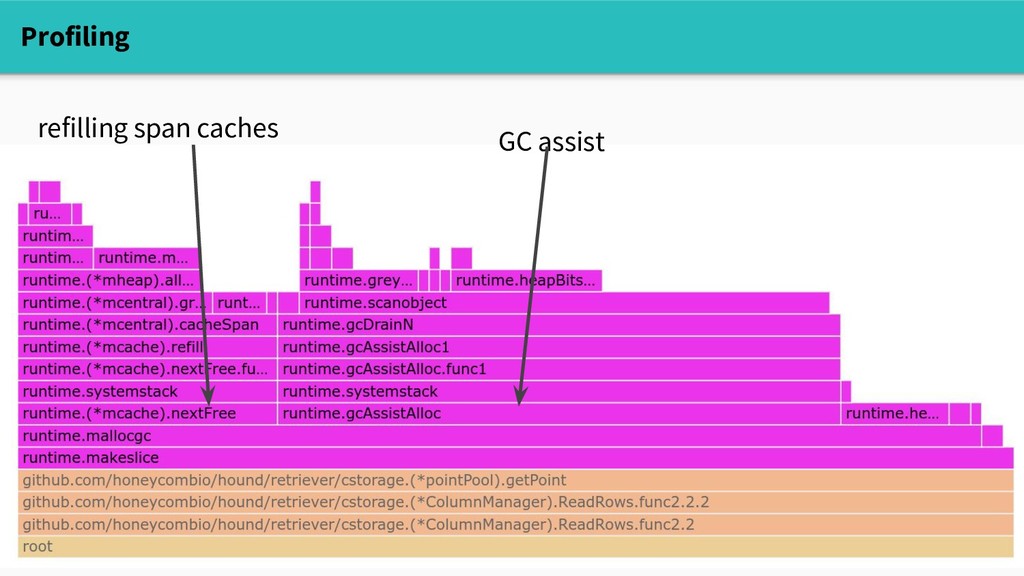
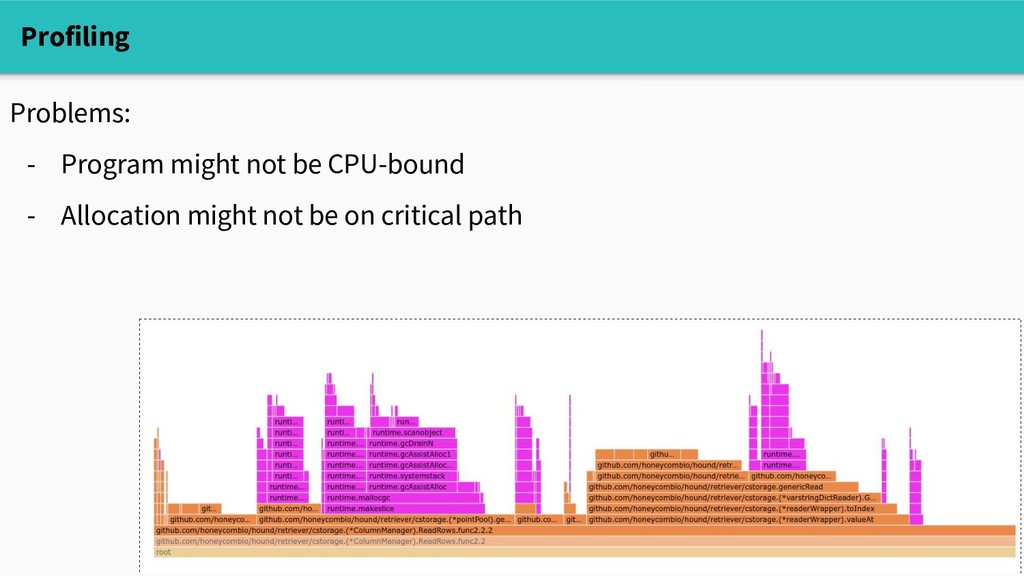
Does this mean that reducing allocations will improve performance? Well, it depends. The builtin memory profiler can tell us where we're allocating, but doesn't answer the causal question "will reducing allocations make a difference?"
Does this mean that reducing allocations will improve performance? Well, it depends. The builtin memory profiler can tell us where we're allocating, but doesn't answer the causal question "will reducing allocations make a difference?" Three tools to start with: - crude experimenting - sampling profiling with pprof - go tool trace
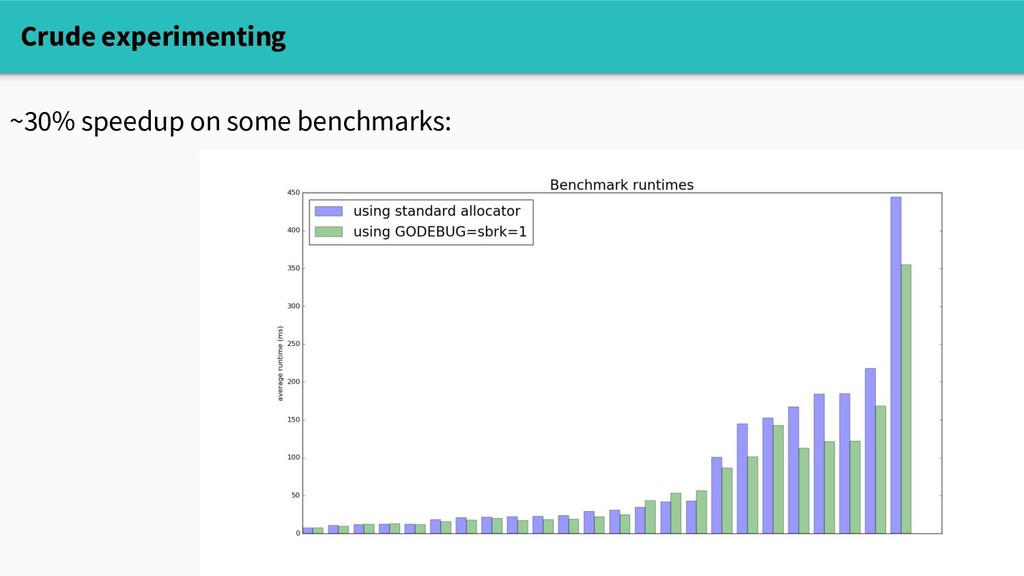
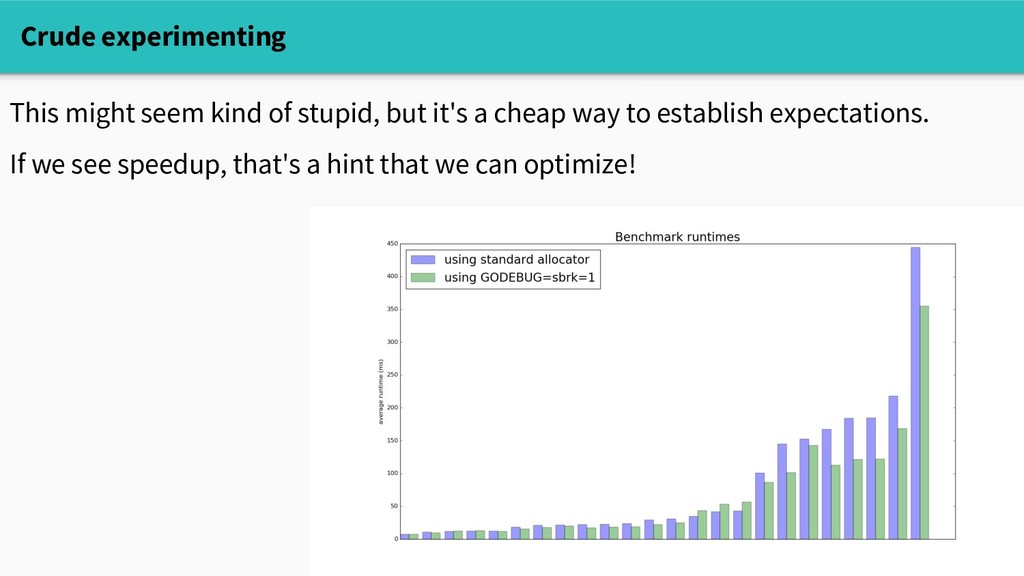
way to establish expectations. If we see speedup, that's a hint that we can optimize! Problems: - not viable in production: need synthetic benchmarks - persistent allocator isn't free either, so this doesn't fully reflect allocation cost Crude experimenting
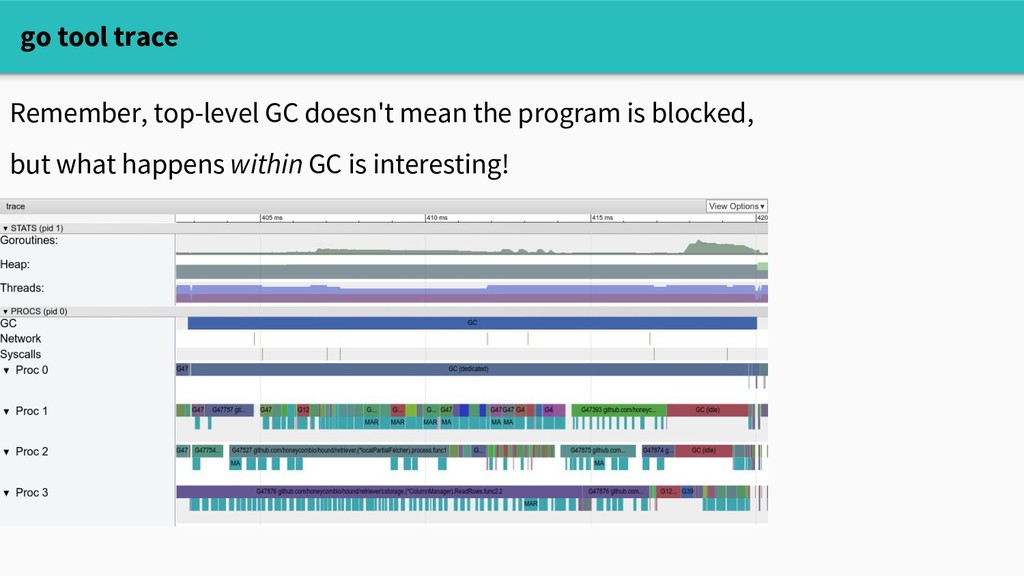
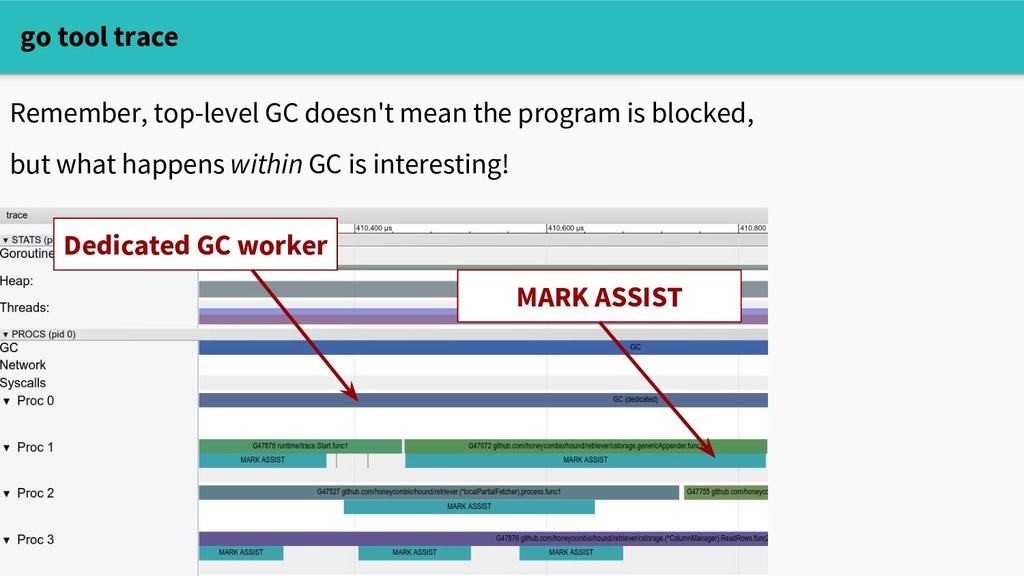
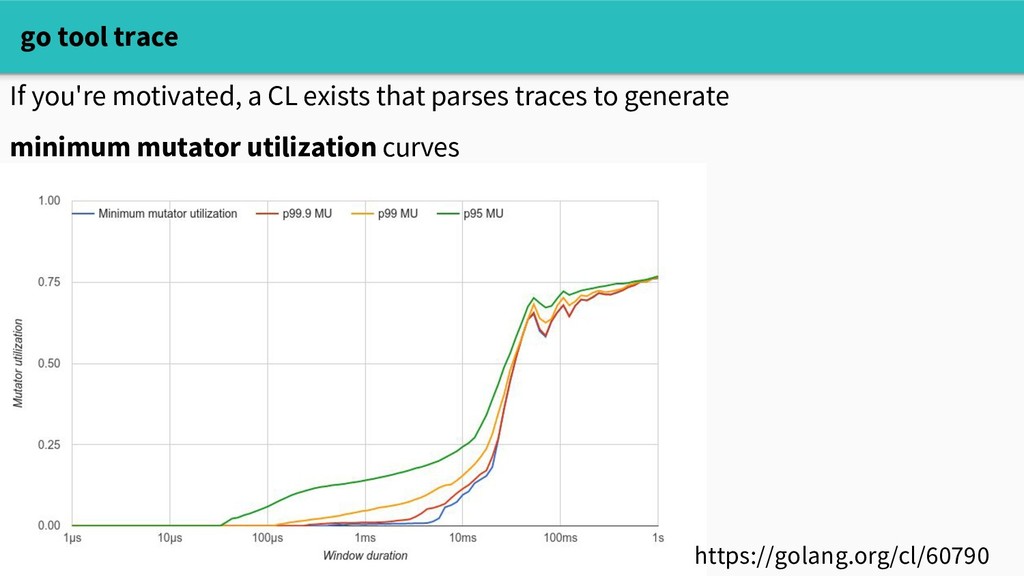
tool at our disposal to understand the impact of allocating. The execution tracer captures very granular runtime events over a short time window: curl localhost:6060/debug/pprof/trace?seconds=5 > trace.out Which you can visualize in a web UI go tool trace trace.out
and execution traces give us a sense of: - whether allocation / GC are affecting performance - which call sites are spending a lot of time allocating - how throughput changes during GC.
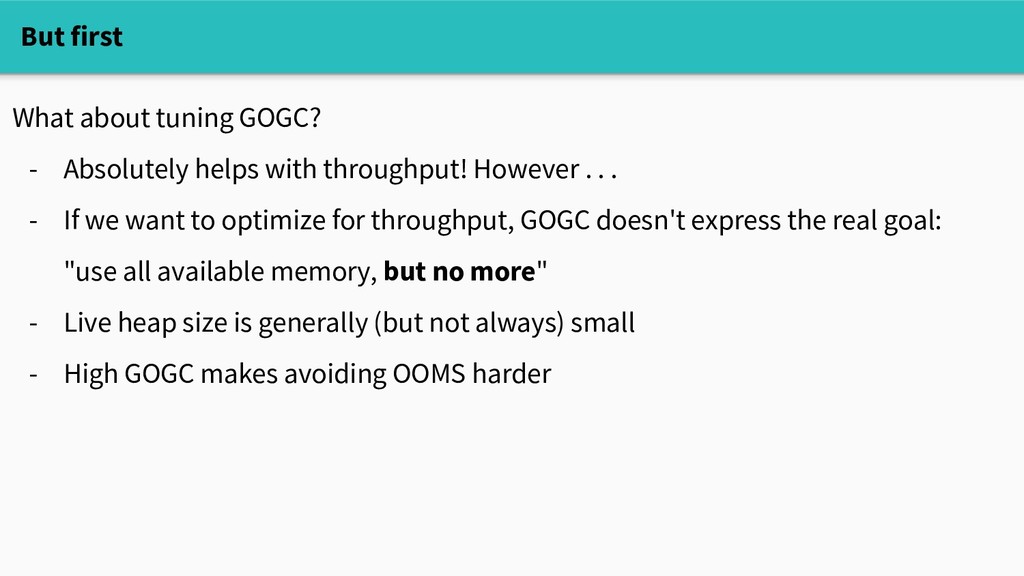
. . . - If we want to optimize for throughput, GOGC doesn't express the real goal: "use all available memory, but no more" - Live heap size is generally (but not always) small - High GOGC makes avoiding OOMS harder But first
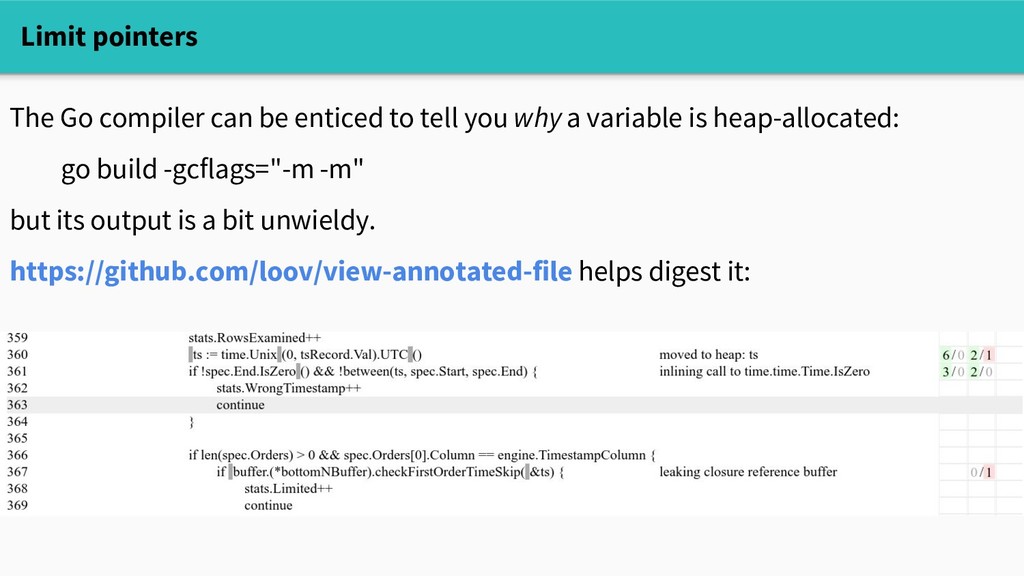
you why a variable is heap-allocated: go build -gcflags="-m -m" but its output is a bit unwieldy. https://github.com/loov/view-annotated-file helps digest it:
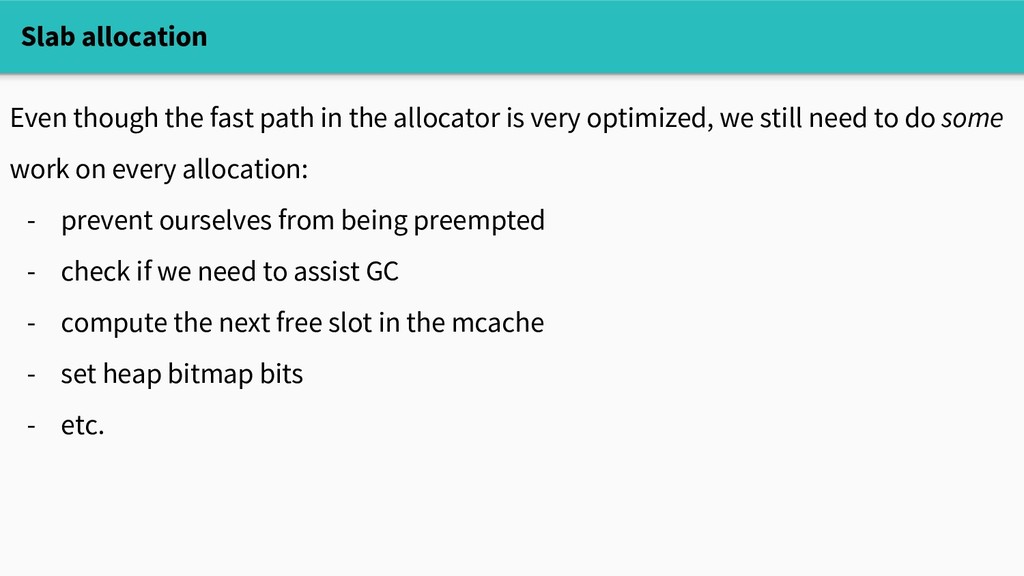
is very optimized, we still need to do some work on every allocation: - prevent ourselves from being preempted - check if we need to assist GC - compute the next free slot in the mcache - set heap bitmap bits - etc.
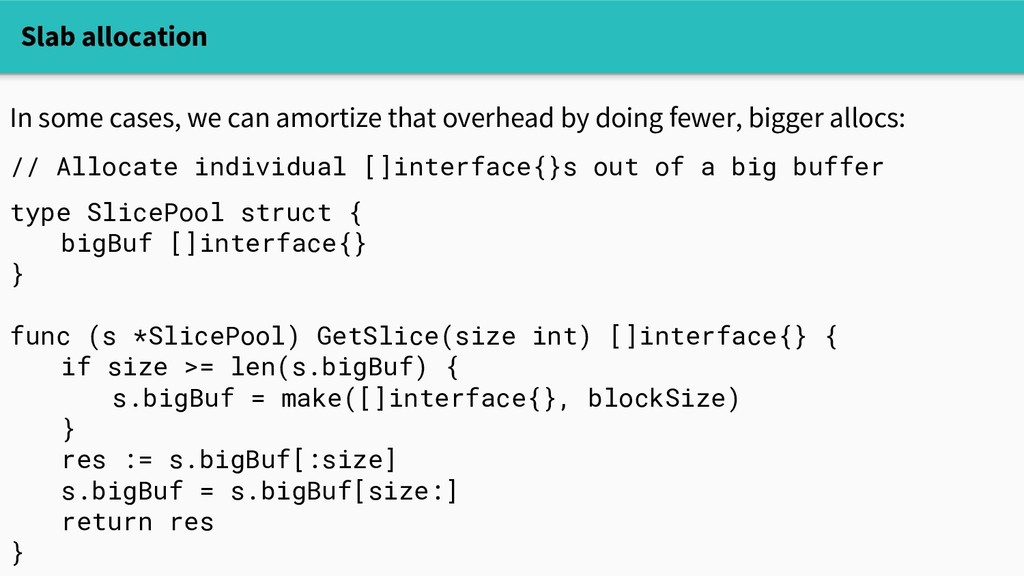
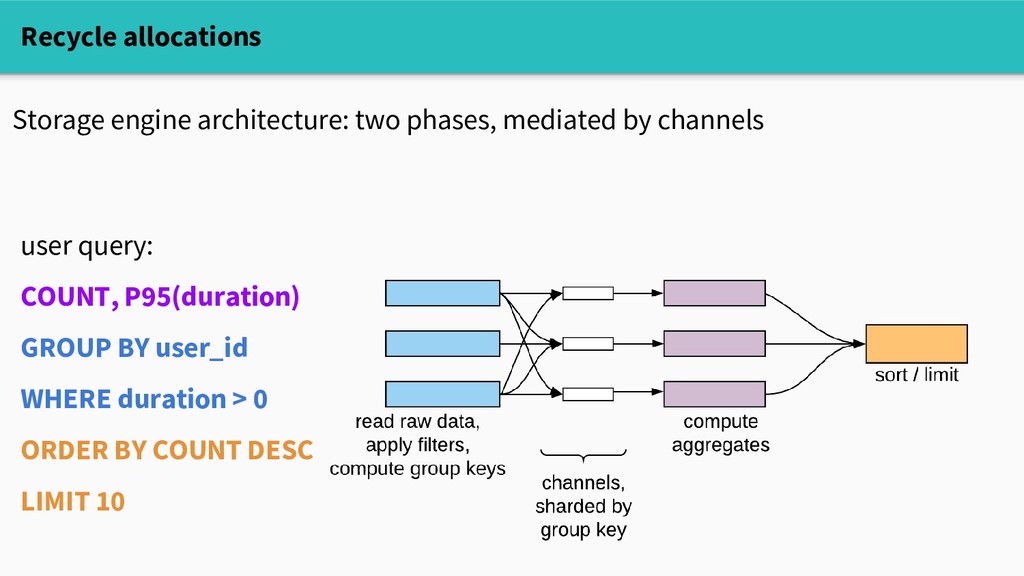
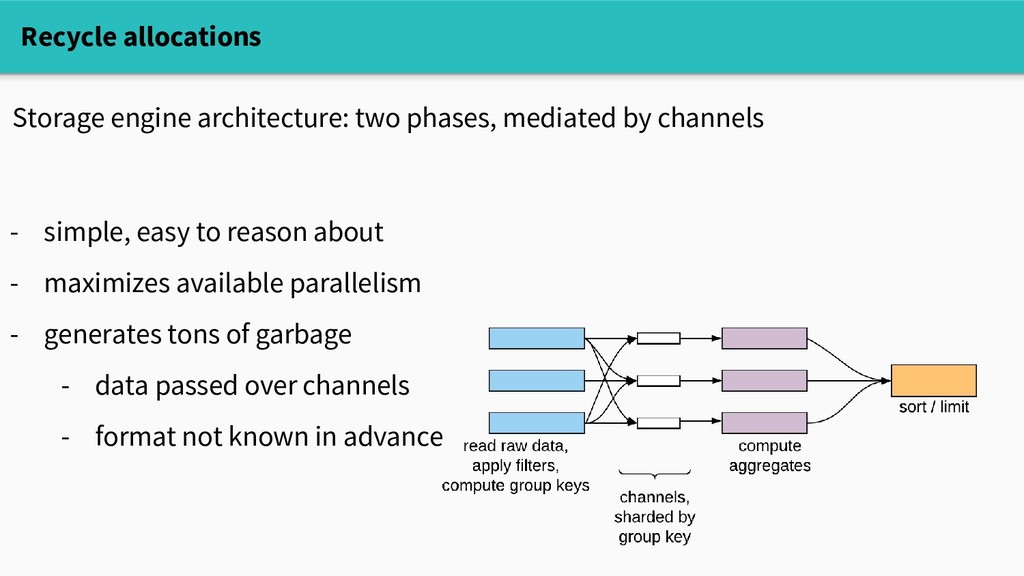
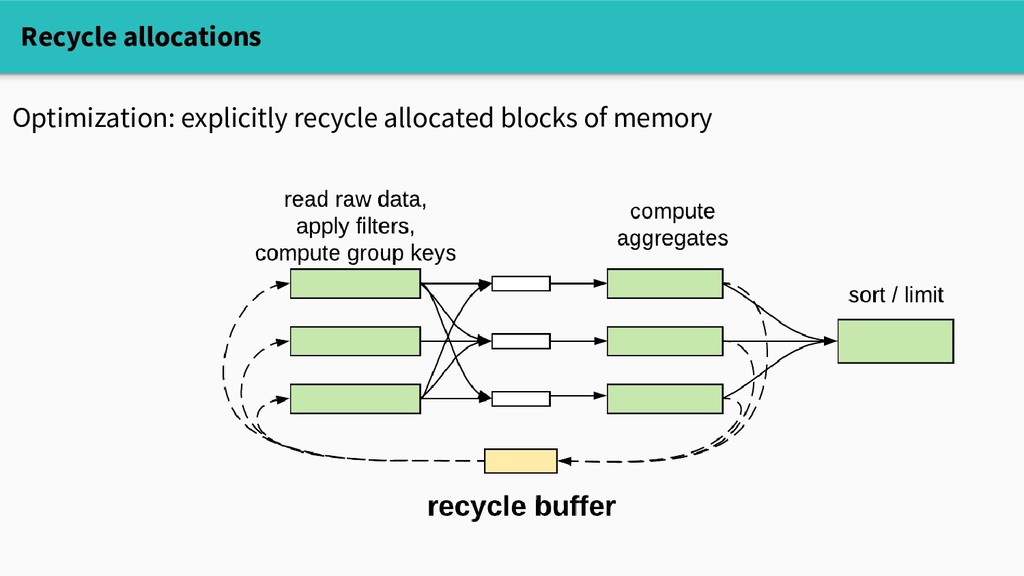
by doing fewer, bigger allocs: // Allocate individual []interface{}s out of a big buffer type SlicePool struct { bigBuf []interface{} } func (s *SlicePool) GetSlice(size int) []interface{} { if size >= len(s.bigBuf) { s.bigBuf = make([]interface{}, blockSize) } res := s.bigBuf[:size] s.bigBuf = s.bigBuf[size:] return res }
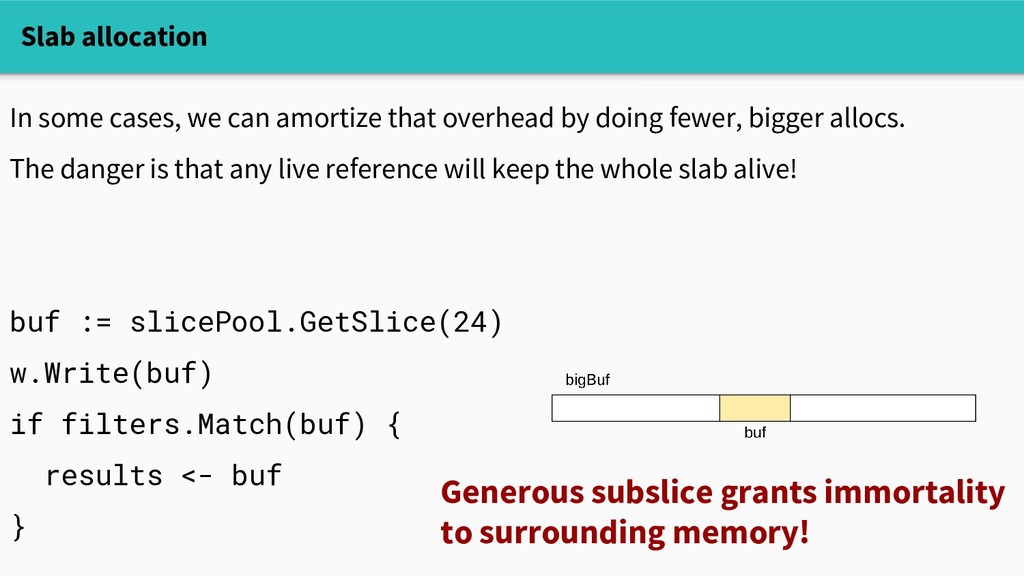
by doing fewer, bigger allocs. The danger is that any live reference will keep the whole slab alive! buf := slicePool.GetSlice(24) w.Write(buf) if filters.Match(buf) { results <- buf } Generous subslice grants immortality to surrounding memory!
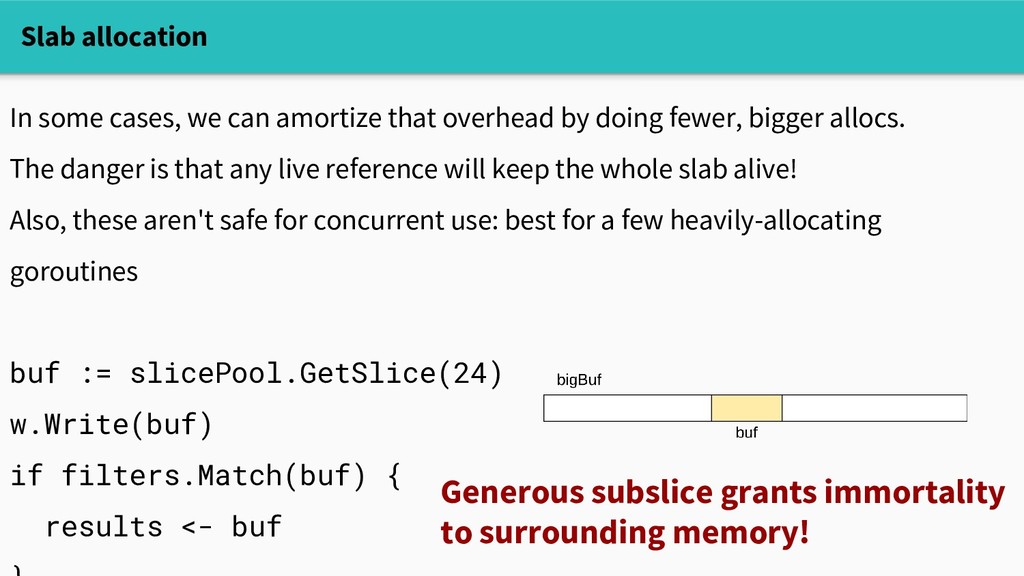
by doing fewer, bigger allocs. The danger is that any live reference will keep the whole slab alive! Also, these aren't safe for concurrent use: best for a few heavily-allocating goroutines buf := slicePool.GetSlice(24) w.Write(buf) if filters.Match(buf) { results <- buf Generous subslice grants immortality to surrounding memory!
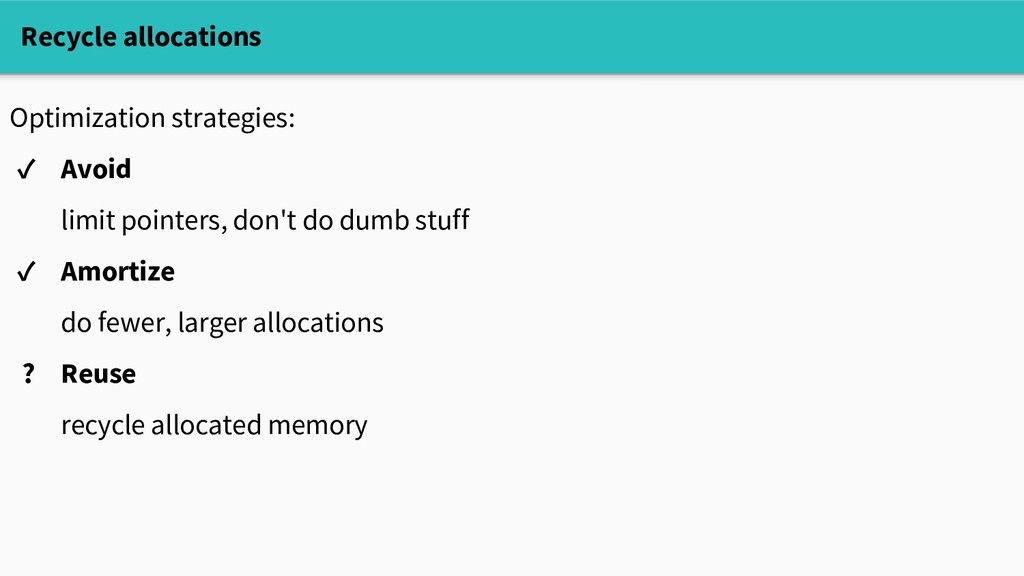
objects, sharded by CPU (with runtime support) - allows lock-free get/put in the fast path - caveat: cleared on every GC Danger: - must be very careful to zero or overwrite recycled memory Recycle allocations
ingenious! - Single allocations are fast but not free - The garbage collector can stop individual goroutines, even without STW - GC work depends on pointer density - Bring your toolbox: - benchmark with GC off - use CPU profiler to find hot allocations - use execution tracer to understand GC pattern - use escape analyzer to understand why allocations happen
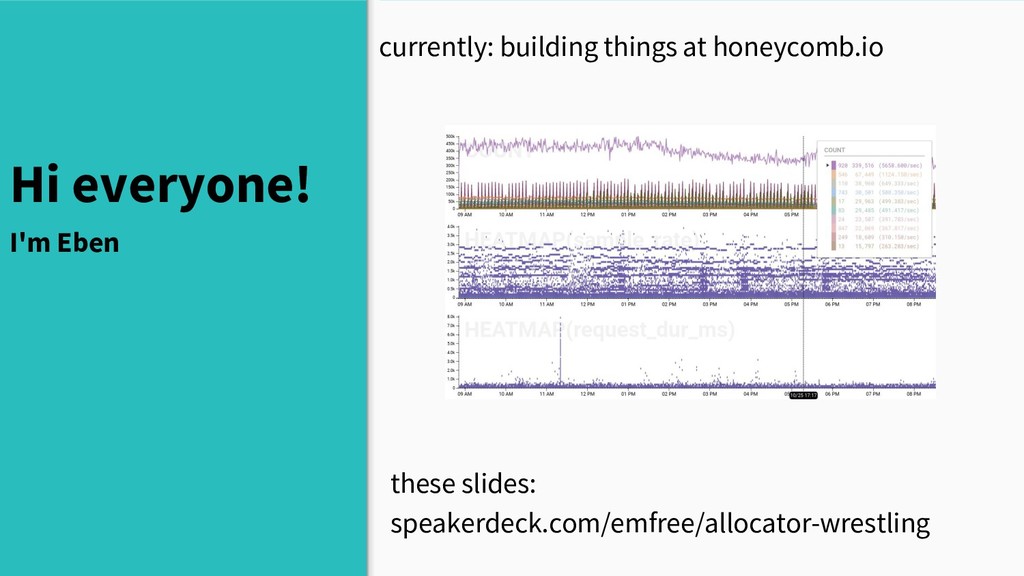
at Honeycomb: the true masterminds Suggested further reading: Allocation efficiency in high-performance Go services Achille Roussel / Rick Branson segment.com/blog/allocation-efficiency-in-high- performance-go-services/ Go 1.5 concurrent garbage collector pacing Austin Clements golang.org/s/go15gcpacing So You Wanna Go Fast Tyler Treat bravenewgeek.com/so-you-wanna-go-fast/ @_emfree_
low-latency garbage collection is essential for many use cases: chat, streaming, lockservers, low-latency high-fanout services, etc. - For throughput-oriented use cases, Go's pauseless garbage collector may not be theoretically optimal. (But it might not be an existential burden either.) A Caveat