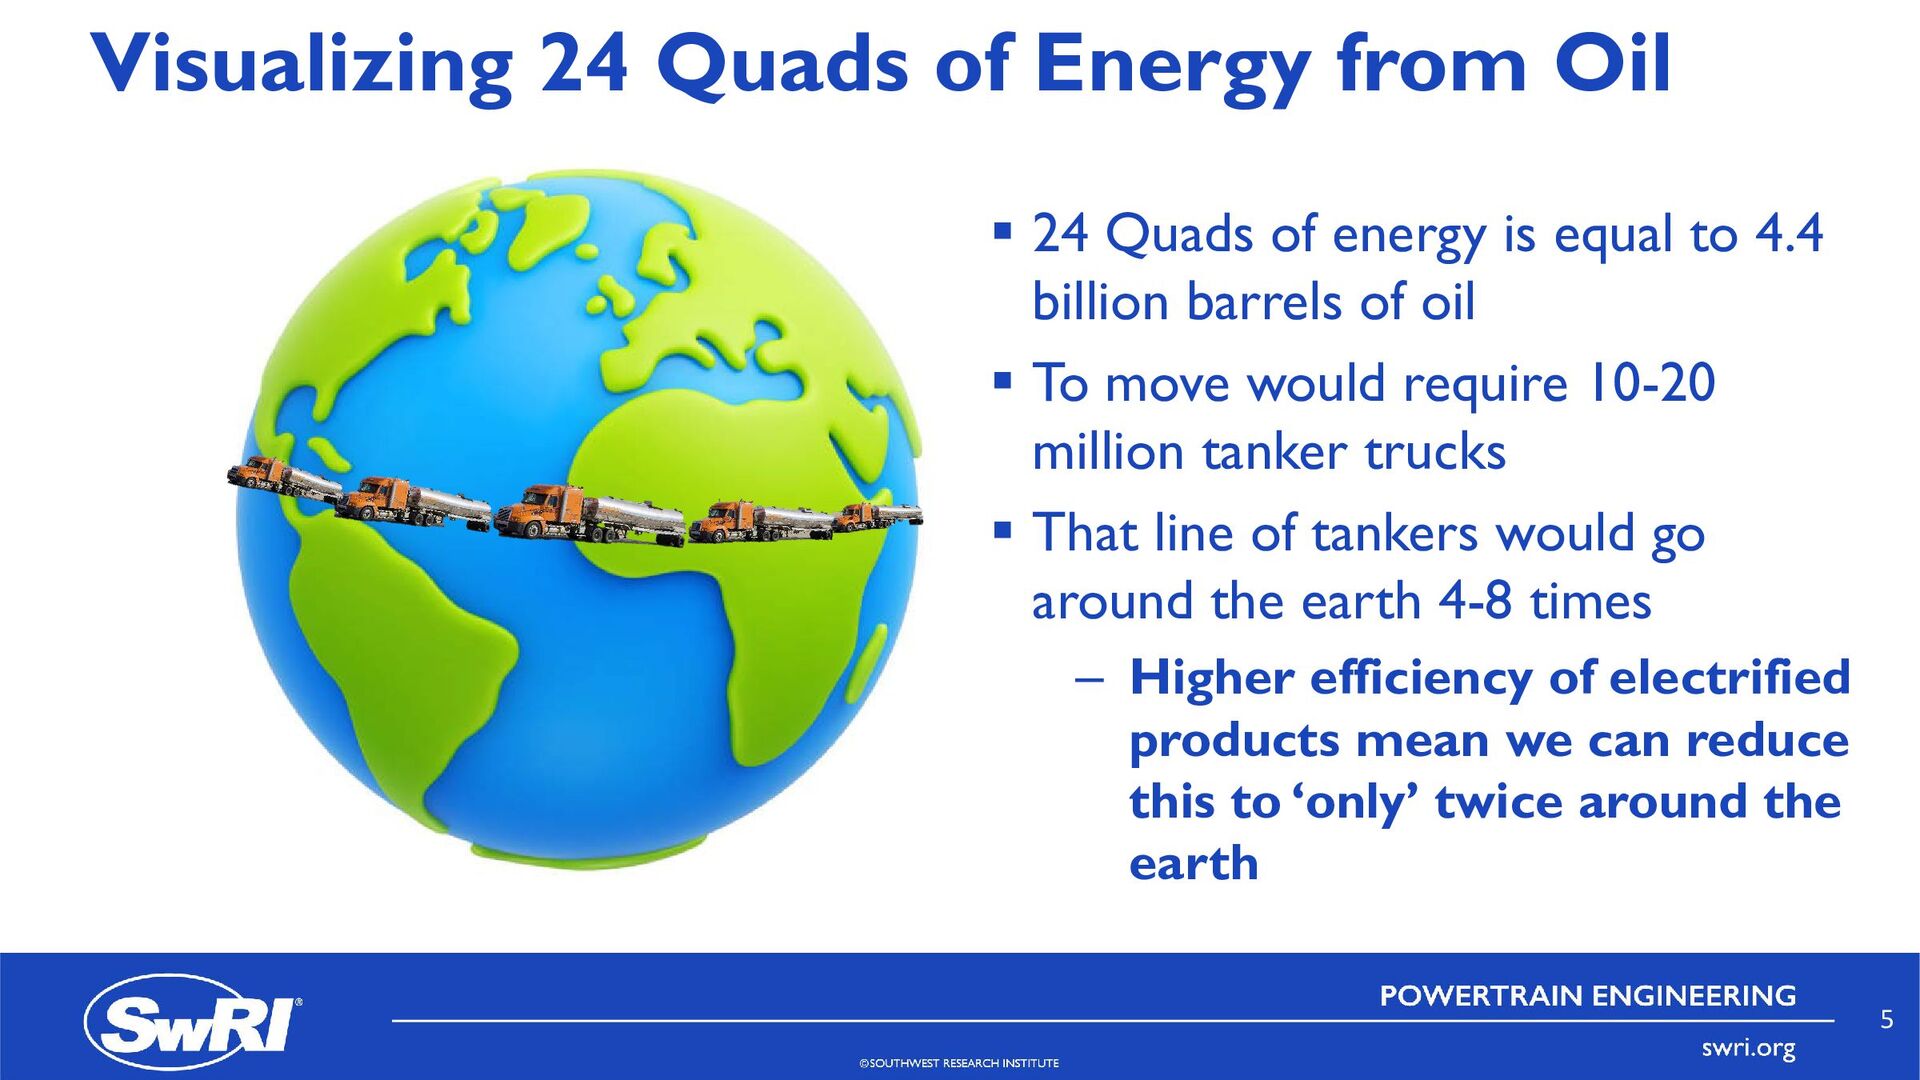
of energy is equal to 4.4 billion barrels of oil To move would require 10-20 million tanker trucks That line of tankers would go around the earth 4-8 times – Higher efficiency of electrified products mean we can reduce this to ‘only’ twice around the earth 5
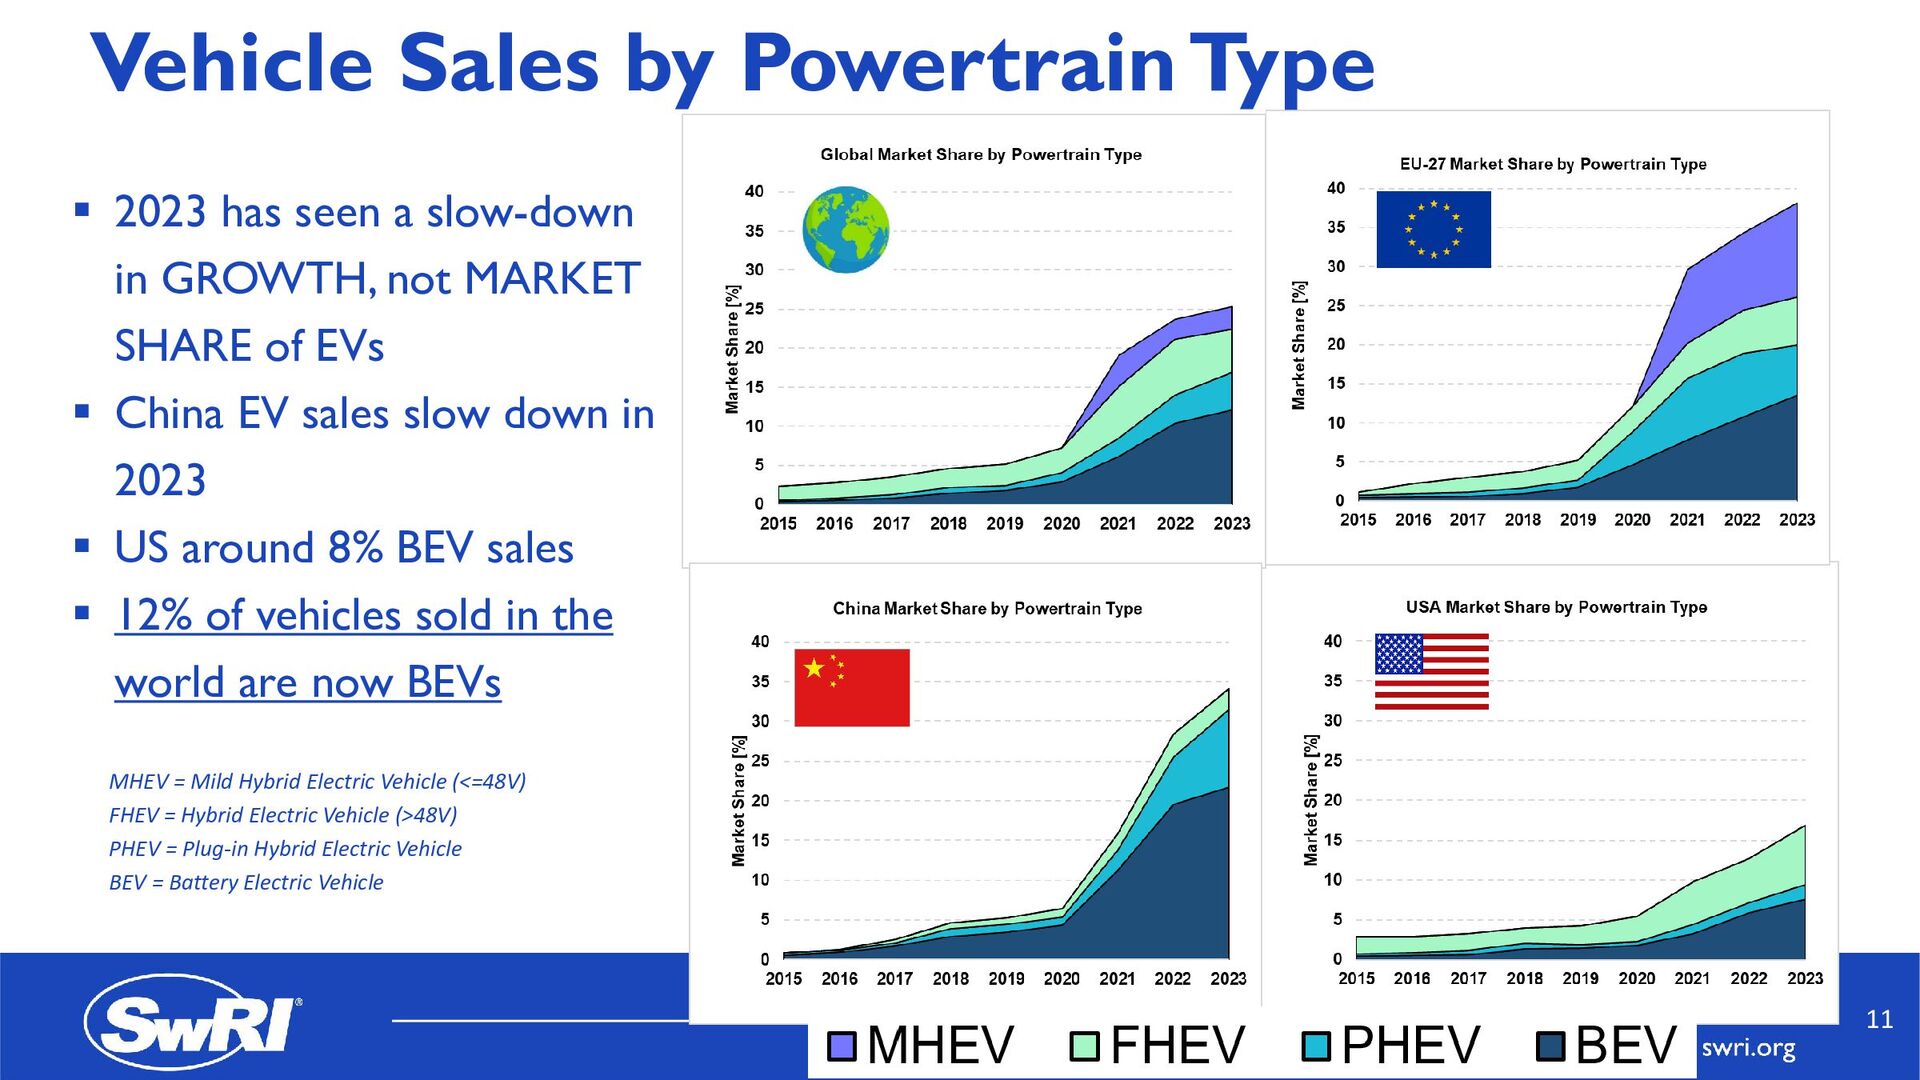
slow-down in GROWTH, not MARKET SHARE of EVs China EV sales slow down in 2023 US around 8% BEV sales 12% of vehicles sold in the world are now BEVs MHEV = Mild Hybrid Electric Vehicle (<=48V) FHEV = Hybrid Electric Vehicle (>48V) PHEV = Plug-in Hybrid Electric Vehicle BEV = Battery Electric Vehicle 11
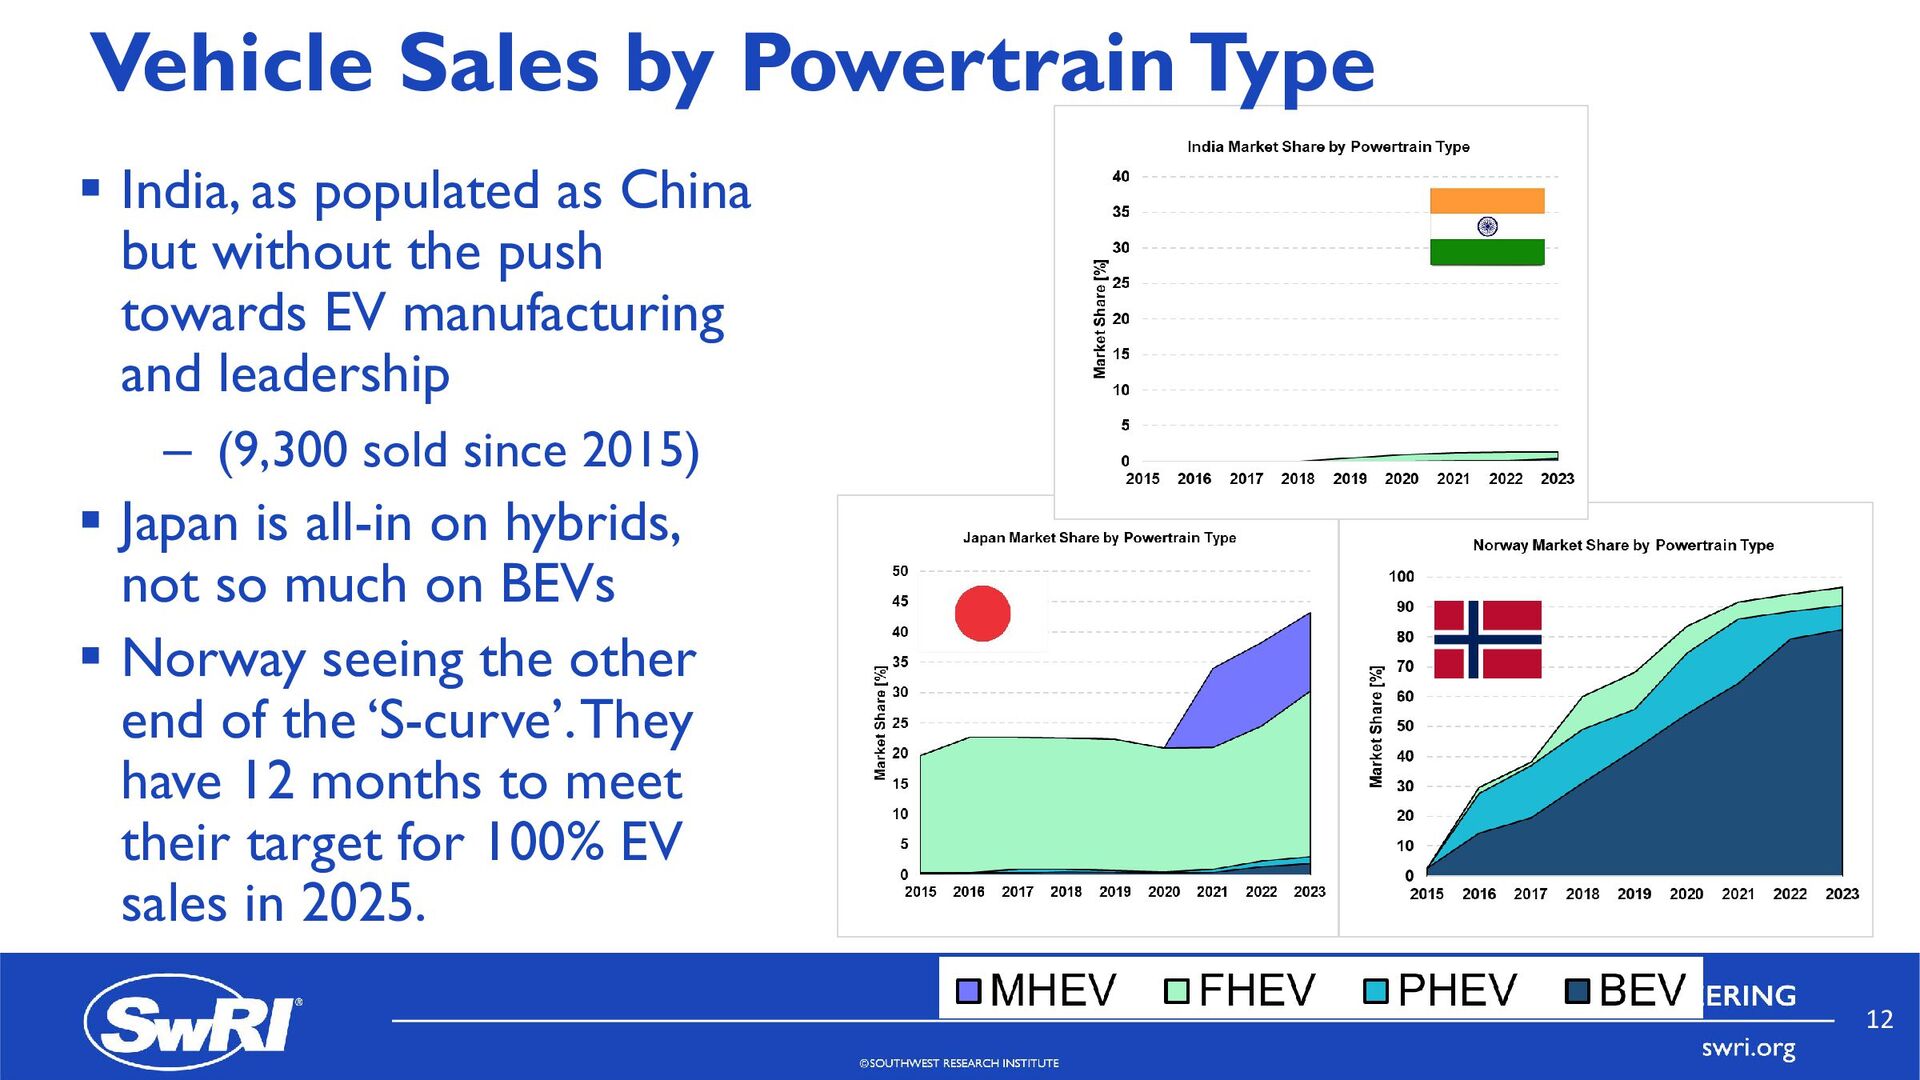
China but without the push towards EV manufacturing and leadership – (9,300 sold since 2015) Japan is all-in on hybrids, not so much on BEVs Norway seeing the other end of the ‘S-curve’. They have 12 months to meet their target for 100% EV sales in 2025. 12
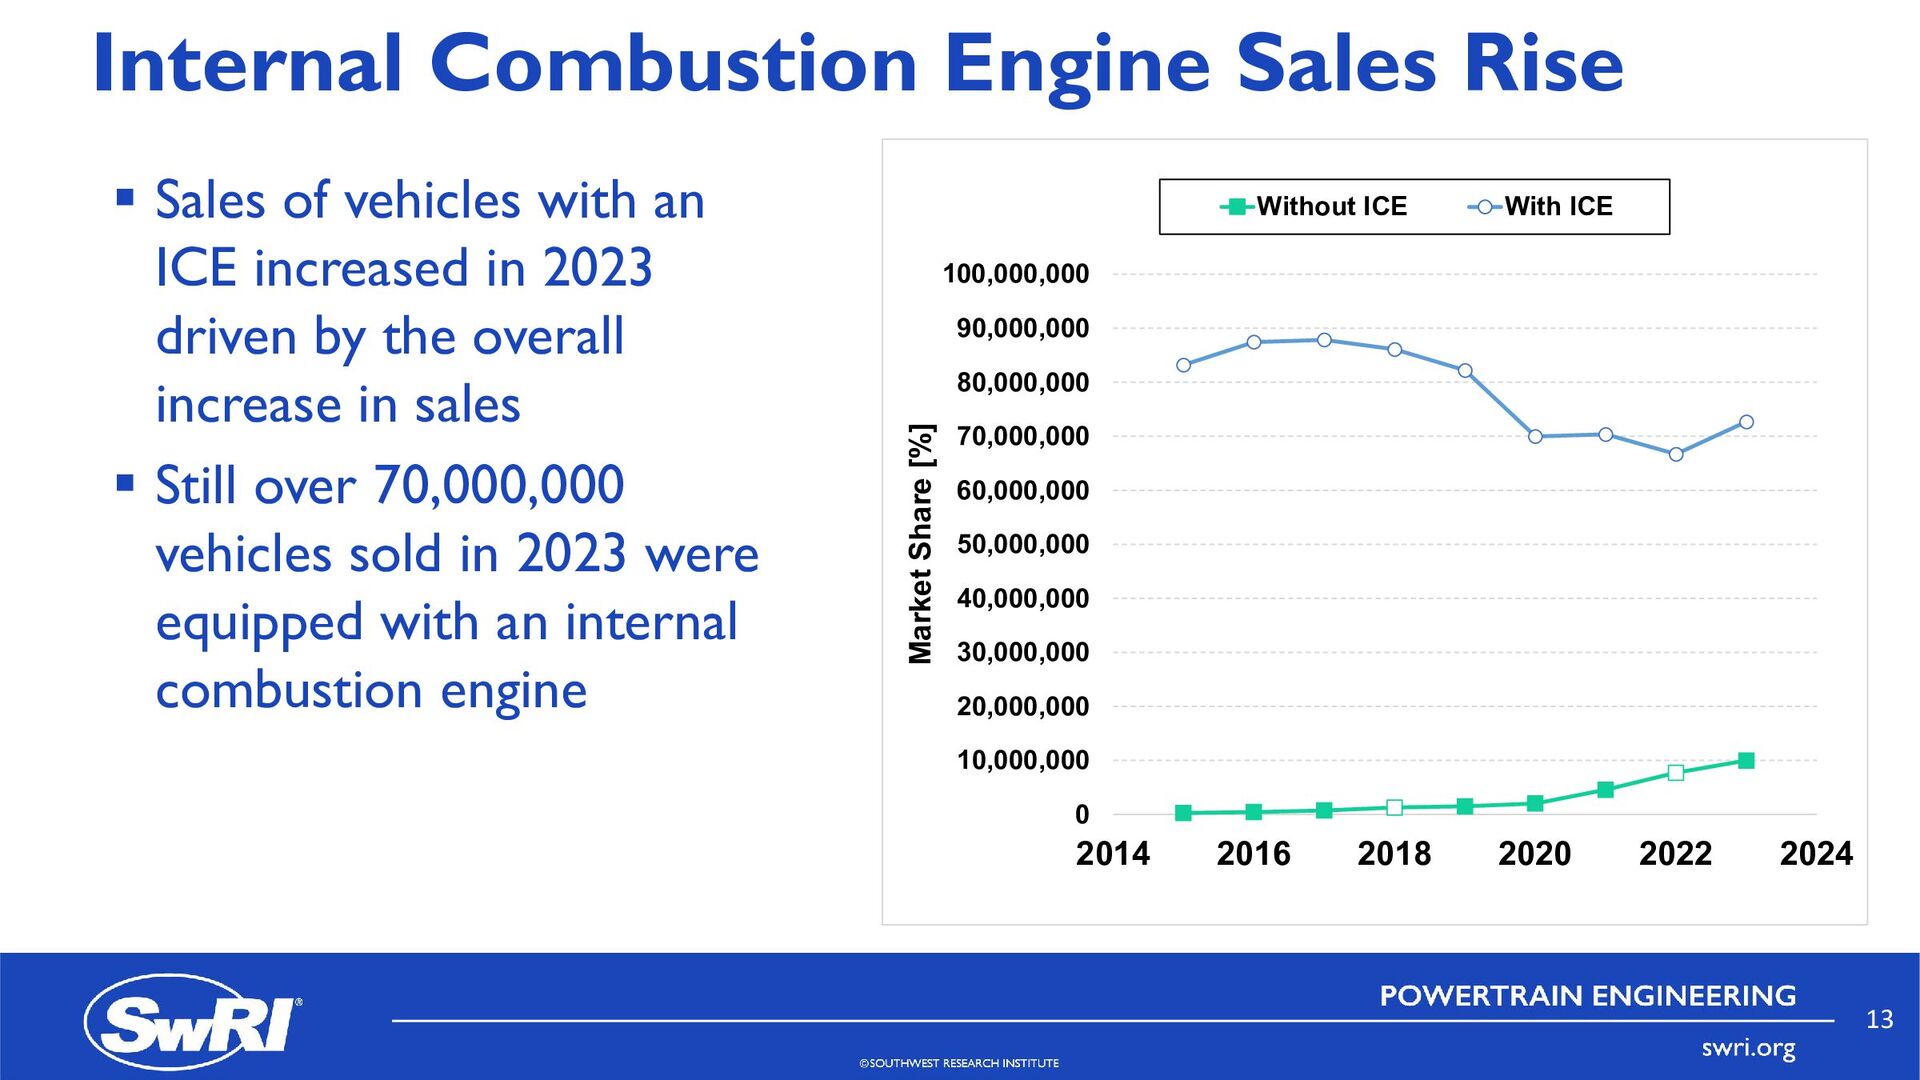
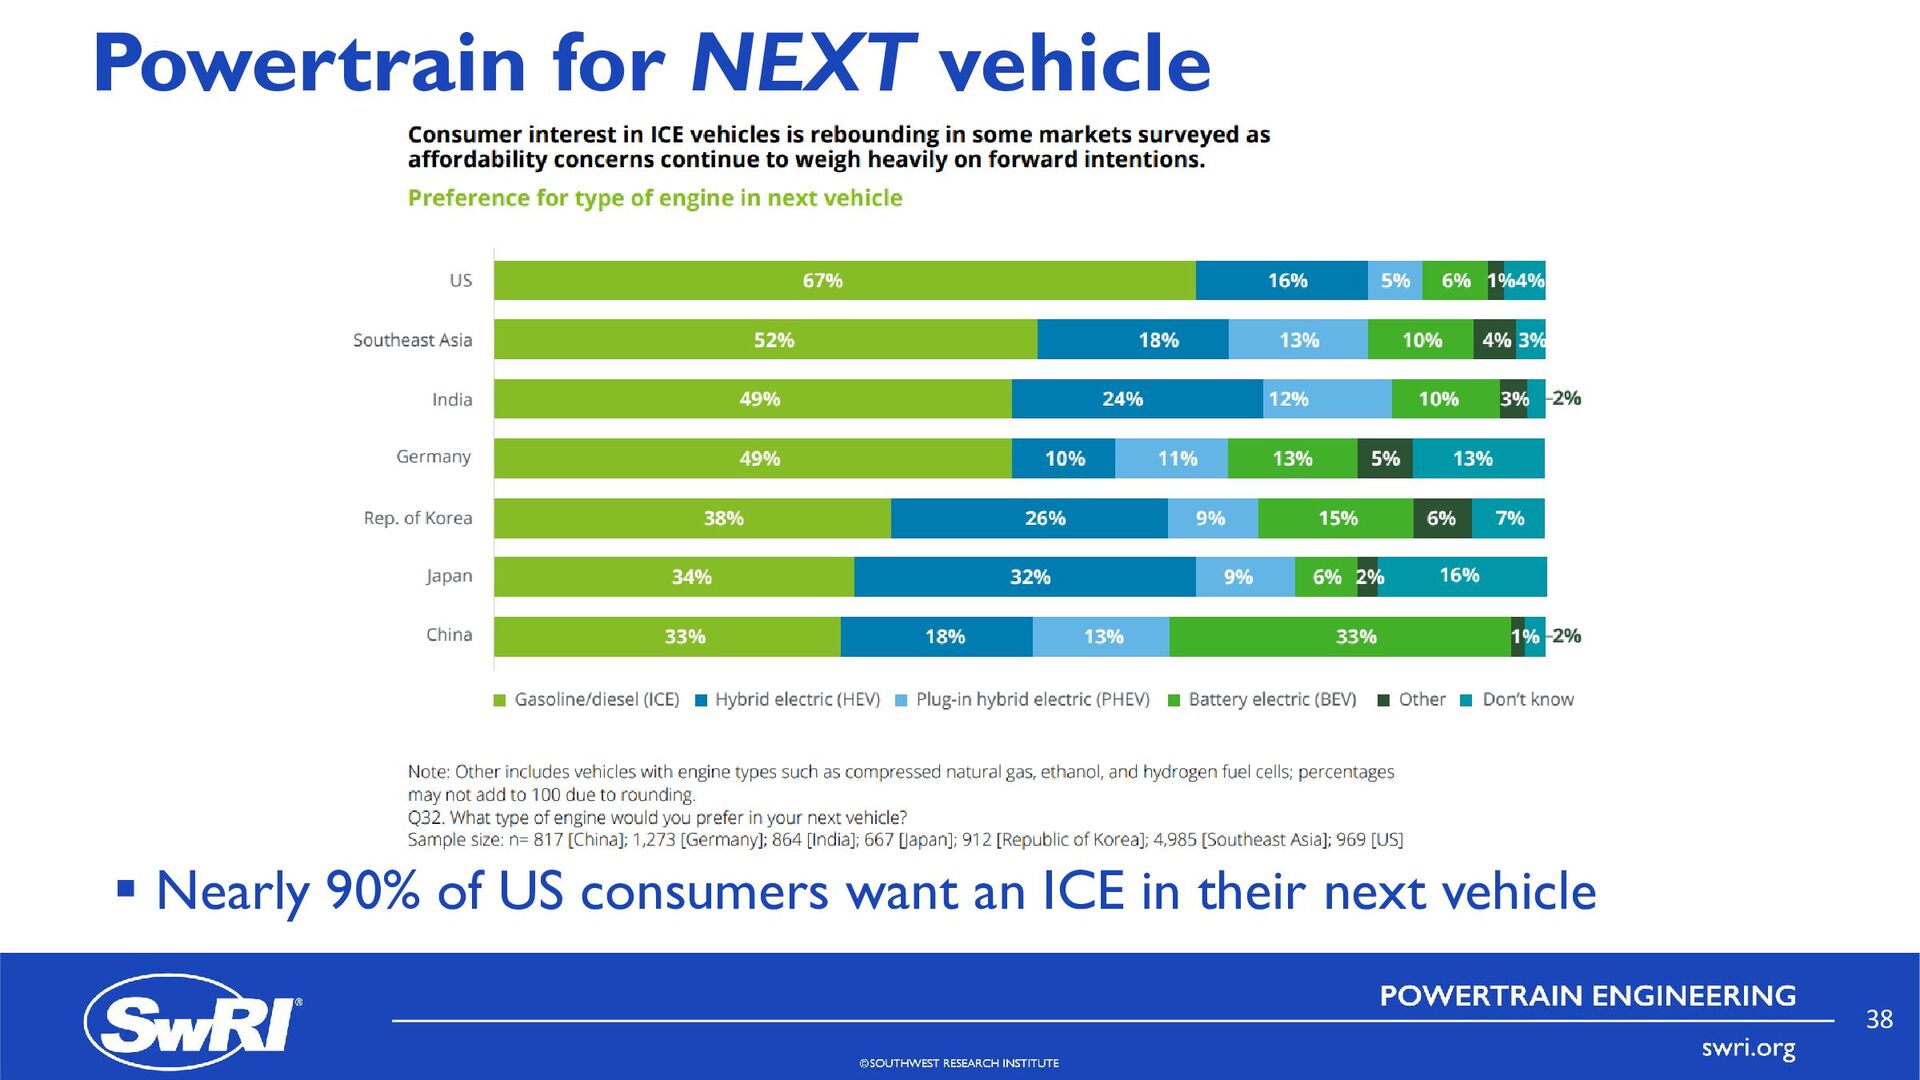
an ICE increased in 2023 driven by the overall increase in sales Still over 70,000,000 vehicles sold in 2023 were equipped with an internal combustion engine 0 10,000,000 20,000,000 30,000,000 40,000,000 50,000,000 60,000,000 70,000,000 80,000,000 90,000,000 100,000,000 2014 2016 2018 2020 2022 2024 Market Share [%] Without ICE With ICE 13
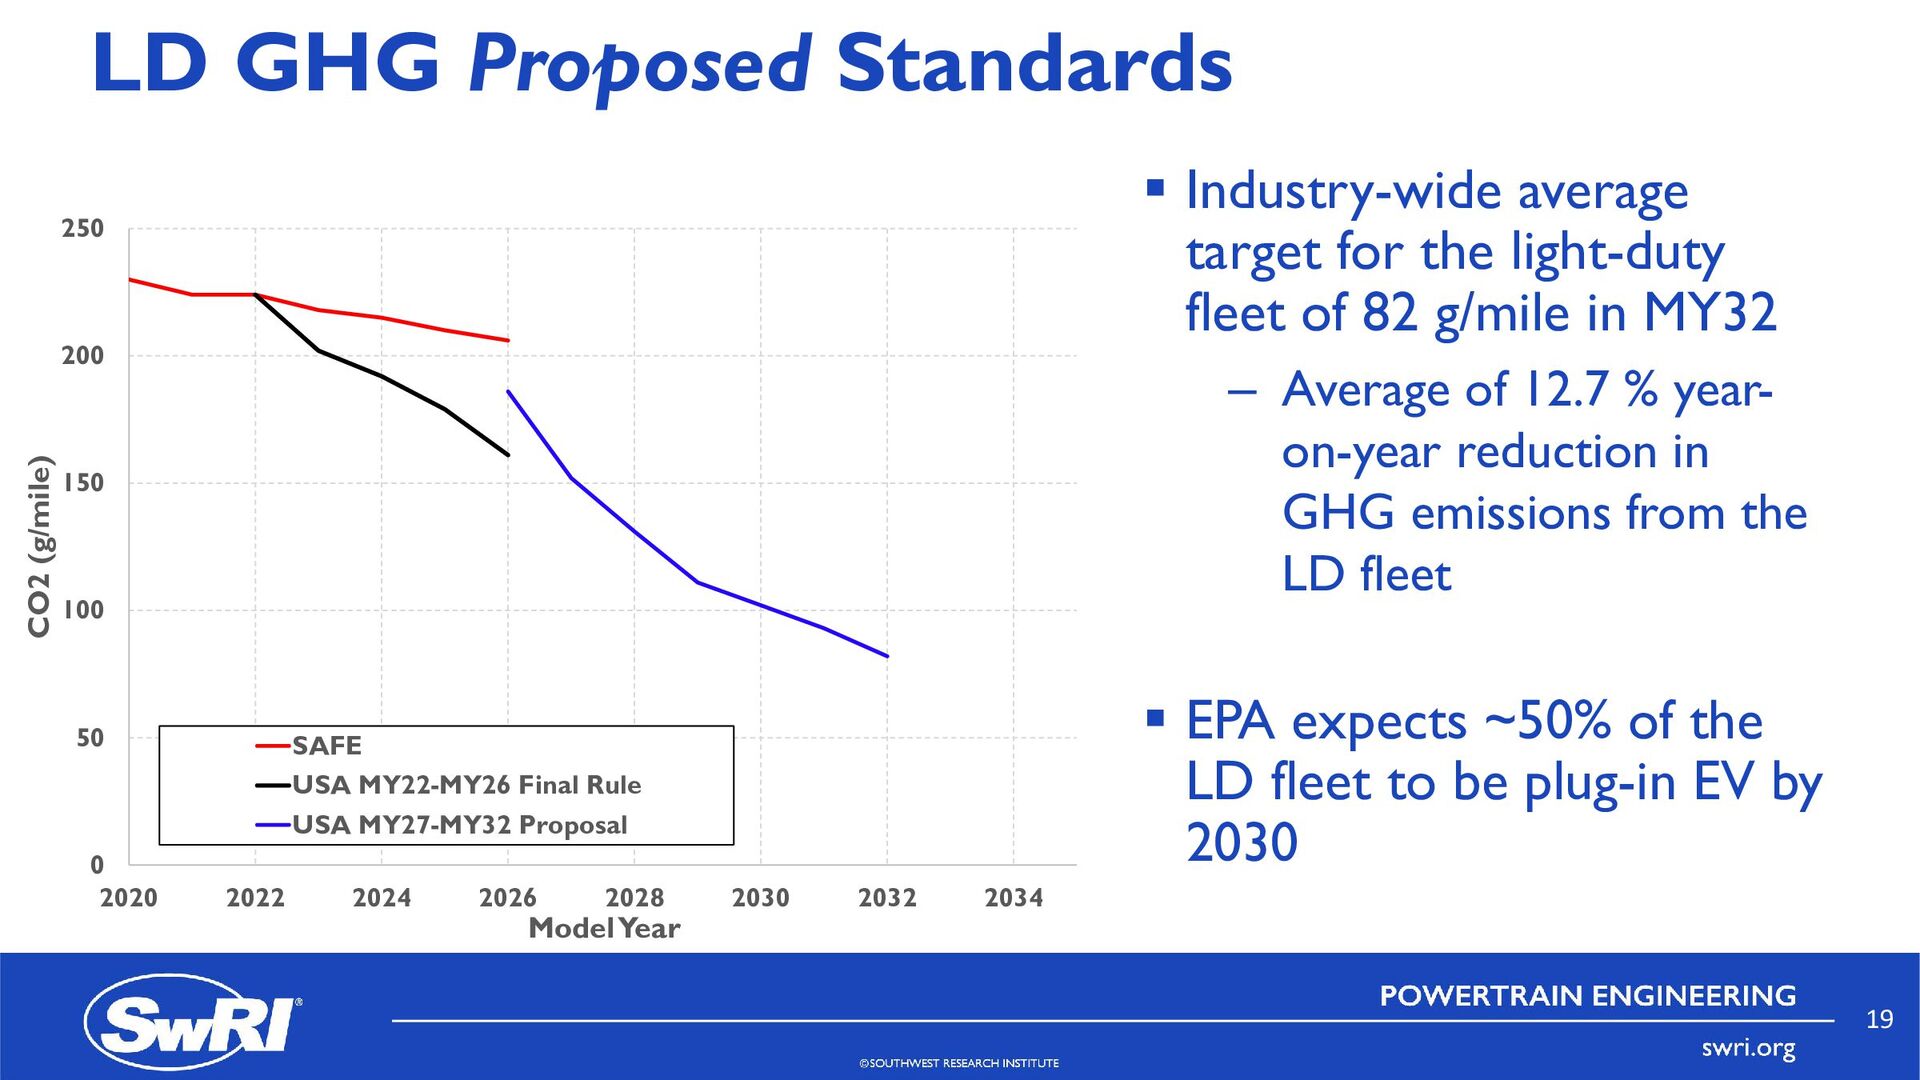
light-duty fleet of 82 g/mile in MY32 – Average of 12.7 % year- on-year reduction in GHG emissions from the LD fleet EPA expects ~50% of the LD fleet to be plug-in EV by 2030 0 50 100 150 200 250 2020 2022 2024 2026 2028 2030 2032 2034 CO2 (g/mile) Model Year SAFE USA MY22-MY26 Final Rule USA MY27-MY32 Proposal 19
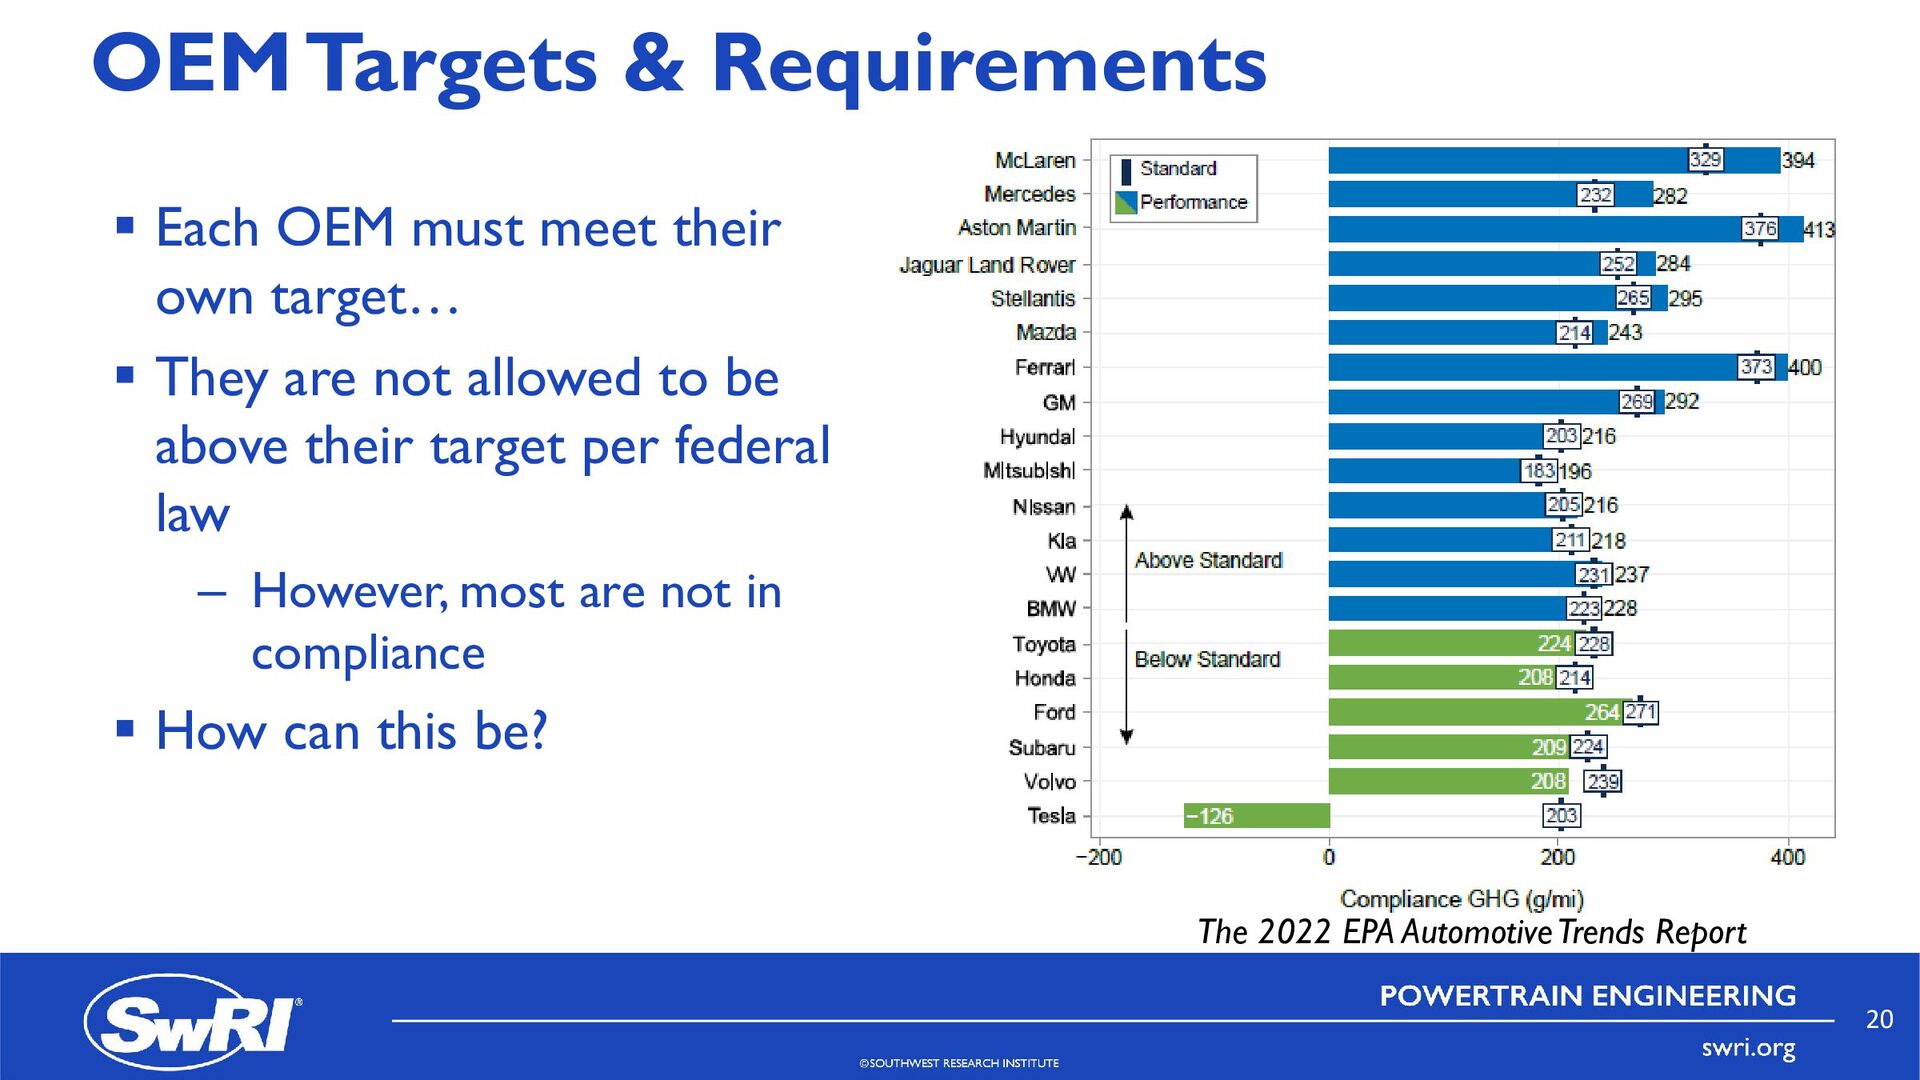
own target… They are not allowed to be above their target per federal law – However, most are not in compliance How can this be? The 2022 EPA Automotive Trends Report 20
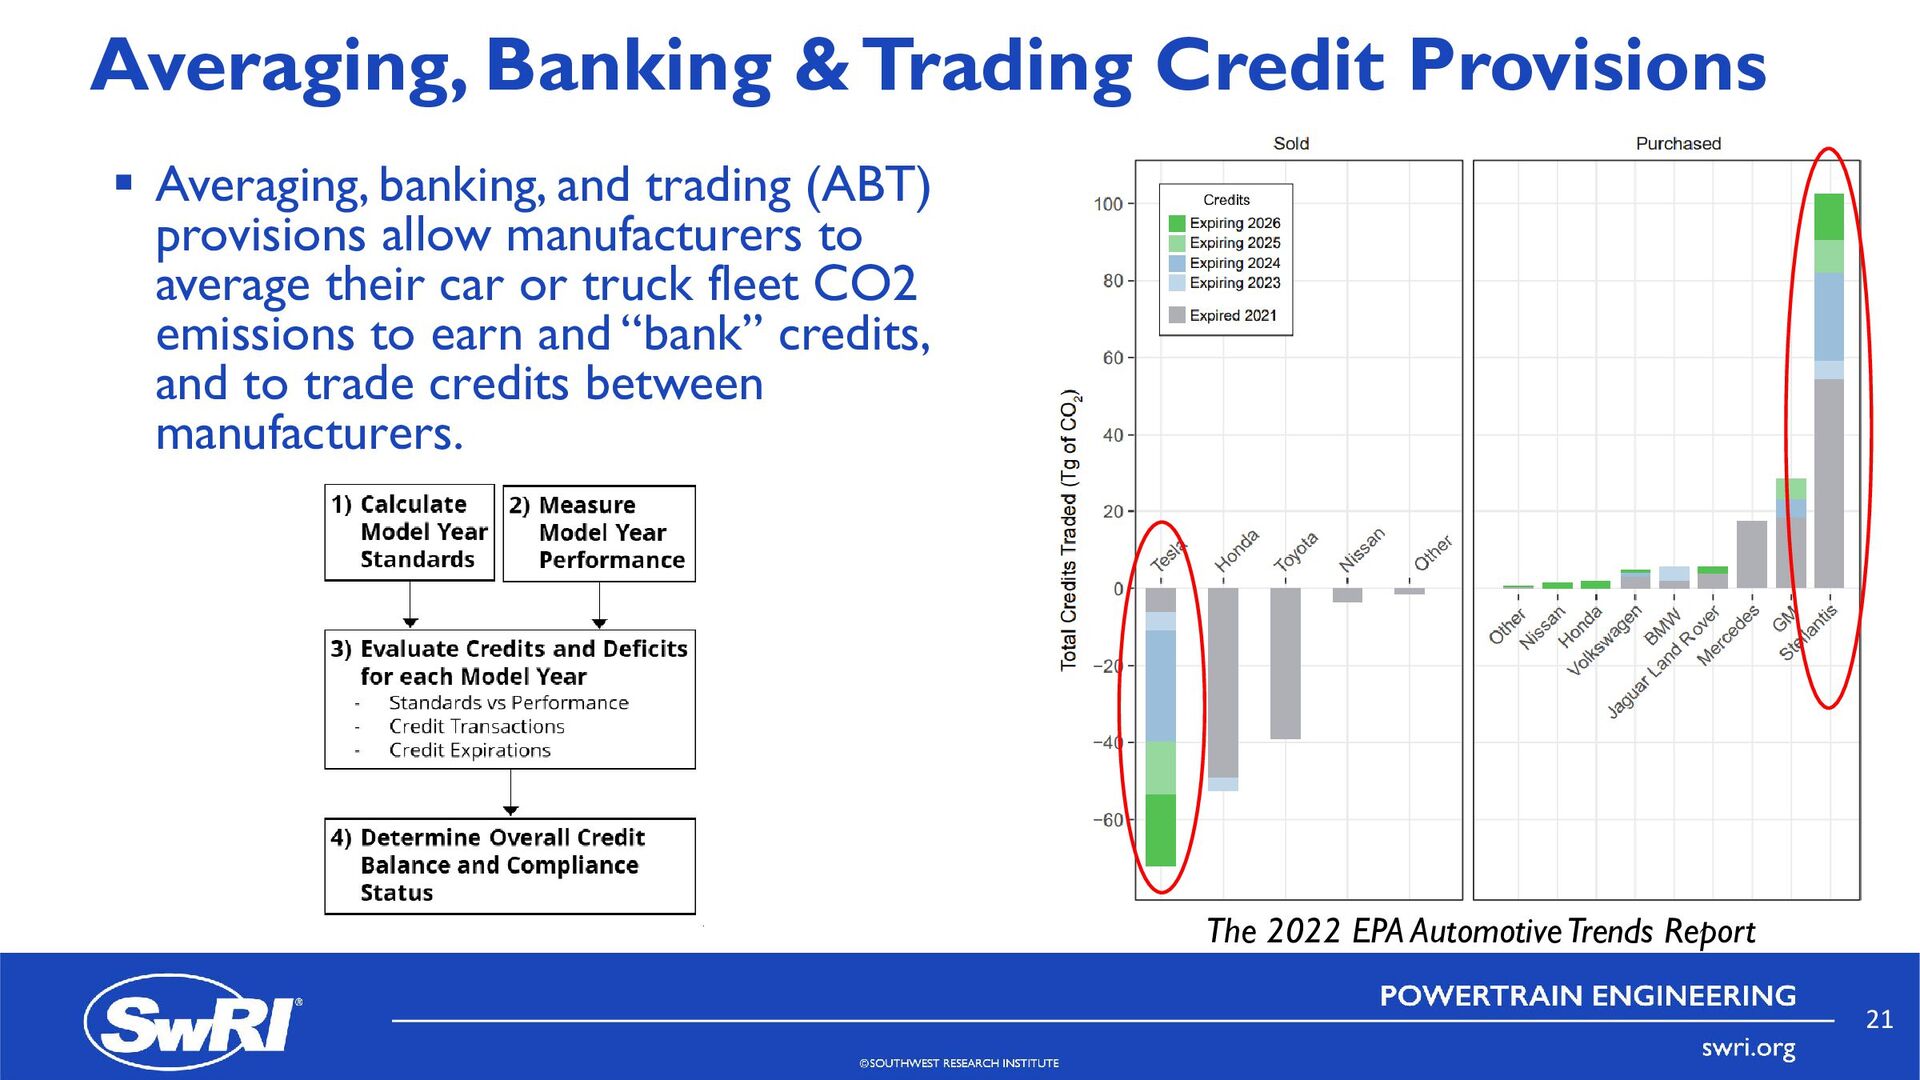
trading (ABT) provisions allow manufacturers to average their car or truck fleet CO2 emissions to earn and “bank” credits, and to trade credits between manufacturers. The 2022 EPA Automotive Trends Report 21
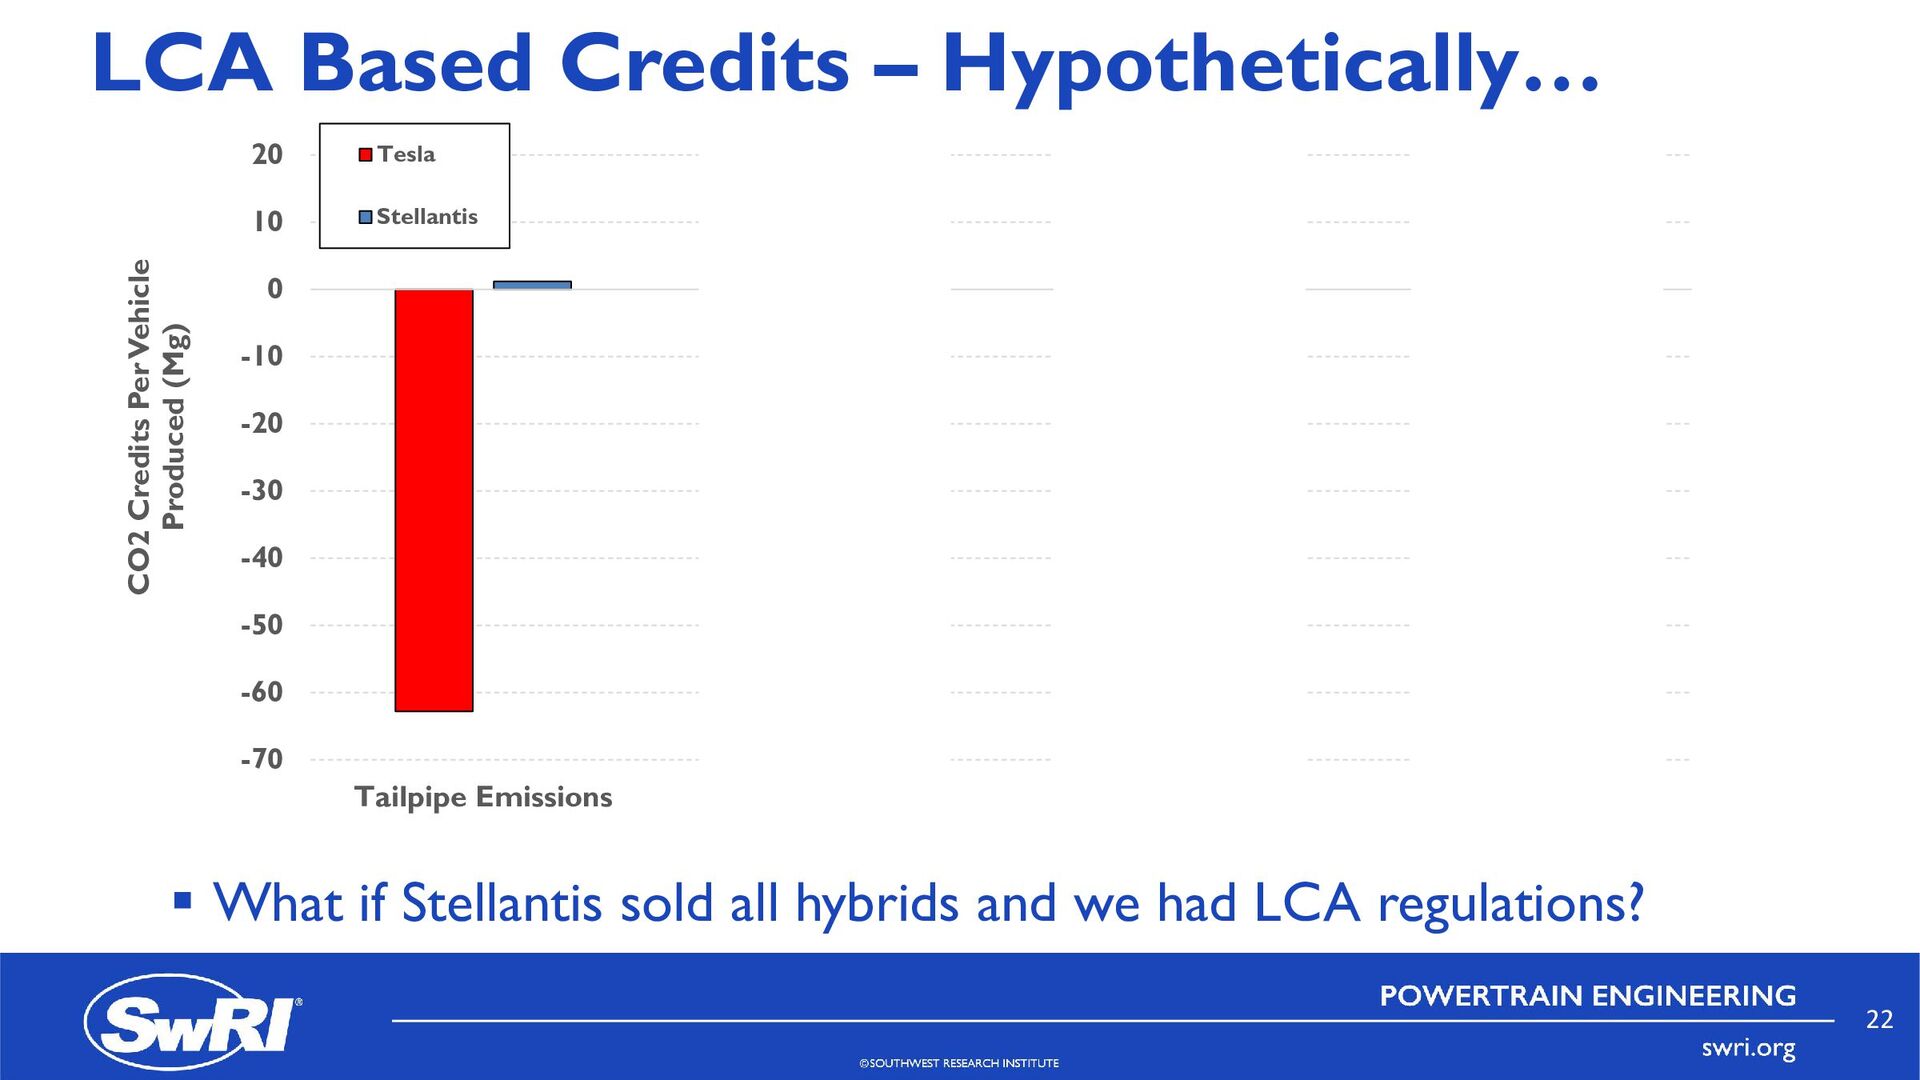
all hybrids and we had LCA regulations? -70 -60 -50 -40 -30 -20 -10 0 10 20 Tailpipe Emissions LCA WY Grid LCA US Av Grid LCA WA Grid CO2 Credits Per Vehicle Produced (Mg) Tesla Stellantis 22
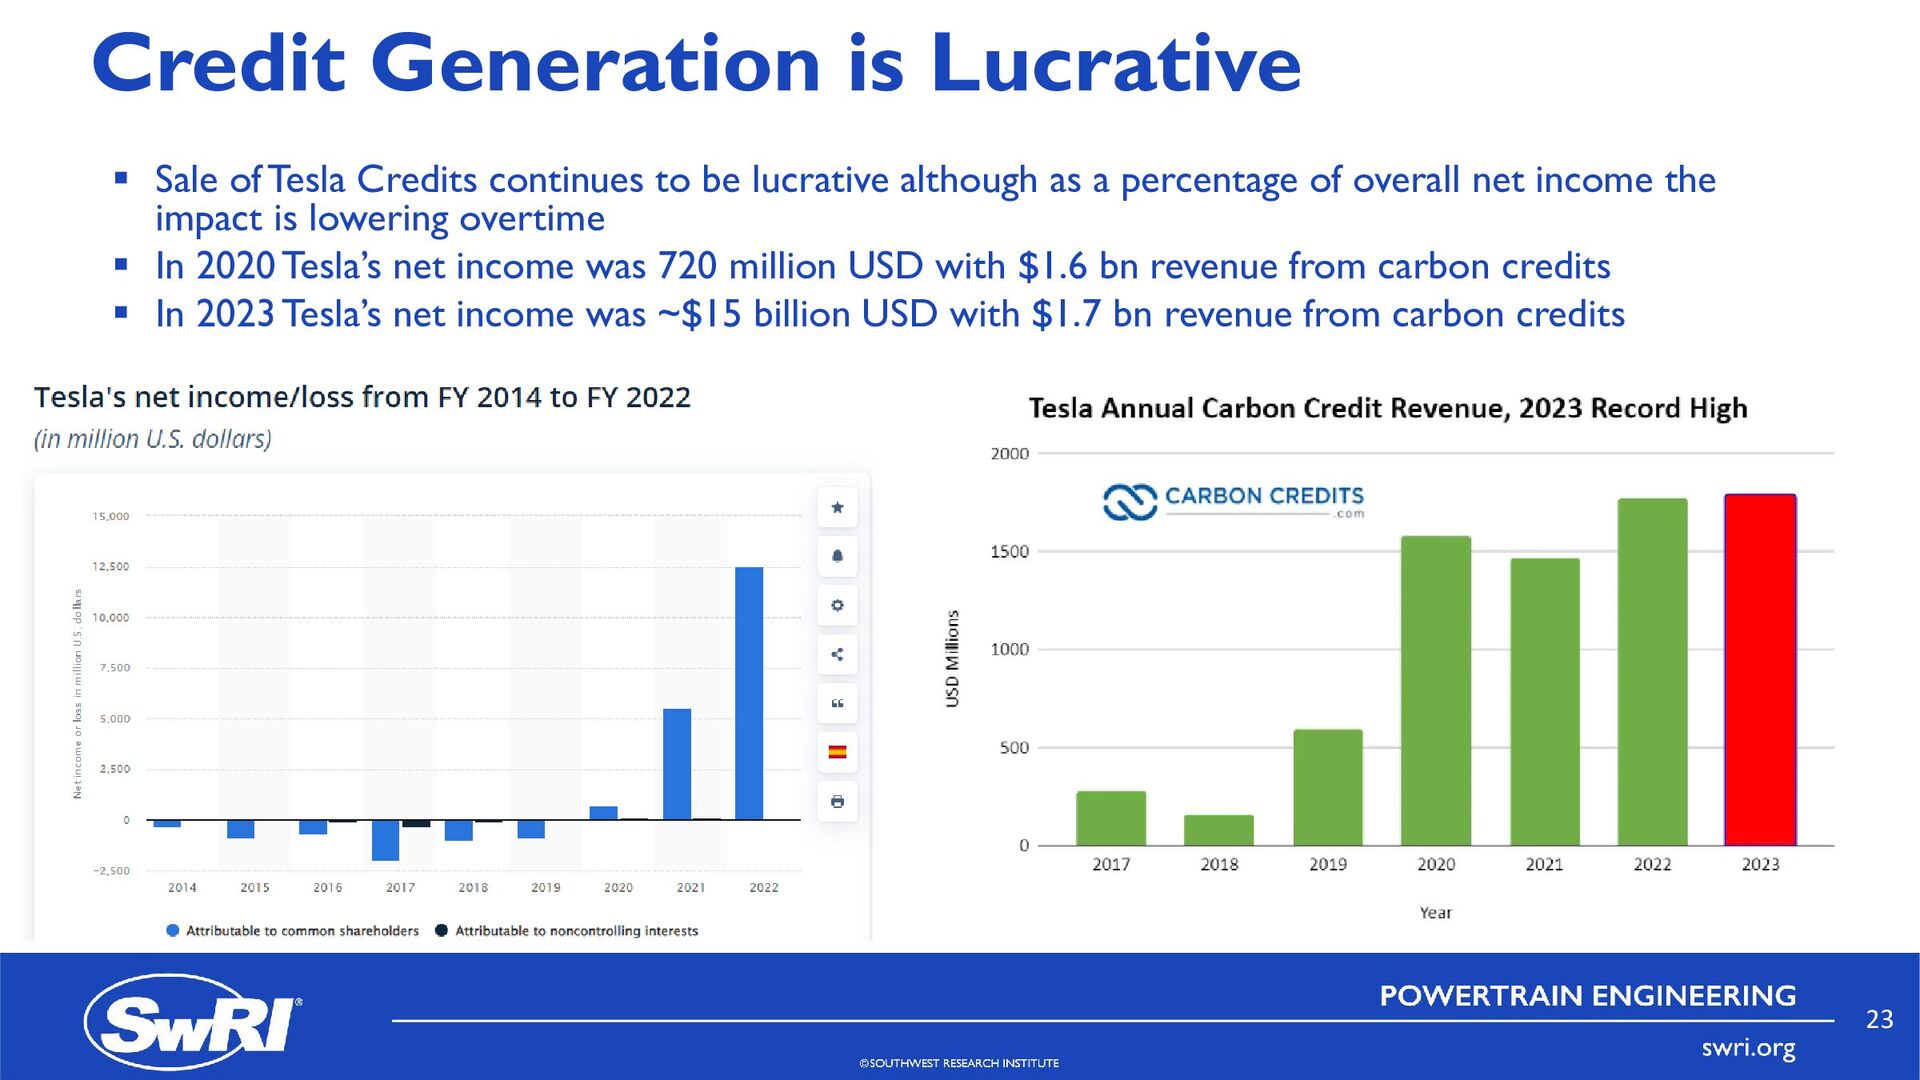
to be lucrative although as a percentage of overall net income the impact is lowering overtime In 2020 Tesla’s net income was 720 million USD with $1.6 bn revenue from carbon credits In 2023 Tesla’s net income was ~$15 billion USD with $1.7 bn revenue from carbon credits 23
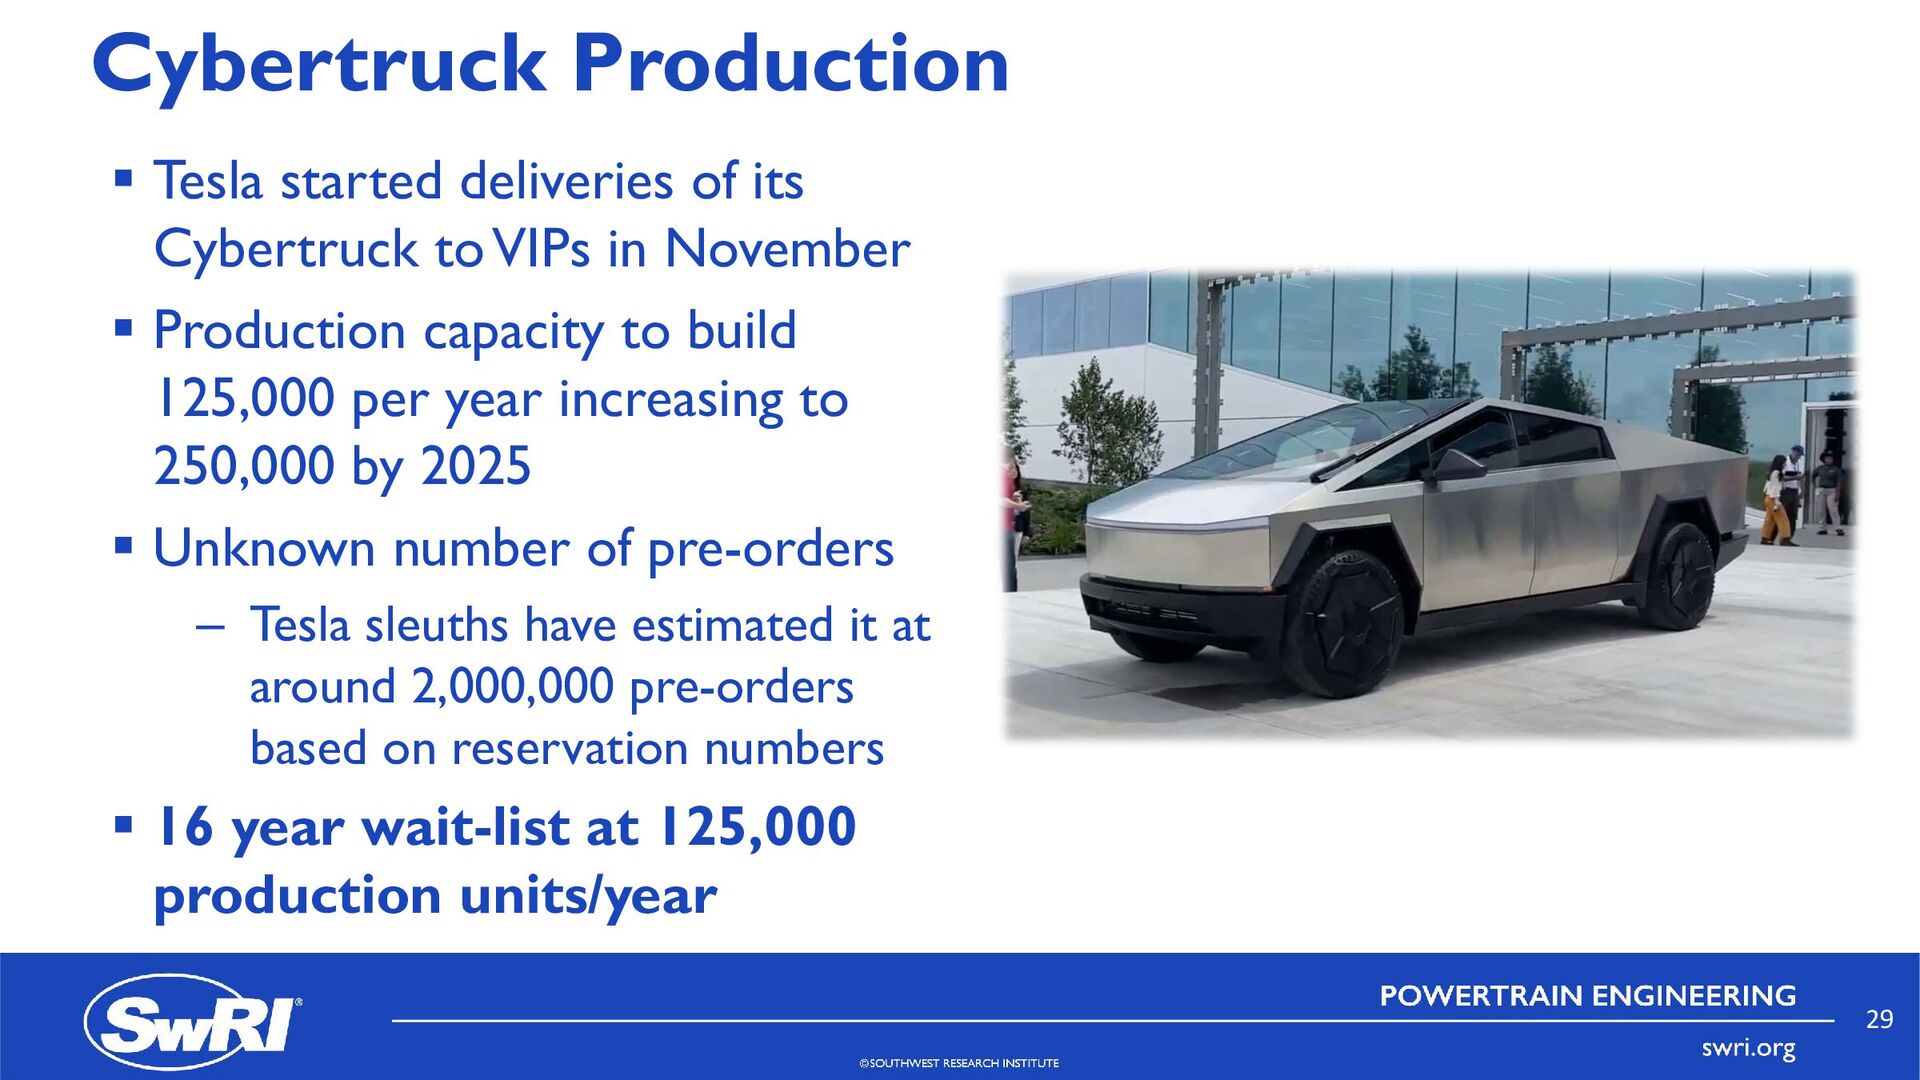
VIPs in November Production capacity to build 125,000 per year increasing to 250,000 by 2025 Unknown number of pre-orders – Tesla sleuths have estimated it at around 2,000,000 pre-orders based on reservation numbers 16 year wait-list at 125,000 production units/year 29
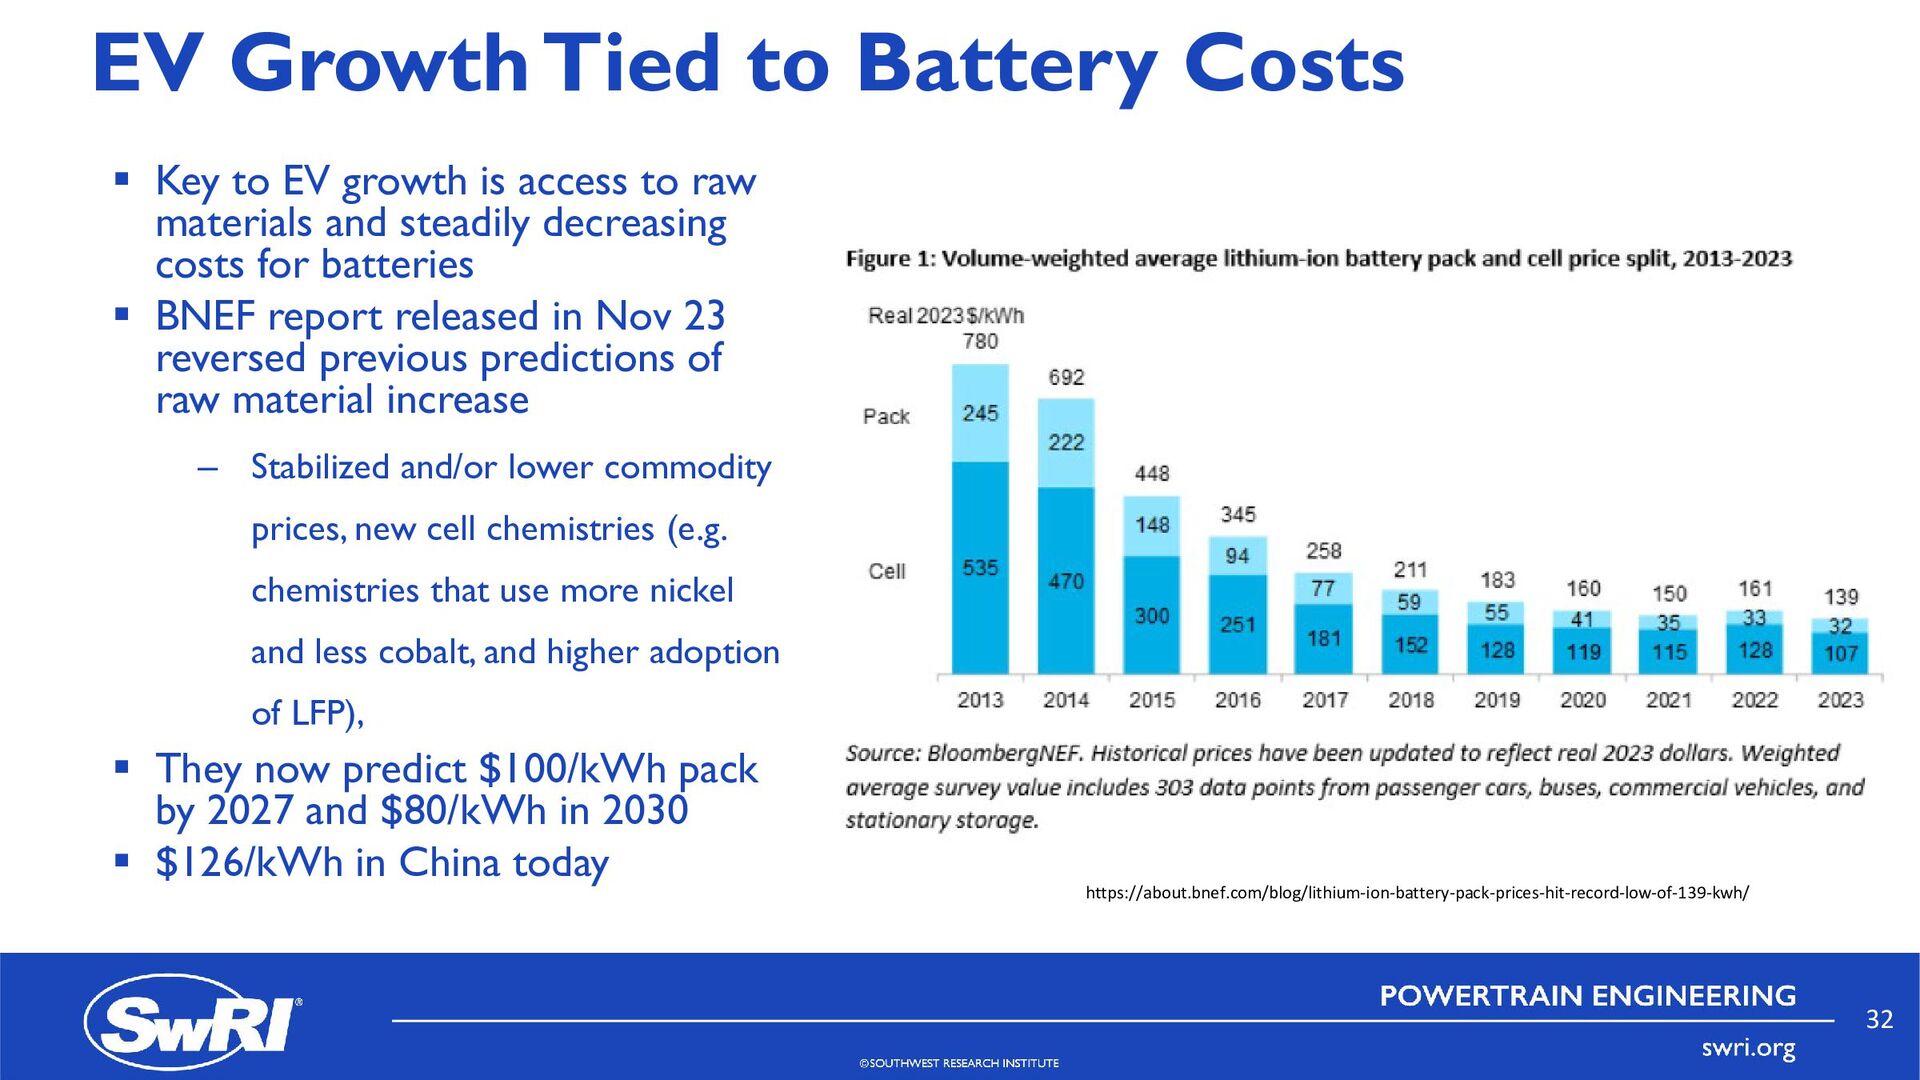
growth is access to raw materials and steadily decreasing costs for batteries BNEF report released in Nov 23 reversed previous predictions of raw material increase – Stabilized and/or lower commodity prices, new cell chemistries (e.g. chemistries that use more nickel and less cobalt, and higher adoption of LFP), They now predict $100/kWh pack by 2027 and $80/kWh in 2030 $126/kWh in China today https://about.bnef.com/blog/lithium-ion-battery-pack-prices-hit-record-low-of-139-kwh/ 32
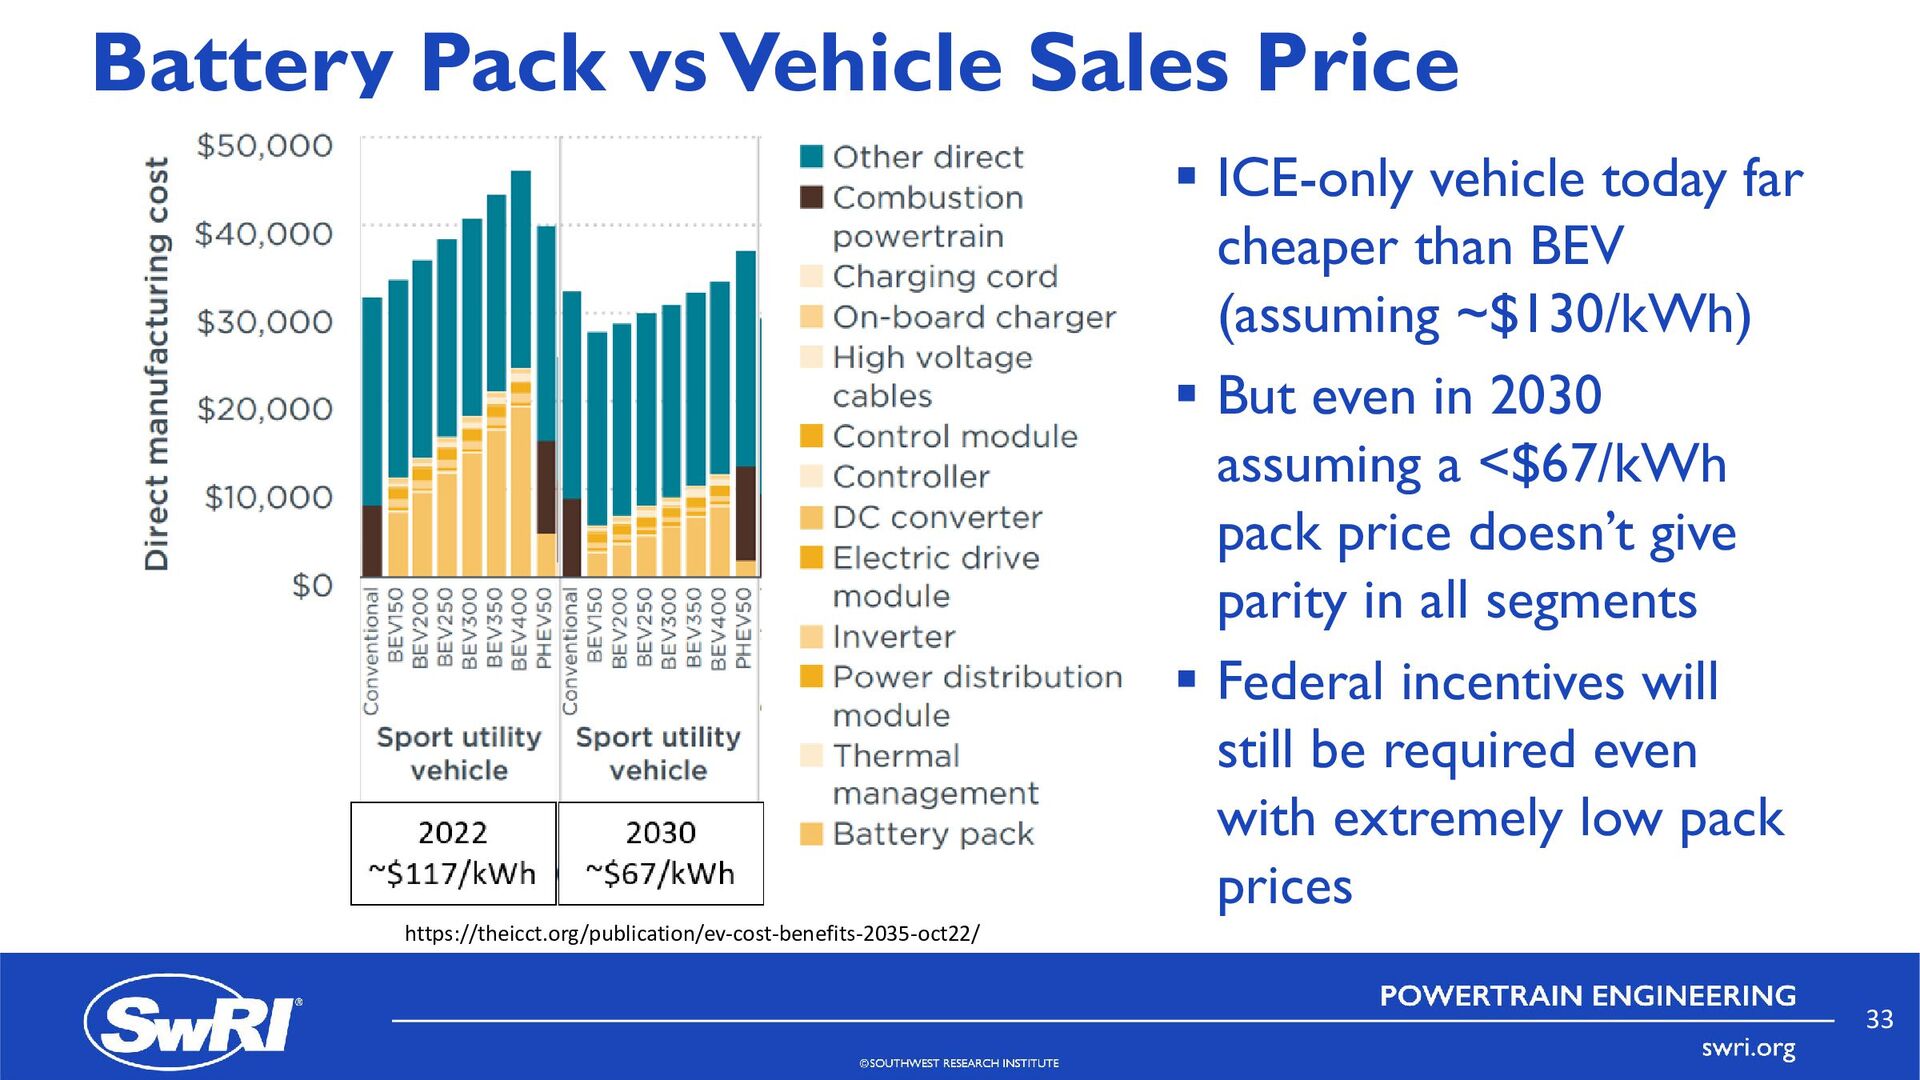
far cheaper than BEV (assuming ~$130/kWh) But even in 2030 assuming a <$67/kWh pack price doesn’t give parity in all segments Federal incentives will still be required even with extremely low pack prices 2030 ~$67/kWh 2022 ~$117/kWh https://theicct.org/publication/ev-cost-benefits-2035-oct22/ 33
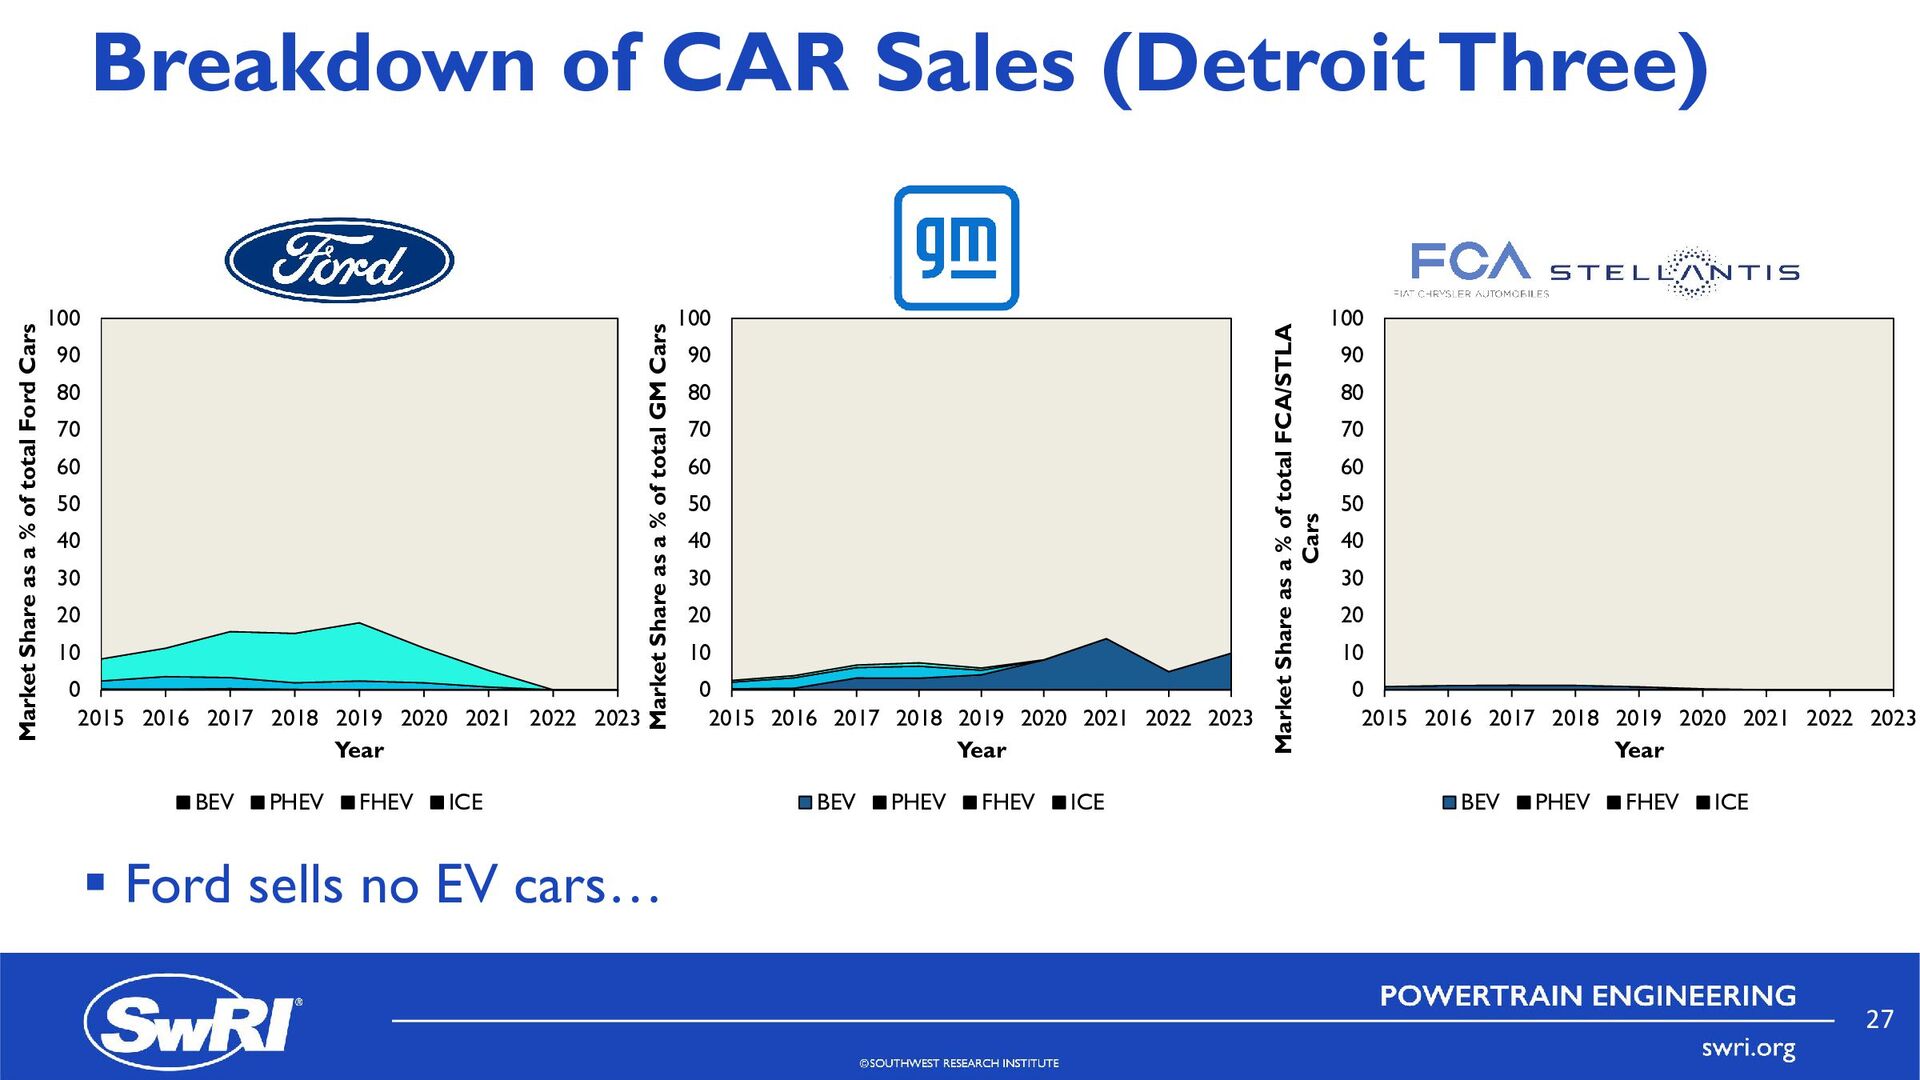
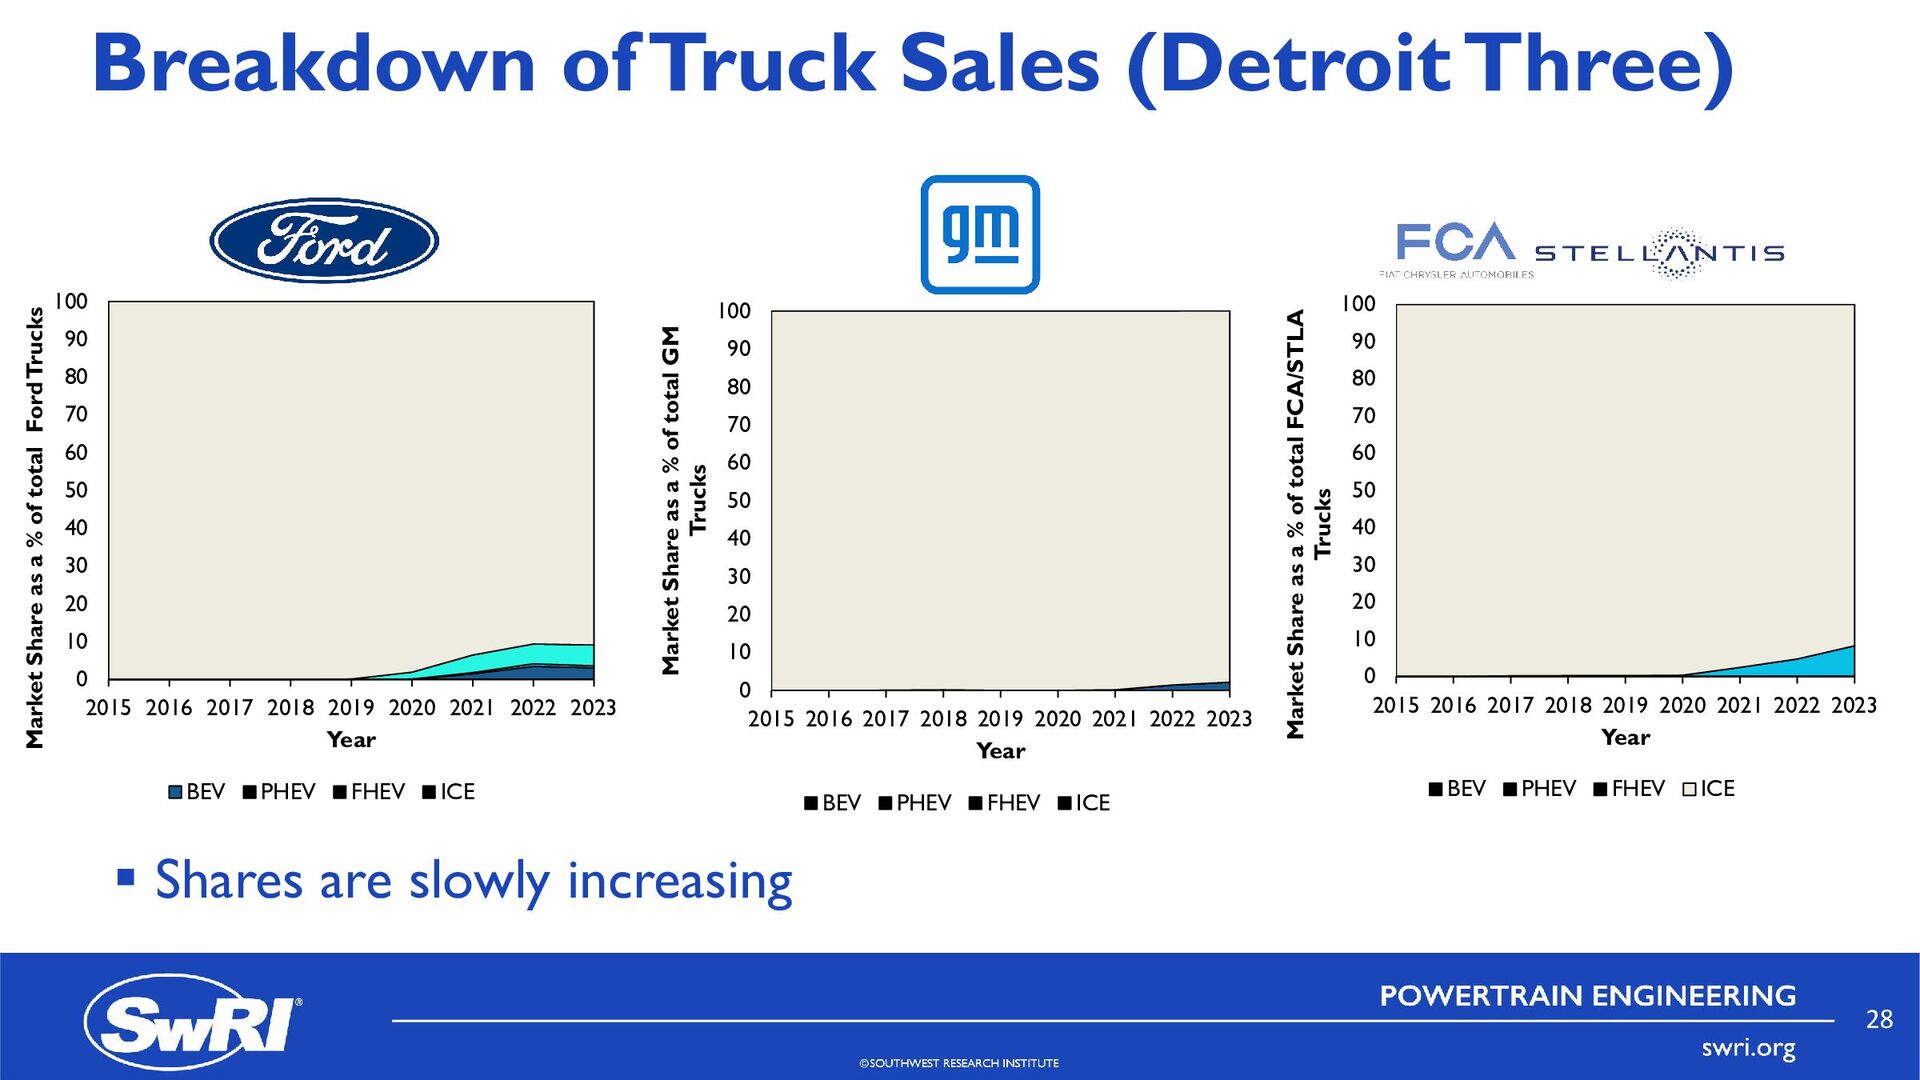
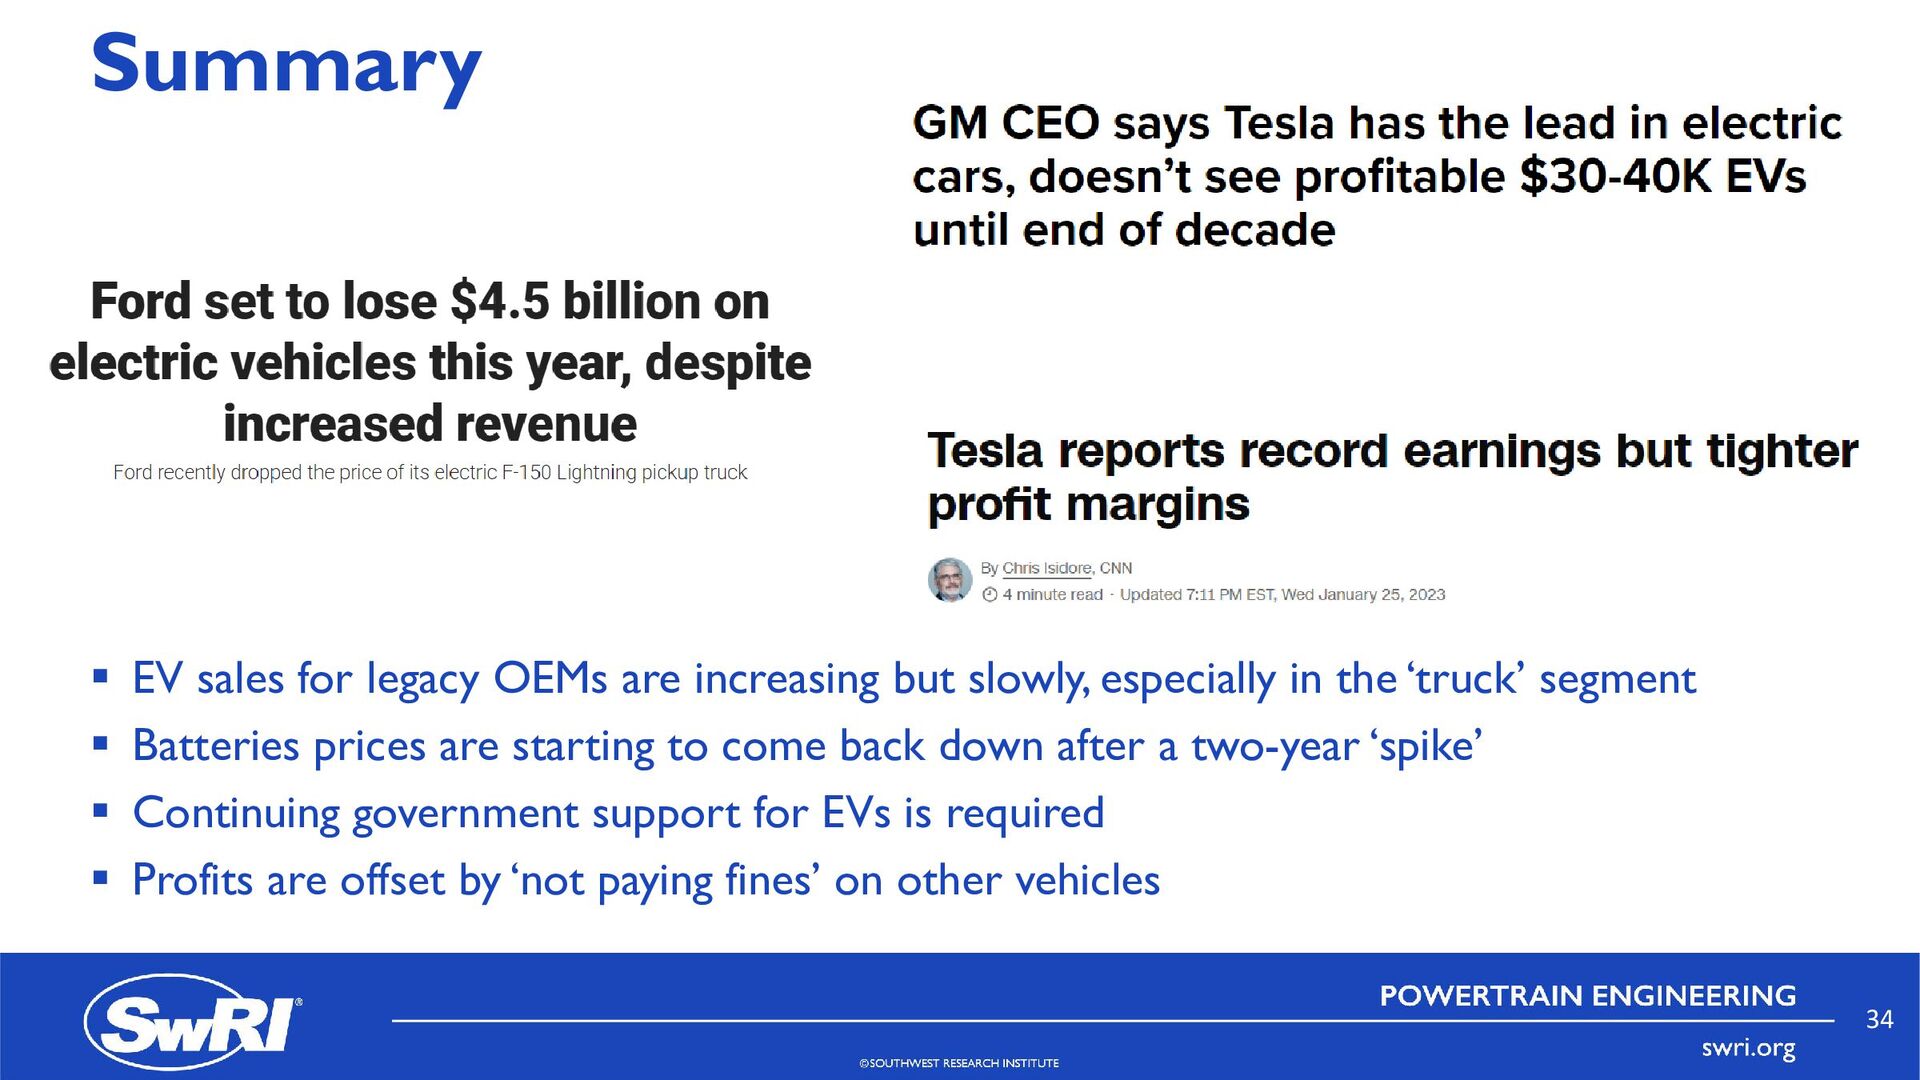
slowly, especially in the ‘truck’ segment Batteries prices are starting to come back down after a two-year ‘spike’ Continuing government support for EVs is required Profits are offset by ‘not paying fines’ on other vehicles 34
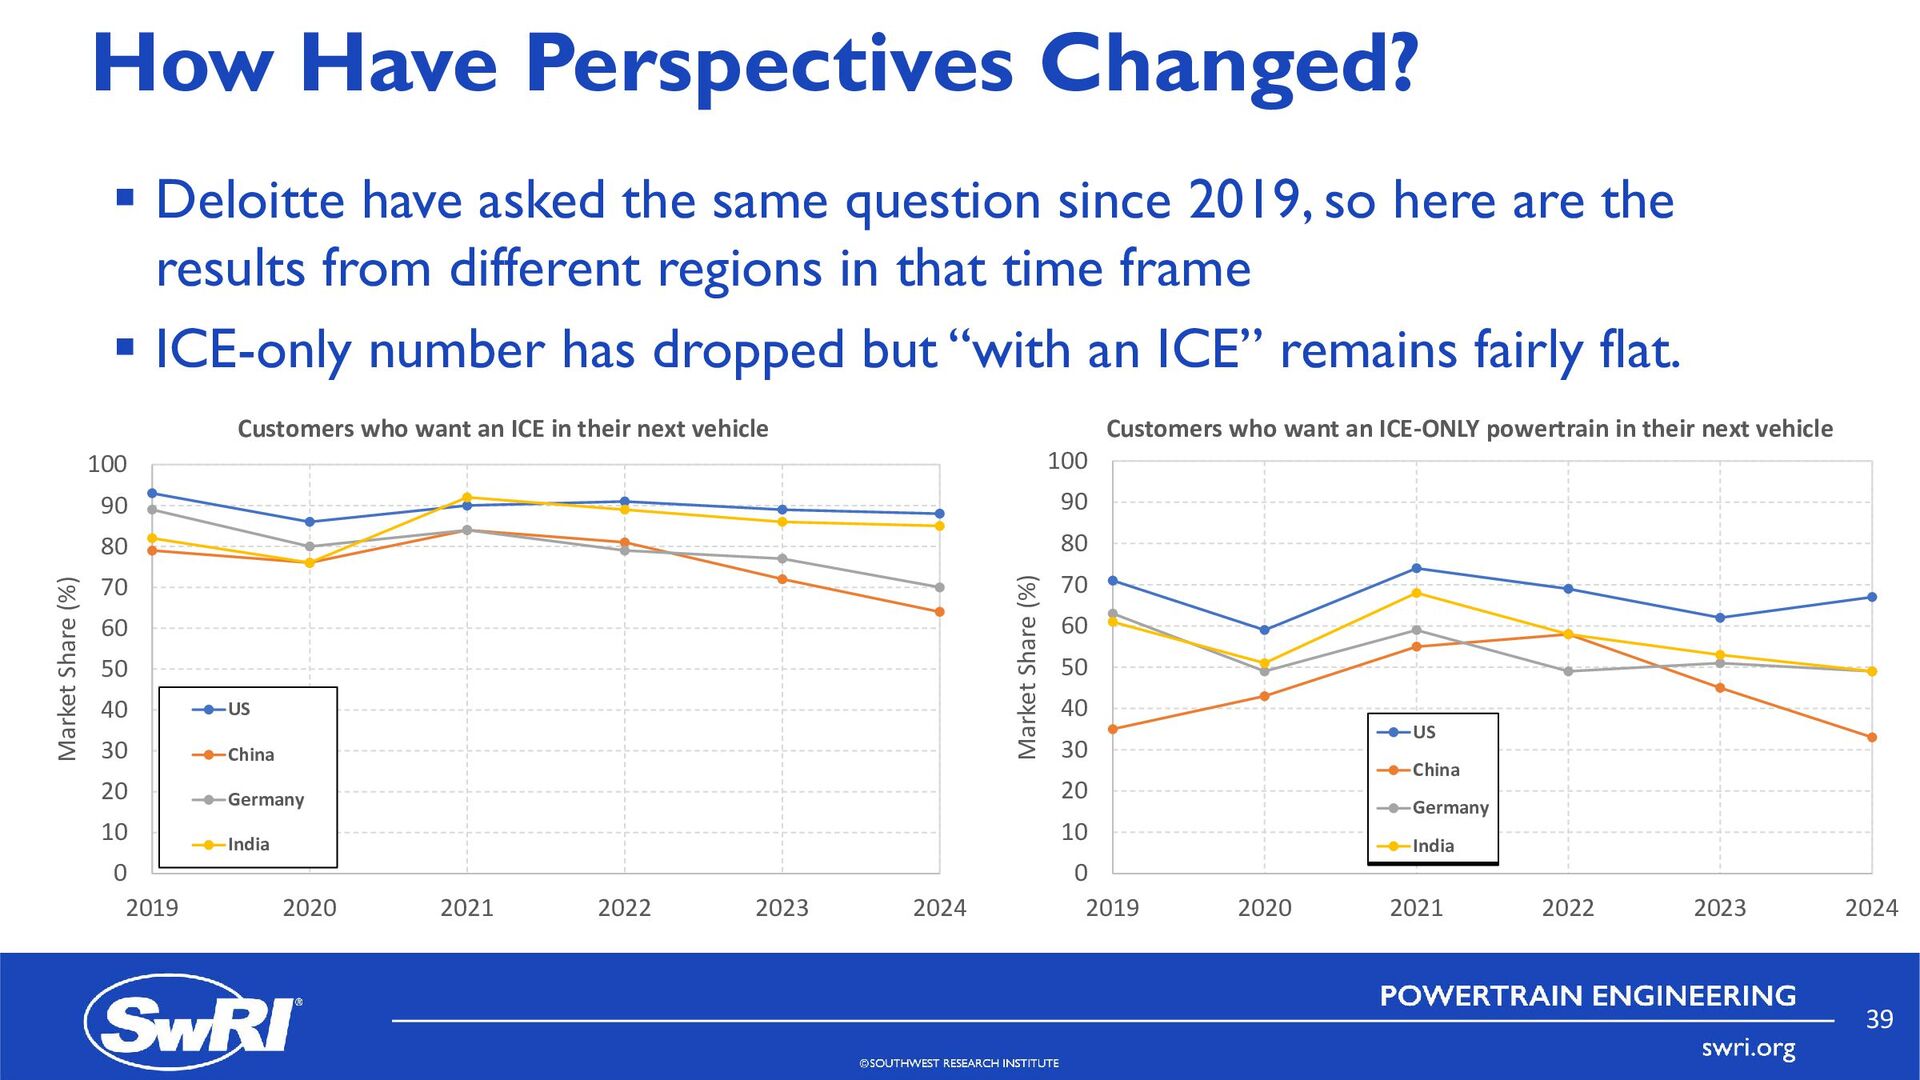
question since 2019, so here are the results from different regions in that time frame ICE-only number has dropped but “with an ICE” remains fairly flat. 0 10 20 30 40 50 60 70 80 90 100 2019 2020 2021 2022 2023 2024 Market Share (%) Customers who want an ICE in their next vehicle US China Germany India 0 10 20 30 40 50 60 70 80 90 100 2019 2020 2021 2022 2023 2024 Market Share (%) Customers who want an ICE-ONLY powertrain in their next vehicle US China Germany India 39
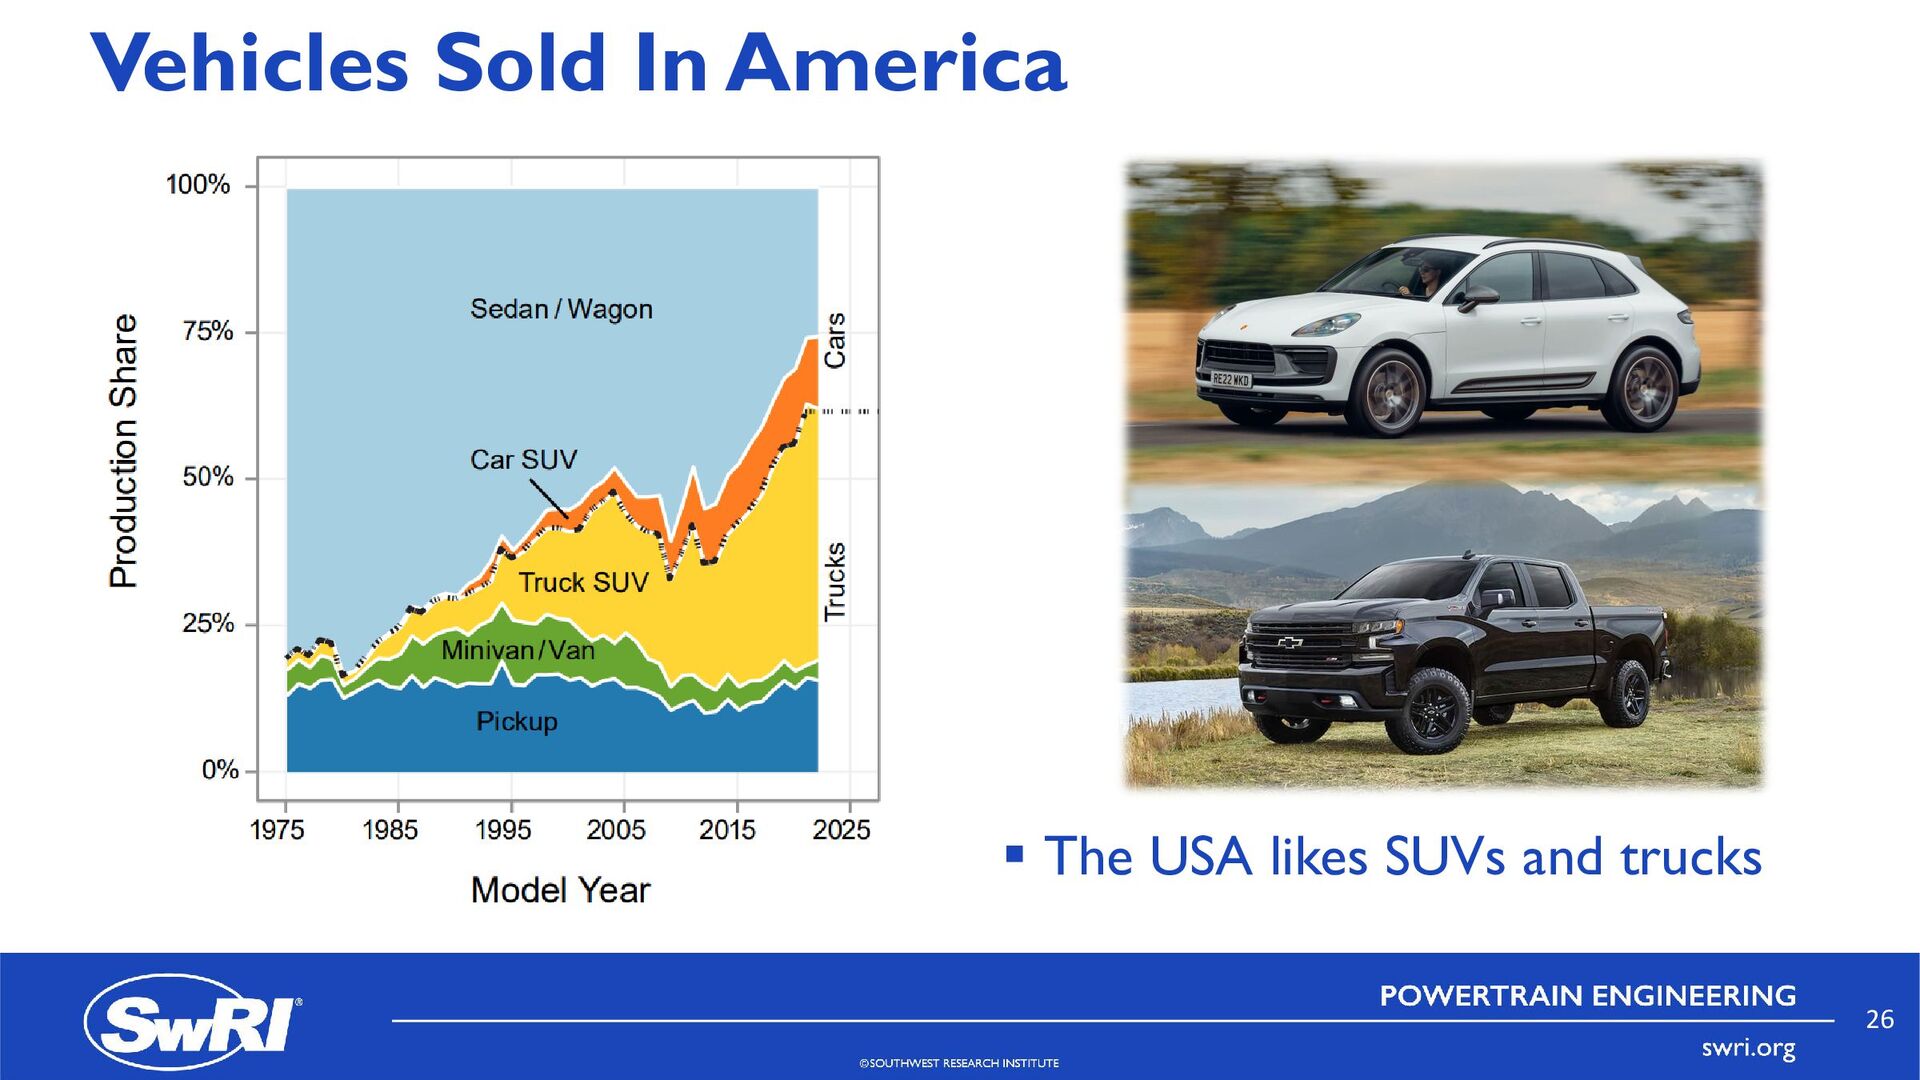
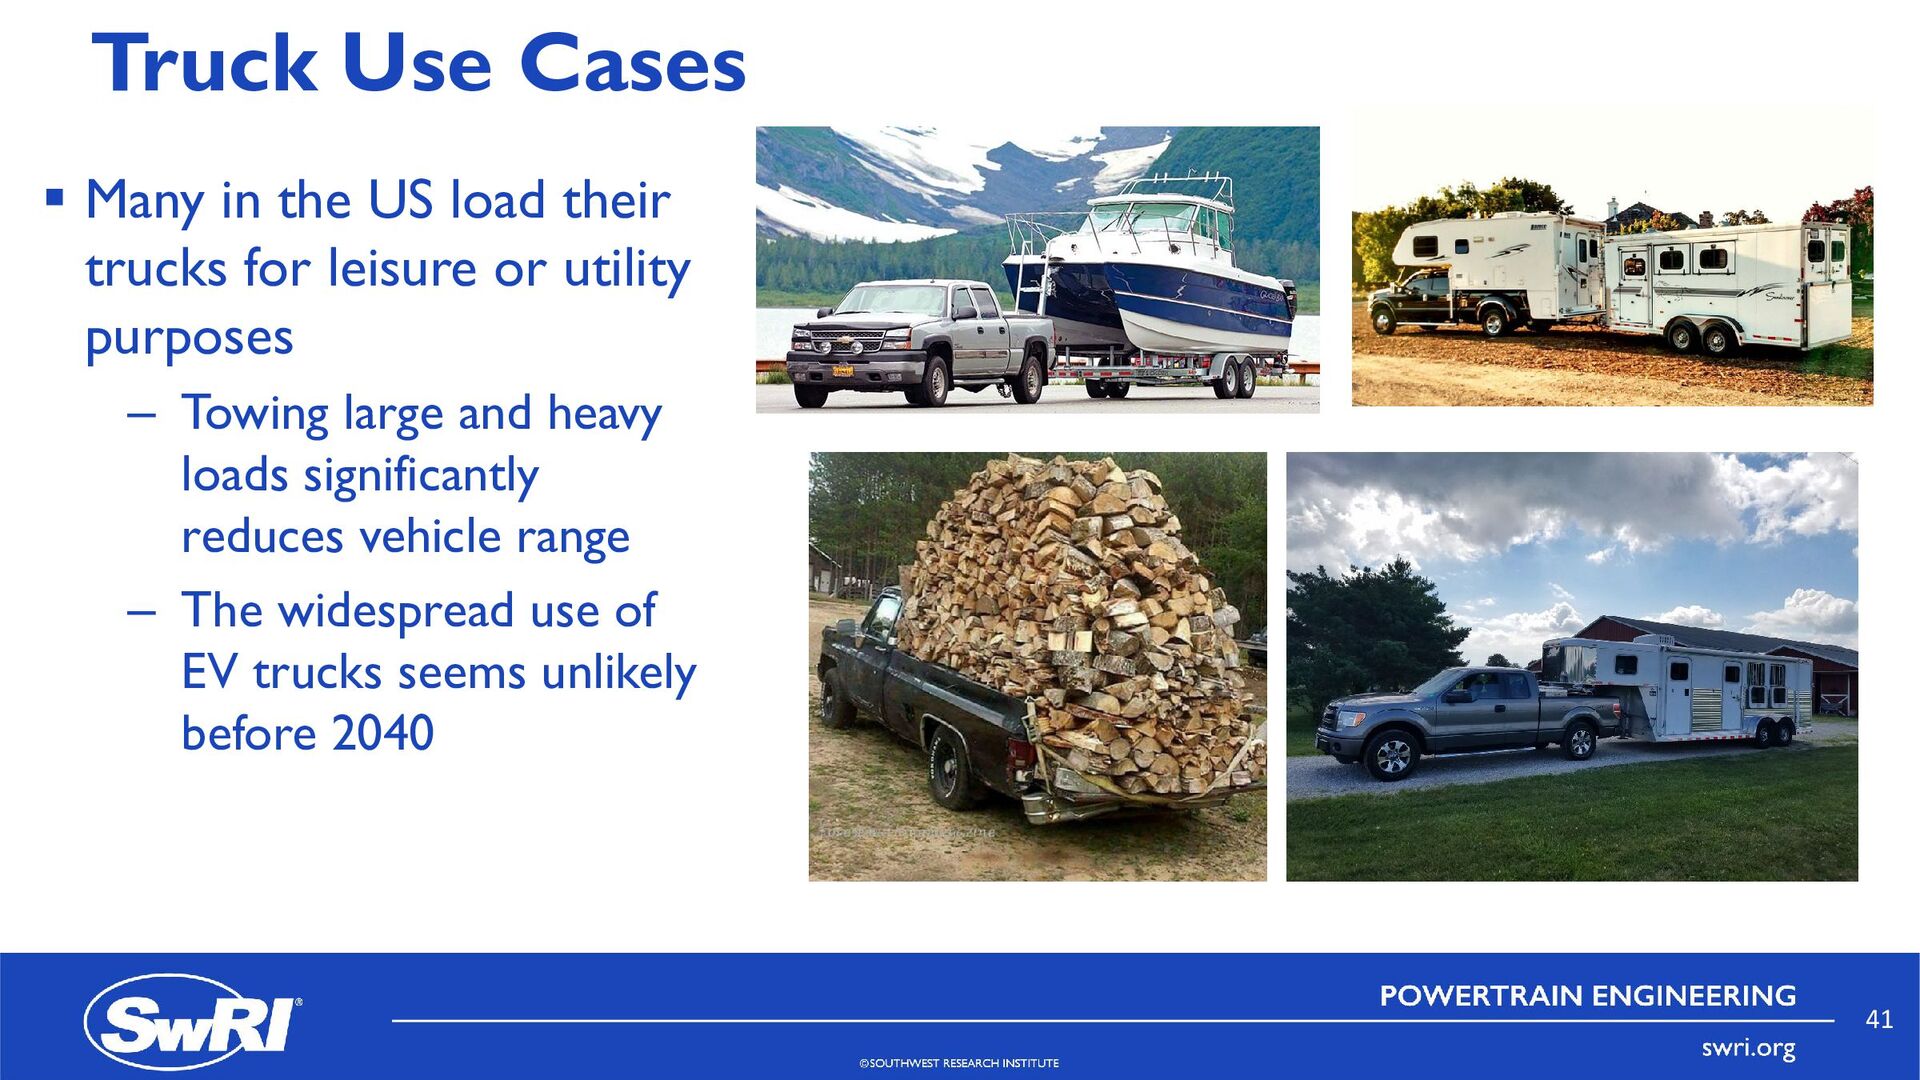
trucks for leisure or utility purposes – Towing large and heavy loads significantly reduces vehicle range – The widespread use of EV trucks seems unlikely before 2040 41
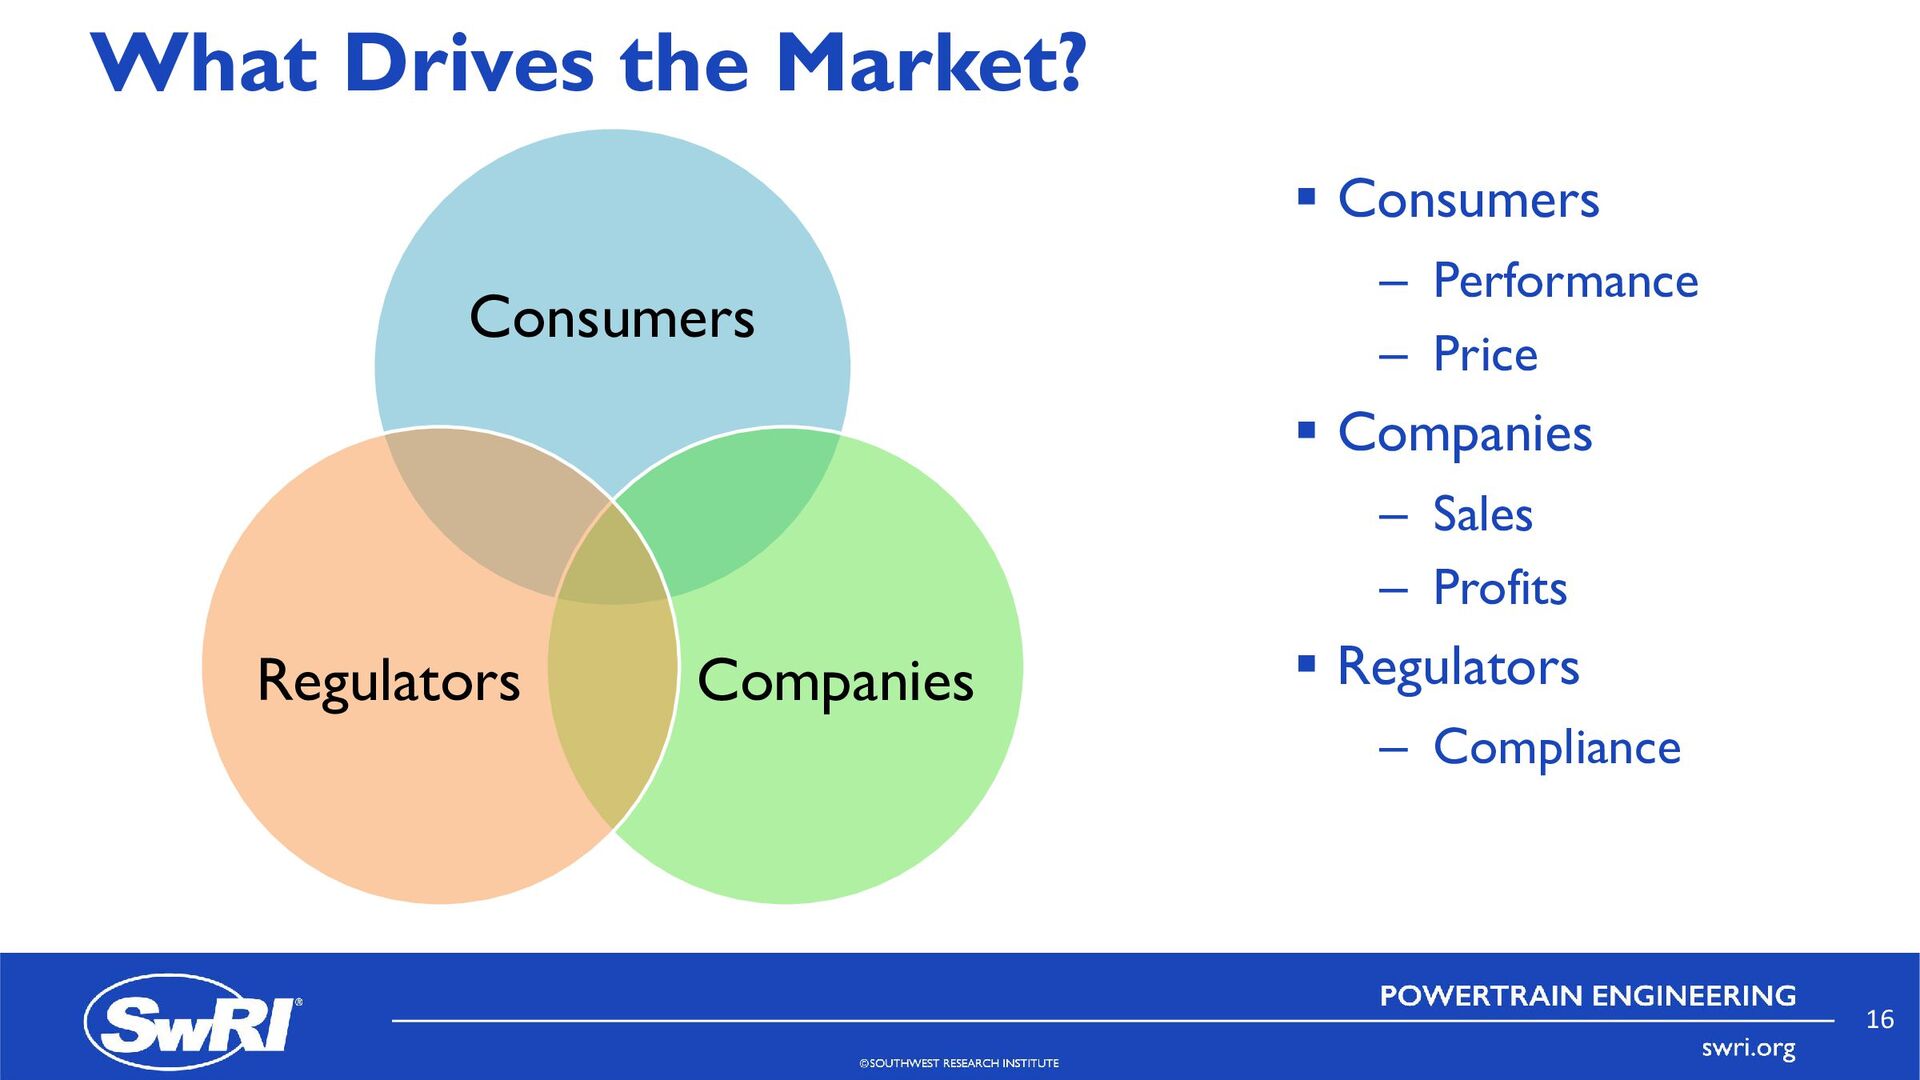
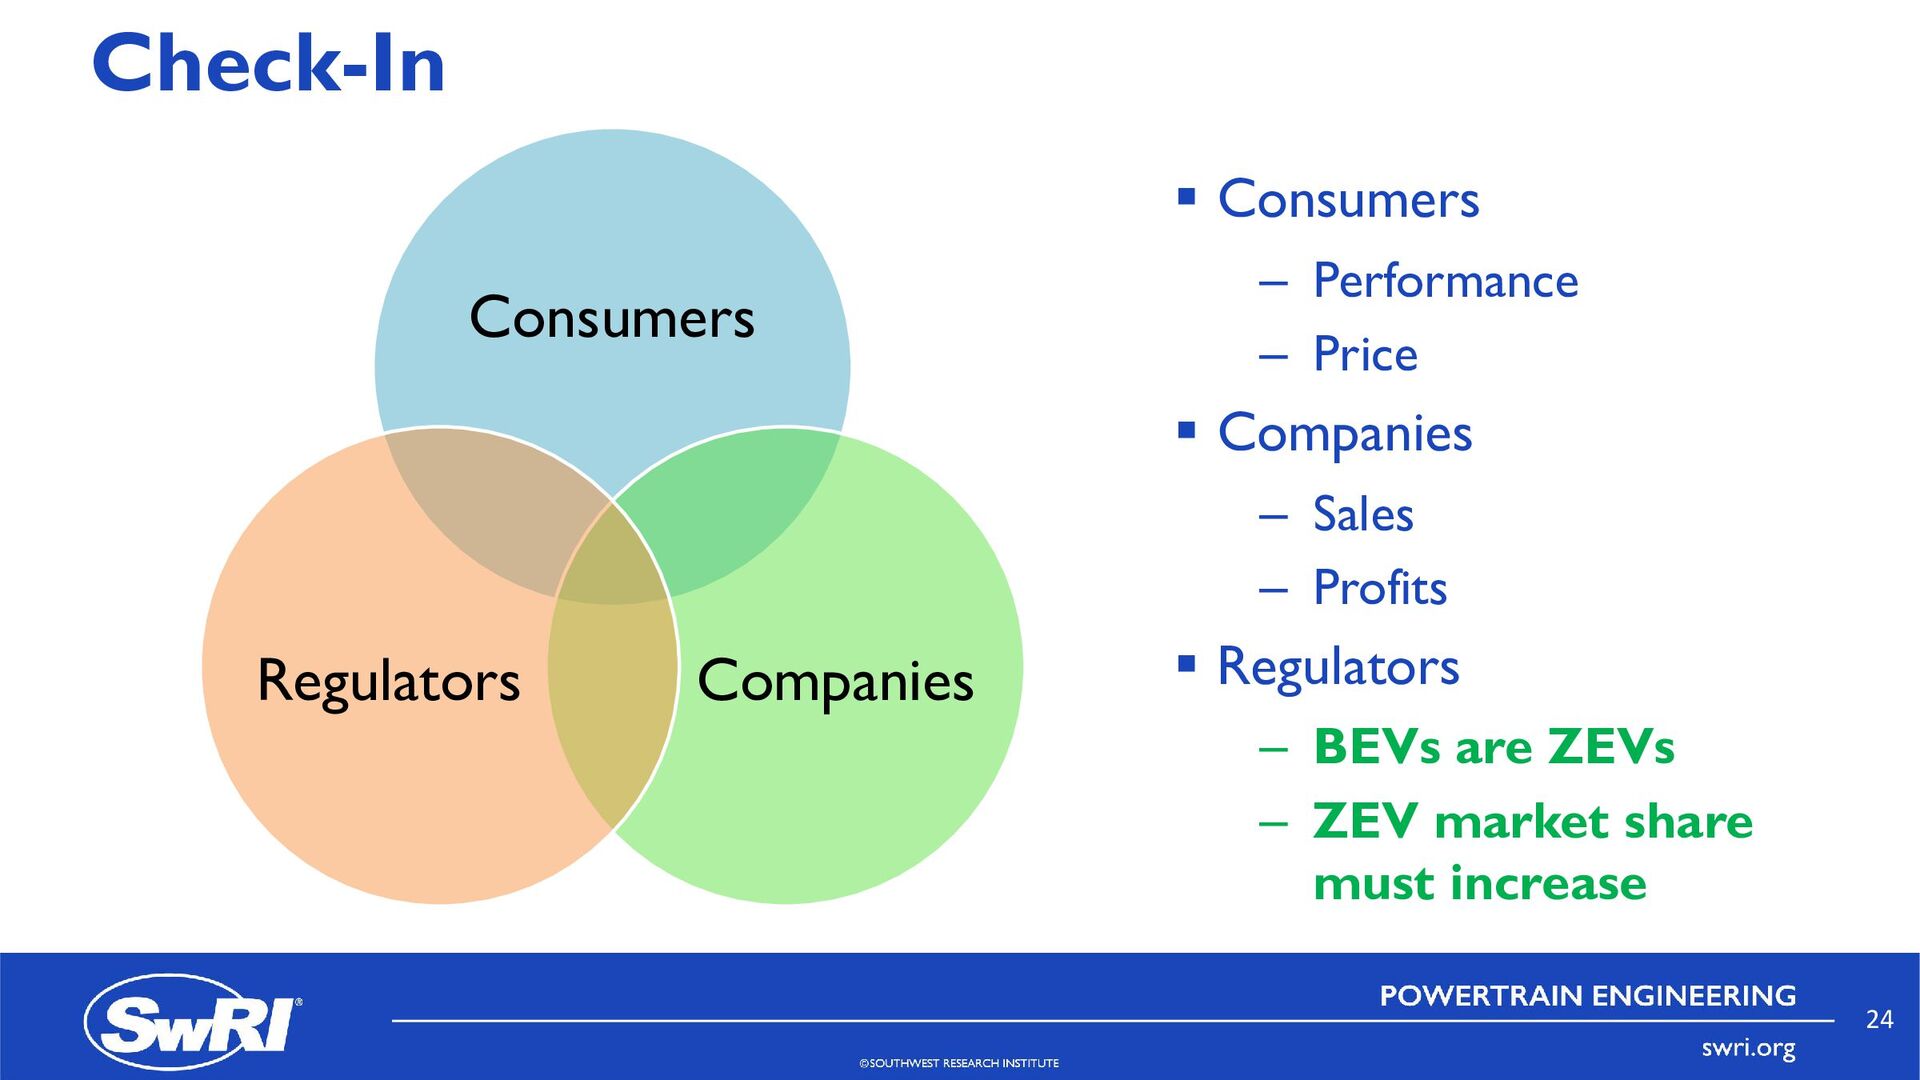
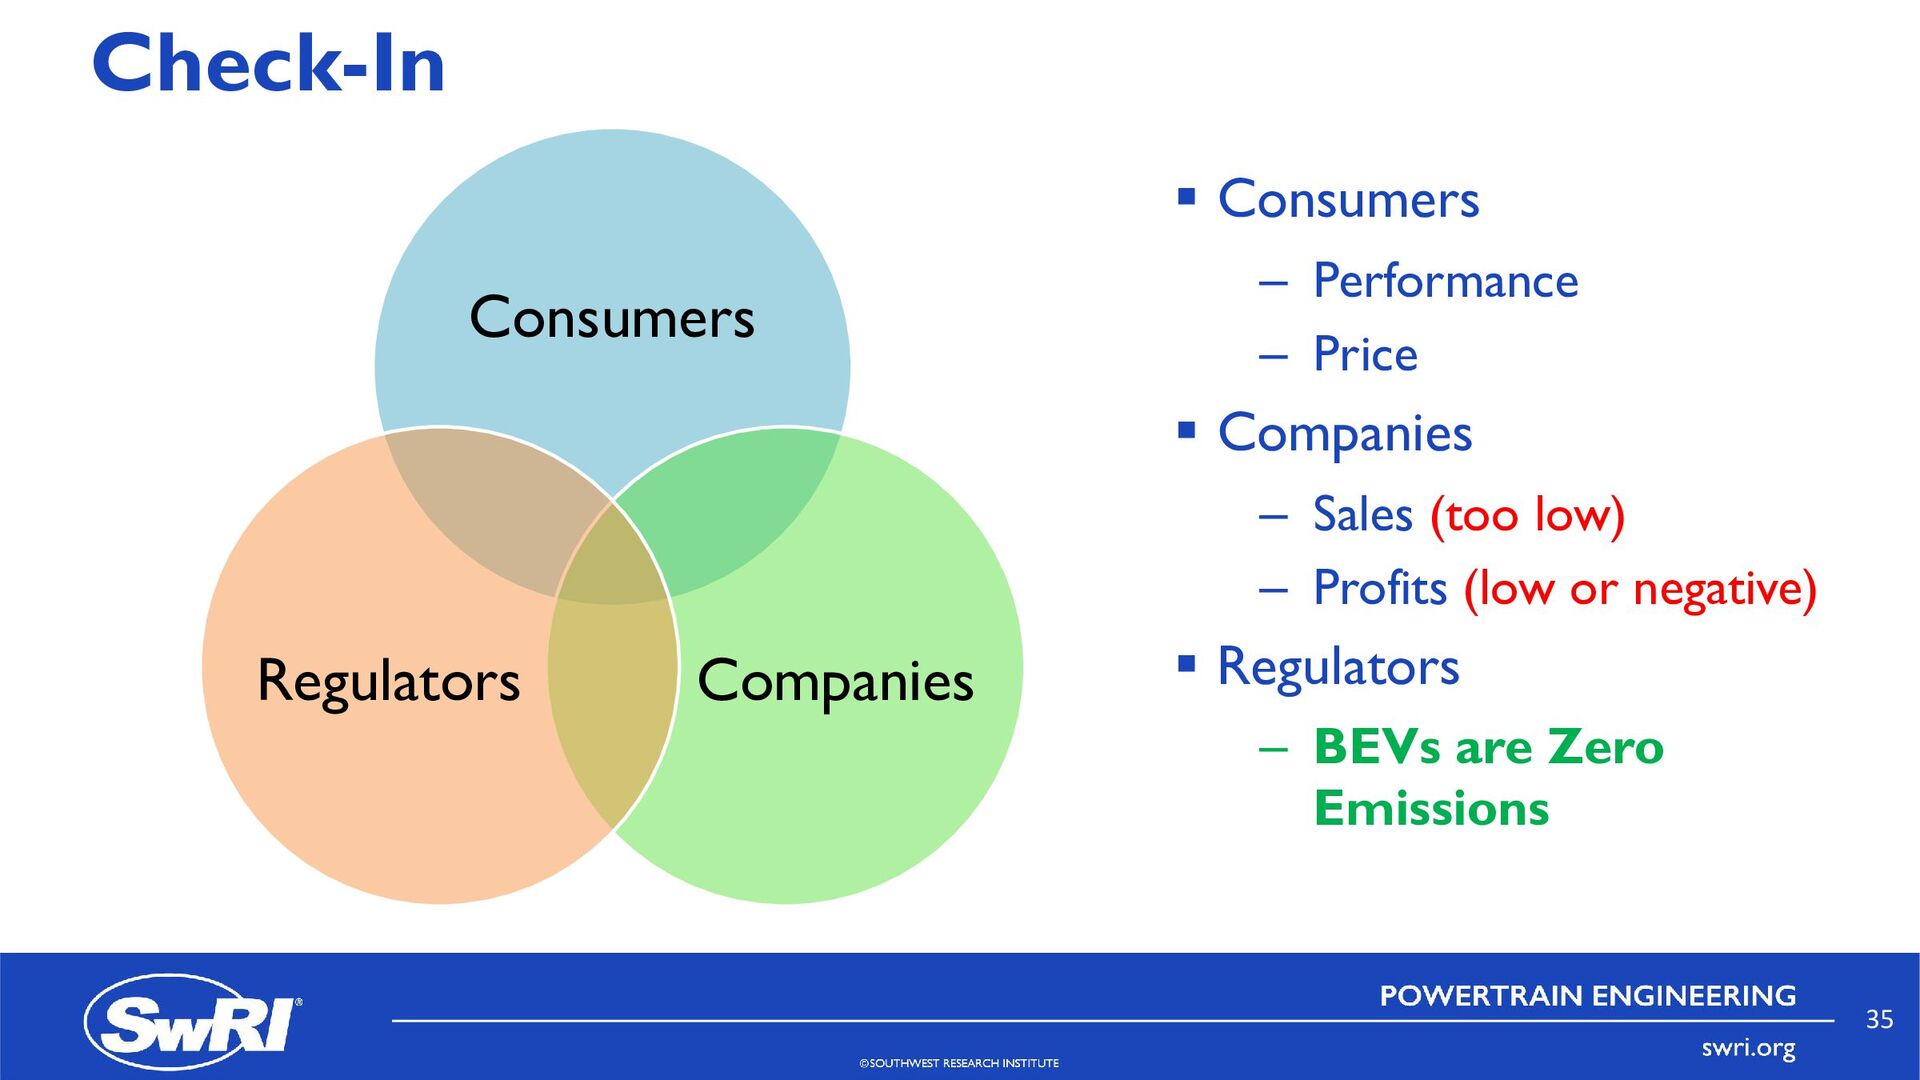
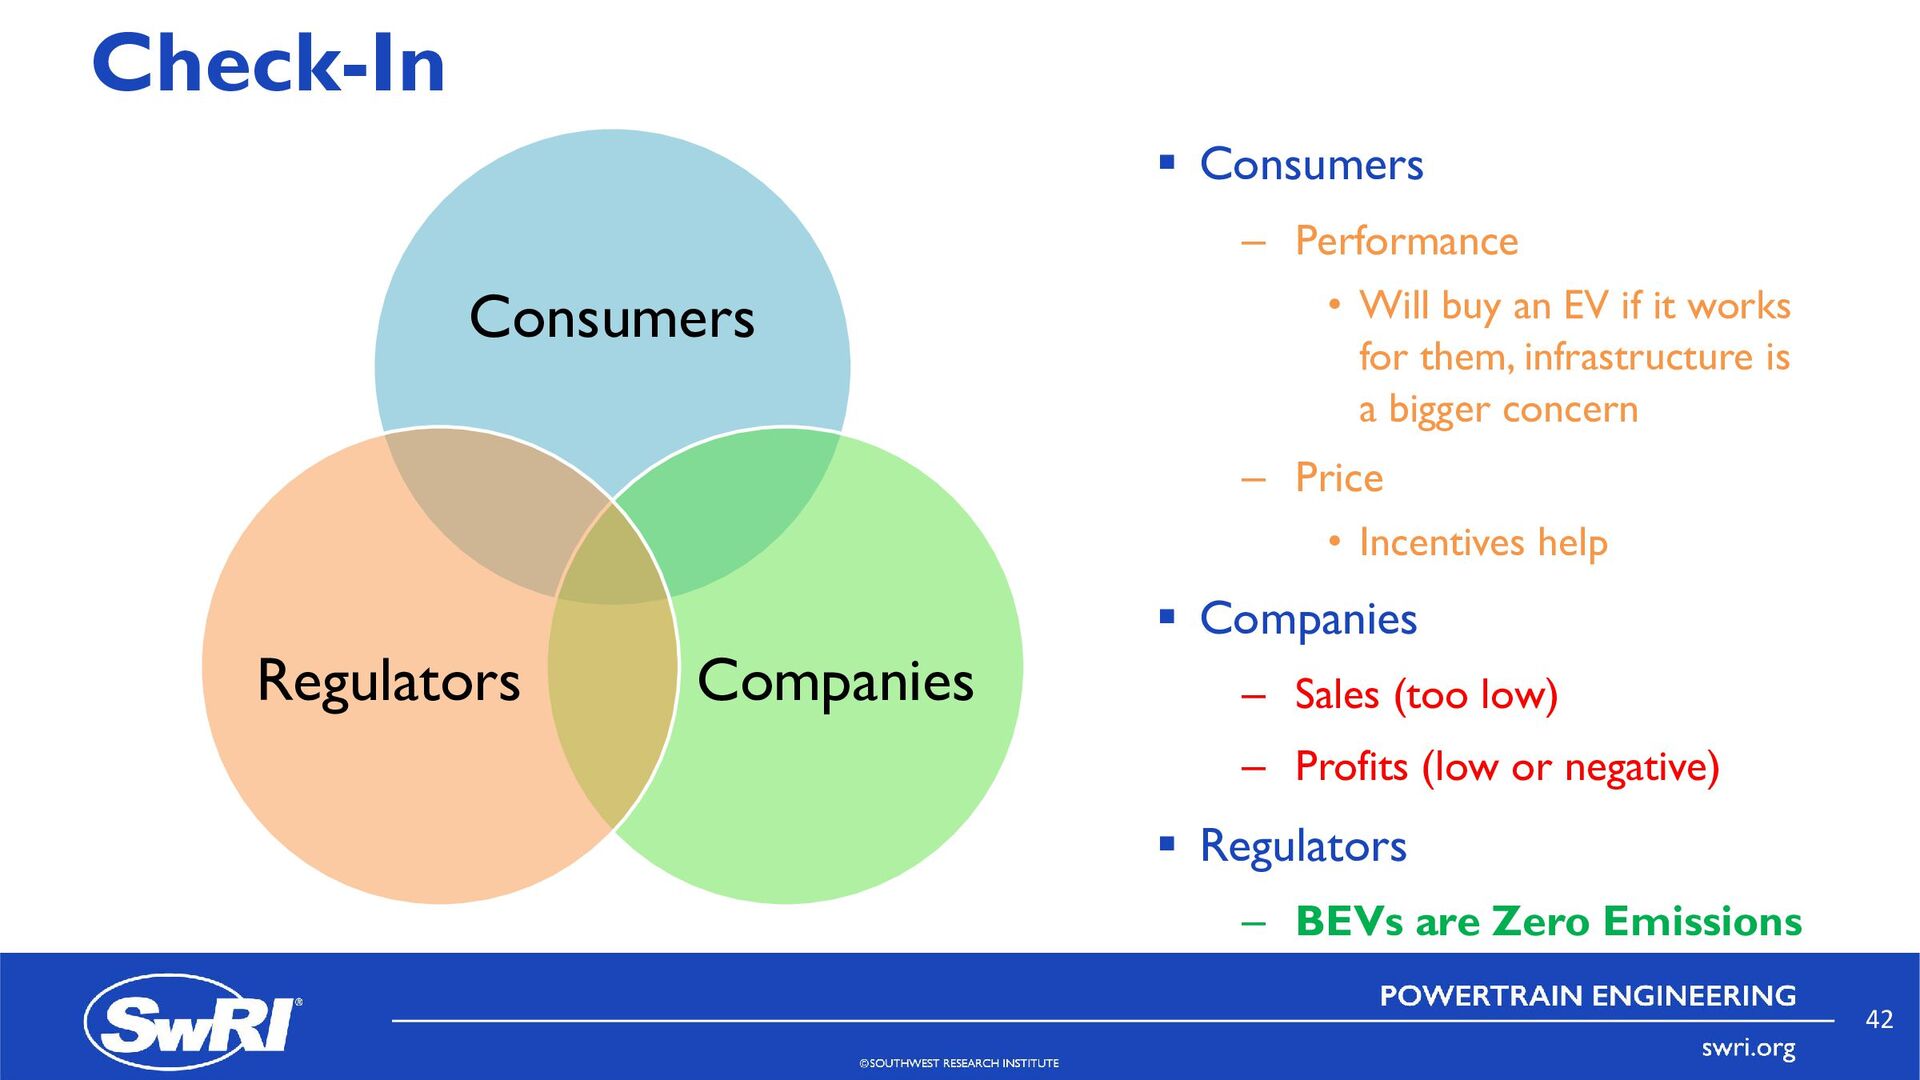
buy an EV if it works for them, infrastructure is a bigger concern – Price • Incentives help Companies – Sales (too low) – Profits (low or negative) Regulators – BEVs are Zero Emissions 42
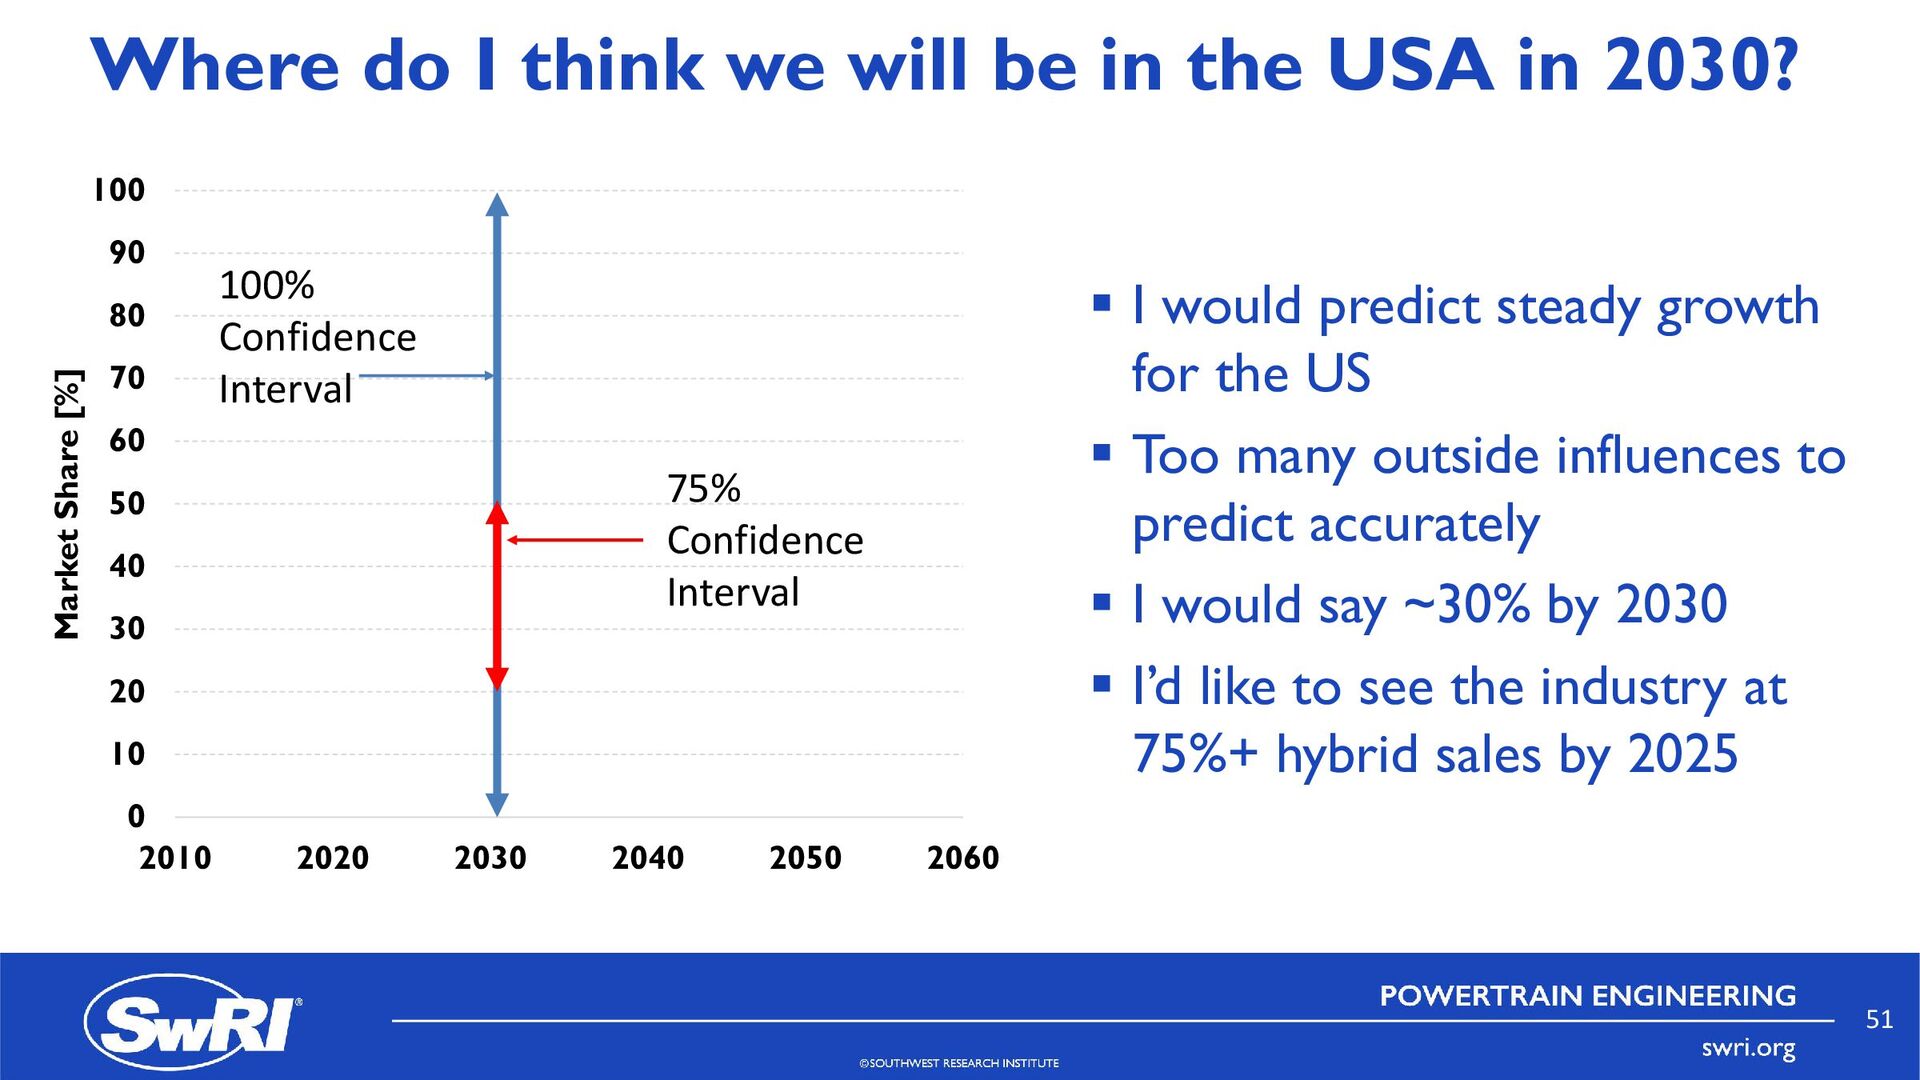
in 2030? 0 10 20 30 40 50 60 70 80 90 100 2010 2020 2030 2040 2050 2060 Market Share [%] I would predict steady growth for the US Too many outside influences to predict accurately I would say ~30% by 2030 I’d like to see the industry at 75%+ hybrid sales by 2025 100% Confidence Interval 75% Confidence Interval 51
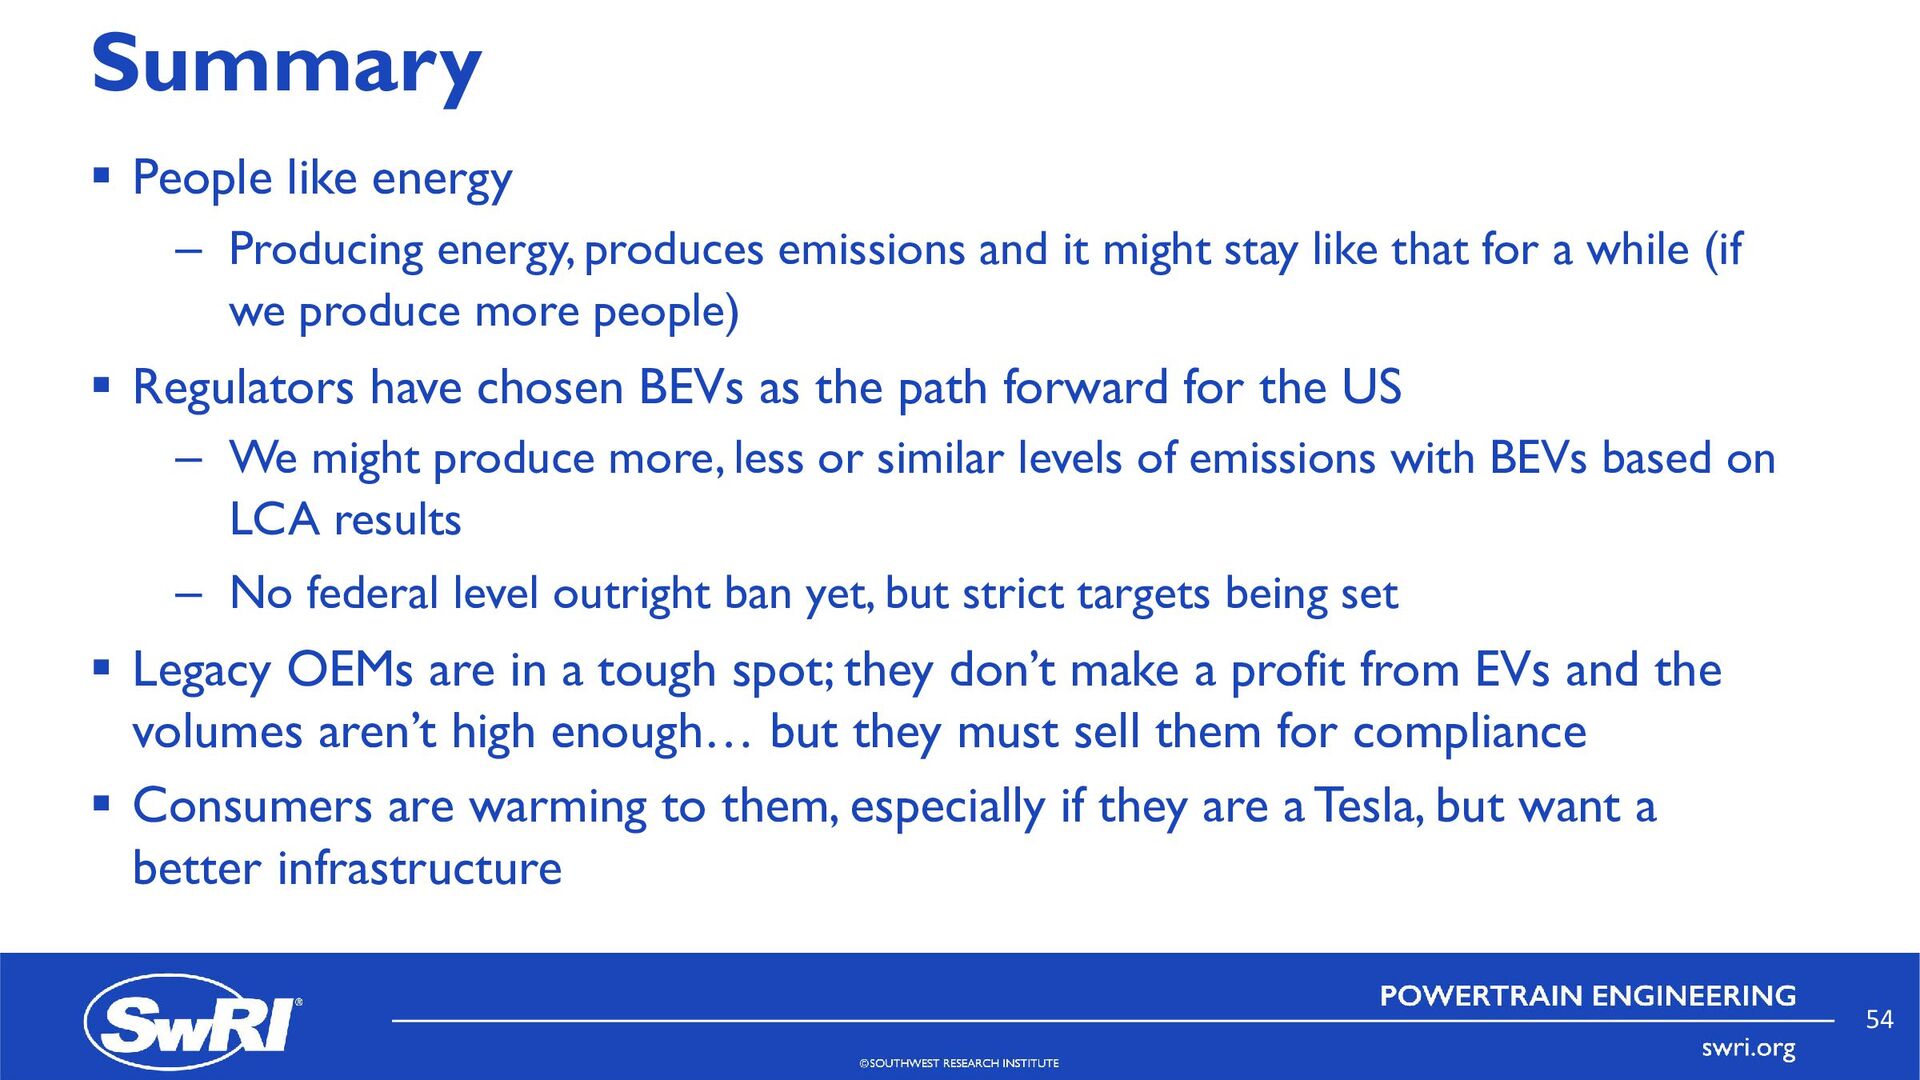
and it might stay like that for a while (if we produce more people) Regulators have chosen BEVs as the path forward for the US – We might produce more, less or similar levels of emissions with BEVs based on LCA results – No federal level outright ban yet, but strict targets being set Legacy OEMs are in a tough spot; they don’t make a profit from EVs and the volumes aren’t high enough… but they must sell them for compliance Consumers are warming to them, especially if they are a Tesla, but want a better infrastructure 54
![Thank You! Graham Conway, PhD [email protected] (210) 522-5134 (office) (210)](https://files.speakerdeck.com/presentations/ff43de2c44c14f21ae2e81321d84f3e3/slide_54.jpg)