Email: [email protected] PhD, DORSAL Lab (Ecole Polytechnique de Montreal). Loves systems engineering, performance analysis, hardware tracing and runtime security Alban Crequy CTO, Kinvolk GmbH. Github: alban Twitter: @albcr Email: [email protected] Loves Kubernetes, networking, security, systemd and containers at the lower-levels of the system.
applications pre-emptively at build-time and carrying forward its security in production... seamlessly! Blog: shiftleft.io/blog Github: ShiftLeftSecurity Twitter: ShiftLeftInc Contact: shiftleft.io/contact
Mic r i s Ap ic o Ap ic o OS - Tracing 101 - Low-impact recording on high frequency events such as syscalls, network events, scheduling, interrupts or process/container specific functions - Used for performance analysis and security
map /* This is a key/value store with the keys being the cpu number * and the values being a perf file descriptor. */ struct bpf_map_def SEC("maps/events") events = { .type = BPF_MAP_TYPE_PERF_EVENT_ARRAY, .key_size = sizeof(int), .value_size = sizeof(__u32), .max_entries = 1024, .map_flags = 0, .pinning = PIN_GLOBAL_NS, .namespace = "traceleft", }; typedef struct { uint64_t timestamp; int64_t tgid; int64_t state; ... } tcp_event_t;
file auditing or monitoring tools - eBPF+Kprobes based, supported from kernel v4.4+ - Also a binary, traceleft that is a reference implementation - Can generate a single binary - with a modular trace battery. - Everything is compiled based on detailed event configuration and platform information - Why? - Configurable event tracing that Just Works™ ...*coughs* - Programmable tracing, supported on older kernels TraceLeft Overview
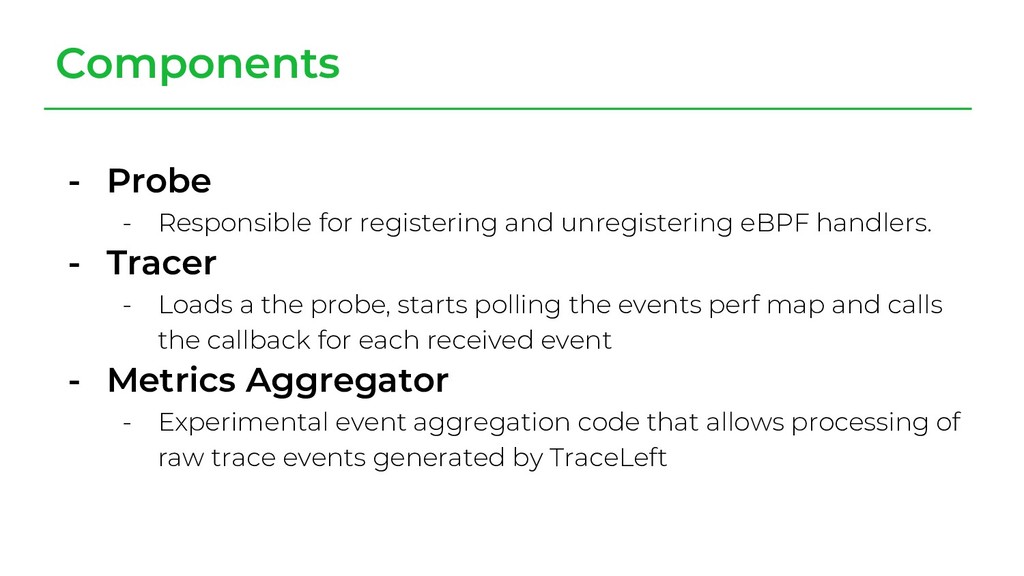
event to be received - Goes through /sys/kernel/debug/tracing/events/syscalls/* and generates structures - Generator - Generates the eBPF handler program sources in C - Battery - Compiled eBPF programs battery (a kernel v4.4 pre-compiled battery has been tested to work till kernel v4.16) Components
- Tracer - Loads a the probe, starts polling the events perf map and calls the callback for each received event - Metrics Aggregator - Experimental event aggregation code that allows processing of raw trace events generated by TraceLeft Components
auditing system name open pid 5518 program id 0 return value 8 hash 3355305515321265881 Filename "/etc/passwd" Flags 524288 Mode 438 name open pid 5518 program id 0 return value 8 hash 3355305515321265881 Filename "/etc/passwd" Flags 524288 Mode 438 name open pid 5522 program id 0 return value 11 hash 10268694621493151422 Filename "/proc/sys/kernel/ngroups_max" Flags 0 Mode 0 name open pid 5522 program id 0 return value 11 hash 5259532013223916043 Filename "/etc/group" Flags 524288 Mode 438
be short-lived (shell scripts) - Application running as a systemd unit - In a different cgroup - Maybe in different namespaces - Application running in a container - In a different cgroup - In different namespaces Matching pids and applications
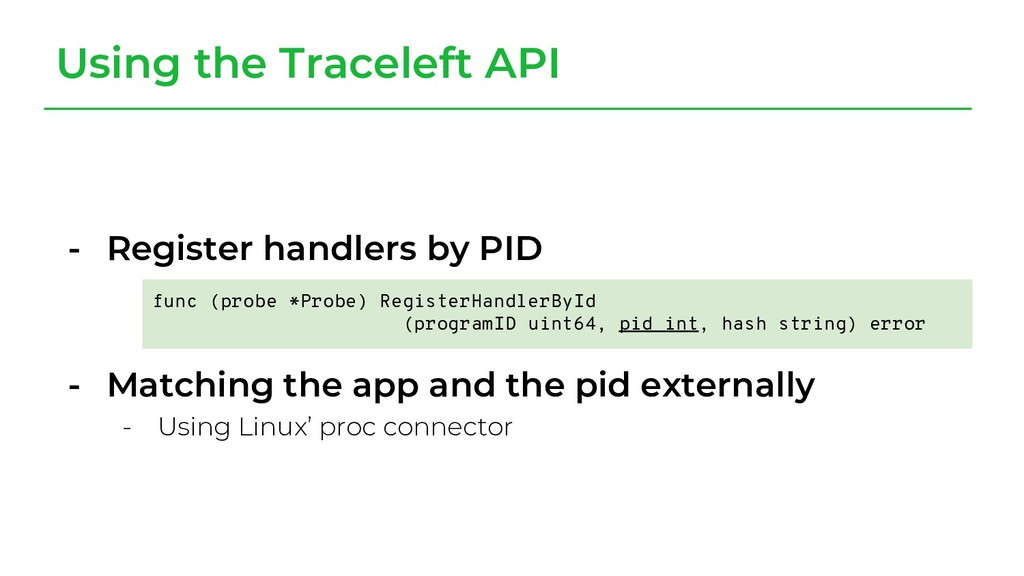
the pid externally - Using Linux’ proc connector Using the Traceleft API func (probe *Probe) RegisterHandlerById (programID uint64, pid int, hash string) error
- Can’t keep track of namespaces or cgroups - Need to check in /proc, asynchronously - /proc/$PID/{exe,comm,cgroup,ns} - Races - Short-lived processes: can’t read procfs fast enough - Missing early events that happened before the BPF handler was installed Proc connector limitations
open(const char *pathname, int flags); In kernel: len = strncpy_from_user(kname, filename, EMBEDDED_NAME_MAX); In the eBPF kprobe: ret = bpf_probe_read(&evt.filename, sizeof(evt.filename), (void *) PT_REGS_PARM2(args));
only in Linux 4.11 - TraceLeft copies 256 bytes - Might be too little - Danger of reading too much - A page border might cause EFAULT - open() use NULL-terminated strings Problems with strings virtual memory of a process mmap’ed region 256 bytes fd = open(ptr, flags);
depends on: - mntns - root, cwd, or dirfd with openat() - at every components, possible symlink - Cannot be evaluated atomically from eBPF Path lookups fd = open(“/data/foo.txt”, O_RDWR);
not the full connection tuple - We add kprobes on inet_csk_accept(), tcp_set_state(), tcp_close(), tcp_v4_connect() Correlating IPs with services ret = connect(sockfd, { IP: 192.168.0.40 } );
wait - Ring buffer has limited size - Default in traceleft: 8 pages (32KiB) per cpu - bpf_perf_event_output() just overwrites previous entries - Counter of lost events Losing events in the perf ring buffer
on function entry - How kretprobes work - Place break exception on function entry - Save the return address of function and replace it by a trampoline - The trampoline does its job and then return to the original address Missing kretprobes
function calls in parallel - Need to save several return addresses - Example: a synchronous accept() syscall - maxactive - Default value: - Since Linux 4.12 (commit 696ced4fb1d7), configurable - In TraceLeft, we chose maxactive=16 Missing kretprobes rp->maxactive = max_t(unsigned int, 10, 2*num_possible_cpus());
Use new BPF helper functions - bpf_get_current_cgroup_id - bpf_probe_read_str - Use LLVM API directly - Avoid using clang, generation of sources etc. Future Work
New Architecture for User-level Packet Capture, Winter USENIX Conference (1993) San Diego - [Tu et al 2017] Joe Stringer, and Justin Pettit. 2017. Building an Extensible Open vSwitch Datapath. SIGOPS Operating Systems Review - [Borkmann 2016-1] Advanced programmability and recent updates with tc’s cls_bpf, NetDev 1.2 (2016) Tokyo Research Papers
cls bpf, NetDev 1.1 (2016), Seville - [Clément 2016] Linux Kernel packet transmission performance in high-speed networks, Masters Thesis (2016), KTH, Stockholm - [Sharma et al. 2016] Enhanced Userspace and In-Kernel Trace Filtering for Production Systems, J. Comput. Sci. Technol. (2016), Springer US Research Papers
![- [McCanne et al. 1993] The BSD Packet Filter: A](https://files.speakerdeck.com/presentations/067d4663ea084edba5a88b63dc96a383/slide_58.jpg)
![- [Borkmann 2016-1] On getting tc classifier fully programmable with](https://files.speakerdeck.com/presentations/067d4663ea084edba5a88b63dc96a383/slide_59.jpg)