Upgrade to Pro — share decks privately, control downloads, hide ads and more …

20190809 CCCJ-CFAJ Joint Seminar@Canadian Embassy

CFA Japan
August 09, 2019

20190809 CCCJ-CFAJ Joint Seminar@Canadian Embassy

Title: Trend in North American Pension Market and Introduction of Value-Oriented Approach

Seminar Outline:

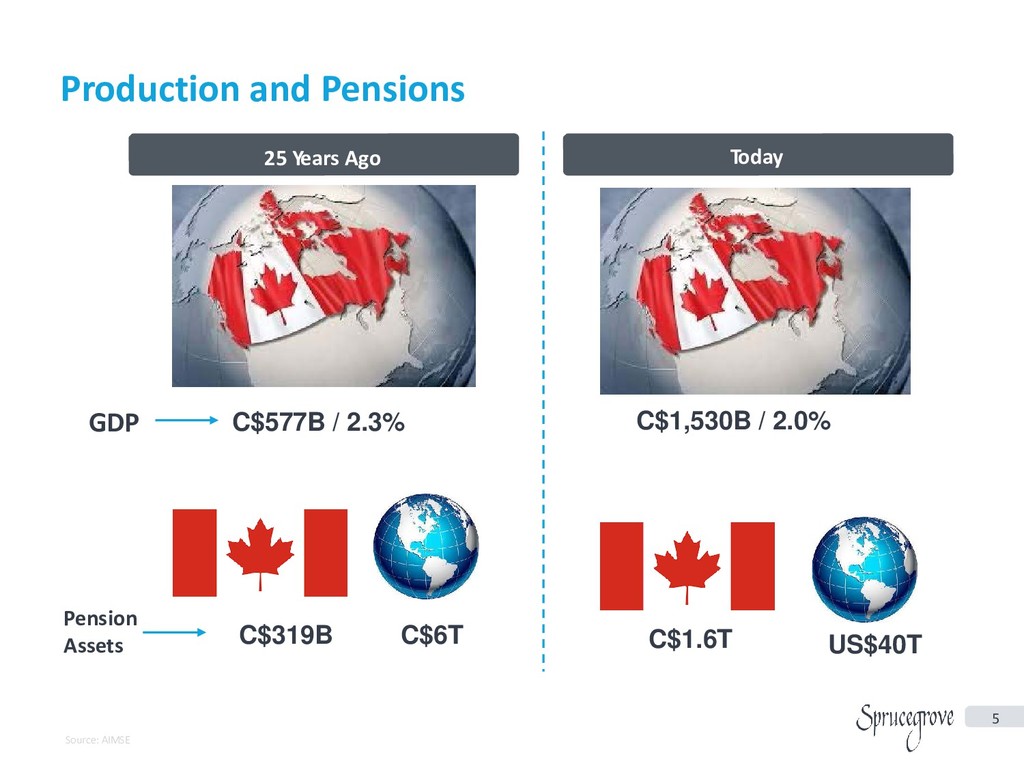
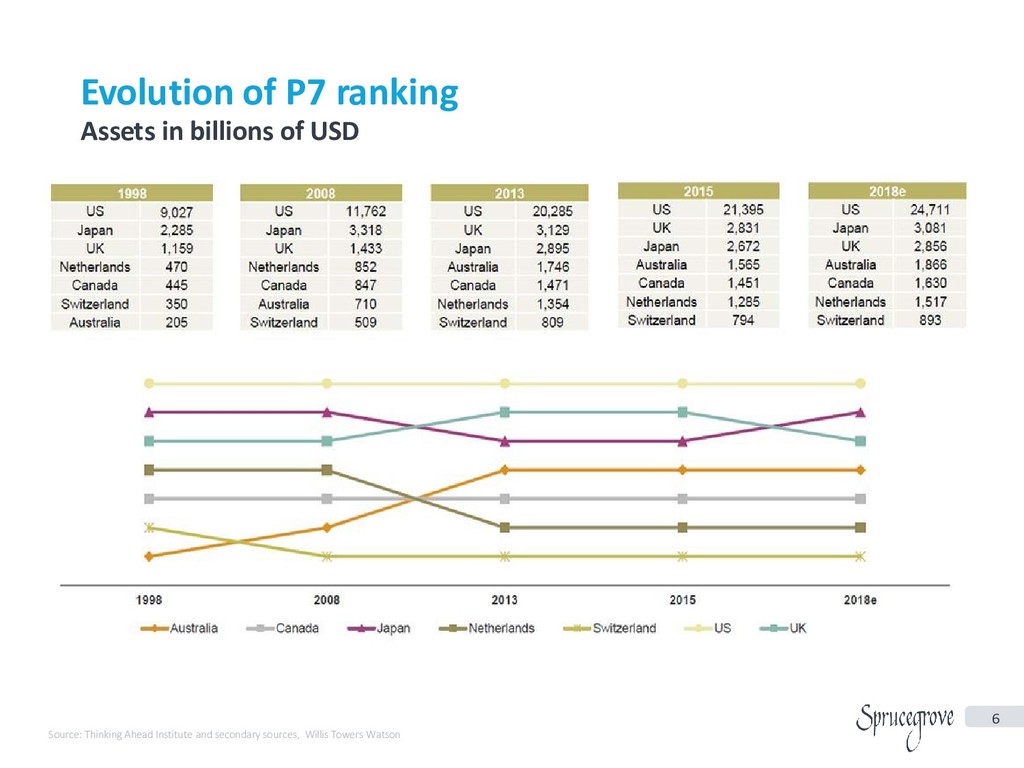
North American pension funds have grown their assets more quickly than their global peers over the past decade. This was driven by the strengthening US dollar and a greater emphasis on investing in equities, which posted strong gains. Overall the world’s biggest pension funds have also begun growing again. This growth is, in part, symptomatic of bond-buying programmes by the world’s biggest central banks, known as quantitative easing, which have driven asset prices up in the decade since the financial crisis.Over the same period, low interest rates have made returns increasingly elusive for investors. Japan’s Government Pension Investment Fund is an example of an investor that has improved returns after a shift in strategy. In 2014, the GPIF signalled a change into riskier assets and away from low-yielding bonds.

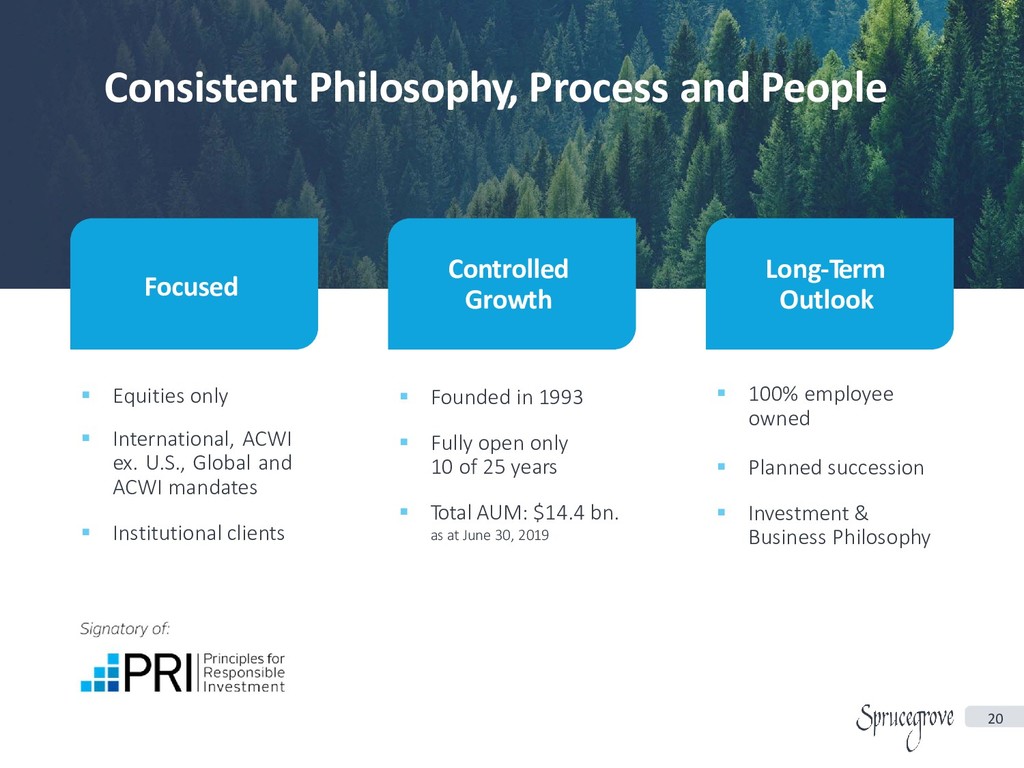
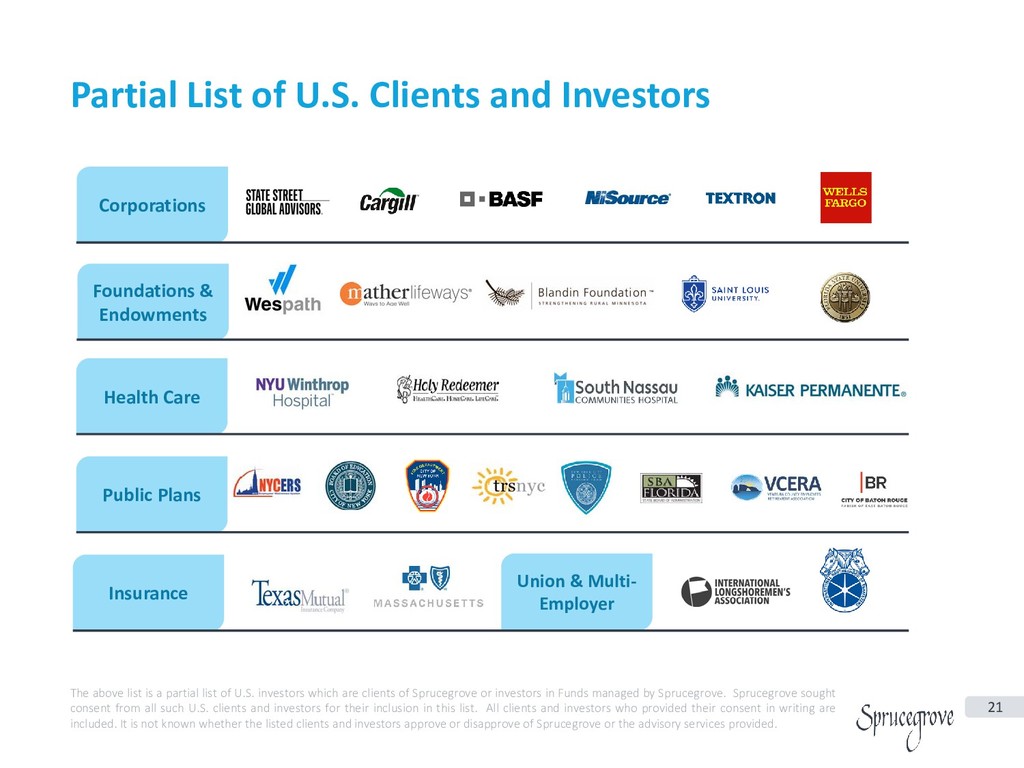
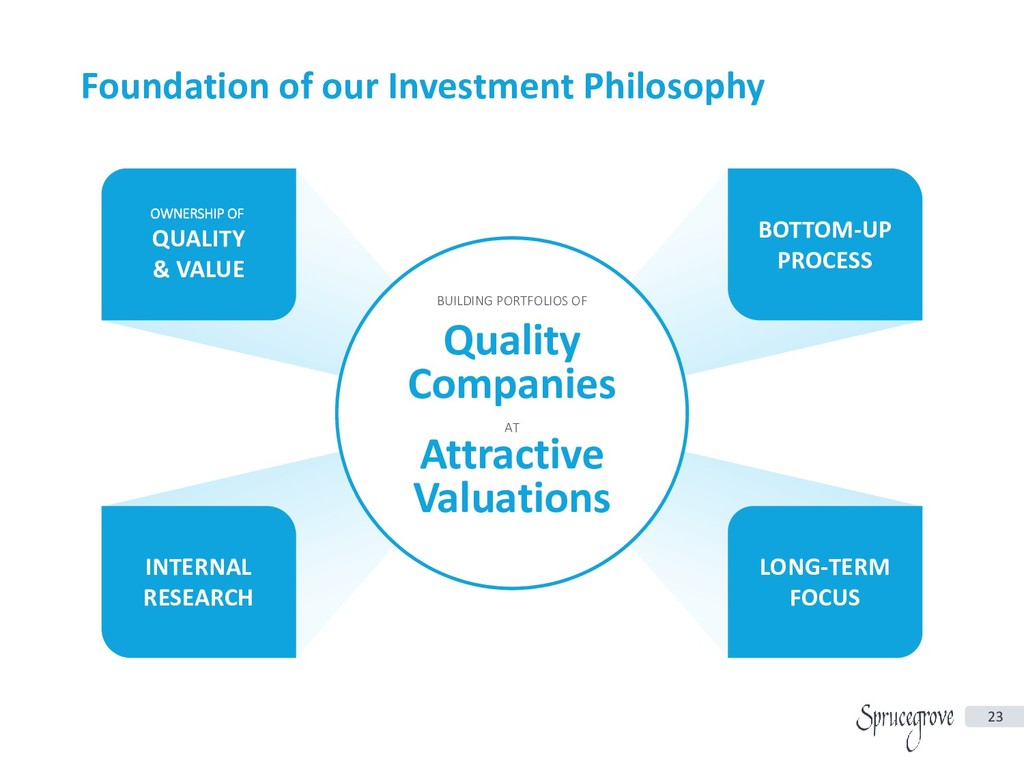
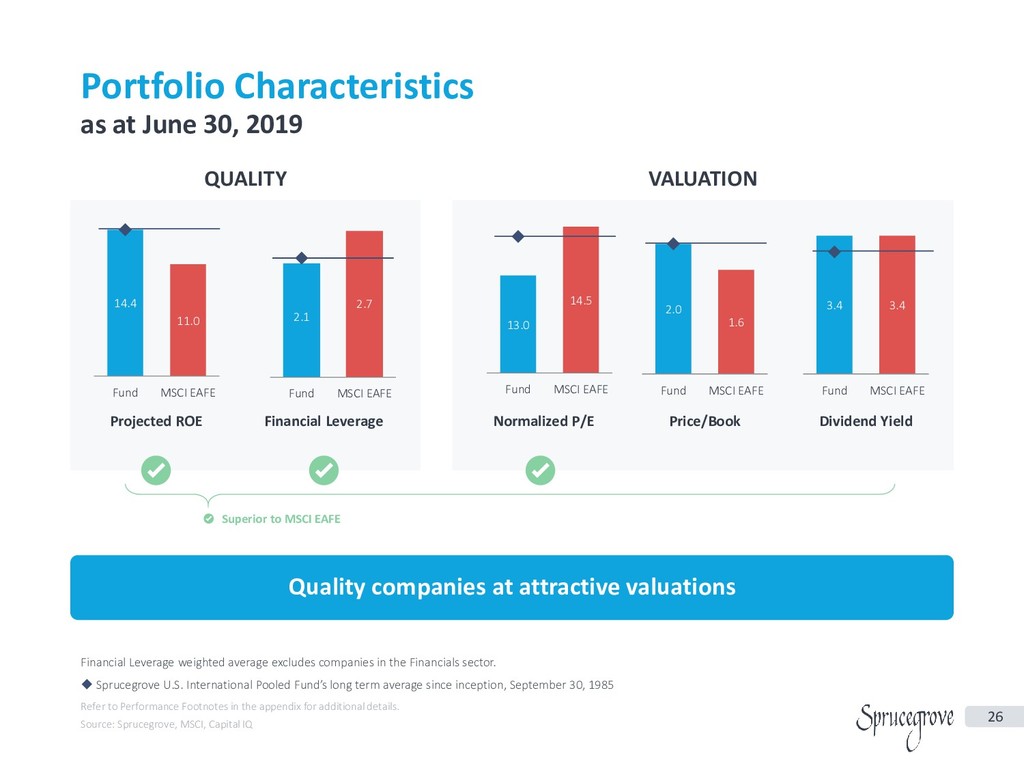
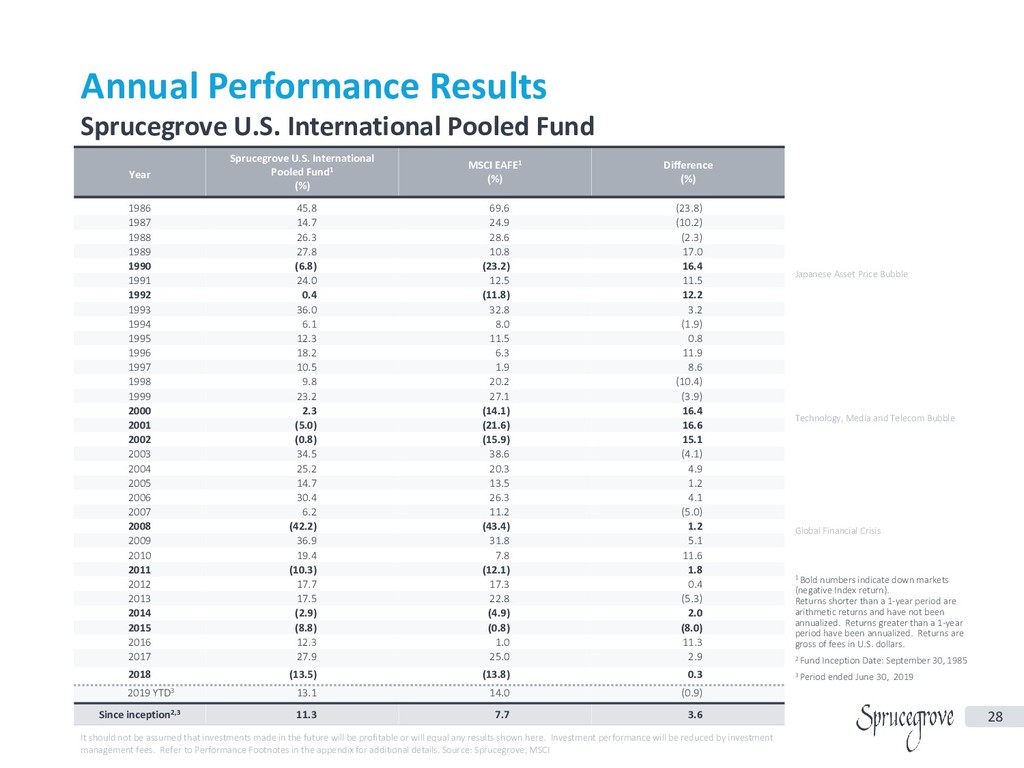
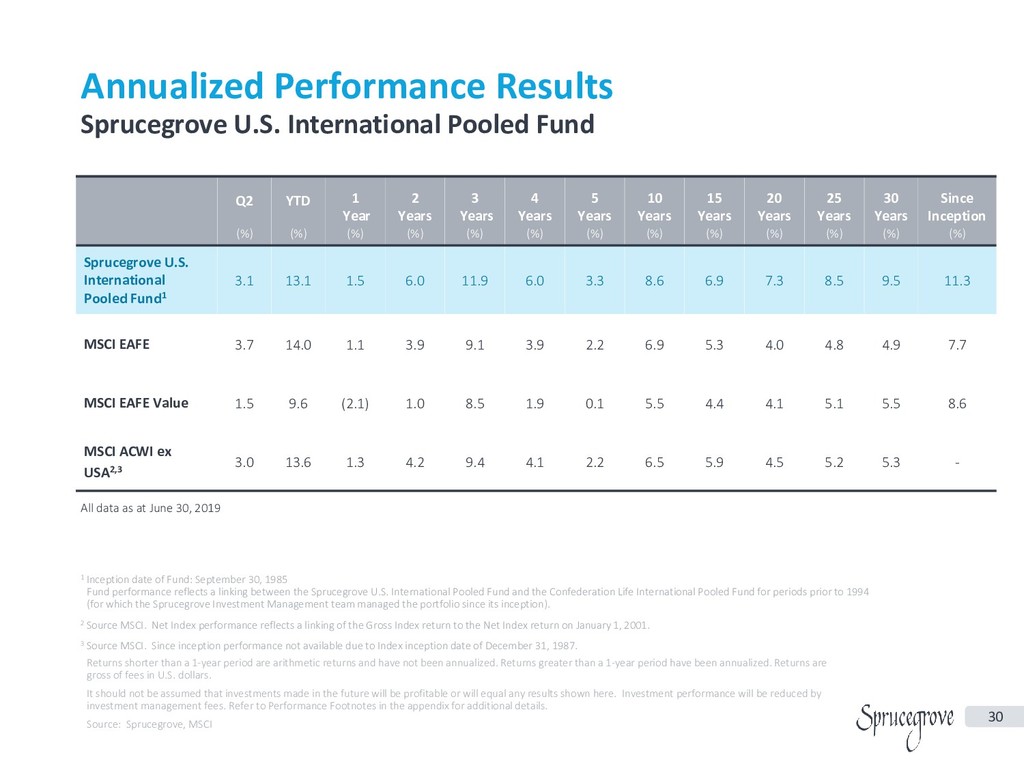
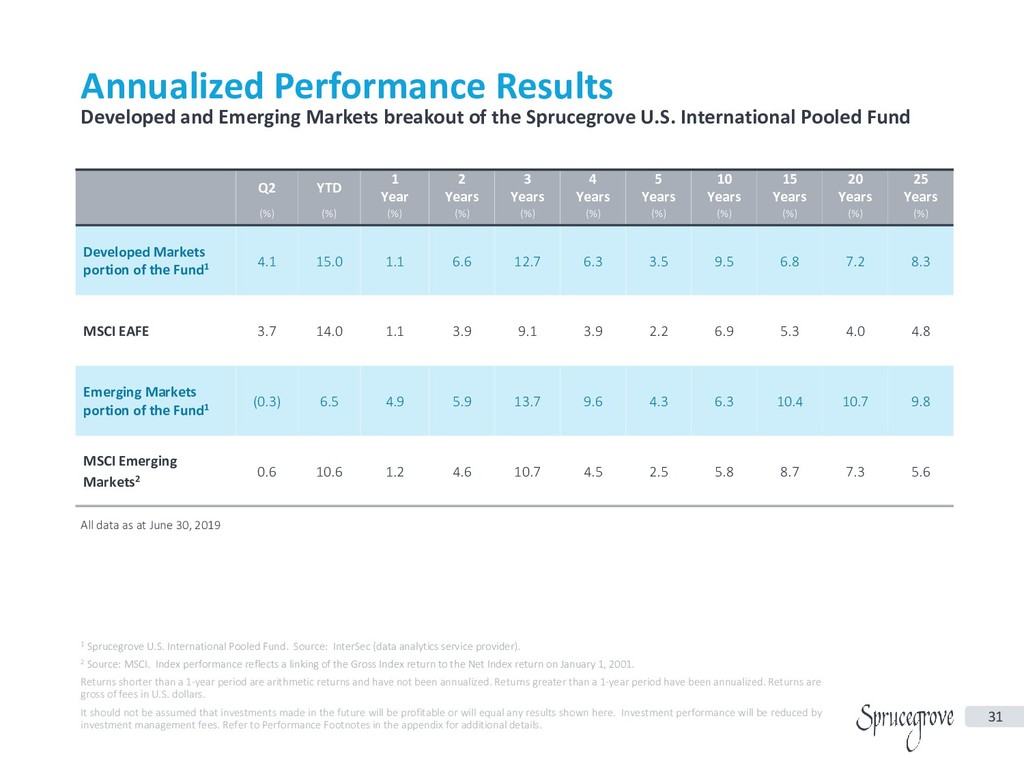
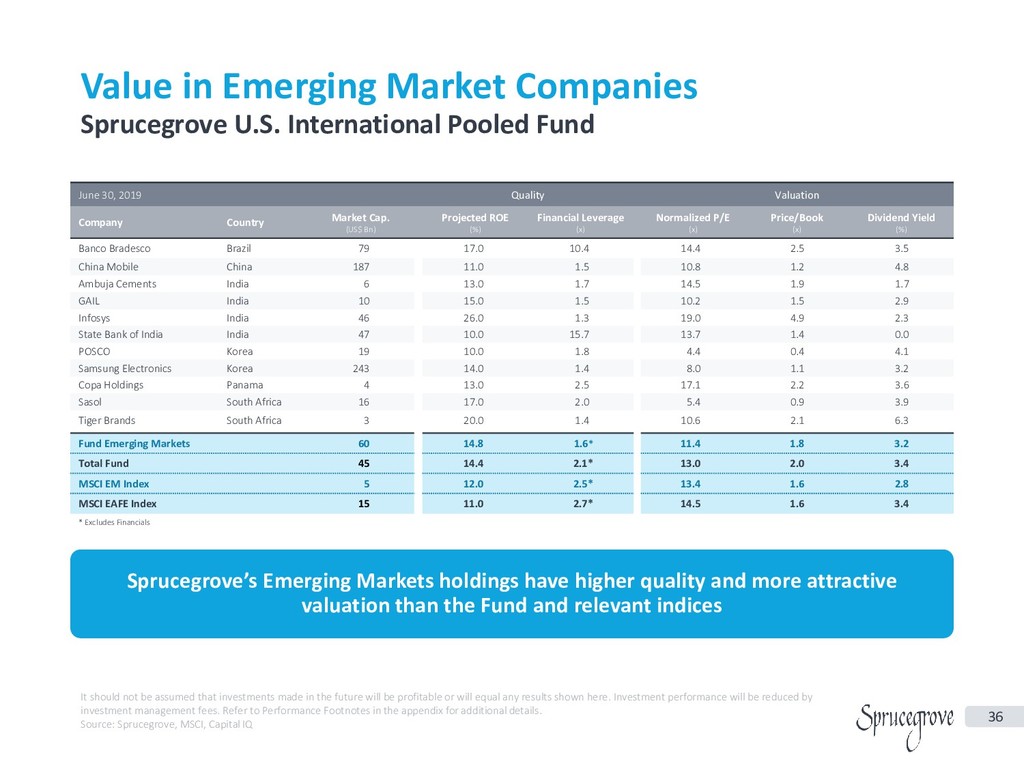
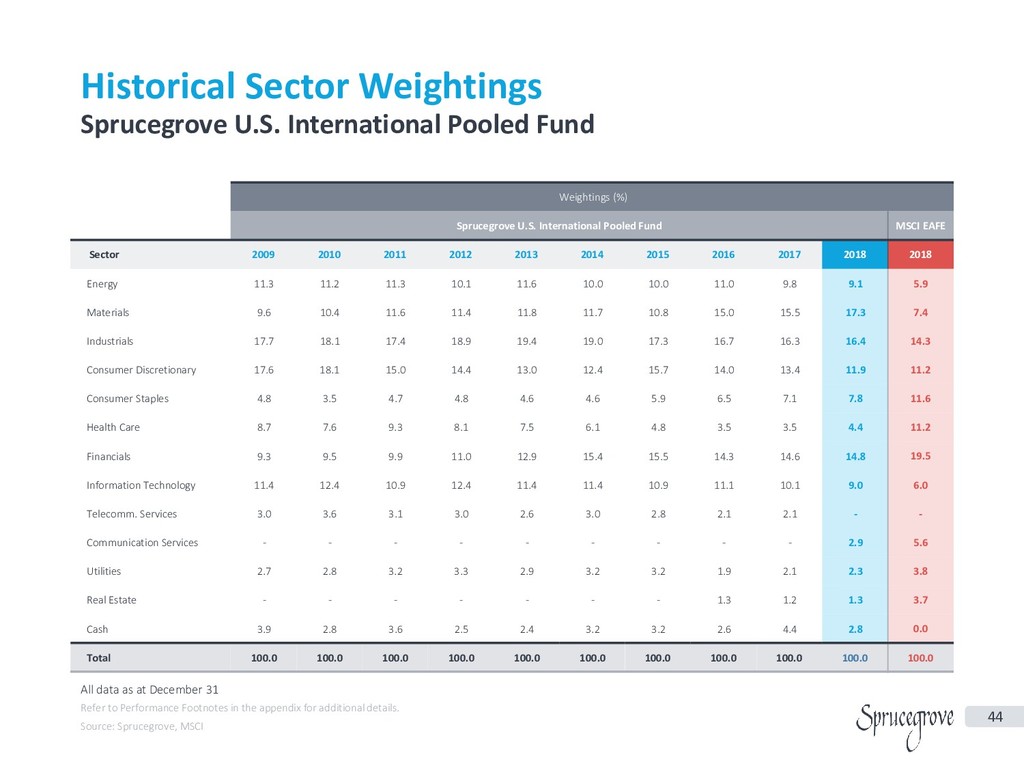
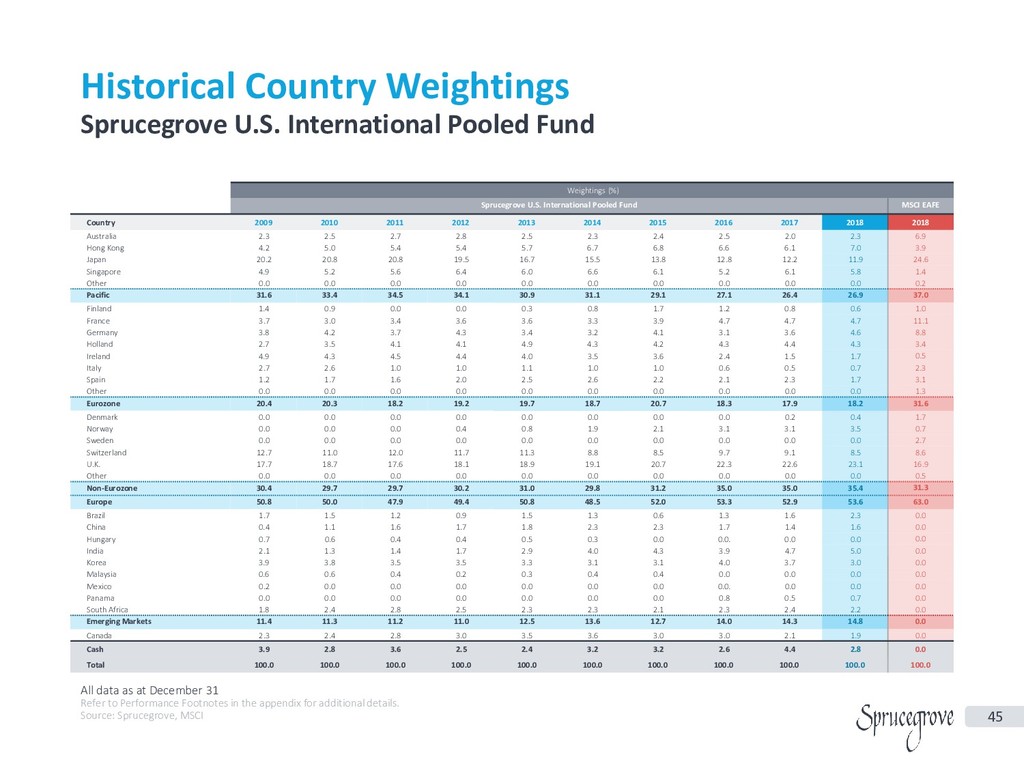
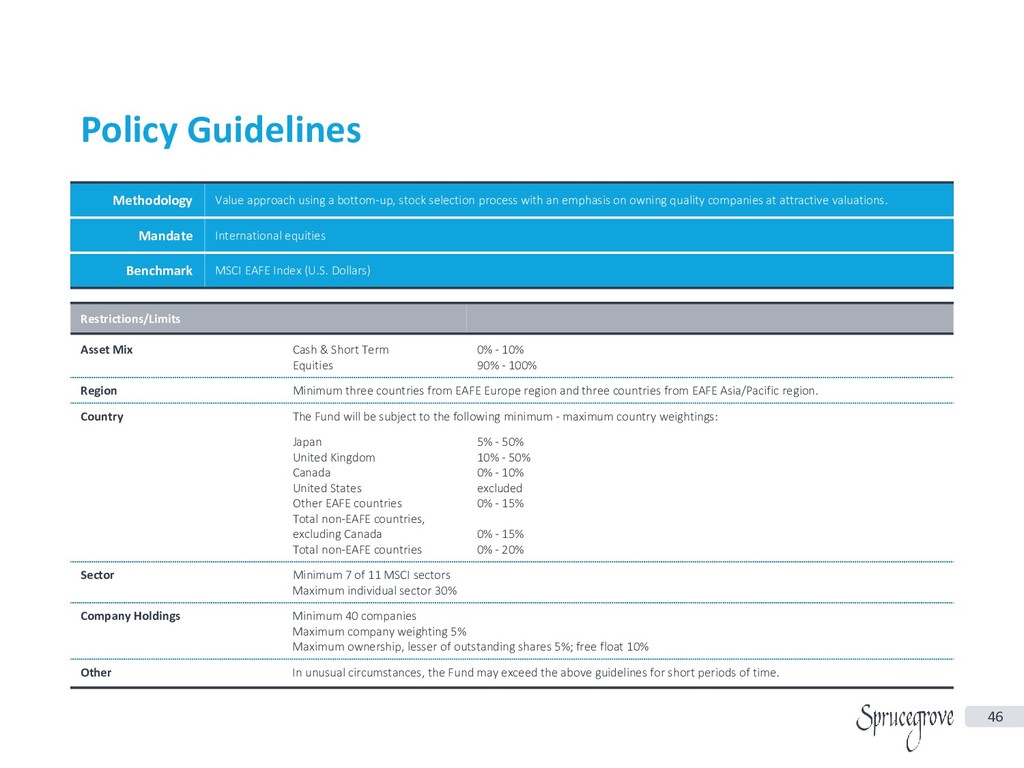
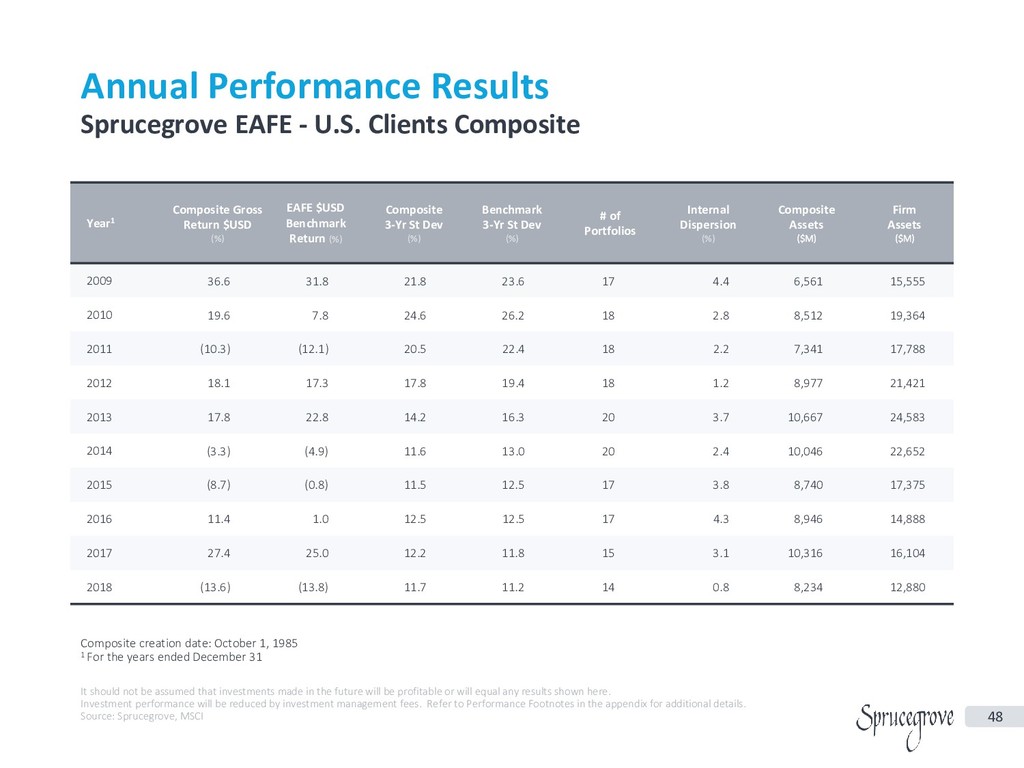
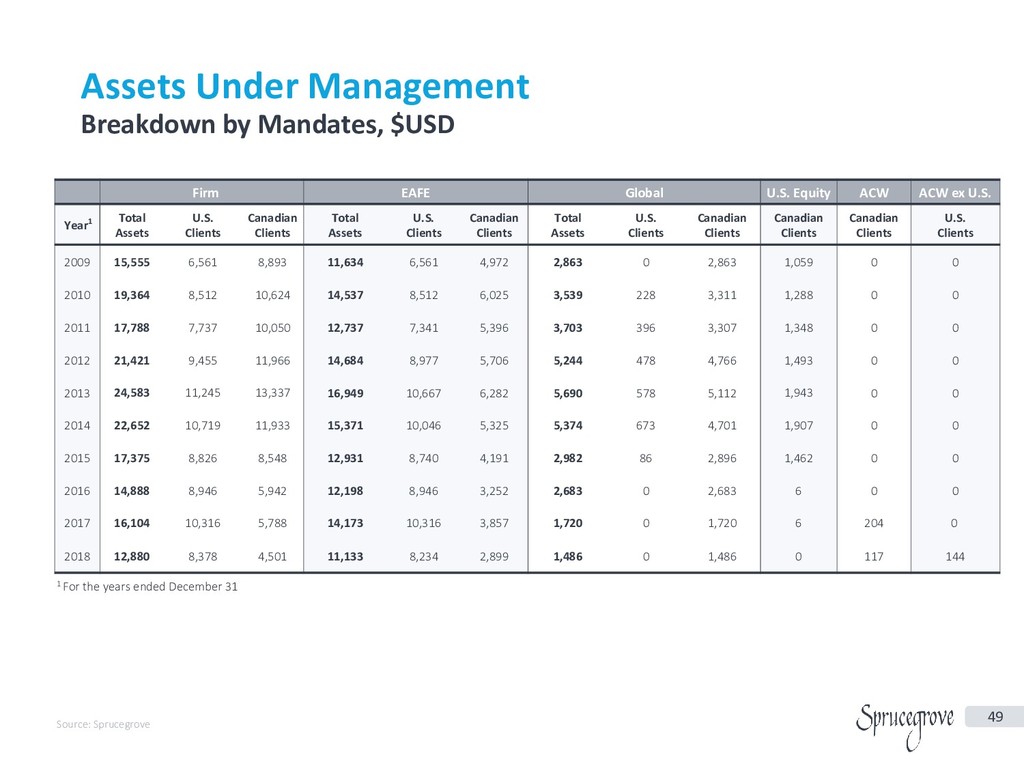
With that background, we look forward to introducing a value oriented investment approach by a Canadian based firm has demonstrated a proven track record of managing US and Canadian pension assets in global equity markets for over 30 years.

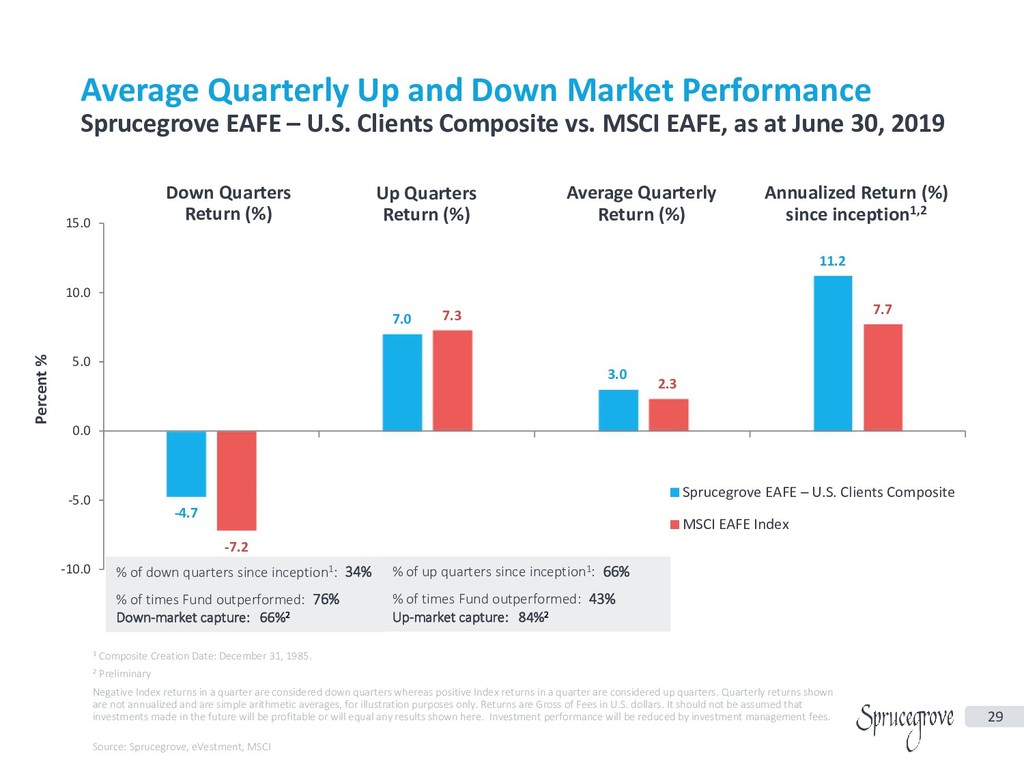
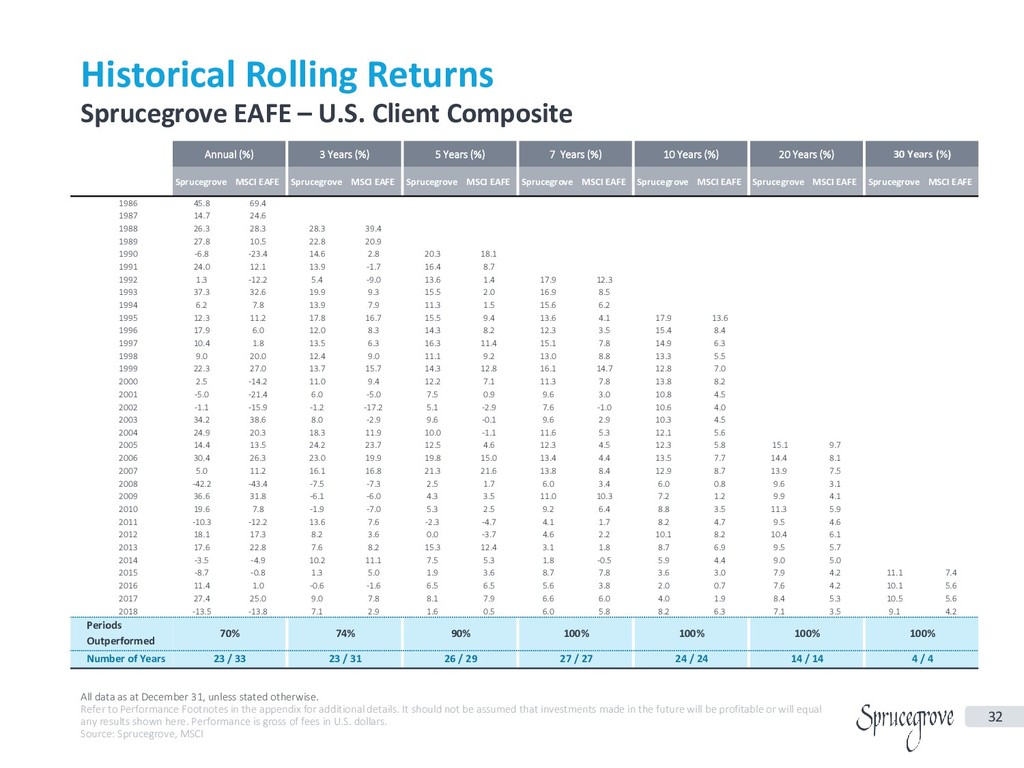
We invite you to join us for a presentation by an international equities manager that is focused on delivering outperformance over the benchmark with less risk in the long run.

10:00-10:15 Registration
10:15-10:20 Opning Remarks by Masataka Aoto, CFA (Board Director, Chair of Program Committee, CFA Society Japan)
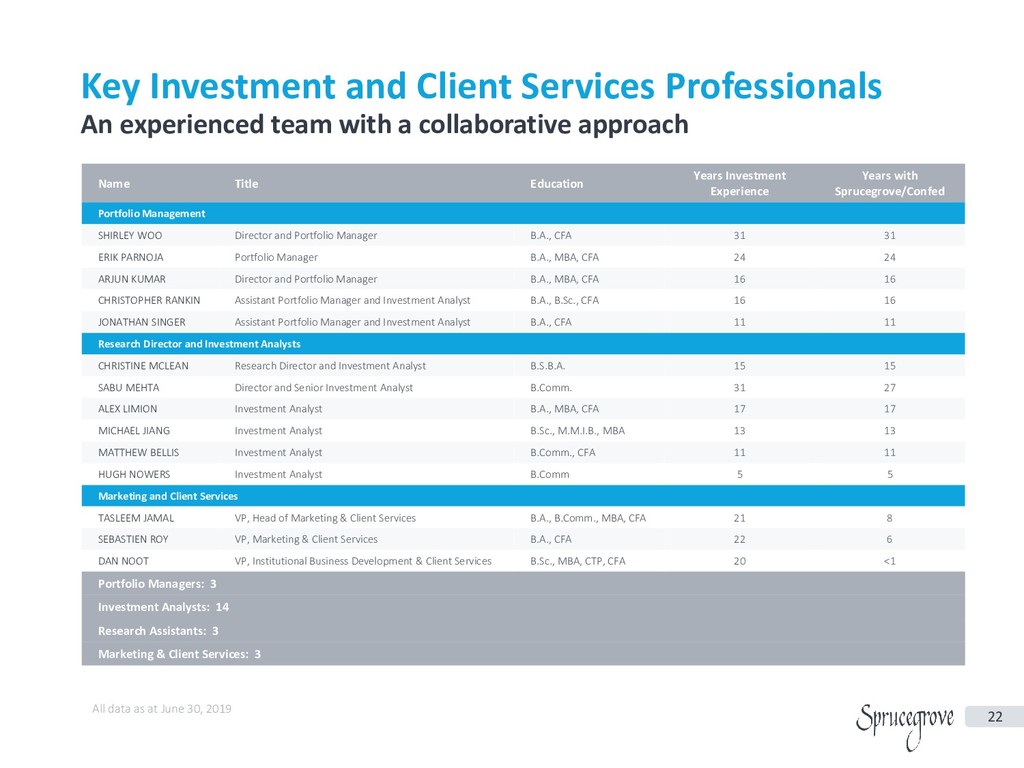
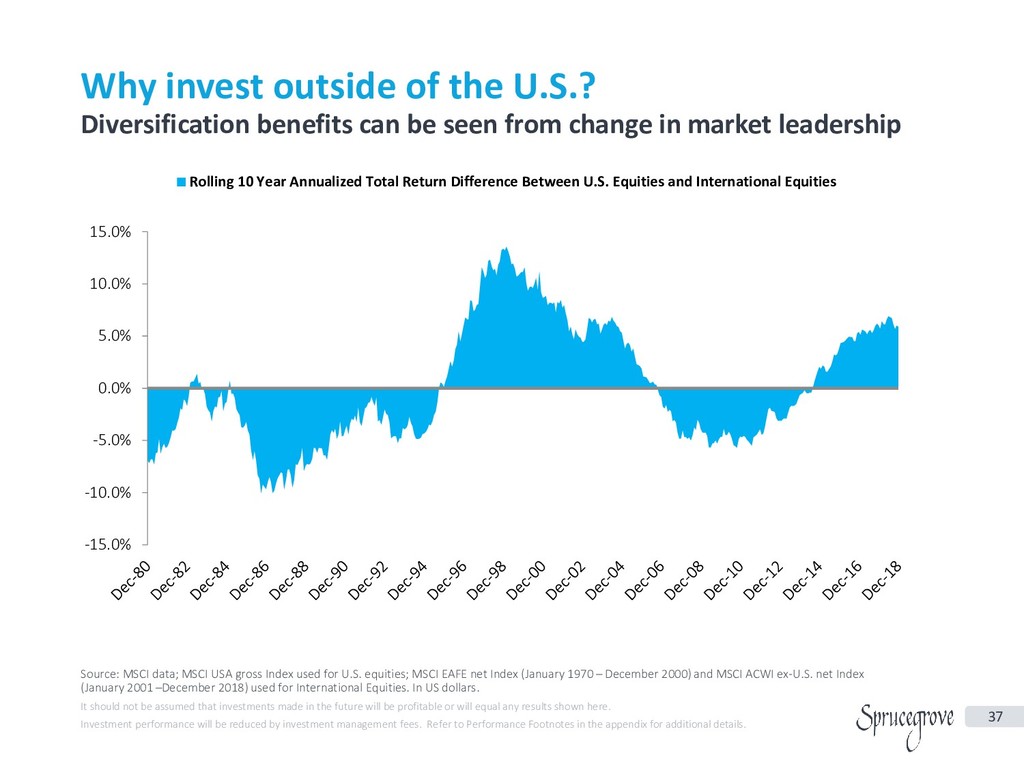
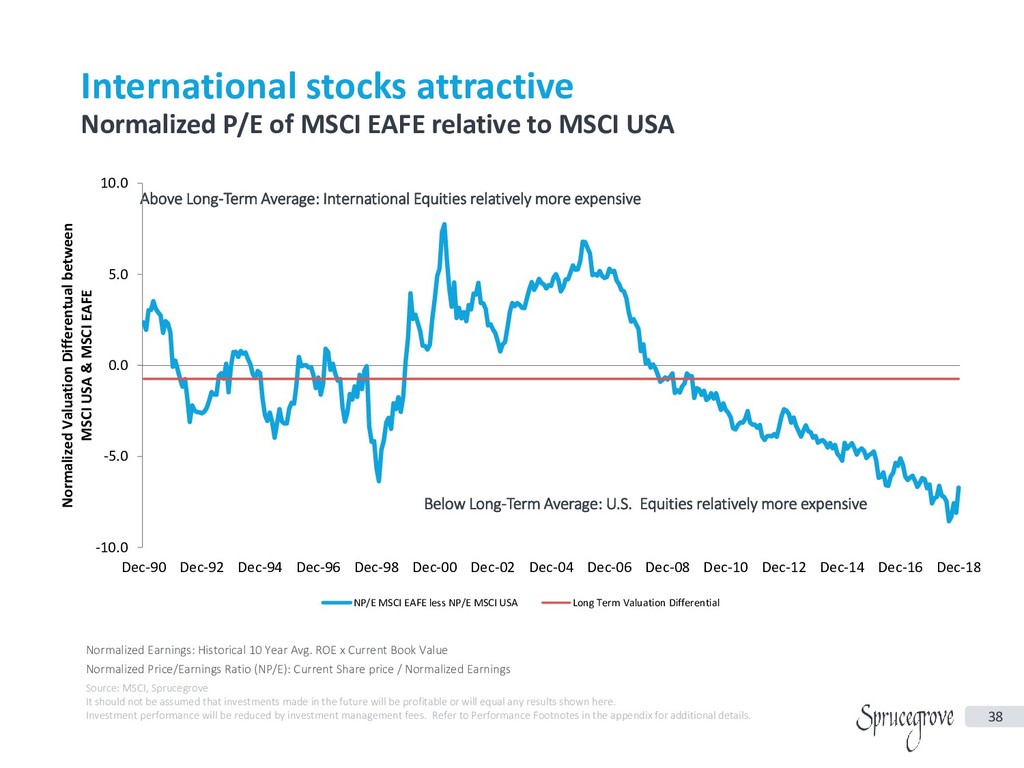
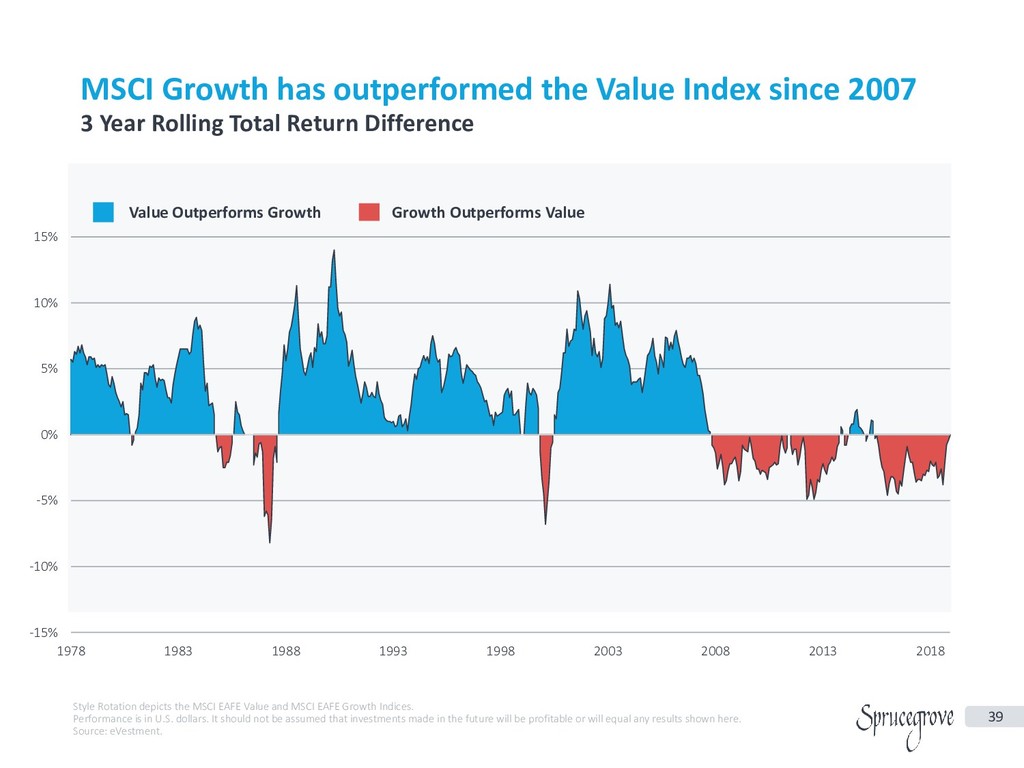
10:20-10:45 "Update investment policy & strategy of pension funds in North America" presented by Tasleem Jamal, CFA (Sprucegrove Investment Management)
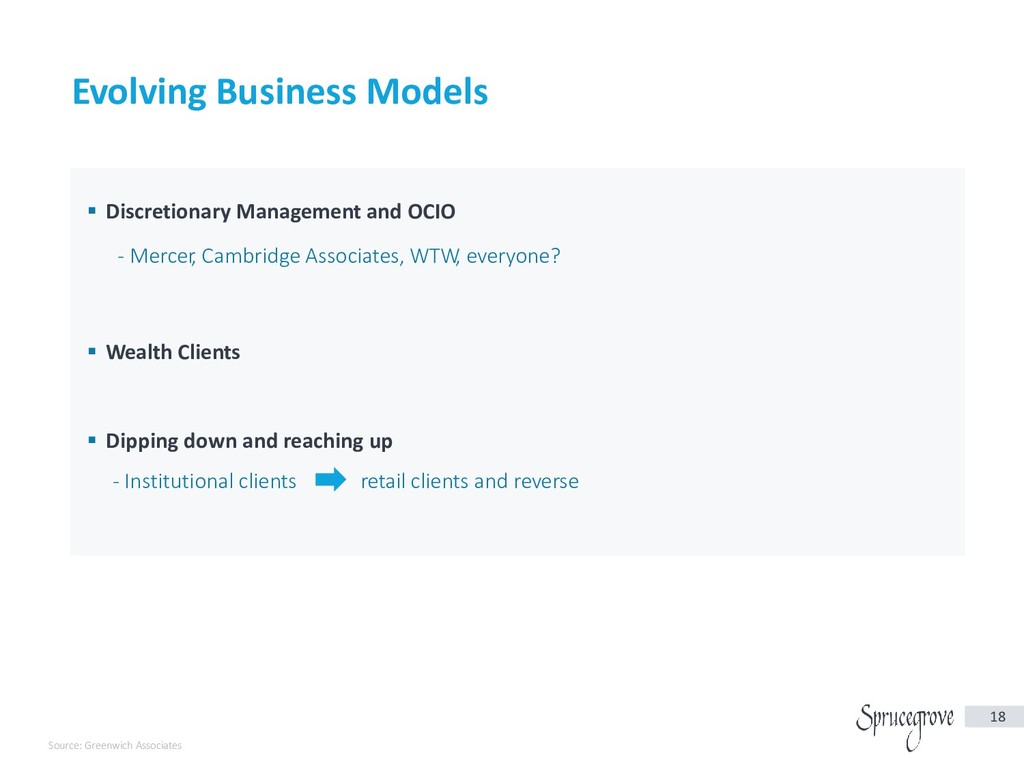
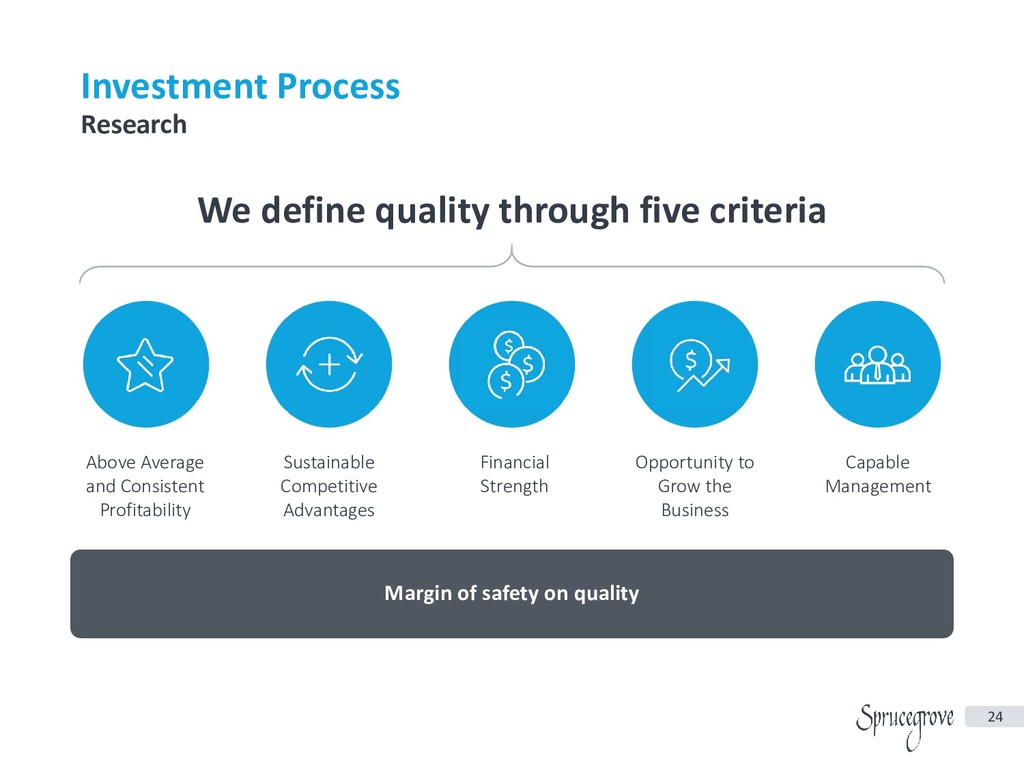
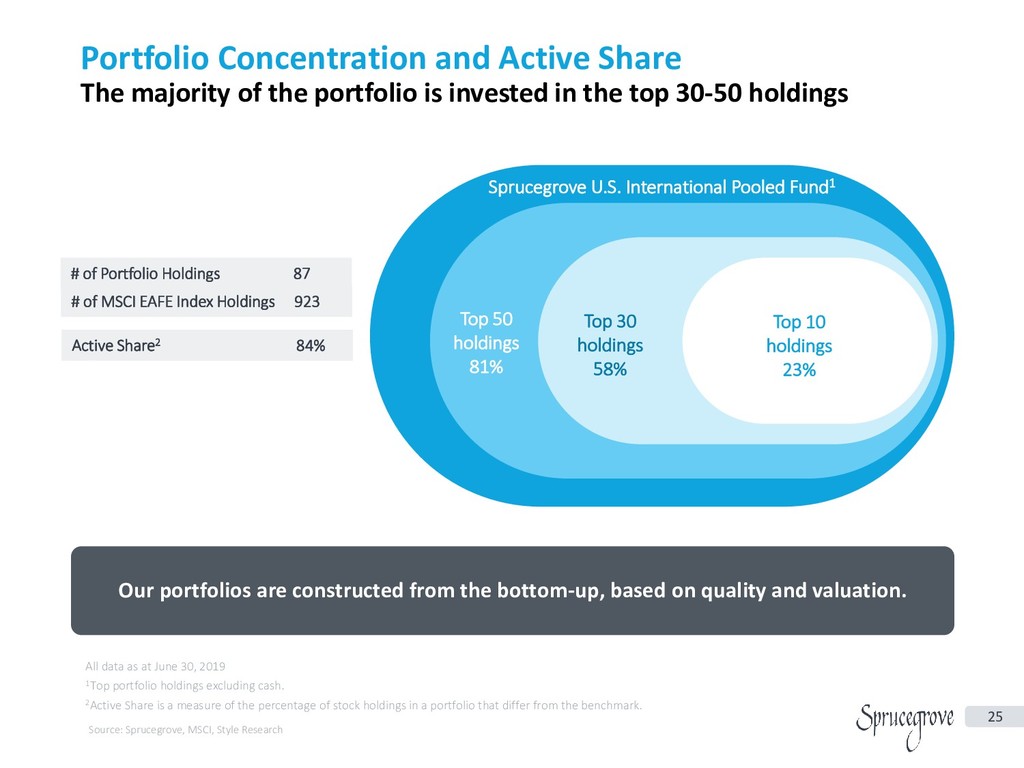
10:45-11:25 "Unique approach in global equity investment by a Canadian Manager" presented by Arjun Kumar, CFA (Sprucegrove Investment Management)
11:30-11:45 QA Session
11:45-11:50 Closing Remarks by Neil Vanwouw, President, The Canadian Chamber of Commerce in Japan
11:50-12:30 Networking Lunch

CFA Japan

August 09, 2019
Tweet

More Decks by CFA Japan

Other Decks in Research

Transcript

  1. Evolution of Global Markets 3 Pre‐1960’s 1960’s 1970’s  Institutions

    Dominate  Limited asset classes  Qualitative in nature  No benchmarks  No measurement  Relationship‐driven  Fixed income dominates  Institutions still dominate  Balanced fund mgmt.  Active mgmt. emerges  Fees for Service  Counselling firms embryonic  New asset classes – U.S. equities, mortgages  Counselling firms emerge  Specialty mgmt. begins  Diversification by manager  Market timing becomes popular  Significant pension asset growth  Relative measurement  Manager driven policy Source: AIMSE
  2. Evolution of Global Markets  DC plans  Diversification by

    style  Pressure on fees  Internal mgmt.  Servicing & Differentiation  New asset classes – Emerging Markets, Mortgage‐backed securities, Real return bonds, Managed futures, High Yield, Hedge Funds 4 Source: AIMSE 1980’s 1990’s to present 1990’s to present  Counselling firms Dominate  Specialty mgmt. grows  Consultants dominate policy decisions  Multi management structures  Asset mix becomes liability driven  Diversification by asset class  New asset classes – International equities, Real estate, Venture capital, cash  New competition  Benchmark measurement  Indexation emerges  Deluge of investment products  Investment styles  Pension Boards  Globalization
  3. 5 Production and Pensions C$577B / 2.3% C$1,530B / 2.0%

    C$319B C$6T C$1.6T US$40T GDP Pension Assets 25 Years Ago Today Source: AIMSE
  4. Evolution of P7 ranking Assets in billions of USD 6

    Source: Thinking Ahead Institute and secondary sources, Willis Towers Watson
  5. Relative size of top pension funds by market  While

    the top ten US pension funds represent 8.4% of total assets, the top ten Japanese pension funds account for 69.1% of total assets. This is largely explained by the Government Pension Investment fund that represents 46.6% of Japan’s pension assets  In the UK, the top ten pension funds represent 16.9% of the total UK pension assets. Among them, 11.3% are private pension funds and the 3.9% are state‐sponsored pension funds. 7 Source: Willis Towers Watson Thinking Ahead Institute and secondary sources.
  6. Asset allocation and DB/DC split 8 Source: Willis Towers Watson

    Thinking Ahead Institute and secondary sources,
  7. Key Issues for pension funds to consider in the next

    5‐10 years 9 Source: Greenwich Associates  Pension design, continually towards a DC model  Bigger impact from evolved regulations  Governance issues are challenging  Culture makes a difference  Sustainability and long‐horizon investing  Technology rising
  8. A ‘Mid‐Life’ Crisis? The asset management is entering the ‘maturity’

    phase of the industry lifecycle. 11 Source: Greenwich Associates
  9. Leading Consultants Share of Cumulative Relationships by Leading Consultants 

    The top 20 consultants advise roughly 78% of the large institutional funds in the U.S.; the top 10 account for 58% Sprucegrove favorably rated with consultant 12 Source: Greenwich Associates
  10. Structure at Consultant Firms Large consultant firms, their personnel structure

     Researcher (specialist, often not revenue generating; although, that is changing)  Field consultant (generalist, revenue generating) Smaller consultant firms, no dedicated research role  Often a total of 5‐15 professionals, all generalists who meet managers and clients 13 Source: Greenwich Associates
  11. Industry Data  85% of US Institutional mandates involve a

    consultant (Greenwich Associates)  Consultants’ client base has grown: institutional clients, family offices, financial intermediaries and some insurance plans hire consultants today  80% of investment management firms have dedicated consultant relations teams  Shadow searches continue to expand underscoring importance of databases 14 Source: Greenwich Associates
  12. Ratings  Formalized or Informal?  Influential or Informative ‐

    (long lists vs. focus lists)  Factors to earn positive ratings: Macro (Firm Level) ‐Firm stability, ownership, culture, compensation ‐Strategy: is the firm targeted, clear, or scattered ‐Focused on their clients or their share price? Investment focused vs. asset gathers Micro (Product Level) ‐Process (repeatable, understandable, explainable to other)? ‐People (investment team chemistry, tenure) ‐Performance (as it illustrates the process; consistently in top 35% valued more than top decile one year, bottom next) 15 Source: Greenwich Associates
  13. Global Consultant Firms  Consultant usage per country globally (Greenwich

    Associates, descending order): ‐ UK and Australia involve 90%+ ‐ US, Canada, Italy, Norway, Netherlands, Italy, Japan  Global Consultants ‐ Mercer ‐ AON ‐ Cambridge Associates ‐ Willis Towers Watson ‐ Russell Investments ‐ Albourne and Altius (specialty) Sprucegrove favorably rated with consultant 16 Source: Greenwich Associates
  14. Consultant Penetration continues to be strong Global Utilization of Investment

    Consultants 2016  The influence of investments consultants varies across markets, and the U.K. and U.S. continue to lead the world in consultant use. 17 Source: Greenwich Associates
  15. Evolving Business Models  Discretionary Management and OCIO ‐ Mercer,

    Cambridge Associates, WTW , everyone?  Wealth Clients  Dipping down and reaching up ‐ Institutional clients retail clients and reverse 18 Source: Greenwich Associates
  16. Consistent Philosophy, Process and People 20 Focused Controlled Growth Long‐Term

    Outlook  Equities only  International, ACWI ex. U.S., Global and ACWI mandates  Institutional clients  Founded in 1993  Fully open only 10 of 25 years  Total AUM: $14.4 bn. as at June 30, 2019  100% employee owned  Planned succession  Investment & Business Philosophy
  17. Partial List of U.S. Clients and Investors 21 Corporations Public

    Plans Union & Multi‐ Employer Insurance Foundations & Endowments Health Care The above list is a partial list of U.S. investors which are clients of Sprucegrove or investors in Funds managed by Sprucegrove. Sprucegrove sought consent from all such U.S. clients and investors for their inclusion in this list. All clients and investors who provided their consent in writing are included. It is not known whether the listed clients and investors approve or disapprove of Sprucegrove or the advisory services provided.
  18. 22 Key Investment and Client Services Professionals Name Title Education

    Years Investment Experience Years with Sprucegrove/Confed Portfolio Management SHIRLEY WOO Director and Portfolio Manager B.A., CFA 31 31 ERIK PARNOJA Portfolio Manager B.A., MBA, CFA 24 24 ARJUN KUMAR Director and Portfolio Manager B.A., MBA, CFA 16 16 CHRISTOPHER RANKIN Assistant Portfolio Manager and Investment Analyst B.A., B.Sc., CFA 16 16 JONATHAN SINGER Assistant Portfolio Manager and Investment Analyst B.A., CFA 11 11 Research Director and Investment Analysts CHRISTINE MCLEAN Research Director and Investment Analyst B.S.B.A. 15 15 SABU MEHTA Director and Senior Investment Analyst B.Comm. 31 27 ALEX LIMION Investment Analyst B.A., MBA, CFA 17 17 MICHAEL JIANG Investment Analyst B.Sc., M.M.I.B., MBA 13 13 MATTHEW BELLIS Investment Analyst B.Comm., CFA 11 11 HUGH NOWERS Investment Analyst B.Comm 5 5 Marketing and Client Services TASLEEM JAMAL VP, Head of Marketing & Client Services B.A., B.Comm., MBA, CFA 21 8 SEBASTIEN ROY VP, Marketing & Client Services B.A., CFA 22 6 DAN NOOT VP, Institutional Business Development & Client Services B.Sc., MBA, CTP, CFA 20 <1 Portfolio Managers: 3 Investment Analysts: 14 Research Assistants: 3 Marketing & Client Services: 3 An experienced team with a collaborative approach All data as at June 30, 2019
  19. OWNERSHIP OF QUALITY & VALUE BOTTOM‐UP PROCESS LONG‐TERM FOCUS INTERNAL

    RESEARCH Foundation of our Investment Philosophy 23 BUILDING PORTFOLIOS OF Quality Companies AT Attractive Valuations
  20. Investment Process 24 Research We define quality through five criteria

    Above Average and Consistent Profitability Sustainable Competitive Advantages Financial Strength Opportunity to Grow the Business Capable Management Margin of safety on quality
  21. 25 Portfolio Concentration and Active Share The majority of the

    portfolio is invested in the top 30‐50 holdings Our portfolios are constructed from the bottom‐up, based on quality and valuation. Sprucegrove U.S. International Pooled Fund1 Top 50 holdings 81% Top 30 holdings 58% Top 10 holdings 23% Source: Sprucegrove, MSCI, Style Research # of Portfolio Holdings 87 Active Share2 84% All data as at June 30, 2019 1Top portfolio holdings excluding cash. 2Active Share is a measure of the percentage of stock holdings in a portfolio that differ from the benchmark. # of MSCI EAFE Index Holdings 923
  22. Portfolio Characteristics 13.0 14.5 Fund MSCI EAFE 26 Financial Leverage

    weighted average excludes companies in the Financials sector.  Sprucegrove U.S. International Pooled Fund’s long term average since inception, September 30, 1985 Refer to Performance Footnotes in the appendix for additional details. Source: Sprucegrove, MSCI, Capital IQ as at June 30, 2019 Projected ROE Financial Leverage Normalized P/E Price/Book Dividend Yield 2.0 1.6 Fund MSCI EAFE 3.4 3.4 Fund MSCI EAFE QUALITY VALUATION Superior to MSCI EAFE Quality companies at attractive valuations 14.4 11.0 Fund MSCI EAFE 2.1 2.7 Fund MSCI EAFE
  23. 28 Annual Performance Results Year Sprucegrove U.S. International Pooled Fund1

    (%) MSCI EAFE1 (%) Difference (%) 1986 45.8 69.6 (23.8) 1987 14.7 24.9 (10.2) 1988 26.3 28.6 (2.3) 1989 27.8 10.8 17.0 1990 (6.8) (23.2) 16.4 1991 24.0 12.5 11.5 1992 0.4 (11.8) 12.2 1993 36.0 32.8 3.2 1994 6.1 8.0 (1.9) 1995 12.3 11.5 0.8 1996 18.2 6.3 11.9 1997 10.5 1.9 8.6 1998 9.8 20.2 (10.4) 1999 23.2 27.1 (3.9) 2000 2.3 (14.1) 16.4 2001 (5.0) (21.6) 16.6 2002 (0.8) (15.9) 15.1 2003 34.5 38.6 (4.1) 2004 25.2 20.3 4.9 2005 14.7 13.5 1.2 2006 30.4 26.3 4.1 2007 6.2 11.2 (5.0) 2008 (42.2) (43.4) 1.2 2009 36.9 31.8 5.1 2010 19.4 7.8 11.6 2011 (10.3) (12.1) 1.8 2012 17.7 17.3 0.4 2013 17.5 22.8 (5.3) 2014 (2.9) (4.9) 2.0 2015 (8.8) (0.8) (8.0) 2016 12.3 1.0 11.3 2017 27.9 25.0 2.9 2018 (13.5) (13.8) 0.3 2019 YTD3 13.1 14.0 (0.9) Since inception2,3 11.3 7.7 3.6 Sprucegrove U.S. International Pooled Fund It should not be assumed that investments made in the future will be profitable or will equal any results shown here. Investment performance will be reduced by investment management fees. Refer to Performance Footnotes in the appendix for additional details. Source: Sprucegrove, MSCI 1 Bold numbers indicate down markets (negative Index return). Returns shorter than a 1‐year period are arithmetic returns and have not been annualized. Returns greater than a 1‐year period have been annualized. Returns are gross of fees in U.S. dollars. 2 Fund Inception Date: September 30, 1985 3 Period ended June 30, 2019 Japanese Asset Price Bubble Technology, Media and Telecom Bubble Global Financial Crisis
  24. ‐4.7 7.0 3.0 11.2 ‐7.2 7.3 2.3 7.7 ‐10.0 ‐5.0

    0.0 5.0 10.0 15.0 Sprucegrove EAFE – U.S. Clients Composite MSCI EAFE Index % of up quarters since inception1: 66% % of times Fund outperformed: 43% Up‐market capture: 84%2 29 Average Quarterly Up and Down Market Performance Sprucegrove EAFE – U.S. Clients Composite vs. MSCI EAFE, as at June 30, 2019 1 Composite Creation Date: December 31, 1985. 2 Preliminary Negative Index returns in a quarter are considered down quarters whereas positive Index returns in a quarter are considered up quarters. Quarterly returns shown are not annualized and are simple arithmetic averages, for illustration purposes only. Returns are Gross of Fees in U.S. dollars. It should not be assumed that investments made in the future will be profitable or will equal any results shown here. Investment performance will be reduced by investment management fees. Source: Sprucegrove, eVestment, MSCI % of down quarters since inception1: 34% % of times Fund outperformed: 76% Down‐market capture: 66%2 Percent % Annualized Return (%) since inception1,2 Average Quarterly Return (%) Up Quarters Return (%) Down Quarters Return (%)
  25. 30 Annualized Performance Results Sprucegrove U.S. International Pooled Fund Returns

    shorter than a 1‐year period are arithmetic returns and have not been annualized. Returns greater than a 1‐year period have been annualized. Returns are gross of fees in U.S. dollars. It should not be assumed that investments made in the future will be profitable or will equal any results shown here. Investment performance will be reduced by investment management fees. Refer to Performance Footnotes in the appendix for additional details. Source: Sprucegrove, MSCI All data as at June 30, 2019 1 Inception date of Fund: September 30, 1985 Fund performance reflects a linking between the Sprucegrove U.S. International Pooled Fund and the Confederation Life International Pooled Fund for periods prior to 1994 (for which the Sprucegrove Investment Management team managed the portfolio since its inception). 2 Source MSCI. Net Index performance reflects a linking of the Gross Index return to the Net Index return on January 1, 2001. 3 Source MSCI. Since inception performance not available due to Index inception date of December 31, 1987. Q2 YTD 1 Year 2 Years 3 Years 4 Years 5 Years 10 Years 15 Years 20 Years 25 Years 30 Years Since Inception (%) (%) (%) (%) (%) (%) (%) (%) (%) (%) (%) (%) (%) Sprucegrove U.S. International Pooled Fund1 3.1 13.1 1.5 6.0 11.9 6.0 3.3 8.6 6.9 7.3 8.5 9.5 11.3 MSCI EAFE 3.7 14.0 1.1 3.9 9.1 3.9 2.2 6.9 5.3 4.0 4.8 4.9 7.7 MSCI EAFE Value 1.5 9.6 (2.1) 1.0 8.5 1.9 0.1 5.5 4.4 4.1 5.1 5.5 8.6 MSCI ACWI ex USA2,3 3.0 13.6 1.3 4.2 9.4 4.1 2.2 6.5 5.9 4.5 5.2 5.3 ‐
  26. 31 Annualized Performance Results Q2 YTD 1 Year 2 Years

    3 Years 4 Years 5 Years 10 Years 15 Years 20 Years 25 Years (%) (%) (%) (%) (%) (%) (%) (%) (%) (%) (%) Developed Markets portion of the Fund1 4.1 15.0 1.1 6.6 12.7 6.3 3.5 9.5 6.8 7.2 8.3 MSCI EAFE 3.7 14.0 1.1 3.9 9.1 3.9 2.2 6.9 5.3 4.0 4.8 Emerging Markets portion of the Fund1 (0.3) 6.5 4.9 5.9 13.7 9.6 4.3 6.3 10.4 10.7 9.8 MSCI Emerging Markets2 0.6 10.6 1.2 4.6 10.7 4.5 2.5 5.8 8.7 7.3 5.6 All data as at June 30, 2019 1 Sprucegrove U.S. International Pooled Fund. Source: InterSec (data analytics service provider). 2 Source: MSCI. Index performance reflects a linking of the Gross Index return to the Net Index return on January 1, 2001. Returns shorter than a 1‐year period are arithmetic returns and have not been annualized. Returns greater than a 1‐year period have been annualized. Returns are gross of fees in U.S. dollars. It should not be assumed that investments made in the future will be profitable or will equal any results shown here. Investment performance will be reduced by investment management fees. Refer to Performance Footnotes in the appendix for additional details. Developed and Emerging Markets breakout of the Sprucegrove U.S. International Pooled Fund
  27. 32 Historical Rolling Returns Sprucegrove EAFE – U.S. Client Composite

    All data as at December 31, unless stated otherwise. Refer to Performance Footnotes in the appendix for additional details. It should not be assumed that investments made in the future will be profitable or will equal any results shown here. Performance is gross of fees in U.S. dollars. Source: Sprucegrove, MSCI Annual (%) 3 Years (%) 5 Years (%) 7 Years (%) 10 Years (%) 20 Years (%) 30 Years (%) Sprucegrove MSCI EAFE Sprucegrove MSCI EAFE Sprucegrove MSCI EAFE Sprucegrove MSCI EAFE Sprucegrove MSCI EAFE Sprucegrove MSCI EAFE Sprucegrove MSCI EAFE 1986 45.8 69.4 1987 14.7 24.6 1988 26.3 28.3 28.3 39.4 1989 27.8 10.5 22.8 20.9 1990 ‐6.8 ‐23.4 14.6 2.8 20.3 18.1 1991 24.0 12.1 13.9 ‐1.7 16.4 8.7 1992 1.3 ‐12.2 5.4 ‐9.0 13.6 1.4 17.9 12.3 1993 37.3 32.6 19.9 9.3 15.5 2.0 16.9 8.5 1994 6.2 7.8 13.9 7.9 11.3 1.5 15.6 6.2 1995 12.3 11.2 17.8 16.7 15.5 9.4 13.6 4.1 17.9 13.6 1996 17.9 6.0 12.0 8.3 14.3 8.2 12.3 3.5 15.4 8.4 1997 10.4 1.8 13.5 6.3 16.3 11.4 15.1 7.8 14.9 6.3 1998 9.0 20.0 12.4 9.0 11.1 9.2 13.0 8.8 13.3 5.5 1999 22.3 27.0 13.7 15.7 14.3 12.8 16.1 14.7 12.8 7.0 2000 2.5 ‐14.2 11.0 9.4 12.2 7.1 11.3 7.8 13.8 8.2 2001 ‐5.0 ‐21.4 6.0 ‐5.0 7.5 0.9 9.6 3.0 10.8 4.5 2002 ‐1.1 ‐15.9 ‐1.2 ‐17.2 5.1 ‐2.9 7.6 ‐1.0 10.6 4.0 2003 34.2 38.6 8.0 ‐2.9 9.6 ‐0.1 9.6 2.9 10.3 4.5 2004 24.9 20.3 18.3 11.9 10.0 ‐1.1 11.6 5.3 12.1 5.6 2005 14.4 13.5 24.2 23.7 12.5 4.6 12.3 4.5 12.3 5.8 15.1 9.7 2006 30.4 26.3 23.0 19.9 19.8 15.0 13.4 4.4 13.5 7.7 14.4 8.1 2007 5.0 11.2 16.1 16.8 21.3 21.6 13.8 8.4 12.9 8.7 13.9 7.5 2008 ‐42.2 ‐43.4 ‐7.5 ‐7.3 2.5 1.7 6.0 3.4 6.0 0.8 9.6 3.1 2009 36.6 31.8 ‐6.1 ‐6.0 4.3 3.5 11.0 10.3 7.2 1.2 9.9 4.1 2010 19.6 7.8 ‐1.9 ‐7.0 5.3 2.5 9.2 6.4 8.8 3.5 11.3 5.9 2011 ‐10.3 ‐12.2 13.6 7.6 ‐2.3 ‐4.7 4.1 1.7 8.2 4.7 9.5 4.6 2012 18.1 17.3 8.2 3.6 0.0 ‐3.7 4.6 2.2 10.1 8.2 10.4 6.1 2013 17.6 22.8 7.6 8.2 15.3 12.4 3.1 1.8 8.7 6.9 9.5 5.7 2014 ‐3.5 ‐4.9 10.2 11.1 7.5 5.3 1.8 ‐0.5 5.9 4.4 9.0 5.0 2015 ‐8.7 ‐0.8 1.3 5.0 1.9 3.6 8.7 7.8 3.6 3.0 7.9 4.2 11.1 7.4 2016 11.4 1.0 ‐0.6 ‐1.6 6.5 6.5 5.6 3.8 2.0 0.7 7.6 4.2 10.1 5.6 2017 27.4 25.0 9.0 7.8 8.1 7.9 6.6 6.0 4.0 1.9 8.4 5.3 10.5 5.6 2018 ‐13.5 ‐13.8 7.1 2.9 1.6 0.5 6.0 5.8 8.2 6.3 7.1 3.5 9.1 4.2 Periods Outperformed 70% 74% 90% 100% 100% 100% 100% Number of Years 23 / 33 23 / 31 26 / 29 27 / 27 24 / 24 14 / 14 4 / 4
  28. 33 Proposed Sprucegrove Advisory Fees Proposed UCITS (USD,JPY) *It is

    proposed that Class F would be open to new investment for one year following the date of initial investment. After one year, Class F would be closed to new investors, but existing investors within the class would continue to be eligible to purchase additional Class F shares. Assets Range bps Class A 5M‐15M 70 Class B 15M‐50M 60 Class C 50M‐100M 55 Class D 100M‐400M 35 Class E >400M 25 Class F (Founder)* >=20M 25
  29. Why Sprucegrove? Experienced Investment Management Team Patient, Long‐term, Bottom‐Up Approach

    Emphasis on Internal Research Quality, Value‐Driven Portfolios Outstanding Client Service We offer consistency of philosophy, process and people.
  30. June 30, 2019 Quality Valuation Company Country Market Cap. Projected

    ROE Financial Leverage Normalized P/E Price/Book Dividend Yield (US$ Bn) (%) (x) (x) (x) (%) Banco Bradesco Brazil 79 17.0 10.4 14.4 2.5 3.5 China Mobile China 187 11.0 1.5 10.8 1.2 4.8 Ambuja Cements India 6 13.0 1.7 14.5 1.9 1.7 GAIL India 10 15.0 1.5 10.2 1.5 2.9 Infosys India 46 26.0 1.3 19.0 4.9 2.3 State Bank of India India 47 10.0 15.7 13.7 1.4 0.0 POSCO Korea 19 10.0 1.8 4.4 0.4 4.1 Samsung Electronics Korea 243 14.0 1.4 8.0 1.1 3.2 Copa Holdings Panama 4 13.0 2.5 17.1 2.2 3.6 Sasol South Africa 16 17.0 2.0 5.4 0.9 3.9 Tiger Brands South Africa 3 20.0 1.4 10.6 2.1 6.3 Fund Emerging Markets 60 14.8 1.6* 11.4 1.8 3.2 Total Fund 45 14.4 2.1* 13.0 2.0 3.4 MSCI EM Index 5 12.0 2.5* 13.4 1.6 2.8 MSCI EAFE Index 15 11.0 2.7* 14.5 1.6 3.4 * Excludes Financials 36 Value in Emerging Market Companies Sprucegrove U.S. International Pooled Fund Sprucegrove’s Emerging Markets holdings have higher quality and more attractive valuation than the Fund and relevant indices It should not be assumed that investments made in the future will be profitable or will equal any results shown here. Investment performance will be reduced by investment management fees. Refer to Performance Footnotes in the appendix for additional details. Source: Sprucegrove, MSCI, Capital IQ
  31. 37 Why invest outside of the U.S.? Diversification benefits can

    be seen from change in market leadership Source: MSCI data; MSCI USA gross Index used for U.S. equities; MSCI EAFE net Index (January 1970 – December 2000) and MSCI ACWI ex‐U.S. net Index (January 2001 –December 2018) used for International Equities. In US dollars. It should not be assumed that investments made in the future will be profitable or will equal any results shown here. Investment performance will be reduced by investment management fees. Refer to Performance Footnotes in the appendix for additional details. ‐15.0% ‐10.0% ‐5.0% 0.0% 5.0% 10.0% 15.0% Rolling 10 Year Annualized Total Return Difference Between U.S. Equities and International Equities
  32. 38 International stocks attractive Normalized P/E of MSCI EAFE relative

    to MSCI USA Normalized Earnings: Historical 10 Year Avg. ROE x Current Book Value Normalized Price/Earnings Ratio (NP/E): Current Share price / Normalized Earnings Source: MSCI, Sprucegrove It should not be assumed that investments made in the future will be profitable or will equal any results shown here. Investment performance will be reduced by investment management fees. Refer to Performance Footnotes in the appendix for additional details. Above Long‐Term Average: International Equities relatively more expensive Below Long‐Term Average: U.S. Equities relatively more expensive ‐10.0 ‐5.0 0.0 5.0 10.0 Dec‐90 Dec‐92 Dec‐94 Dec‐96 Dec‐98 Dec‐00 Dec‐02 Dec‐04 Dec‐06 Dec‐08 Dec‐10 Dec‐12 Dec‐14 Dec‐16 Dec‐18 Normalized Valuation Differentual between MSCI USA & MSCI EAFE NP/E MSCI EAFE less NP/E MSCI USA Long Term Valuation Differential
  33. ‐15% ‐10% ‐5% 0% 5% 10% 15% 1978 1983 1988

    1993 1998 2003 2008 2013 2018 39 MSCI Growth has outperformed the Value Index since 2007 3 Year Rolling Total Return Difference Style Rotation depicts the MSCI EAFE Value and MSCI EAFE Growth Indices. Performance is in U.S. dollars. It should not be assumed that investments made in the future will be profitable or will equal any results shown here. Source: eVestment. Value Outperforms Growth Growth Outperforms Value
  34. MSCI EAFE Value and Growth Indices 40 Annual Performance Results

    2018 (%) 2017 (%) 2016 (%) 2015 (%) 2014 (%) 2013 (%) 2012 (%) 2011 (%) 2010 (%) 2009 (%) MSCI EAFE Value (14.8) 21.4 5.0 (5.7) (5.4) 23.0 17.7 (12.2) 3.2 34.2 MSCI EAFE Growth (12.8) 28.9 (3.0) 4.1 (4.4) 22.5 16.9 (12.1) 12.2 29.4 Returns shorter than a 1‐year period are arithmetic returns and have not been annualized. Returns greater than a 1‐year period have been annualized. Returns are in U.S. dollars. It should not be assumed that investments made in the future will be profitable or will equal any results shown here. Refer to Performance Footnotes in the appendix for additional details. Source: MSCI Q2 YTD 1 Year 2 Years 3 Years 4 Years 5 Years 10 Years 15 Years 20 Years 25 Years 30 Years (%) (%) (%) (%) (%) (%) (%) (%) (%) (%) (%) (%) MSCI EAFE Value 1.5 9.6 (2.1) 1.0 8.5 1.9 0.1 5.5 4.4 4.1 5.1 5.5 MSCI EAFE Growth 5.7 18.5 4.2 6.8 9.7 5.9 4.4 8.2 6.2 3.7 4.4 4.1 Annualized Performance Results outperformed All data as at June 30, 2019
  35. 8.7 10.1 6.5 4.3 8.8 7.0 8.8 7.2 7.3 8.5

    2009 2010 2011 2012 2013 2014 2015 2016 2017 2018 Turnover (%) 41 Historical Annual Turnover Sprucegrove U.S. International Pooled Fund Average long‐term holding period of over 12 years All data as at December 31 It should not be assumed that investments made in the future will be profitable or will equal any results shown here. Investment performance will be reduced by investment management fees. Refer to Performance Footnotes in the appendix for additional details. Average 7.6
  36. Historical Characteristics 42 All data as at December 31 unless

    stated otherwise. 1 long term average since the Fund’s inception, September 30, 1985 2 Financial Leverage weighted average excludes companies in the Financials sector It should not be assumed that investments made in the future will be profitable or will equal any results shown here. Refer to Performance Footnotes in the appendix for additional details. Source: Sprucegrove, MSCI, Capital IQ Sprucegrove U.S. International Pooled Fund Consistently applied philosophy and process over time ‘00 ‘01 ‘02 ‘03 ‘04 ‘05 ‘06 ‘07 ‘08 ‘09 ‘10 ‘11 ‘12 ‘13 ‘14 ‘15 ‘16 ‘17 ‘18 Quality Fund Projected ROE % 13.6 14.6 14.6 14.5 14.5 15.0 16.5 17.5 16.9 15.9 15.4 15.2 15.0 15.1 15.0 14.9 14.2 14.4 14.4 MSCI EAFE Projected ROE % 10.0 10.0 10.0 10.0 10.0 10.0 11.0 11.0 12.0 11.0 11.0 11.0 11.0 11.0 11.0 11.0 11.0 11.0 11.0 Fund Historical ROE % 13.7 14.3 14.1 14.5 14.6 16.0 17.5 18.4 17.8 17.4 17.0 16.8 16.6 16.8 16.6 16.8 17.3 16.3 16.7 MSCI EAFE Historical ROE % 9.2 8.5 8.5 8.6 8.5 9.3 9.9 11.3 11.3 11.6 11.6 11.6 11.5 11.8 11.9 11.7 11.2 10.4 9.8 Fund Fin. Leverage2 X 2.1 2.2 2.2 2.2 2.2 2.2 2.2 2.2 2.2 2.1 2.1 2.0 2.0 2.1 2.1 2.2 2.3 2.1 2.1 MSCI EAFE Fin. Leverage2 X 3.2 3.1 3.1 3.2 3.2 3.1 3.0 2.8 2.8 2.8 2.8 2.7 2.8 2.7 2.7 2.7 2.7 2.7 2.7 Valuation Fund Normalized P/E X 17.7 15.0 12.8 14.4 15.8 17.3 17.3 14.4 9.8 12.8 13.5 11.4 12.5 13.7 13.4 12.0 13.3 14.2 11.7 MSCI EAFE Normalized P/E X 28.0 21.5 16.1 19.9 20.0 23.6 22.3 20.0 10.1 14.6 14.0 11.5 13.0 15.6 15.0 14.8 15.0 15.9 13.3
  37. 43 Top 10 Holdings Sprucegrove U.S. International Pooled Fund All

    data as at June 30, 2019 1 Financial Leverage weighted average excludes companies in the Financials sector. It should not be assumed that investments made in the future will be profitable or will equal any results shown here. The information presented is an example of investment technique and should not be construed as representative of investment performance. A list of all securities purchased and sold within the past year together with dates and prices is available upon request. Refer to Performance Footnotes in the appendix for additional details. Source: Sprucegrove, MSCI, Capital IQ Stock Country Sector % of Fund Projected ROE (%) Financial Leverage1 (x) Normalized P/E (x) P/B (x) Dividend Yield (%) Yara International Norway Materials 2.4 14.0 2.0 10.6 1.5 1.6 Air Liquide France Materials 2.4 14.0 2.4 21.2 3.0 2.2 Novartis Switzerland Health Care 2.3 18.0 2.9 24.5 4.4 3.2 Diageo U.K. Consumer Staples 2.2 34.0 3.4 25.9 8.8 2.0 LafargeHolcim Switzerland Materials 2.2 9.0 2.2 11.7 1.1 4.2 United Overseas Bank Singapore Financials 2.1 12.0 10.3 9.6 1.1 4.6 Anglo American U.K. Materials 2.1 13.0 2.2 12.1 1.6 3.5 Banco Bradesco Brazil Financials 2.0 17.0 10.4 14.4 2.5 3.5 SBM Offshore Holland Energy 2.0 14.0 3.8 10.8 1.5 1.9 BHP Group U.K. Materials 2.0 18.0 2.0 14.9 2.7 4.4 Total 21.7 Weighted Average 16.3 2.6 15.7 2.8 3.1 MSCI EAFE 11.0 2.7 14.5 1.6 3.4
  38. 44 Historical Sector Weightings Sprucegrove U.S. International Pooled Fund All

    data as at December 31 Refer to Performance Footnotes in the appendix for additional details. Source: Sprucegrove, MSCI Weightings (%) Sprucegrove U.S. International Pooled Fund MSCI EAFE Sector 2009 2010 2011 2012 2013 2014 2015 2016 2017 2018 2018 Energy 11.3 11.2 11.3 10.1 11.6 10.0 10.0 11.0 9.8 9.1 5.9 Materials 9.6 10.4 11.6 11.4 11.8 11.7 10.8 15.0 15.5 17.3 7.4 Industrials 17.7 18.1 17.4 18.9 19.4 19.0 17.3 16.7 16.3 16.4 14.3 Consumer Discretionary 17.6 18.1 15.0 14.4 13.0 12.4 15.7 14.0 13.4 11.9 11.2 Consumer Staples 4.8 3.5 4.7 4.8 4.6 4.6 5.9 6.5 7.1 7.8 11.6 Health Care 8.7 7.6 9.3 8.1 7.5 6.1 4.8 3.5 3.5 4.4 11.2 Financials 9.3 9.5 9.9 11.0 12.9 15.4 15.5 14.3 14.6 14.8 19.5 Information Technology 11.4 12.4 10.9 12.4 11.4 11.4 10.9 11.1 10.1 9.0 6.0 Telecomm. Services 3.0 3.6 3.1 3.0 2.6 3.0 2.8 2.1 2.1 ‐ ‐ Communication Services ‐ ‐ ‐ ‐ ‐ ‐ ‐ ‐ ‐ 2.9 5.6 Utilities 2.7 2.8 3.2 3.3 2.9 3.2 3.2 1.9 2.1 2.3 3.8 Real Estate ‐ ‐ ‐ ‐ ‐ ‐ ‐ 1.3 1.2 1.3 3.7 Cash 3.9 2.8 3.6 2.5 2.4 3.2 3.2 2.6 4.4 2.8 0.0 Total 100.0 100.0 100.0 100.0 100.0 100.0 100.0 100.0 100.0 100.0 100.0
  39. 45 Historical Country Weightings Sprucegrove U.S. International Pooled Fund All

    data as at December 31 Refer to Performance Footnotes in the appendix for additional details. Source: Sprucegrove, MSCI Weightings (%) Sprucegrove U.S. International Pooled Fund MSCI EAFE Country 2009 2010 2011 2012 2013 2014 2015 2016 2017 2018 2018 Australia 2.3 2.5 2.7 2.8 2.5 2.3 2.4 2.5 2.0 2.3 6.9 Hong Kong 4.2 5.0 5.4 5.4 5.7 6.7 6.8 6.6 6.1 7.0 3.9 Japan 20.2 20.8 20.8 19.5 16.7 15.5 13.8 12.8 12.2 11.9 24.6 Singapore 4.9 5.2 5.6 6.4 6.0 6.6 6.1 5.2 6.1 5.8 1.4 Other 0.0 0.0 0.0 0.0 0.0 0.0 0.0 0.0 0.0 0.0 0.2 Pacific 31.6 33.4 34.5 34.1 30.9 31.1 29.1 27.1 26.4 26.9 37.0 Finland 1.4 0.9 0.0 0.0 0.3 0.8 1.7 1.2 0.8 0.6 1.0 France 3.7 3.0 3.4 3.6 3.6 3.3 3.9 4.7 4.7 4.7 11.1 Germany 3.8 4.2 3.7 4.3 3.4 3.2 4.1 3.1 3.6 4.6 8.8 Holland 2.7 3.5 4.1 4.1 4.9 4.3 4.2 4.3 4.4 4.3 3.4 Ireland 4.9 4.3 4.5 4.4 4.0 3.5 3.6 2.4 1.5 1.7 0.5 Italy 2.7 2.6 1.0 1.0 1.1 1.0 1.0 0.6 0.5 0.7 2.3 Spain 1.2 1.7 1.6 2.0 2.5 2.6 2.2 2.1 2.3 1.7 3.1 Other 0.0 0.0 0.0 0.0 0.0 0.0 0.0 0.0 0.0 0.0 1.3 Eurozone 20.4 20.3 18.2 19.2 19.7 18.7 20.7 18.3 17.9 18.2 31.6 Denmark 0.0 0.0 0.0 0.0 0.0 0.0 0.0 0.0 0.2 0.4 1.7 Norway 0.0 0.0 0.0 0.4 0.8 1.9 2.1 3.1 3.1 3.5 0.7 Sweden 0.0 0.0 0.0 0.0 0.0 0.0 0.0 0.0 0.0 0.0 2.7 Switzerland 12.7 11.0 12.0 11.7 11.3 8.8 8.5 9.7 9.1 8.5 8.6 U.K. 17.7 18.7 17.6 18.1 18.9 19.1 20.7 22.3 22.6 23.1 16.9 Other 0.0 0.0 0.0 0.0 0.0 0.0 0.0 0.0 0.0 0.0 0.5 Non‐Eurozone 30.4 29.7 29.7 30.2 31.0 29.8 31.2 35.0 35.0 35.4 31.3 Europe 50.8 50.0 47.9 49.4 50.8 48.5 52.0 53.3 52.9 53.6 63.0 Brazil 1.7 1.5 1.2 0.9 1.5 1.3 0.6 1.3 1.6 2.3 0.0 China 0.4 1.1 1.6 1.7 1.8 2.3 2.3 1.7 1.4 1.6 0.0 Hungary 0.7 0.6 0.4 0.4 0.5 0.3 0.0 0.0. 0.0 0.0 0.0 India 2.1 1.3 1.4 1.7 2.9 4.0 4.3 3.9 4.7 5.0 0.0 Korea 3.9 3.8 3.5 3.5 3.3 3.1 3.1 4.0 3.7 3.0 0.0 Malaysia 0.6 0.6 0.4 0.2 0.3 0.4 0.4 0.0 0.0 0.0 0.0 Mexico 0.2 0.0 0.0 0.0 0.0 0.0 0.0 0.0. 0.0 0.0 0.0 Panama 0.0 0.0 0.0 0.0 0.0 0.0 0.0 0.8 0.5 0.7 0.0 South Africa 1.8 2.4 2.8 2.5 2.3 2.3 2.1 2.3 2.4 2.2 0.0 Emerging Markets 11.4 11.3 11.2 11.0 12.5 13.6 12.7 14.0 14.3 14.8 0.0 Canada 2.3 2.4 2.8 3.0 3.5 3.6 3.0 3.0 2.1 1.9 0.0 Cash 3.9 2.8 3.6 2.5 2.4 3.2 3.2 2.6 4.4 2.8 0.0 Total 100.0 100.0 100.0 100.0 100.0 100.0 100.0 100.0 100.0 100.0 100.0
  40. 46 Policy Guidelines Restrictions/Limits Asset Mix Cash & Short Term

    Equities 0% ‐ 10% 90% ‐ 100% Region Minimum three countries from EAFE Europe region and three countries from EAFE Asia/Pacific region. Country The Fund will be subject to the following minimum ‐ maximum country weightings: Japan United Kingdom Canada United States Other EAFE countries Total non‐EAFE countries, excluding Canada Total non‐EAFE countries 5% ‐ 50% 10% ‐ 50% 0% ‐ 10% excluded 0% ‐ 15% 0% ‐ 15% 0% ‐ 20% Sector Minimum 7 of 11 MSCI sectors Maximum individual sector 30% Company Holdings Minimum 40 companies Maximum company weighting 5% Maximum ownership, lesser of outstanding shares 5%; free float 10% Other In unusual circumstances, the Fund may exceed the above guidelines for short periods of time. Methodology Value approach using a bottom‐up, stock selection process with an emphasis on owning quality companies at attractive valuations. Mandate International equities Benchmark MSCI EAFE Index (U.S. Dollars)
  41. 47 Currency No Hedging Long‐Term Investors Natural Diversification from Currency

    Basket Natural Hedge from Focus on Security Selection We do not believe we can add Value by Hedging
  42. 48 Annual Performance Results Year1 Composite Gross Return $USD (%)

    EAFE $USD Benchmark Return (%) Composite 3‐Yr St Dev (%) Benchmark 3‐Yr St Dev (%) # of Portfolios Internal Dispersion (%) Composite Assets ($M) Firm Assets ($M) 2009 36.6 31.8 21.8 23.6 17 4.4 6,561 15,555 2010 19.6 7.8 24.6 26.2 18 2.8 8,512 19,364 2011 (10.3) (12.1) 20.5 22.4 18 2.2 7,341 17,788 2012 18.1 17.3 17.8 19.4 18 1.2 8,977 21,421 2013 17.8 22.8 14.2 16.3 20 3.7 10,667 24,583 2014 (3.3) (4.9) 11.6 13.0 20 2.4 10,046 22,652 2015 (8.7) (0.8) 11.5 12.5 17 3.8 8,740 17,375 2016 11.4 1.0 12.5 12.5 17 4.3 8,946 14,888 2017 27.4 25.0 12.2 11.8 15 3.1 10,316 16,104 2018 (13.6) (13.8) 11.7 11.2 14 0.8 8,234 12,880 Sprucegrove EAFE ‐ U.S. Clients Composite Composite creation date: October 1, 1985 1 For the years ended December 31 It should not be assumed that investments made in the future will be profitable or will equal any results shown here. Investment performance will be reduced by investment management fees. Refer to Performance Footnotes in the appendix for additional details. Source: Sprucegrove, MSCI
  43. 49 Assets Under Management Breakdown by Mandates, $USD 1 For

    the years ended December 31 Source: Sprucegrove Firm EAFE Global U.S. Equity ACW ACW ex U.S. Year1 Total Assets U.S. Clients Canadian Clients Total Assets U.S. Clients Canadian Clients Total Assets U.S. Clients Canadian Clients Canadian Clients Canadian Clients U.S. Clients 2009 15,555 6,561 8,893 11,634 6,561 4,972 2,863 0 2,863 1,059 0 0 2010 19,364 8,512 10,624 14,537 8,512 6,025 3,539 228 3,311 1,288 0 0 2011 17,788 7,737 10,050 12,737 7,341 5,396 3,703 396 3,307 1,348 0 0 2012 21,421 9,455 11,966 14,684 8,977 5,706 5,244 478 4,766 1,493 0 0 2013 24,583 11,245 13,337 16,949 10,667 6,282 5,690 578 5,112 1,943 0 0 2014 22,652 10,719 11,933 15,371 10,046 5,325 5,374 673 4,701 1,907 0 0 2015 17,375 8,826 8,548 12,931 8,740 4,191 2,982 86 2,896 1,462 0 0 2016 14,888 8,946 5,942 12,198 8,946 3,252 2,683 0 2,683 6 0 0 2017 16,104 10,316 5,788 14,173 10,316 3,857 1,720 0 1,720 6 204 0 2018 12,880 8,378 4,501 11,133 8,234 2,899 1,486 0 1,486 0 117 144
  44. 50 Notes Sprucegrove Investment Returns Investment performance returns exclude any

    investment management fees paid by the investor. Investment advisory fees will reduce stated returns. Performance returns are calculated on a time weighted, total return basis which includes dividend net of withholding taxes and interest income, realized and unrealized gains or losses, transaction costs and other expenses, if any. For example, a 70 basis point fee applied to an investment with an annual gross return of 10% will provide a compounded net return of 9.24% after 1 year and a 55.53% return after 5 years. MSCI EAFE, World, ACWI ex. US and ACWI Indices The Morgan Stanley Capital International (MSCI) EAFE, World, ACWI ex. US and ACWI Indices are presented as benchmarks for investment performance. The Indices are the arithmetical average, weighted by market value of the performance of companies representing the stock markets of Canada, the U.S., Europe, Australasia, the Far East and Emerging Markets. Returns shown assume reinvestment of dividends unless stated otherwise. The MSCI EAFE Index captures large and mid cap representation across 21 developed markets, excluding the US and Canada. The MSCI World Index captures large and mid cap representation across 23 developed markets, including the US and Canada. The MSCI ACWI ex US Index captures large and mid cap representation across 22 of 23 developed markets, excluding the US, and 26 emerging market countries. The MSCI ACWI Index captures large and mid cap representation across 23 developed markets and 26 emerging markets counties. Throughout this report MSCI data is provided as a comparative reference only and may not be used in any way without the express permission of MSCI. The MSCI information may only be used for your internal use, may not be reproduced or redisseminated in any form and may not be used as a basis for or a component of any financial instruments or products or indices. None of the MSCI information is intended to constitute investment advice or a recommendation to make (or refrain from making) any kind of investment decision and may not be relied on as such. Historical data and analysis should not be taken as an indication or guarantee of any future performance analysis, forecast or prediction. The MSCI information is provided on an “as is” basis and the user of this information assumes the entire risk of any use made of this information. MSCI, each of its affiliates and each other person involved in or related to compiling, computing or creating any MSCI information (collectively, the “MSCI Parties”) expressly disclaims all warranties (including, without limitation, any warranties of originality, accuracy, completeness, timeliness, non‐infringement, merchantability and fitness for a particular purpose) with respect to this information. Without limiting any of the foregoing, in no event shall any MSCI Party have any liability for any direct, indirect, special, incidental, punitive, consequential (including, without limitation, lost profits) or any other damages. (www.msci.com) S&P 500 Index The S&P 500 Index is presented as a benchmark for investment performance. The Index is the arithmetic average, weighted by market value of the performance of companies representing the stock markets of the U.S. Returns shown assume reinvestment of dividends. The S&P Index includes 500 leading companies in leading industries of the U.S. economy. Specific Recommendations Examples of specific holdings are intended to demonstrate our investment process and should not be construed as representative of investment performance. It should not be assumed that investments made in the future will be profitable or will equal any results presented. A list of all securities purchased and sold within the past year (together with dates and prices) is available upon request. Possibility of Loss Investors should be aware that market conditions affect performance and that investment programs carry with them the possibility of loss. It should not be assumed that investments made in the future will be profitable or will equal any results shown in this document. GIPS Compliance Notes Sprucegrove Investment Management Ltd. (Sprucegrove) claims compliance with the Global Investment Performance Standards (GIPS®). Sprucegrove has been independently verified for the periods May 1, 1985 to December 31, 2018. The composites have been examined for the periods May 1, 1985 to December 31, 2018. Continued on next page
  45. 51 Notes (continued) Definition of the Firm Sprucegrove is registered

    in most provinces in Canada as Investment Fund Manager and Portfolio Manager and with the SEC as an Investment Advisor. It manages fully discretionary accounts for fee paying clients. All portfolios with a market value greater than $5 million are included in a composite. Composite and Benchmark Definition Composites and their corresponding benchmarks are determined by equity mandate (EAFE, Global, ACW ex US or ACW) and by the country in which the respective account is domiciled (Canada or the United States). The following is a list of the composites and their benchmarks: Composite EAFE ‐ Canadian Clients Composite Global ‐ Canadian Clients Composite EAFE ‐ U.S. Clients Composite ACW ‐ Canadian Clients Composite ACW ex US ‐ US Clients Composite Inception Date of Composite May 1985 July 1992 October 1985 December 2017 April 2018 Benchmark MSCI EAFE Net Index ‐ CAD MSCI World Net Index ‐ CAD MSCI EAFE Net Index ‐ US MSCI ACWI Net Index ‐ US MSCI ACWI ex. US Net Index ‐ US Fee Schedules The following are the standard fee schedules based on the market value of assets managed. Pooled Fund Accounts* Assets Managed Rate CIT Accounts Invested Plan Assets Rate Separate Fund Accounts Assets Managed Rate First $5,000,000.00 0.70% Class A $0 ‐ $15 million 0.7000% First $25,000,000.00 0.70% Next $10,000,000.00 0.65% Class B $15 ‐ $50 million 0.6500% Next $25,000,000.00 0.60% Next $25,000,000.00 0.55% Class C $50 ‐ $100 million 0.5500% Next $25,000,000.00 0.50% Next $35,000,000.00 0.50% Class D $100 ‐ $400 million 0.3500% Next $225,000,000.00 0.25% Next $225,000,000.00 0.25% Class E Over $400 million 0.2500% Balance 0.20% Balance 0.20% Class F (Founder)* $20 million or more 0.2500% *With respect to each of the Sprucegrove International CIT, the Sprucegrove All Country World ex U.S. CIT, the Sprucegrove All Country World ex U.S. Fund and the Sprucegrove All Country World Pooled Fund (Pension) (each, a “New Fund”), a founder fee of 25bps (the “Founder Fee”) will be available to each investor who invests or has invested a minimum of $20 million (in the applicable currency) in the New Fund within the first two years of the fund having been seeded (each such investor, a “Founder”). Once the two‐year period elapses for a New Fund, the Founder Fee (or related share class) will be closed to new investors. As long as a Founder remains invested in a New Fund, it will continue to be eligible for the Founder Fee, including on additional investments in the fund. Past Performance Prior to Sprucegrove commencing operations in 1993, the Sprucegrove team managed two EAFE portfolios at Confederation Life Insurance, from their inception in 1985, until the portfolios were acquired by Sprucegrove in 1994. Accordingly the performance of these portfolios are linked to their continuation at Sprucegrove as follows: The EAFE Canadian Clients composite includes the performance of the Confederation Life International Pooled Fund from 1985 to 1994; The EAFE U.S. Clients composite includes the performance of the Confederation Life American International Pooled Fund from 1985 to 1994. Prior to December 31, 2011, the name of each composite included the term “Pooled and Separate Accounts Combined.” This term was removed from the composite names as at December 31, 2011. Criteria for Company Examples In each case, the examples for (i) additions and (ii) reductions/eliminations are selected as follows. The most common security traded in the quarter across all accounts for a mandate is chosen unless the resulting example was disclosed as an example of an addition or reduction/elimination, as applicable, for the mandate within the past four quarters, in which case, the next most common security across all accounts in the mandate is chosen. In the event of a tie, the security within the mandate with the highest transaction by total dollar volume during the quarter is chosen. For any account that does not include the selected security, the security within such account with the largest transaction by total dollar volume during the quarter is selected. All examples are chosen based on active, non‐program trades, and exclude exceptional events such as transfers. Eliminations are accounted for in the quarter in which they are completed. Further Information To obtain a presentation that complies with GIPS requirements, and/or a list of composite description, please contact your client service representative.
  46. Sebastien Roy Vice President, Marketing & Client Services [email protected] 416.363.5854

    ext.225 For more information please contact: Tasleem Jamal Vice President, Head of Marketing & Client Services [email protected] 416.363.5854 ext.487 Arjun Kumar Director and Portfolio Manager [email protected] 416.363.5854 ext.249