Upgrade to Pro
— share decks privately, control downloads, hide ads and more …
Speaker Deck
Features
Speaker Deck
PRO
Sign in
Sign up for free
Search
Search
plotlyで動くグラフを作る
Search
takuma koshiishi
January 21, 2023
Technology
0
1.1k
plotlyで動くグラフを作る
takuma koshiishi
January 21, 2023
Tweet
Share
More Decks by takuma koshiishi
See All by takuma koshiishi
R package for a team
kosshi
2
2.1k
Other Decks in Technology
See All in Technology
JAWS-UG Bedrock Claude Night
yamahiro
3
610
反実仮想機械学習とは何か
usaito
PRO
11
4.7k
Databricks における 『MLOps』
databricksjapan
2
170
アクセス制御にまつわる改善 / Improving access control
itkq
0
550
元インフラエンジニアに成る / Human Resources to Human Relations
bobtani
4
930
DevOpsメトリクスとアウトカムの接続にトライ!開発プロセスを通して計測できるメトリクスの活用方法
ham0215
2
240
家族アルバム みてねにおけるGrafana活用術 / Grafana Meetup Japan Vol.1 LT
isaoshimizu
1
770
Google Cloud Next '24 Recap(Cloud Run/k8s)
mokocm
0
240
Building Dashboards as a Hobby
egmc
0
230
Além do else! Categorizando Pokemóns com Pattern Matching no JavaScript
wmsbill
0
640
SIEMを用いて、セキュリティログ分析の可視化と分析を実現し、PDCAサイクルを回してみた
coconala_engineer
0
330
オーナーシップを持つ領域を明確にする
konifar
13
3.2k
Featured
See All Featured
It's Worth the Effort
3n
180
27k
Build your cross-platform service in a week with App Engine
jlugia
225
17k
Visualization
eitanlees
136
14k
VelocityConf: Rendering Performance Case Studies
addyosmani
320
23k
How to train your dragon (web standard)
notwaldorf
73
5.2k
A better future with KSS
kneath
231
16k
Designing Dashboards & Data Visualisations in Web Apps
destraynor
226
51k
Building Effective Engineering Teams - LeadDev
addyosmani
28
1.8k
Being A Developer After 40
akosma
57
580k
We Have a Design System, Now What?
morganepeng
43
6.8k
The Language of Interfaces
destraynor
151
23k
Become a Pro
speakerdeck
PRO
11
4.5k
Transcript
plotlyで 動くグラフを作る Takuma Koshiishi @kotaku08 Tokyo.R #103 2023/1/21
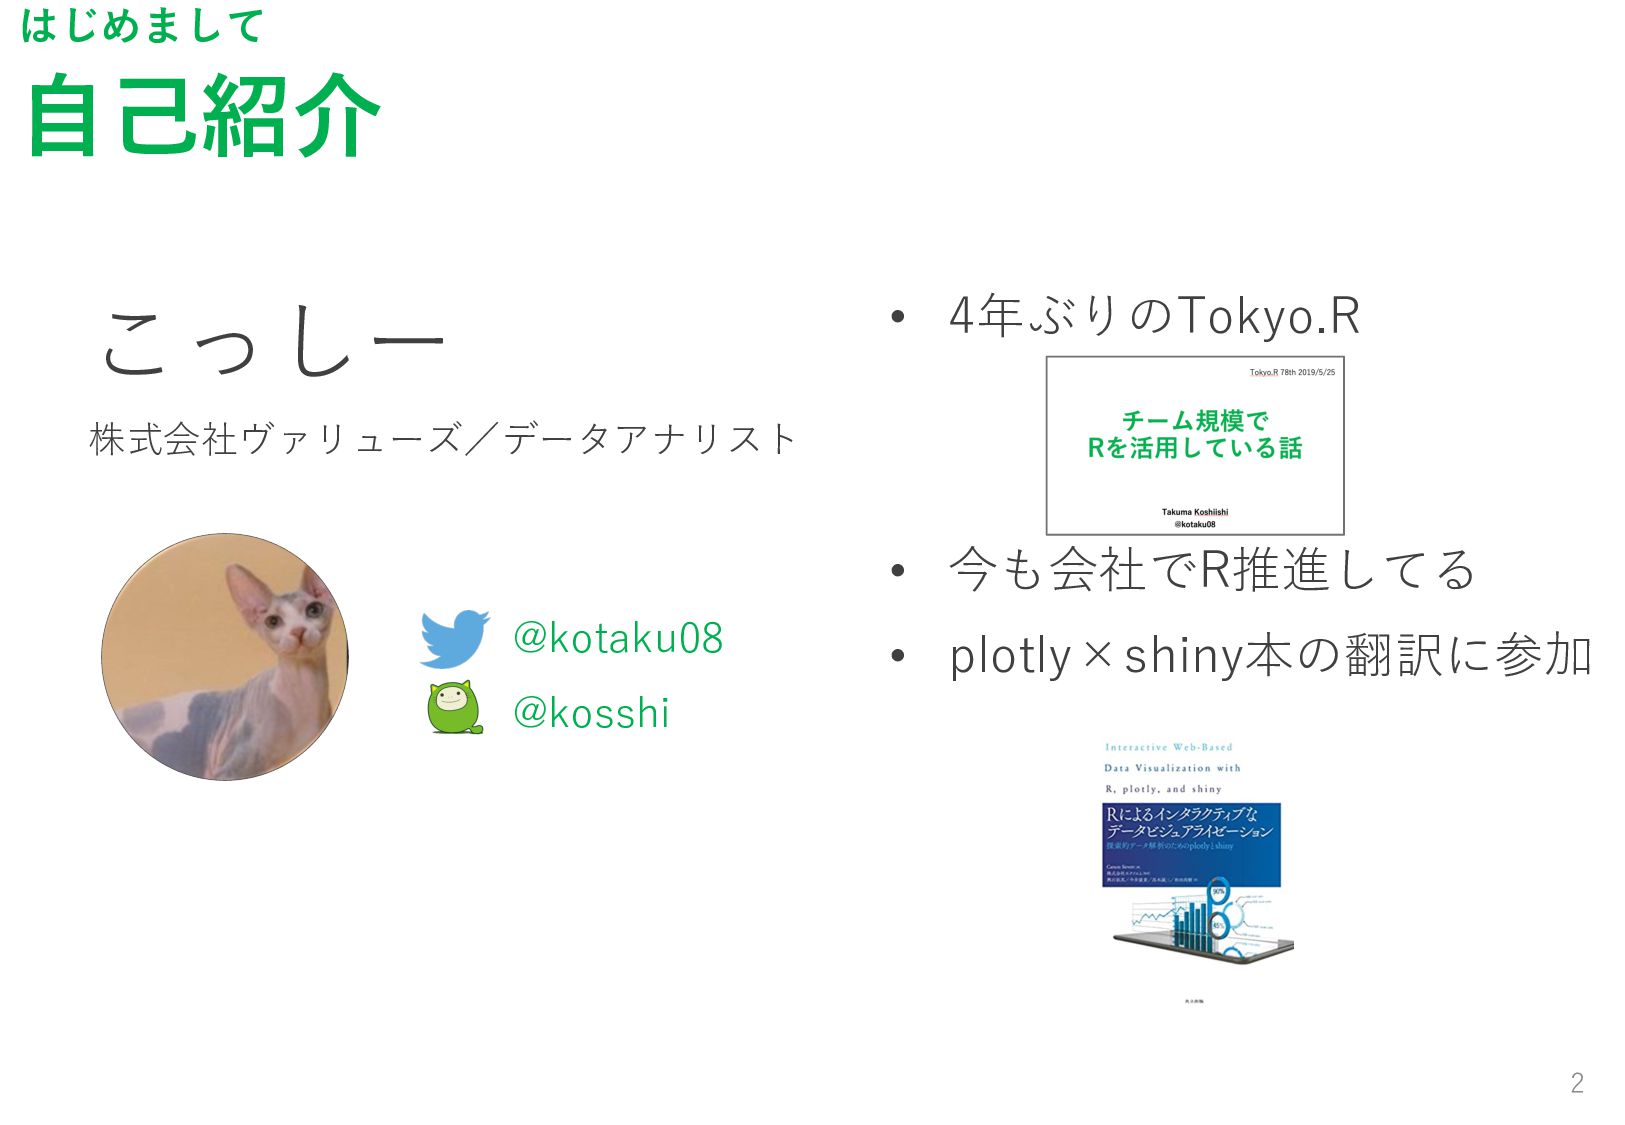
⾃⼰紹介 2 はじめまして こっしー 株式会社ヴァリューズ/データアナリスト @kotaku08 @kosshi • 4年ぶりのTokyo.R •
今も会社でR推進してる • plotly×shiny本の翻訳に参加
今⽇の⽬的 3 plotly触ってみようかな!と思ってもらう
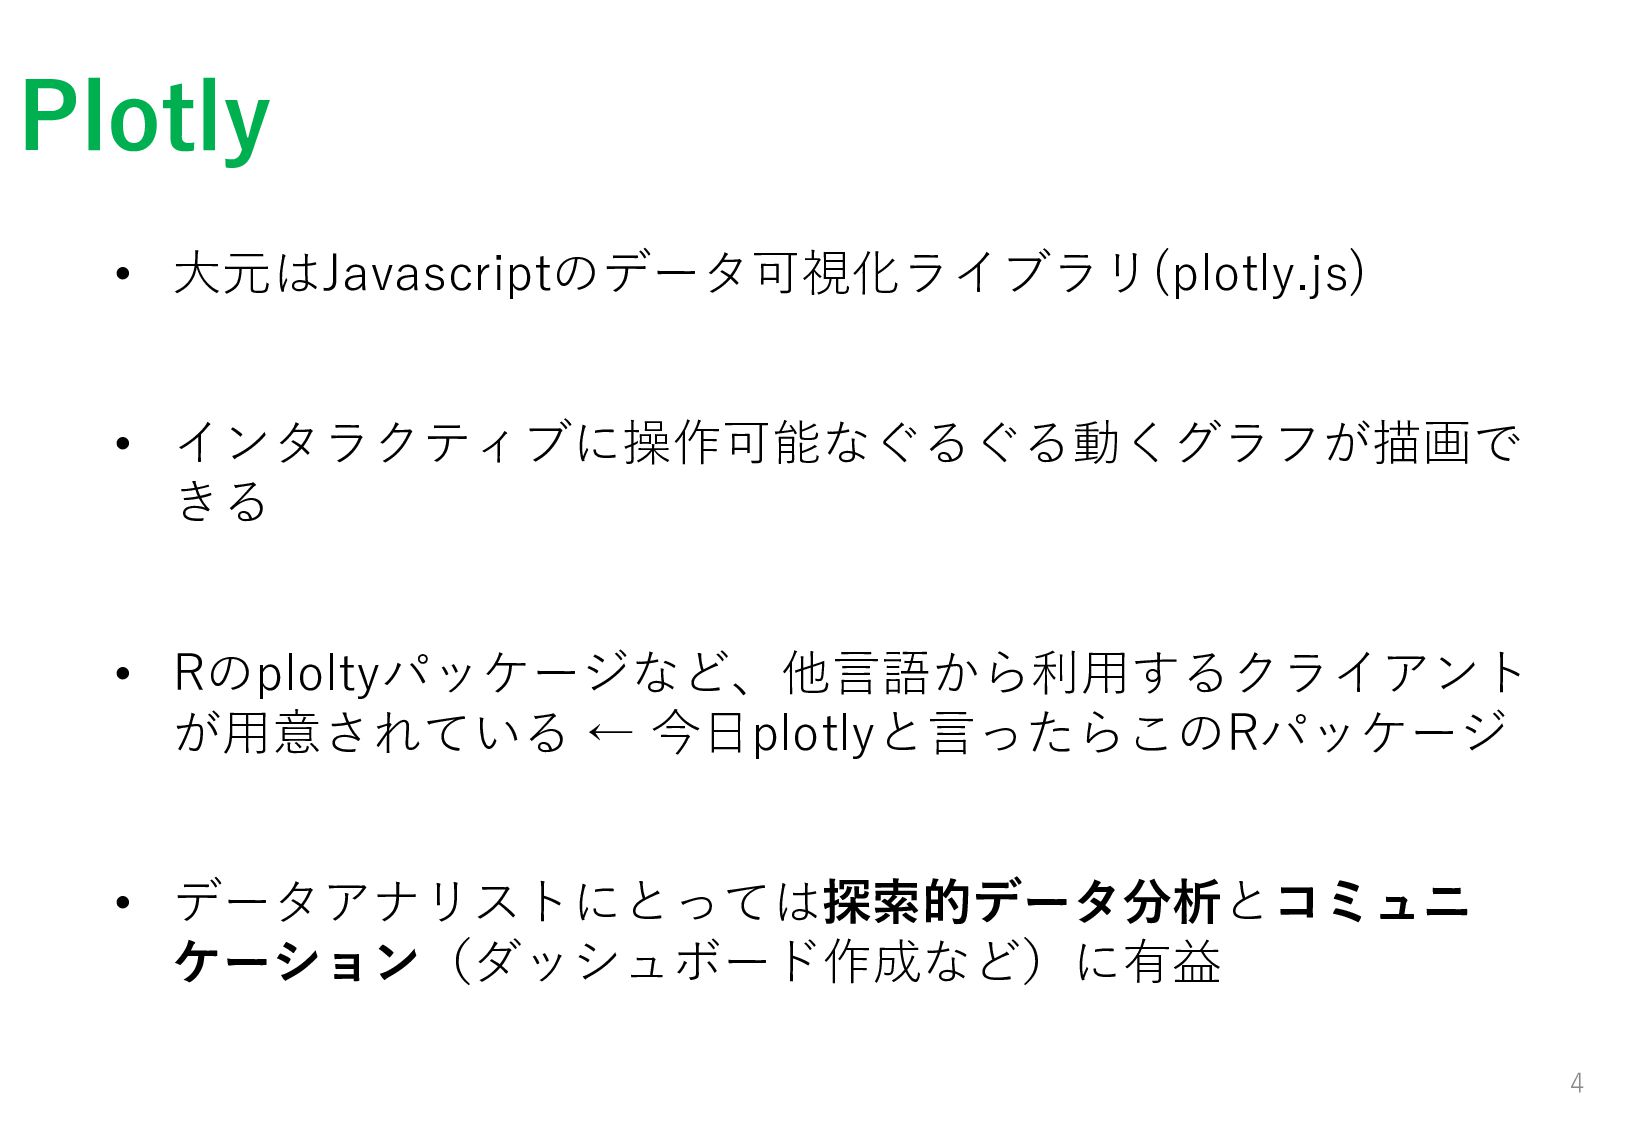
Plotly 4 • ⼤元はJavascriptのデータ可視化ライブラリ(plotly.js) • インタラクティブに操作可能なぐるぐる動くグラフが描画で きる • Rのploltyパッケージなど、他⾔語から利⽤するクライアント が⽤意されている
← 今⽇plotlyと⾔ったらこのRパッケージ • データアナリストにとっては探索的データ分析とコミュニ ケーション(ダッシュボード作成など)に有益
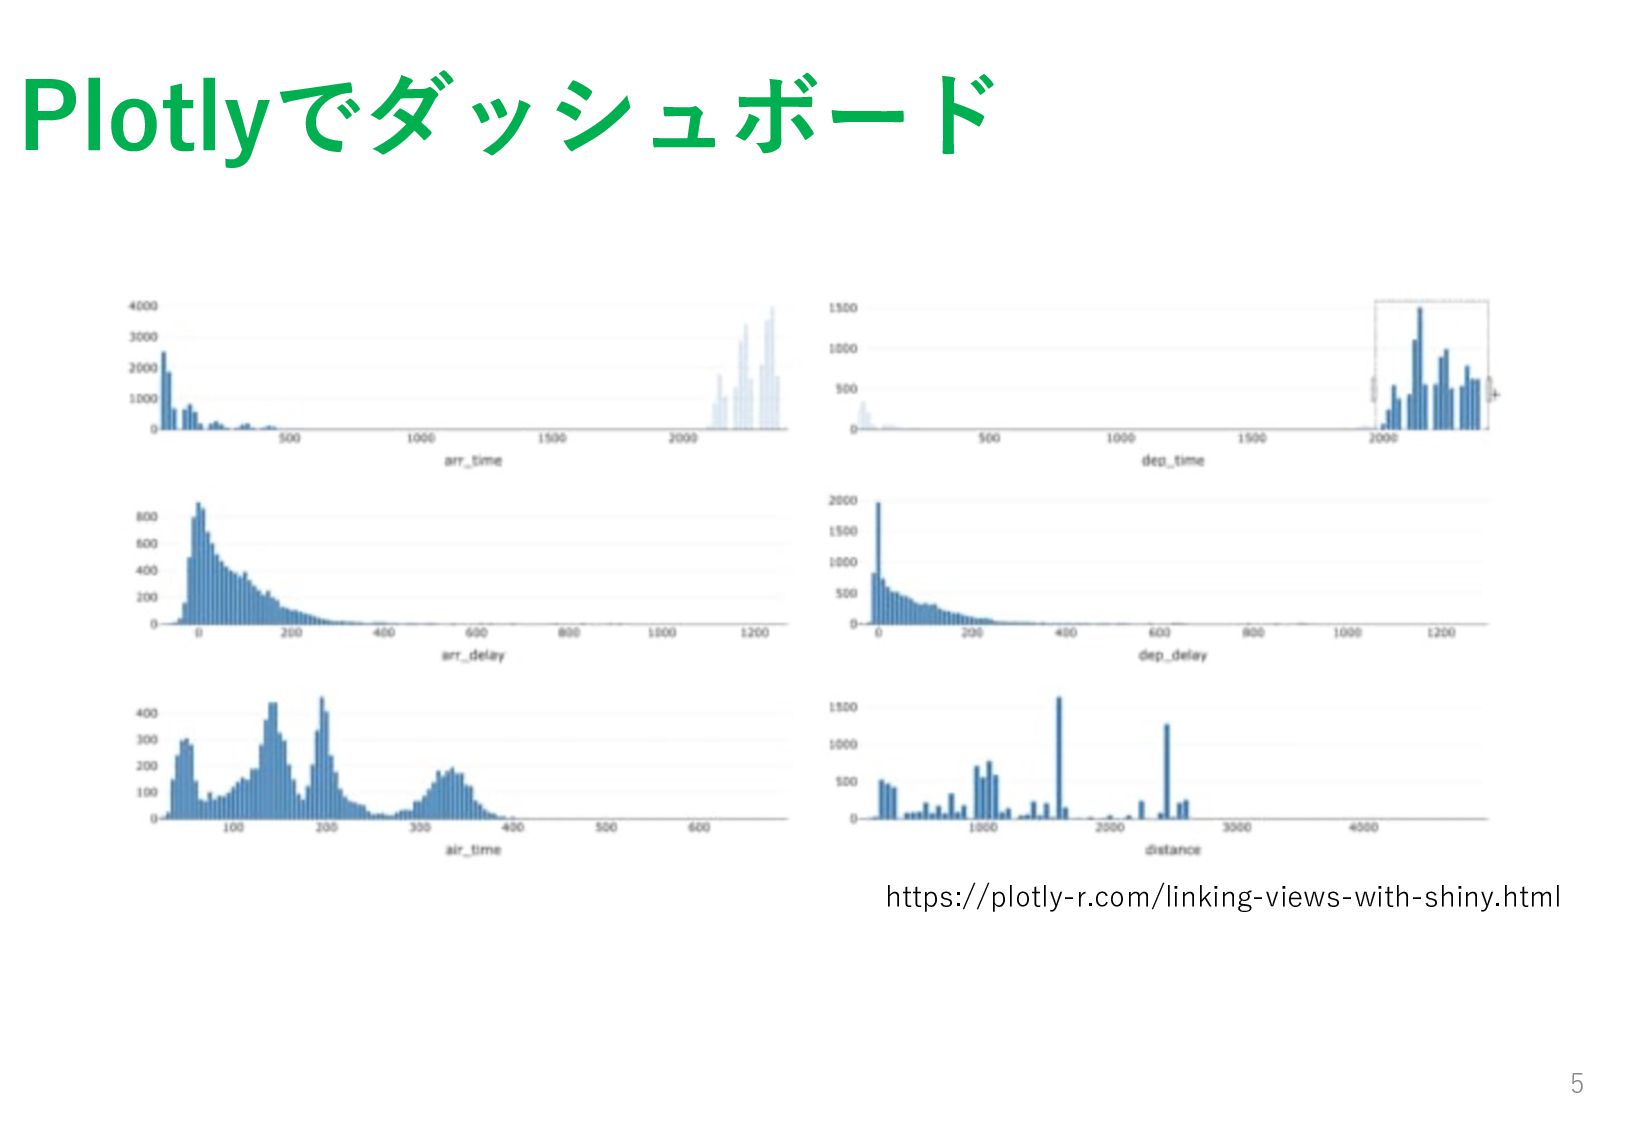
Plotlyでダッシュボード 5 https://plotly-r.com/linking-views-with-shiny.html
ここを推したいPlotly 6 • とにかく動く!楽しい • 多様な出⼒形式。HTML、SVG、PDFなどで保存可能。 Rmarkdown、shinyとも連携できる。 • ggplot2と連携できて、初めの⼀歩の敷居が低い。今⽇か ら使える!
2つのグラフの描画⽅法① 7 ①ggplot2を利⽤して描画 ◦ggplot2のグラフをggplotly()に渡すだけ で簡単! ◦複雑なことでもggplot2とその拡張パッ ケージに任せられるのが嬉しい! ×対応してないgeomもある。
2つのグラフの描画⽅法② 8 ②plotlyの記法で描画 ◦plotlyパッケージ独⾃の書き⽅だが、 ggplot2の書き⽅が⼟台にあり、Rユーザに 優しい。 ◦インタラクティブな点のカスタマイズ性 に優れる。習熟するならこっち。
まとめ 9 • plotlyパッケージで動くグラフが作れるよ! • ggplot2と直接連携しているし、⽂法も似ているので ggplot2ユーザは簡単に始められるよ! • ⼀歩踏み出したらインタラクティブ性を極める旅に出かけ よう!(グラフ同⼠の連携やshinyアプリ作成など)
Enjoy! 10 仕事でR使いたい⼈募集しています! 興味がある⽅是⾮DMください!
参考⽂献 11 • 「Interactive web-based data visualization with R, plotly,
and shiny」https://plotly-r.com/index.html • 「Rによるインタラクティブなデータビジュアライゼー ション: 探索的データ解析のためのplotlyとshiny」