Upgrade to Pro — share decks privately, control downloads, hide ads and more …

Connecting the Dots Between Site Speed, User Ex...

Connecting the Dots Between Site Speed, User Experience & Your Business [WebExpo 2025]

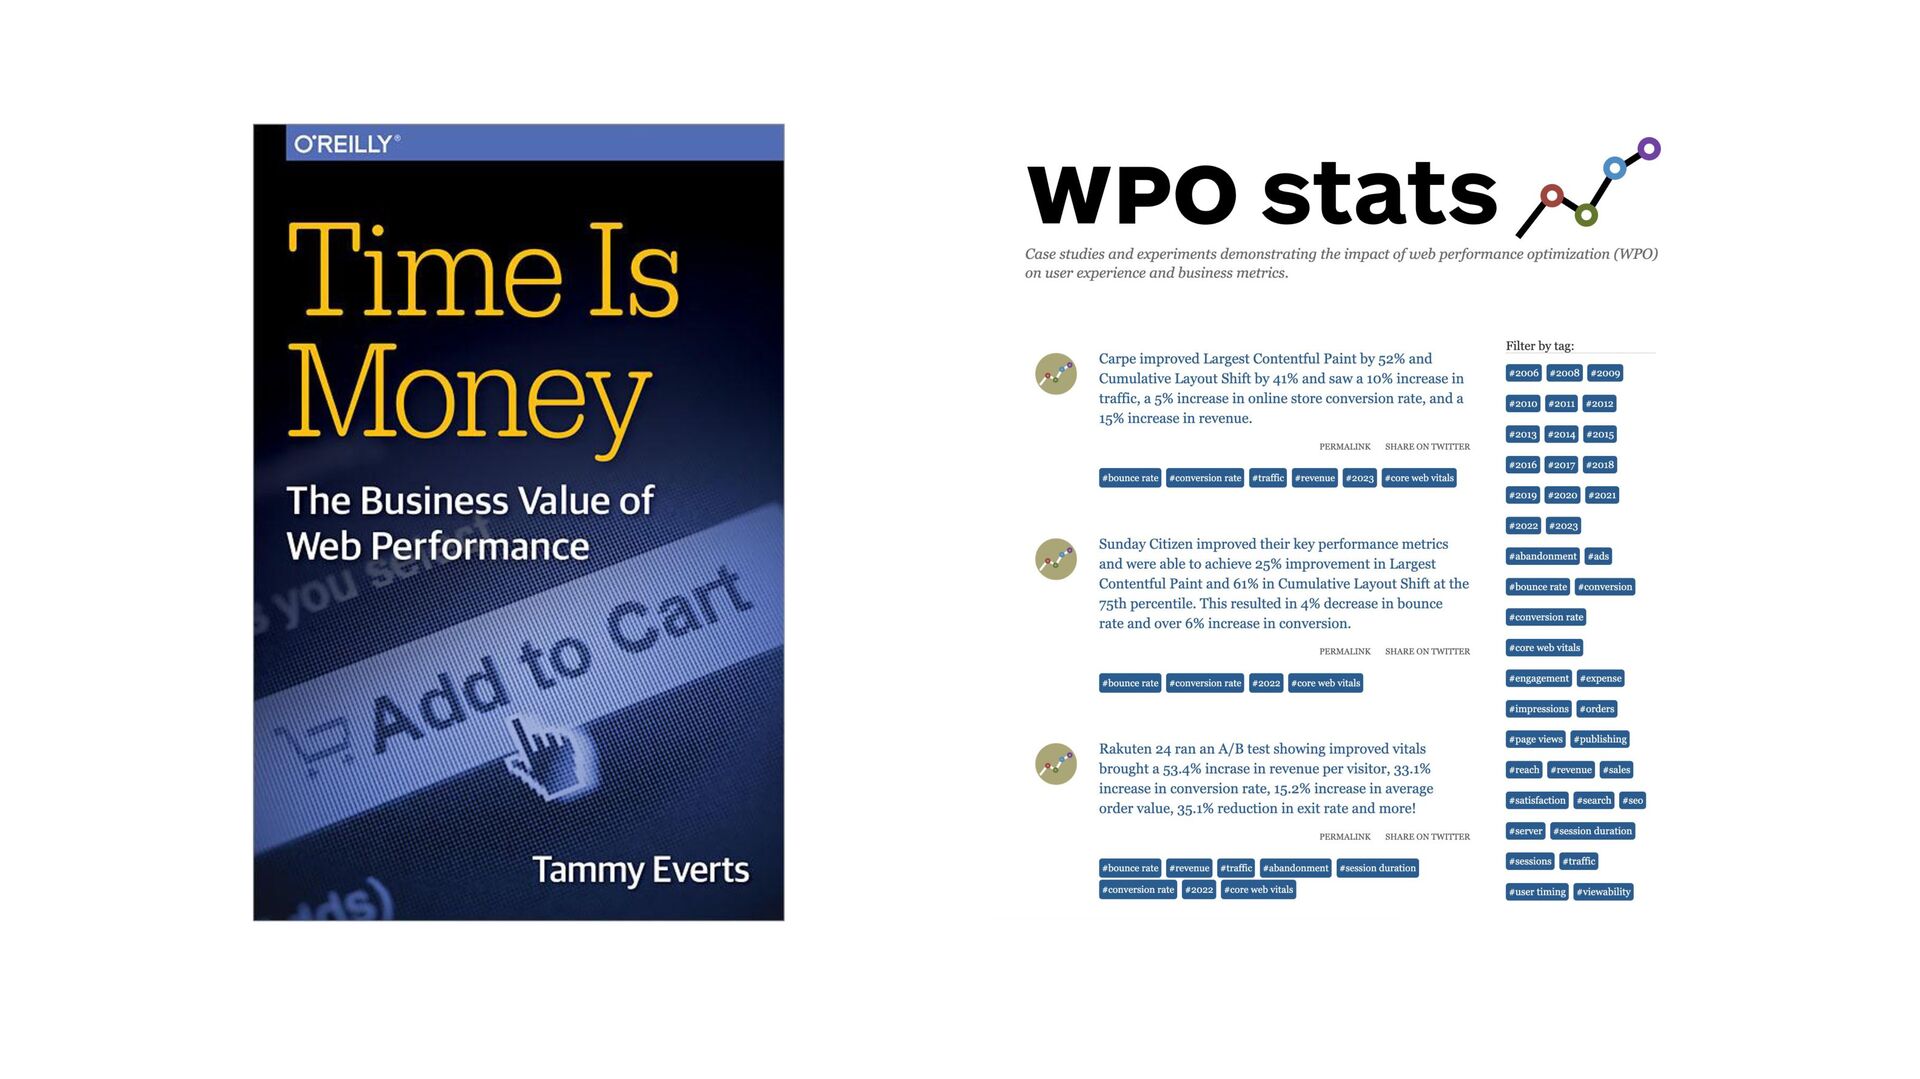
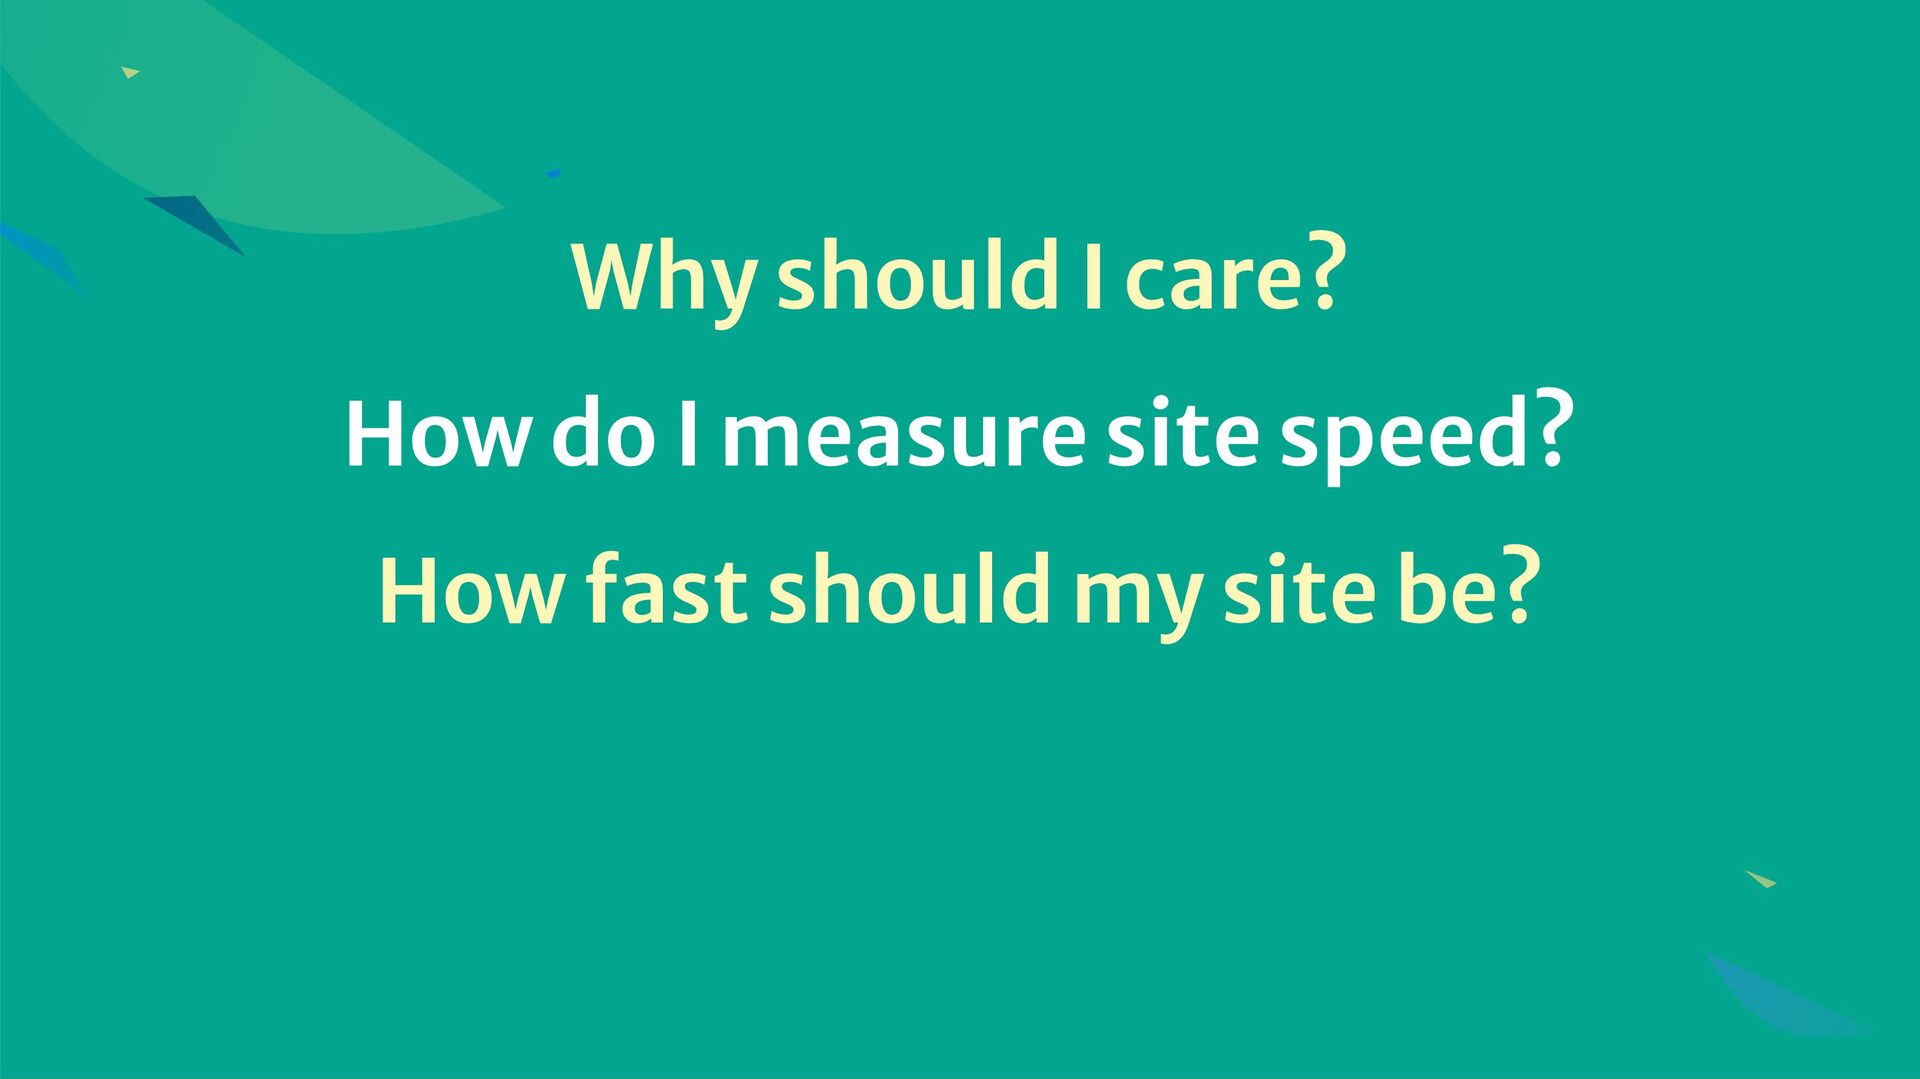
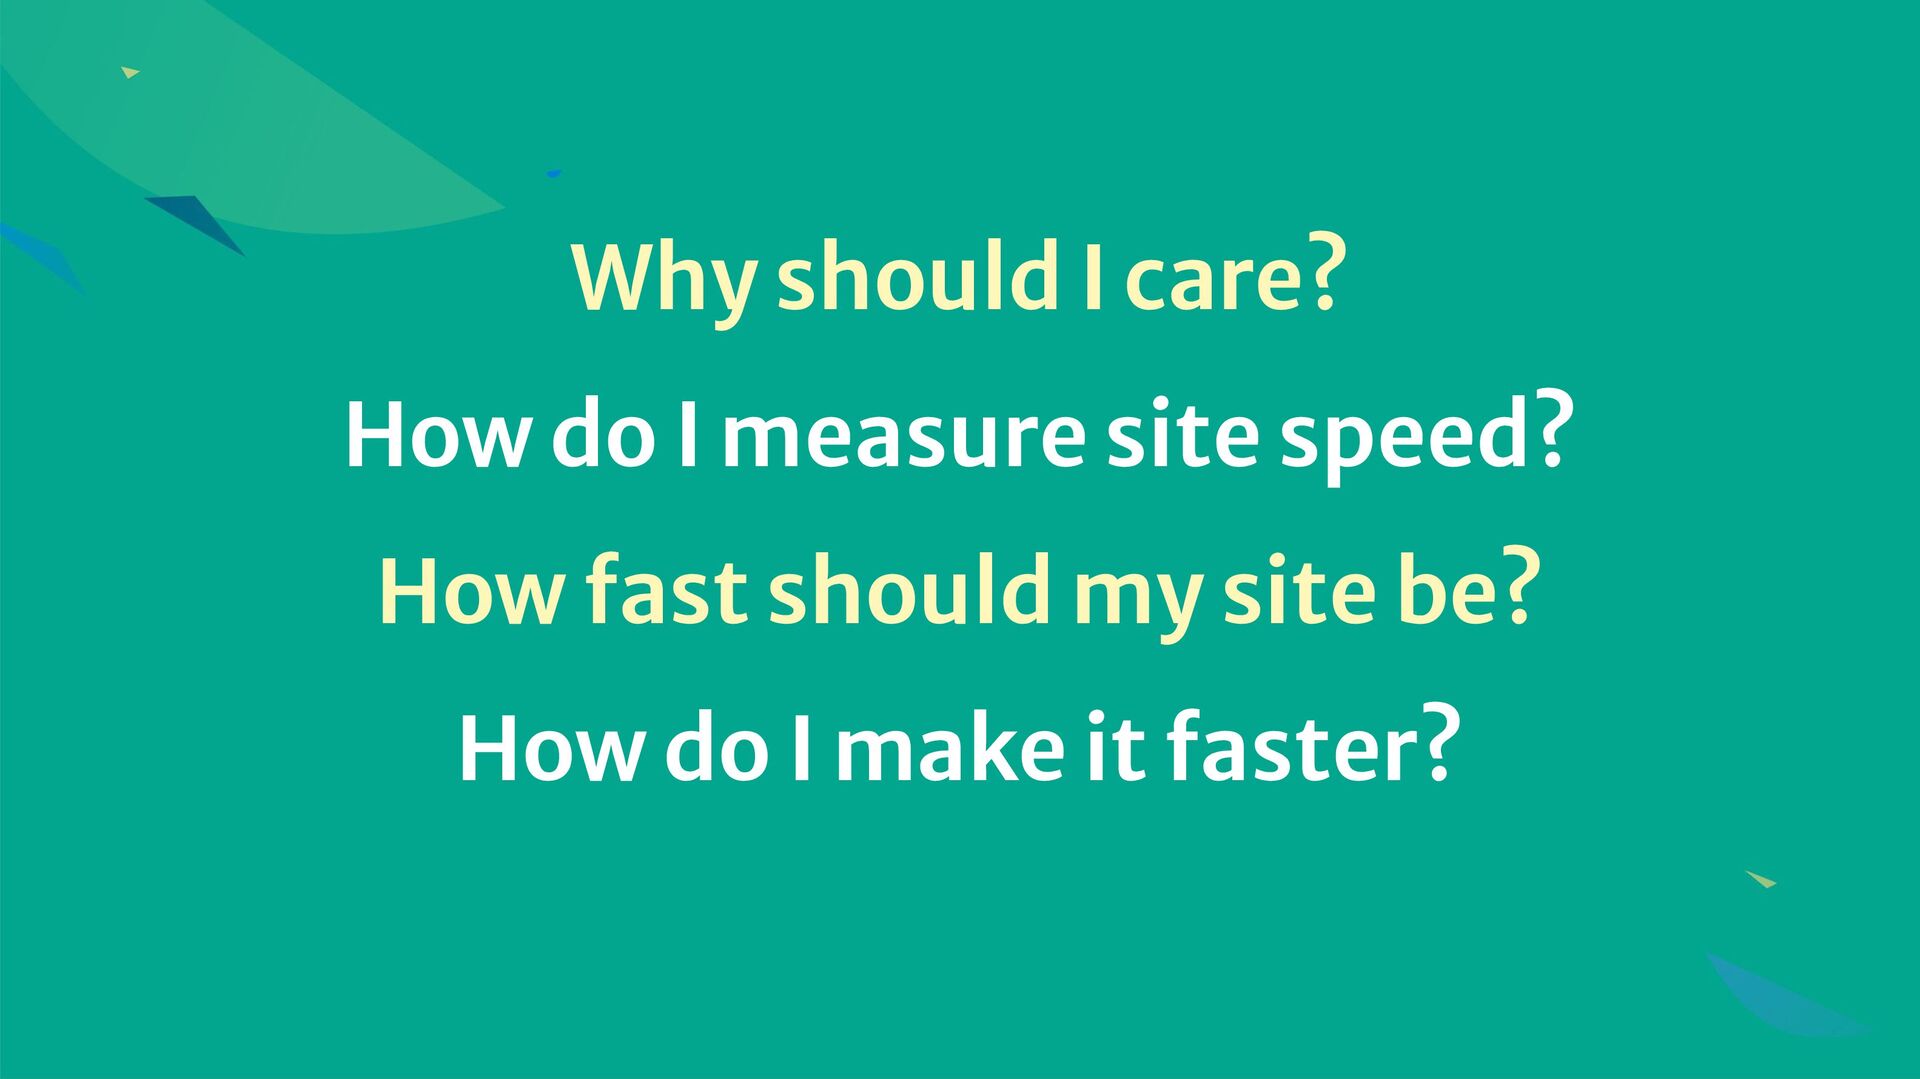
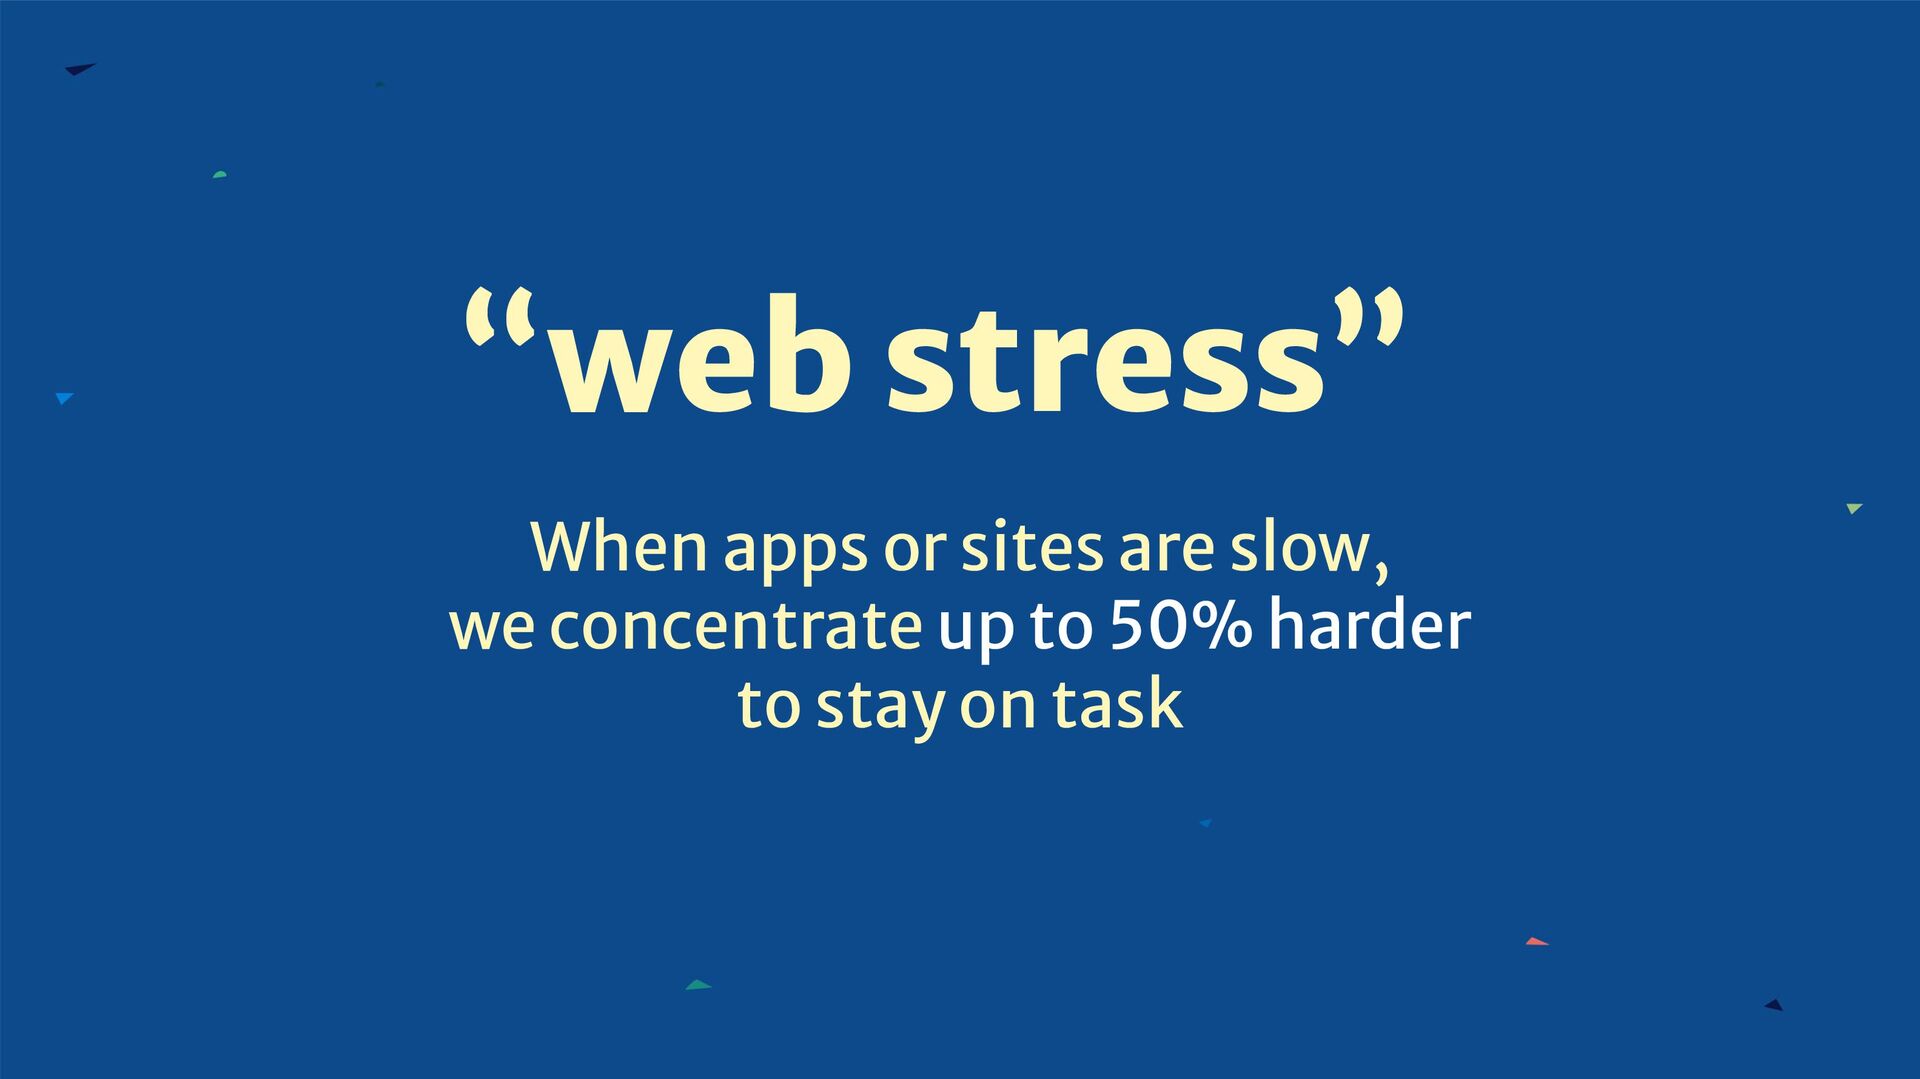
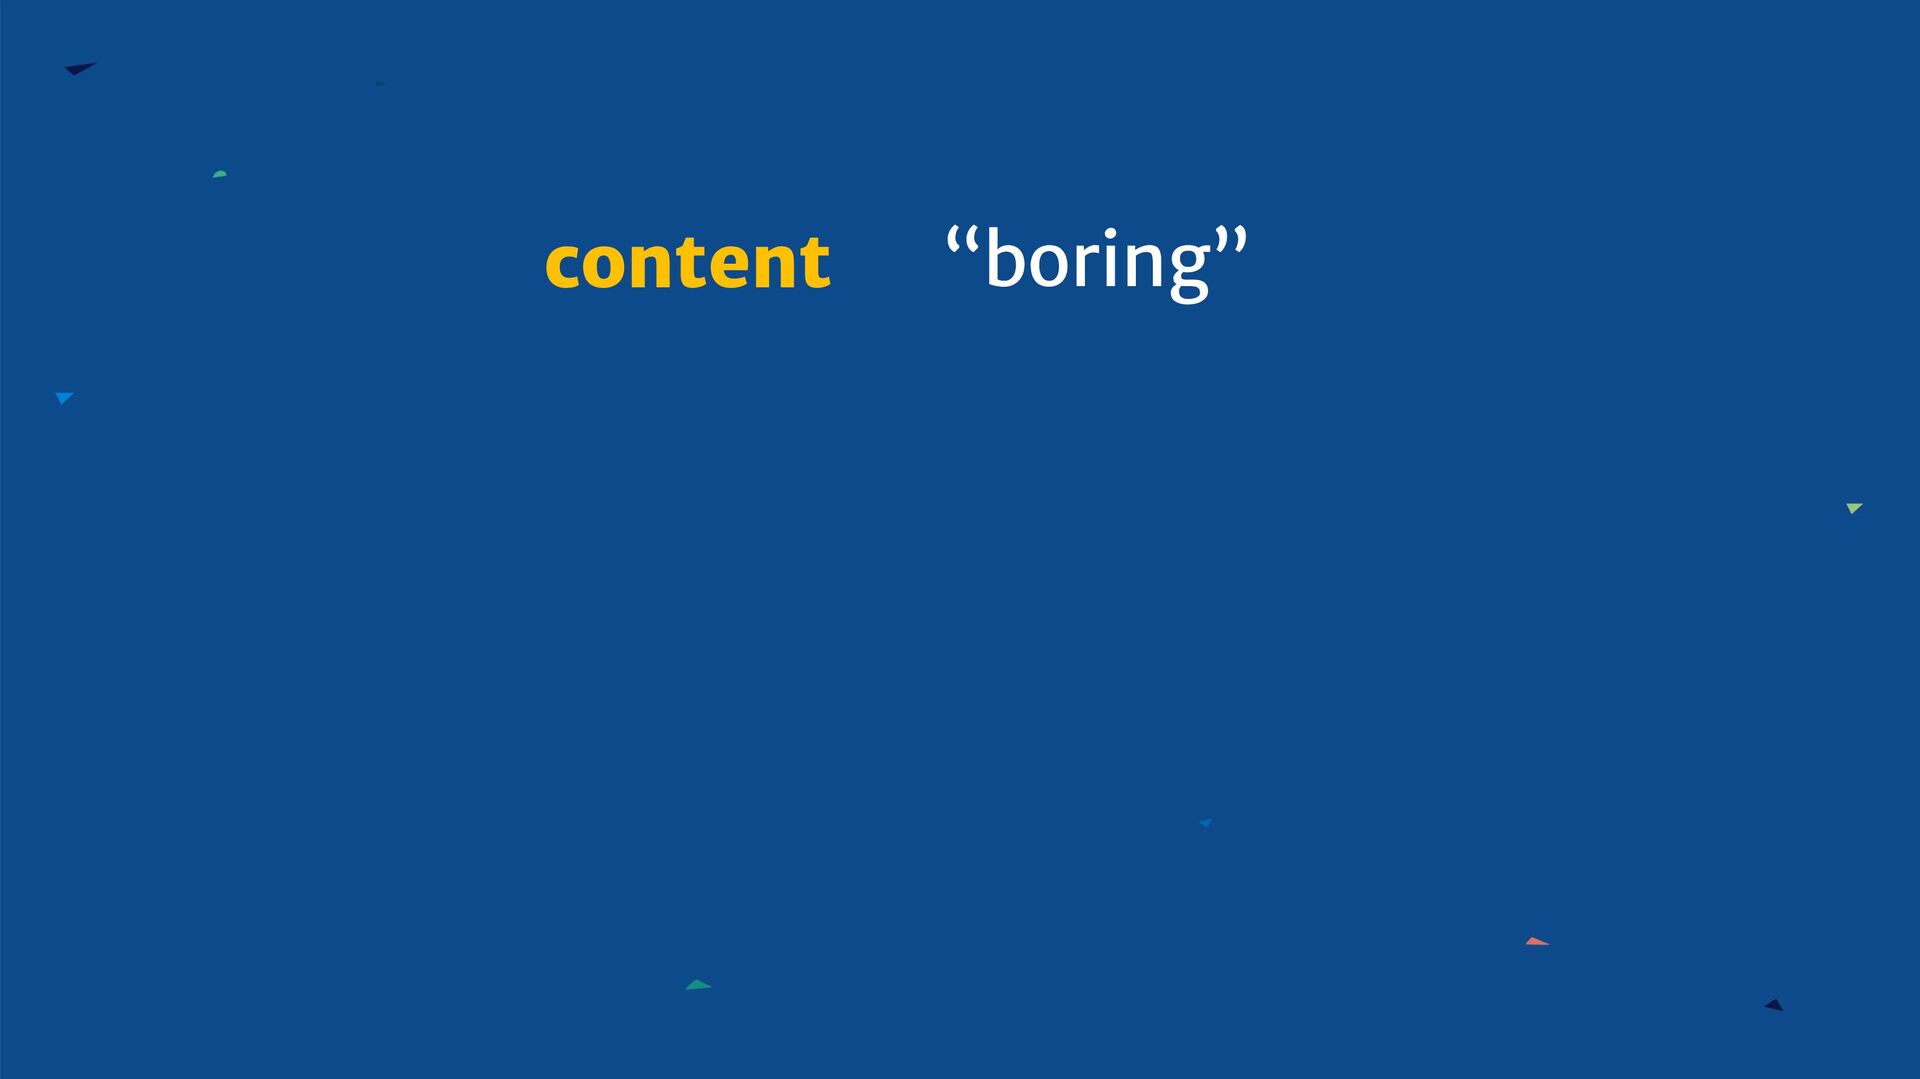
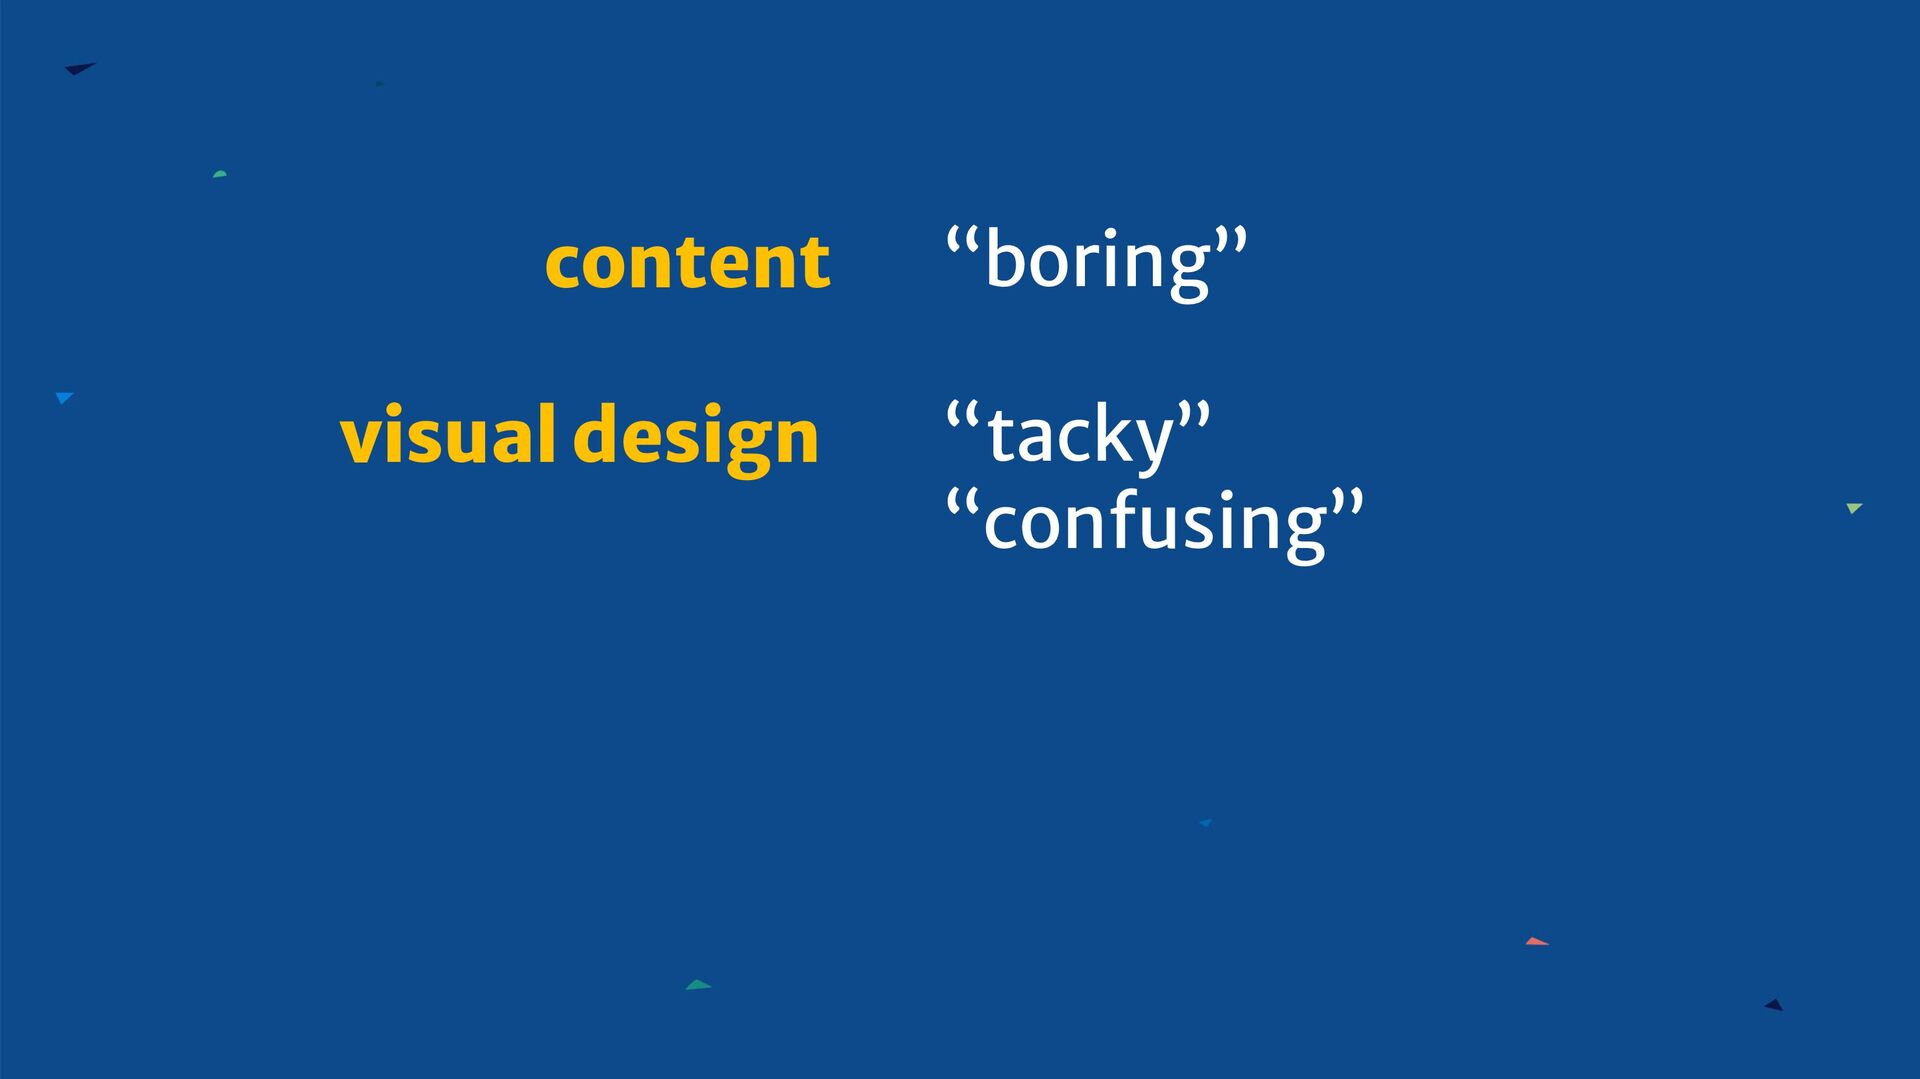
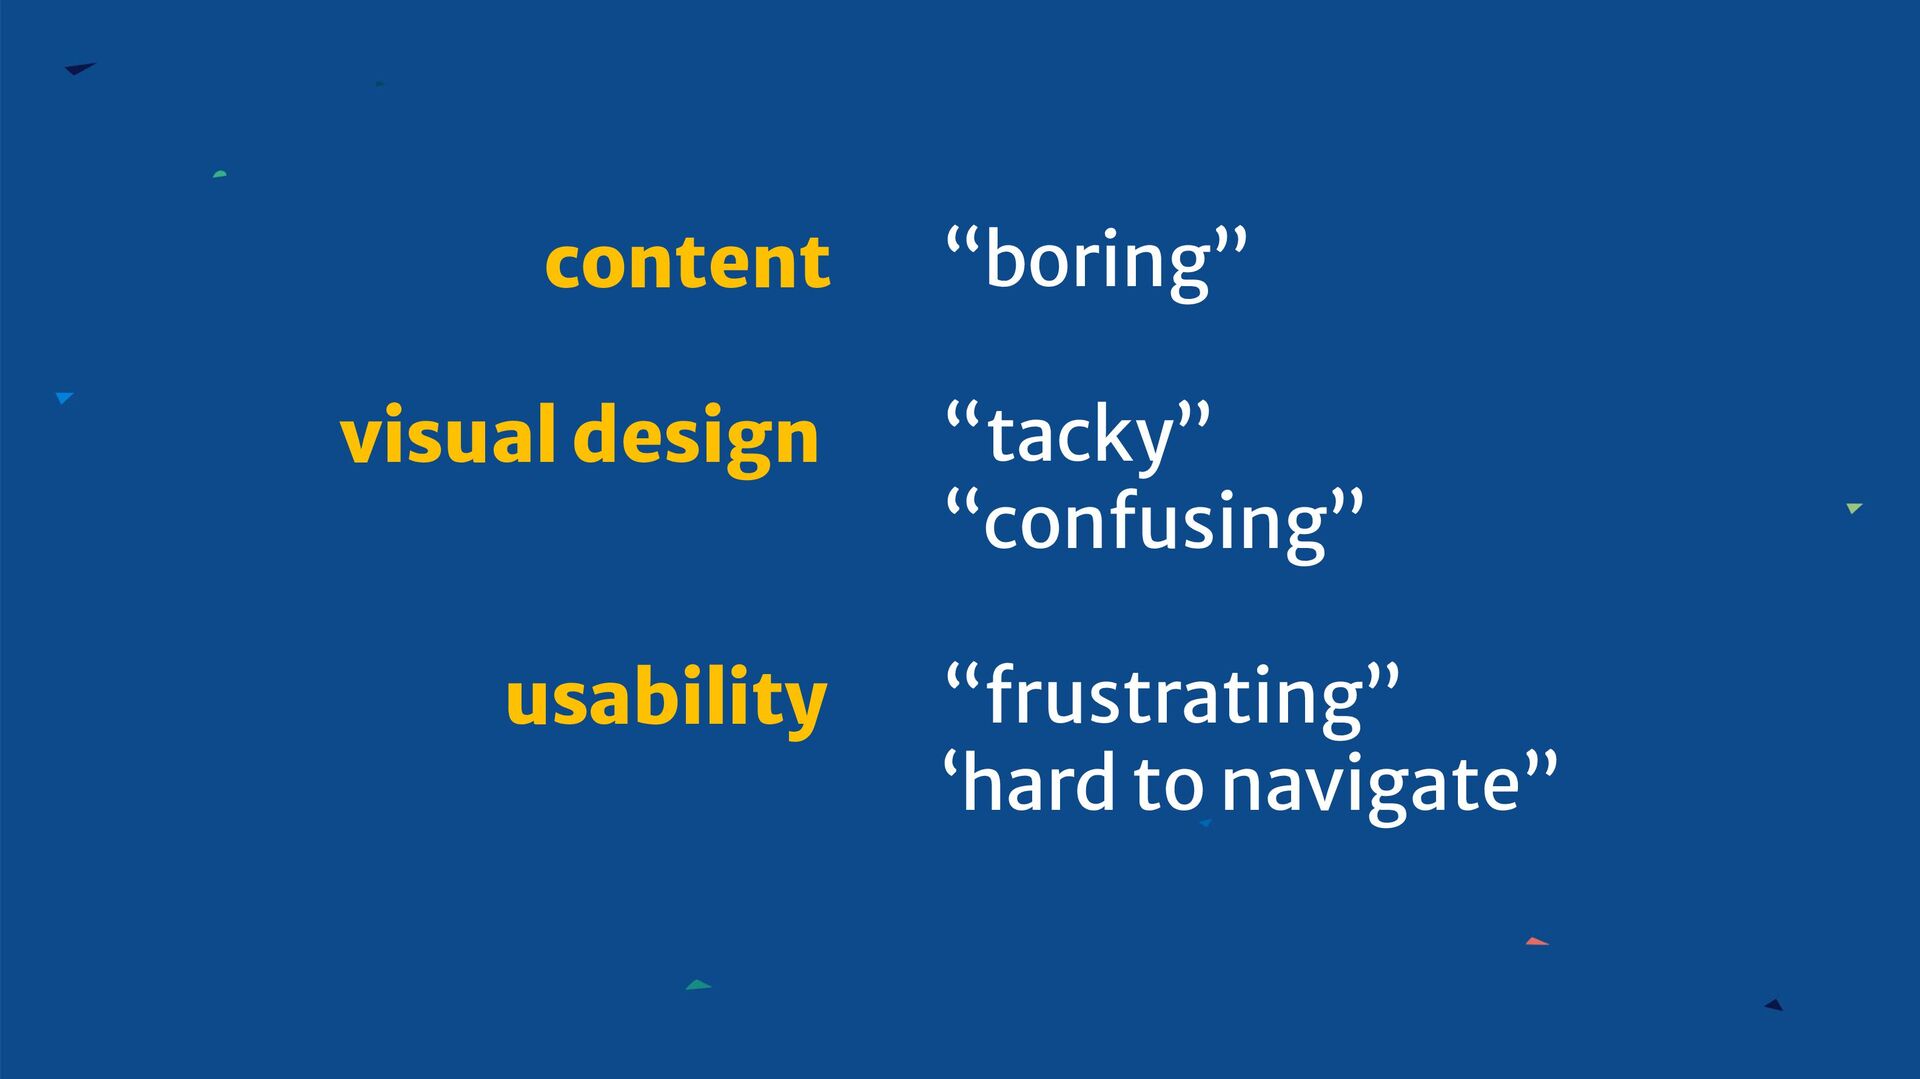
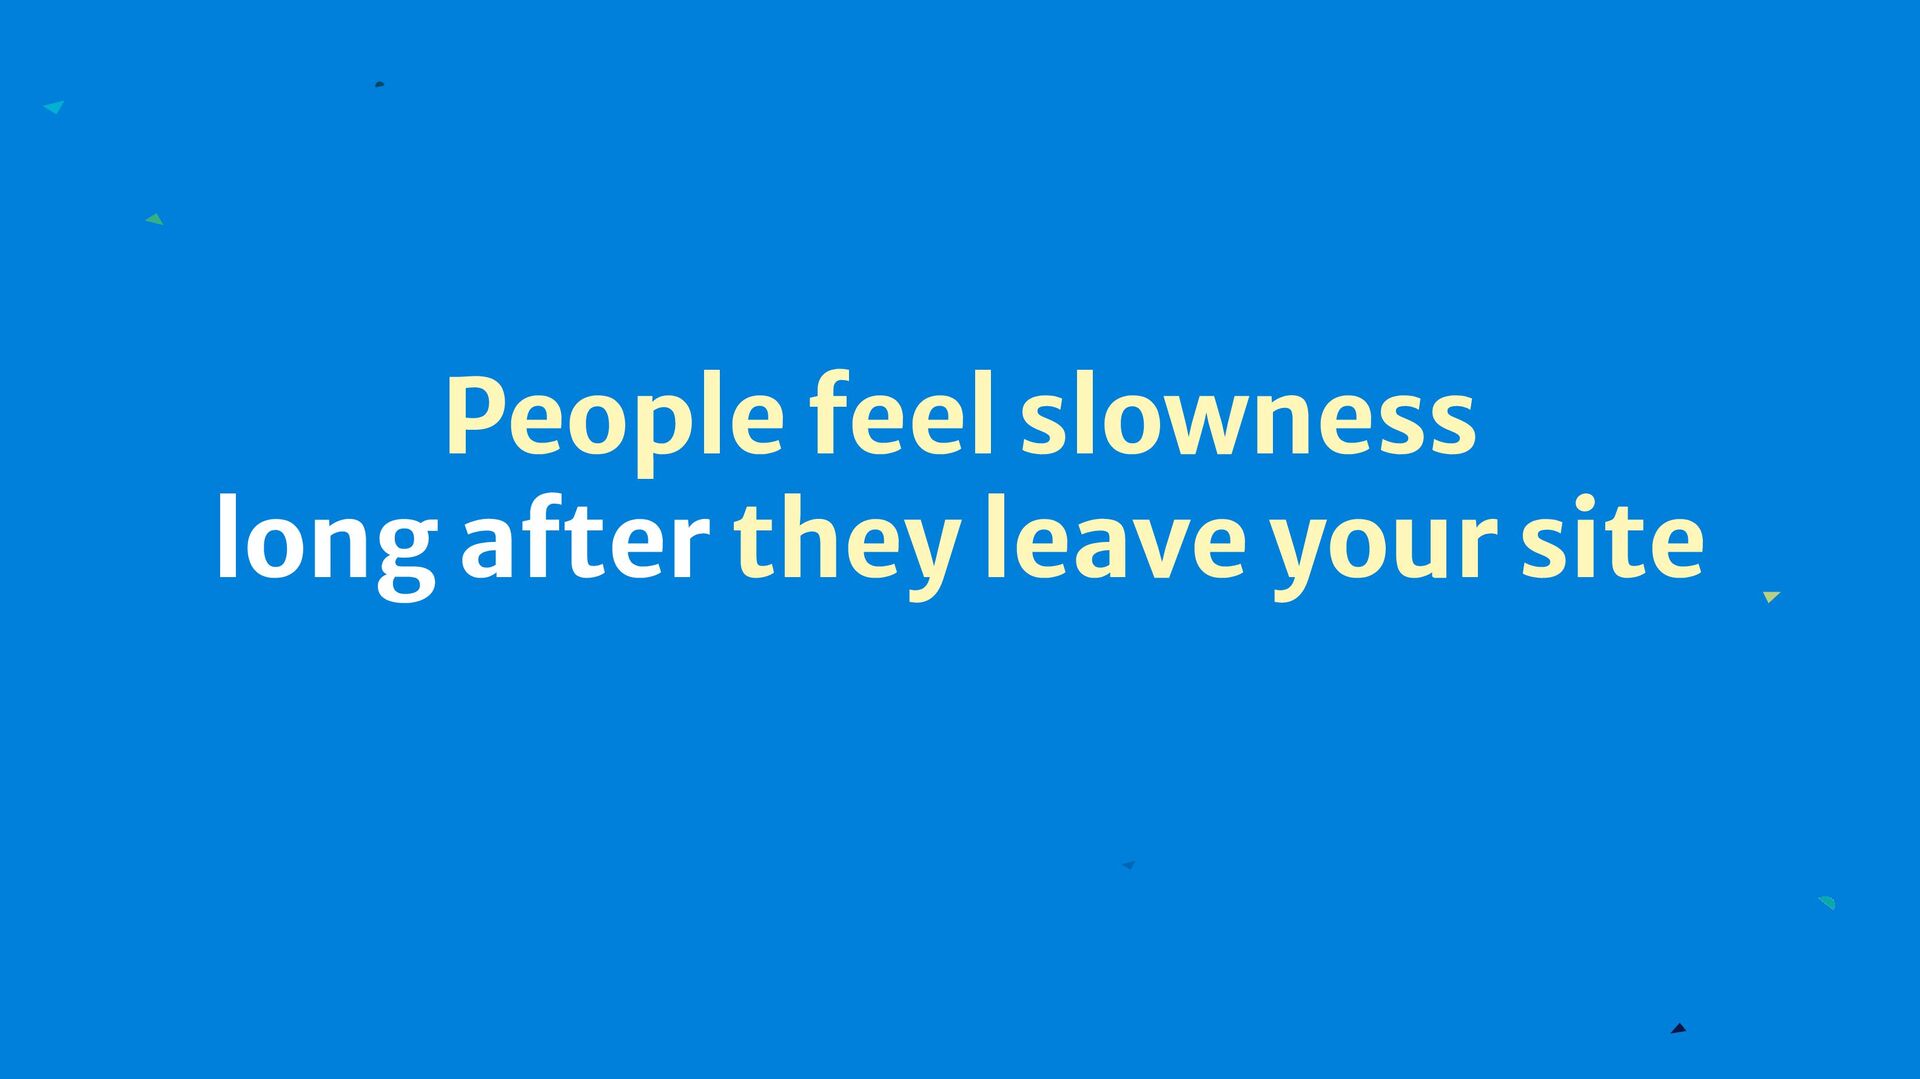
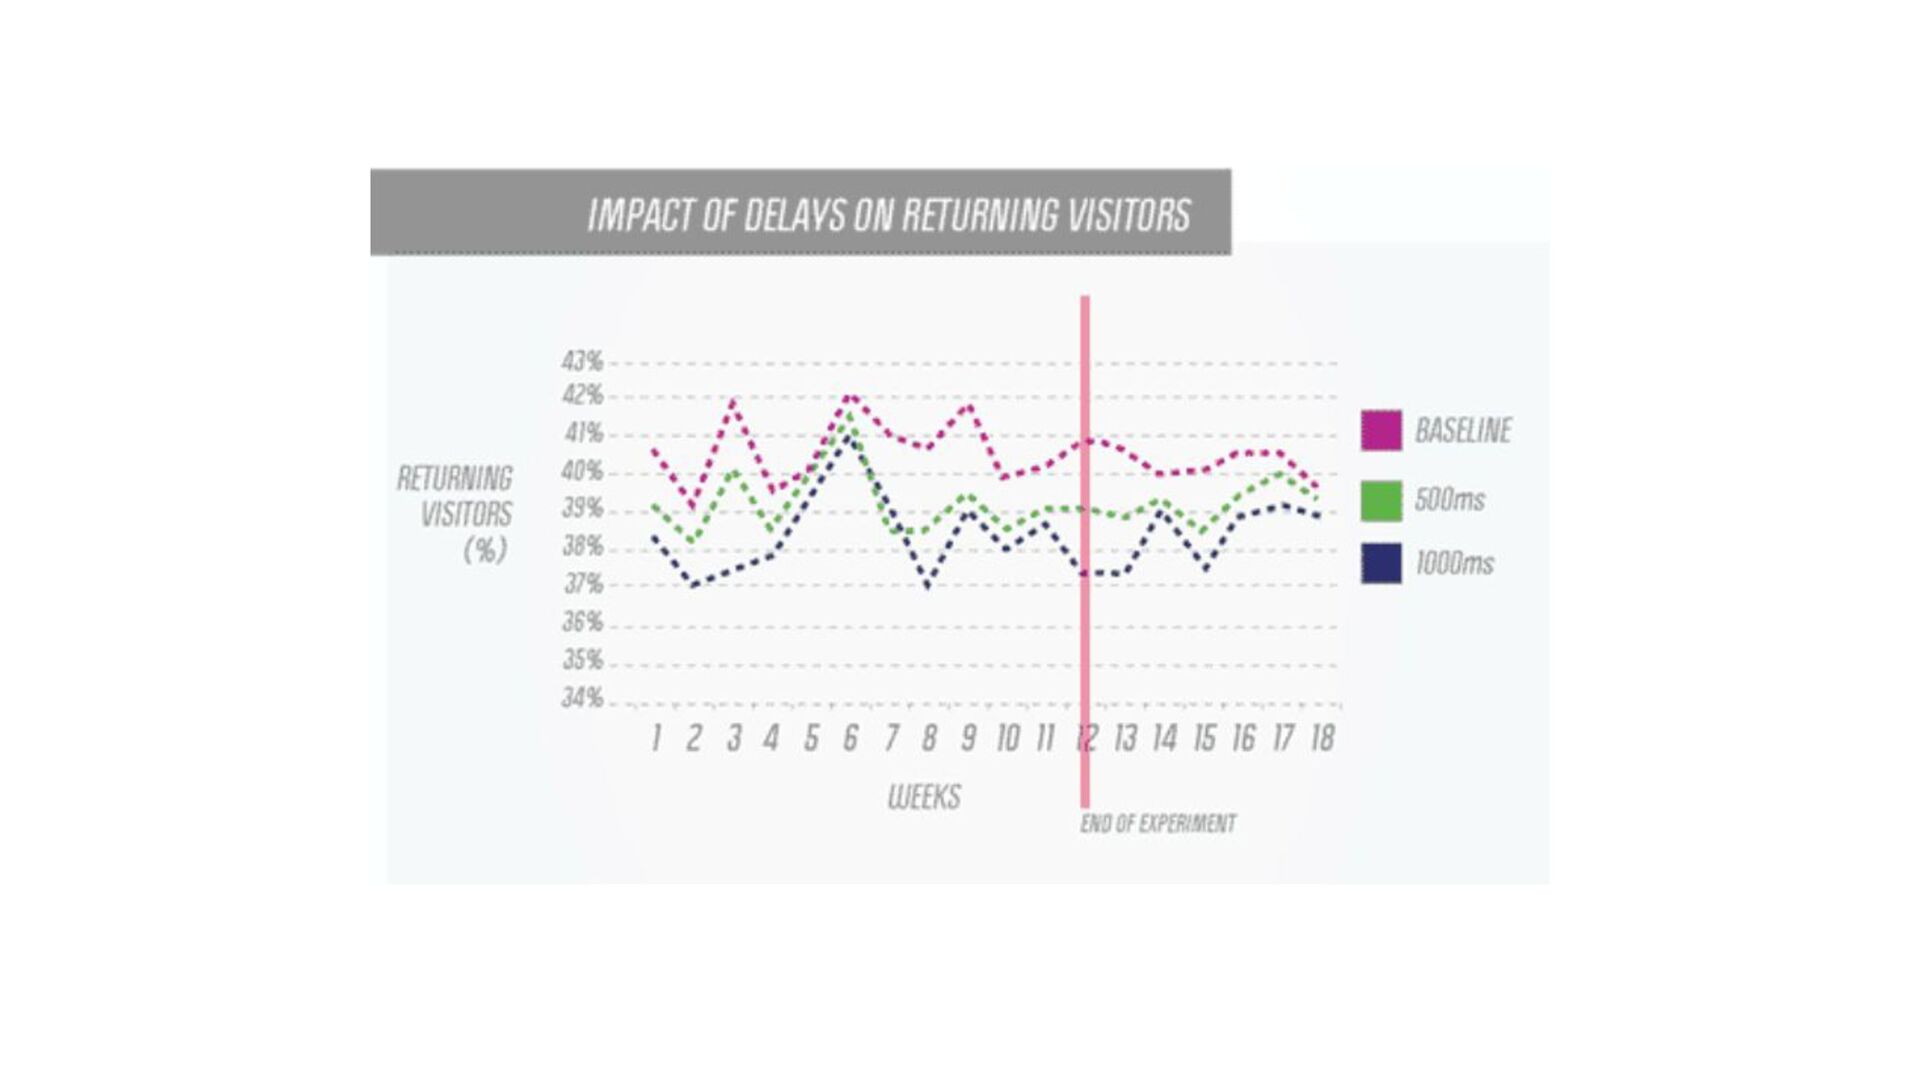
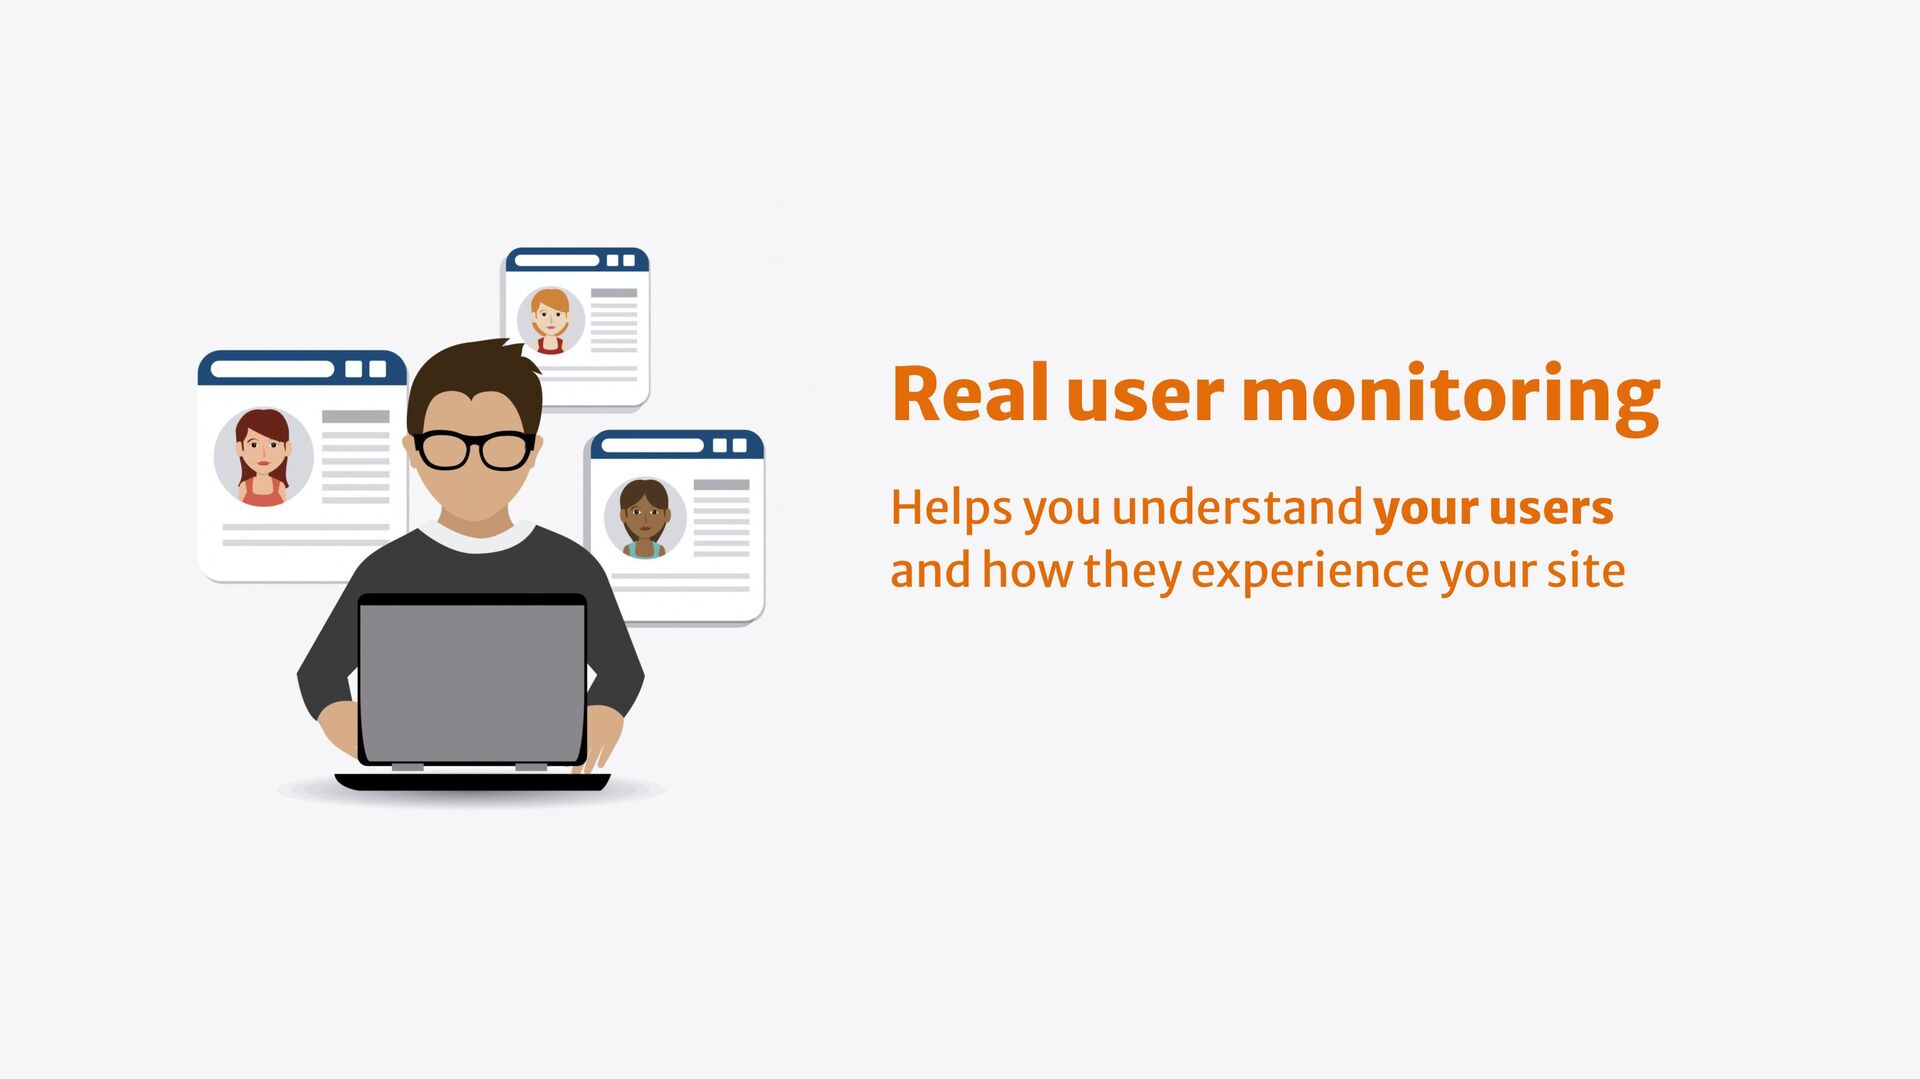
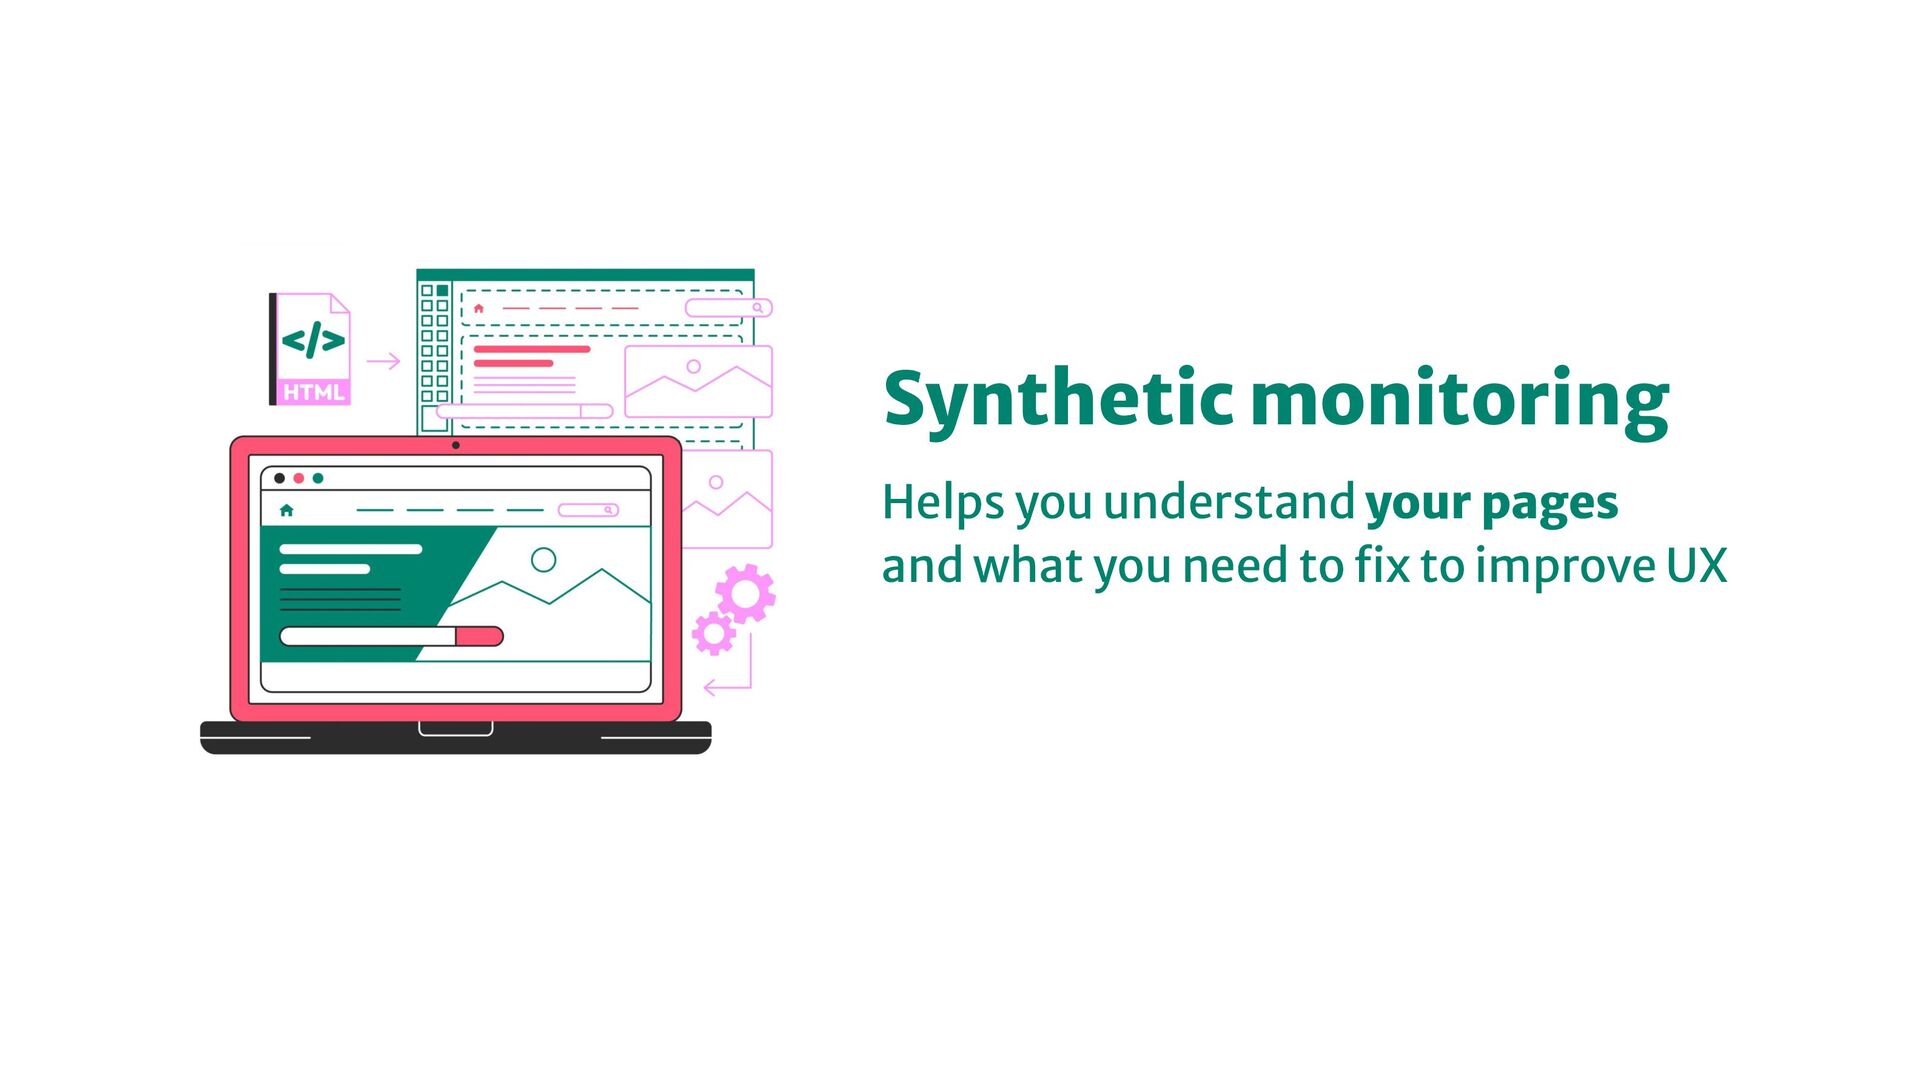
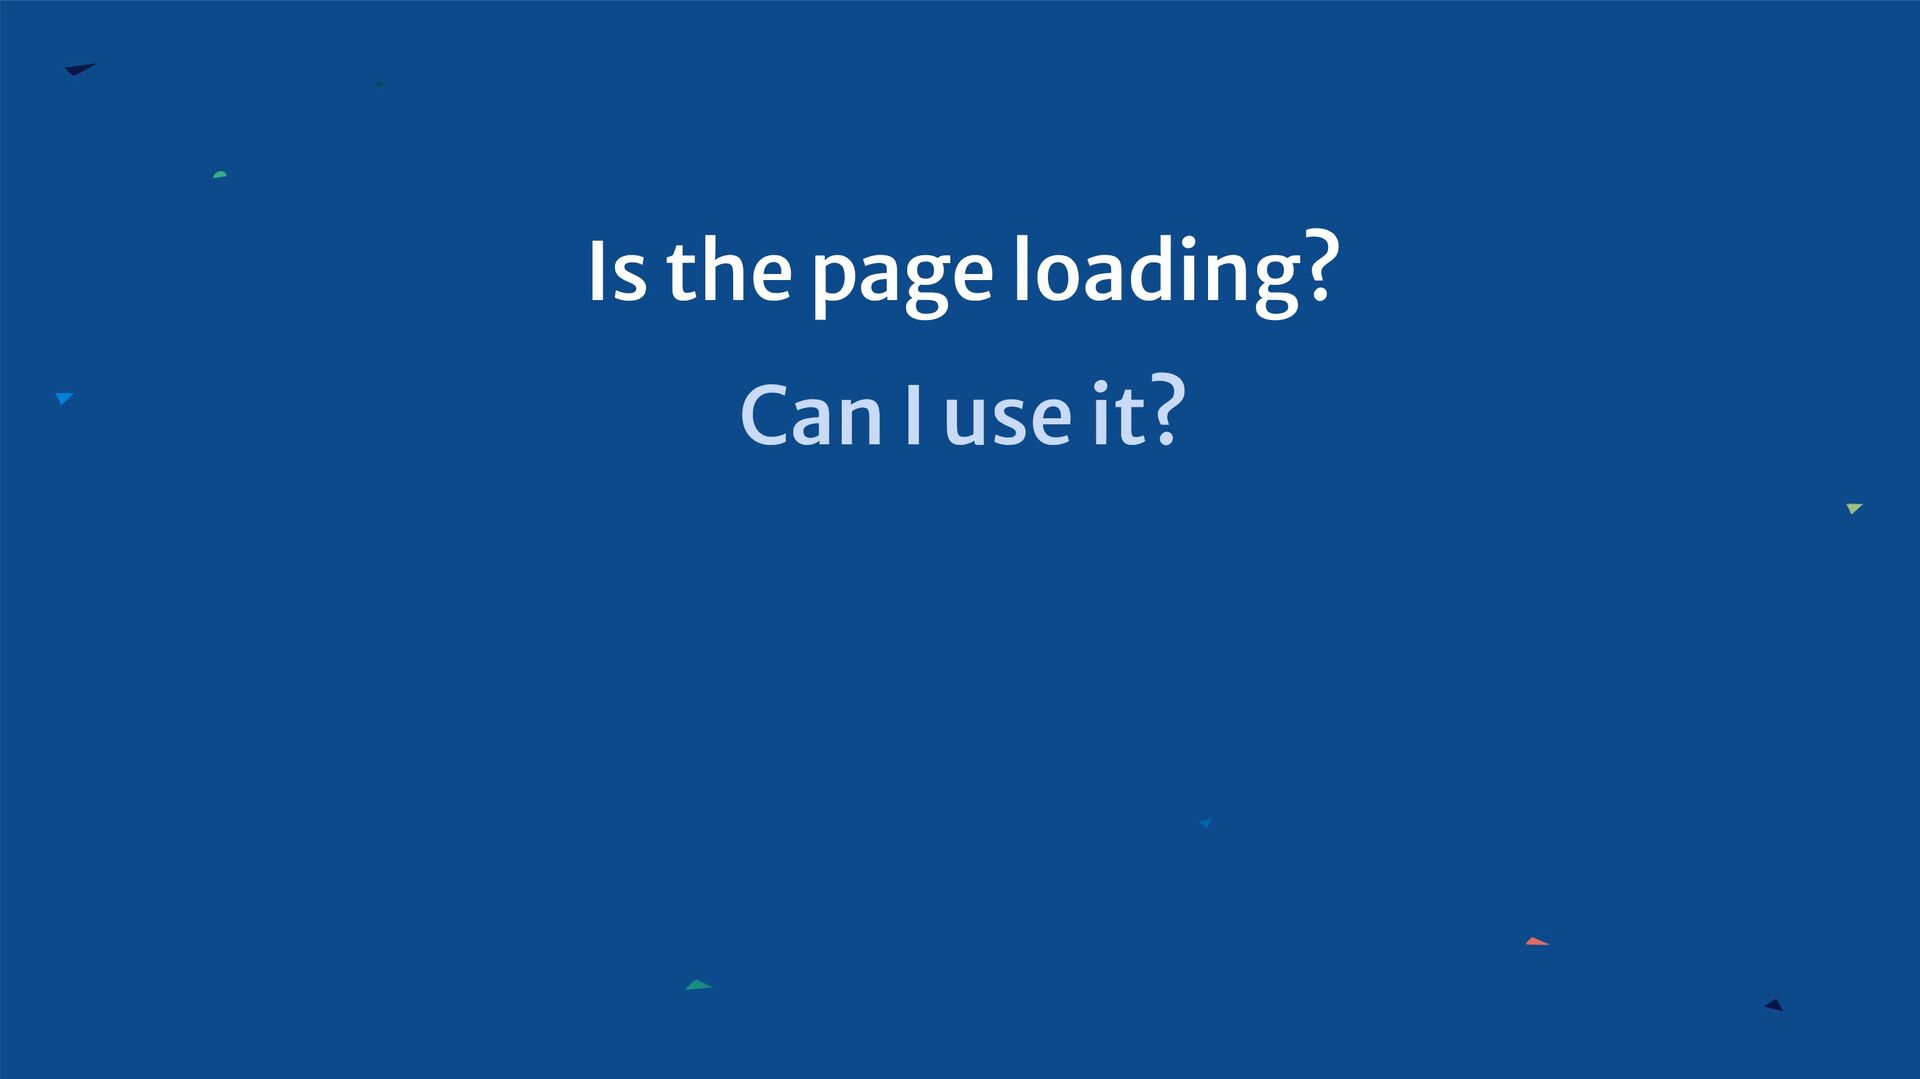
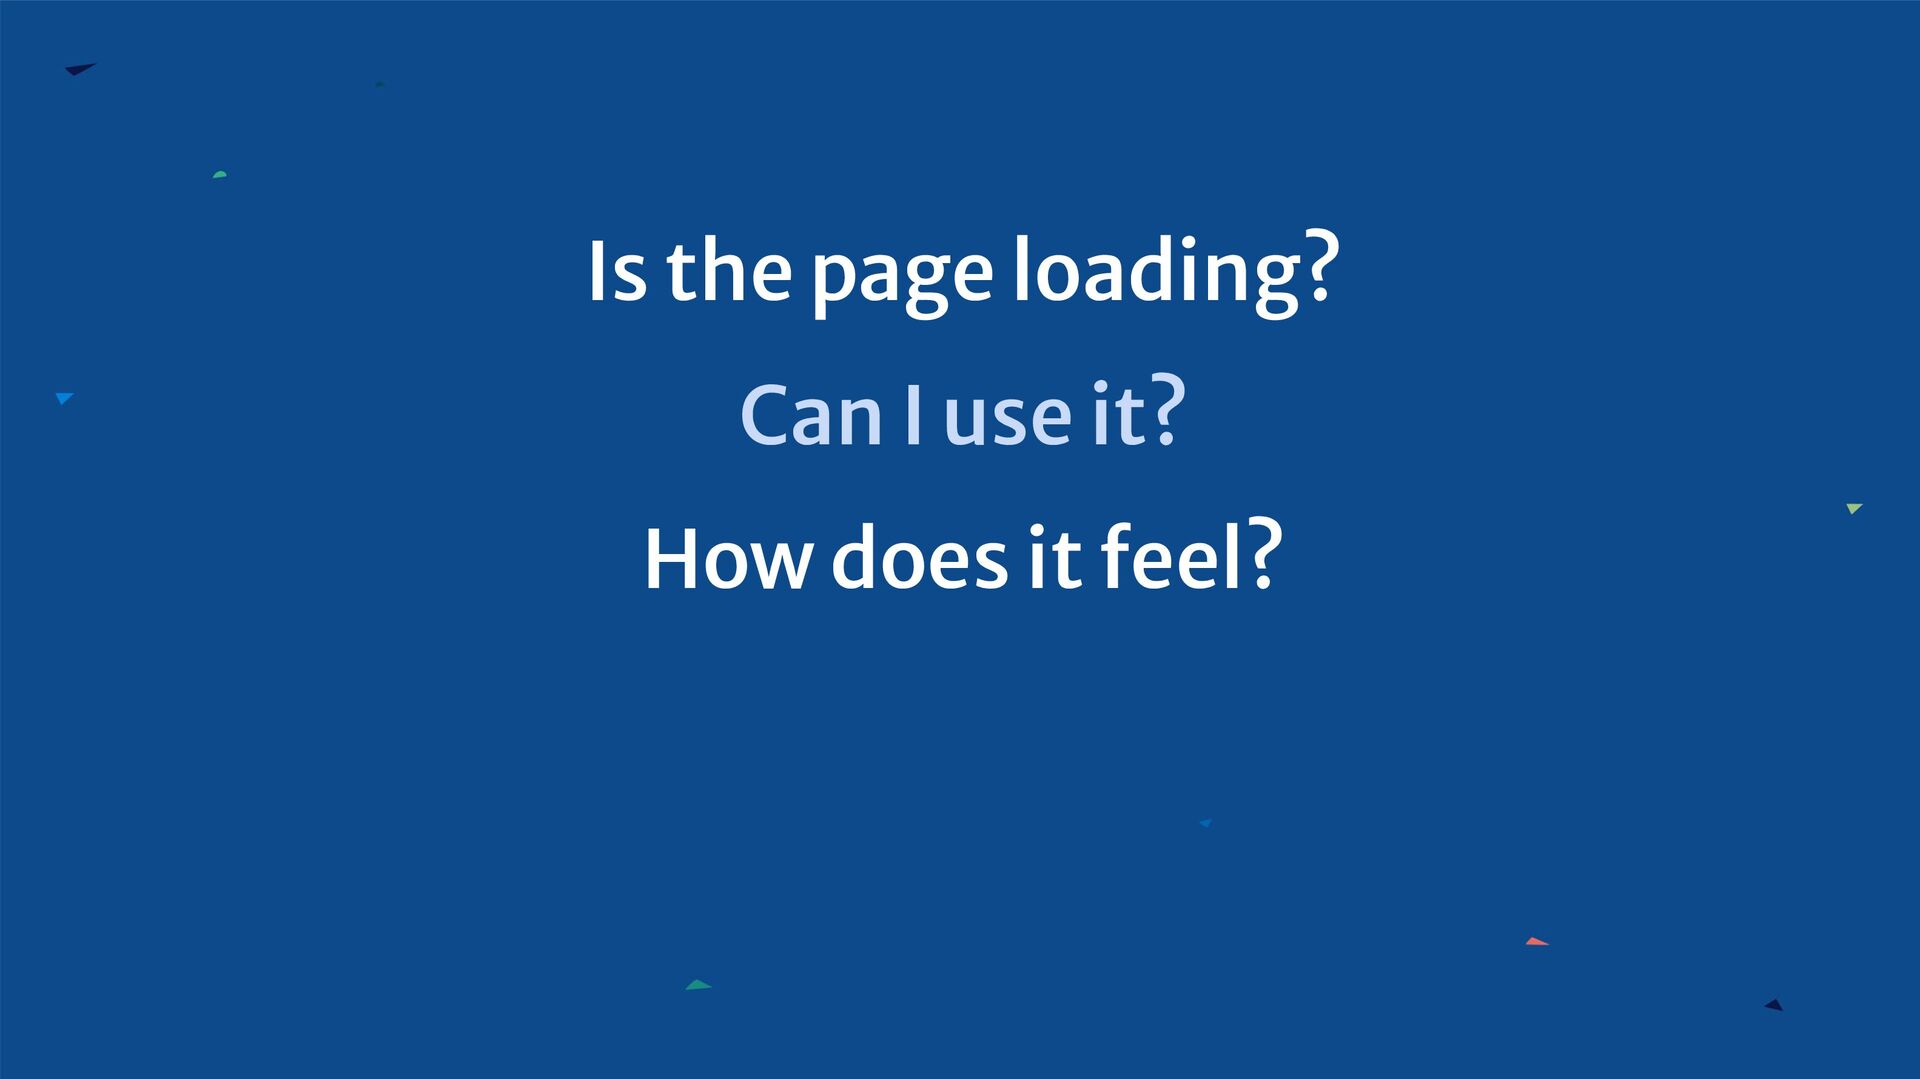
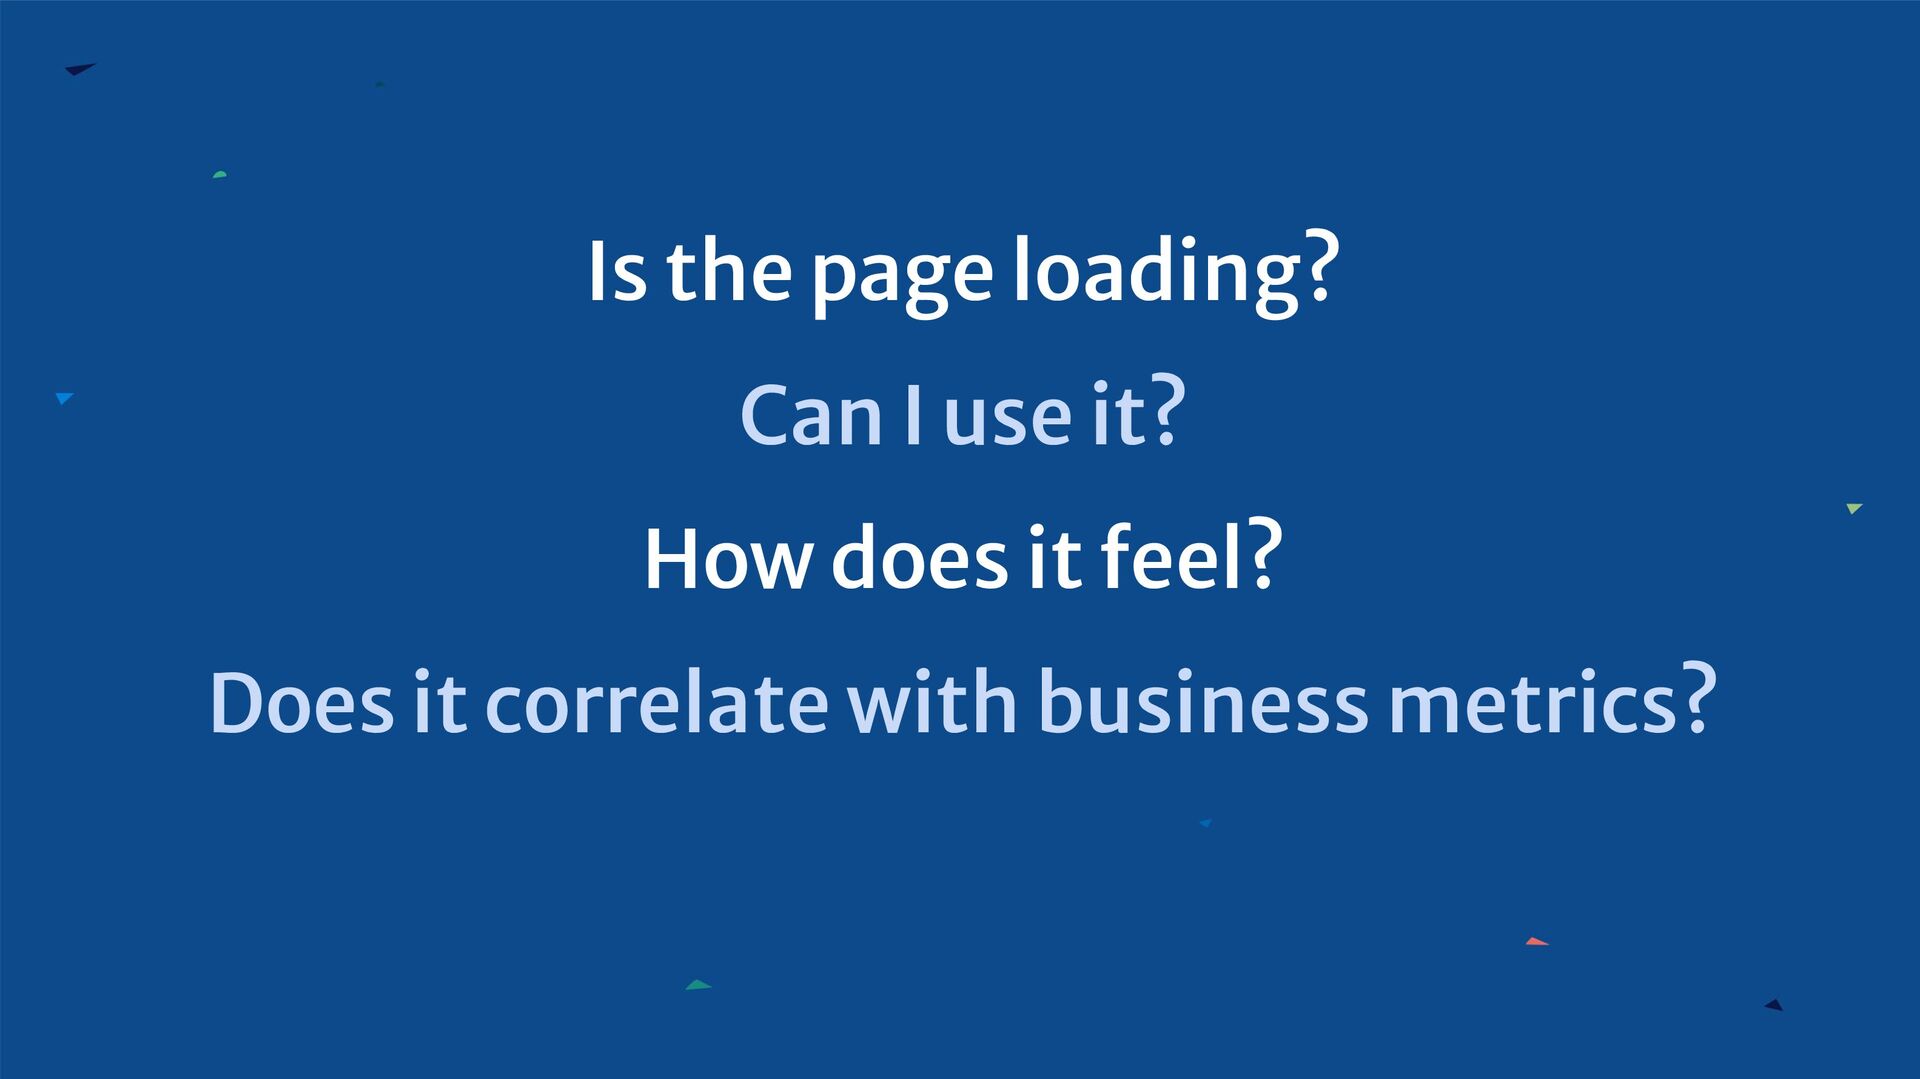
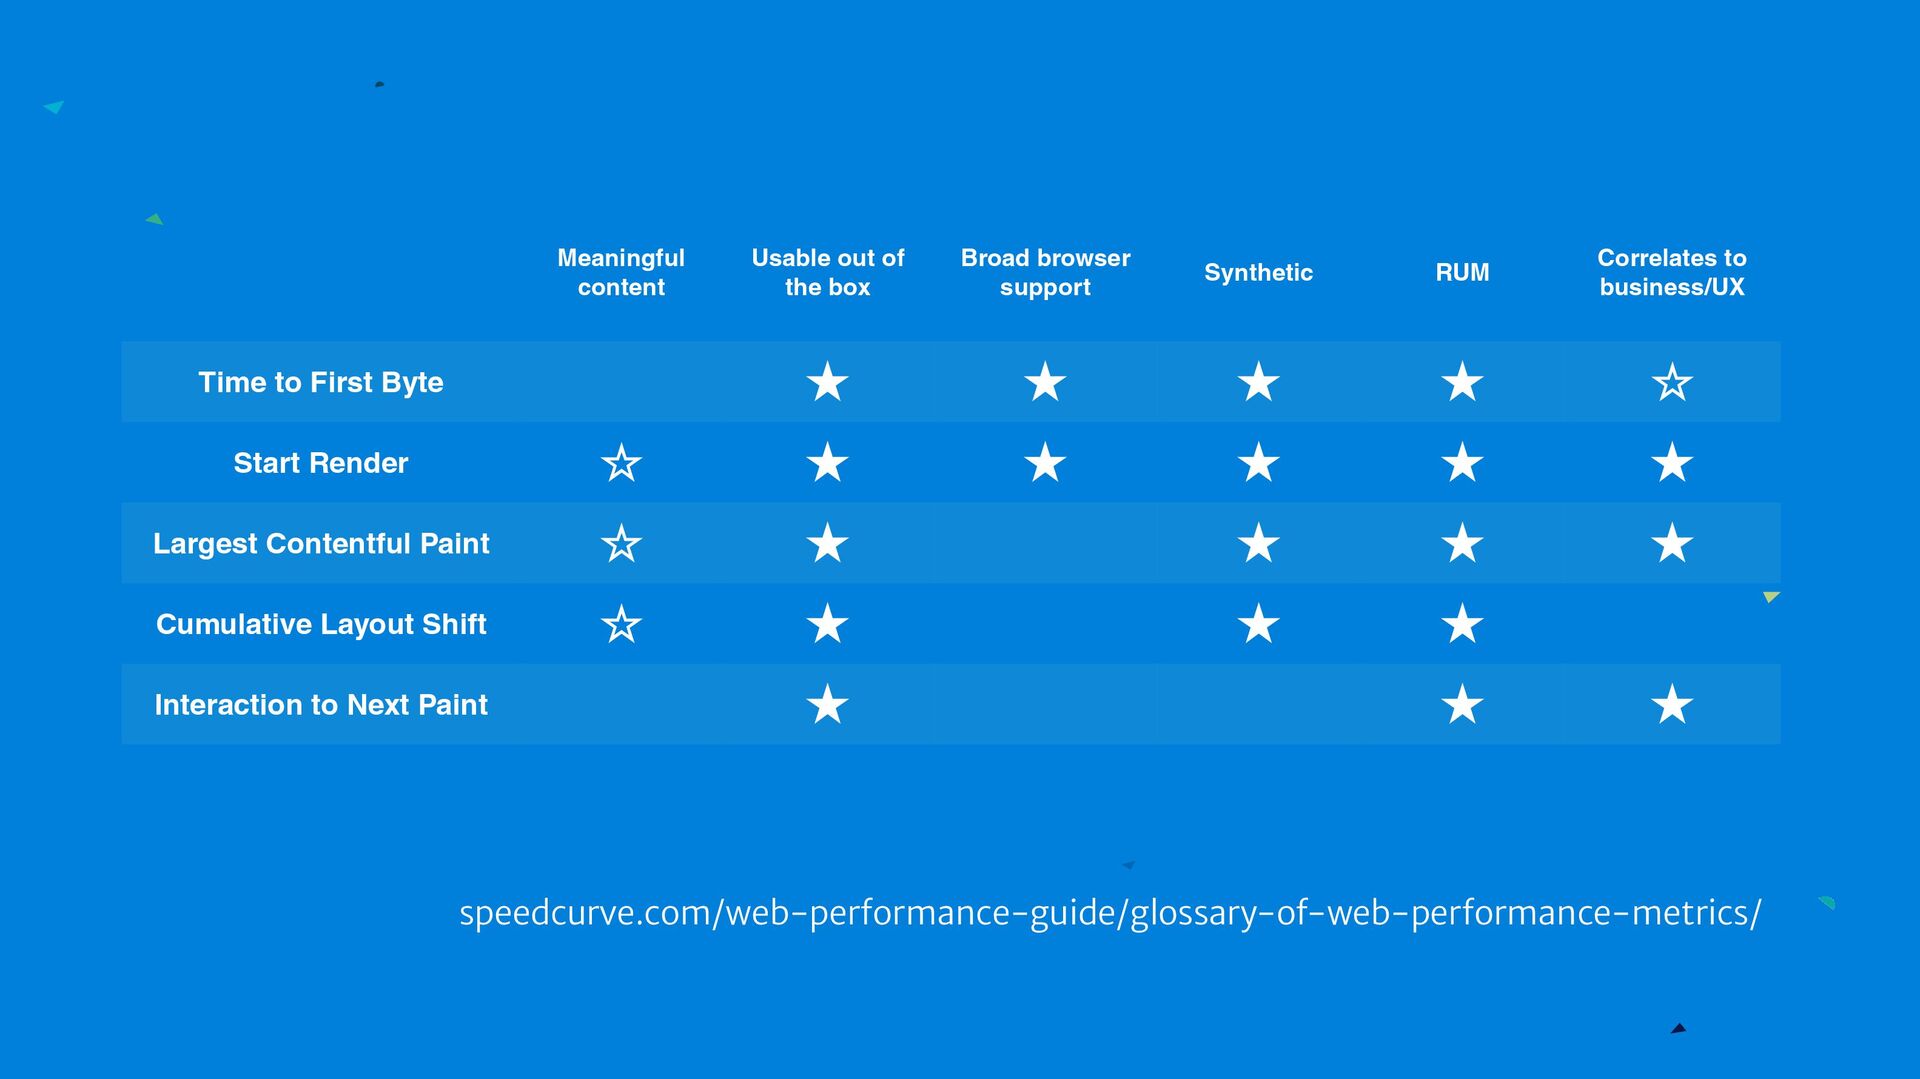
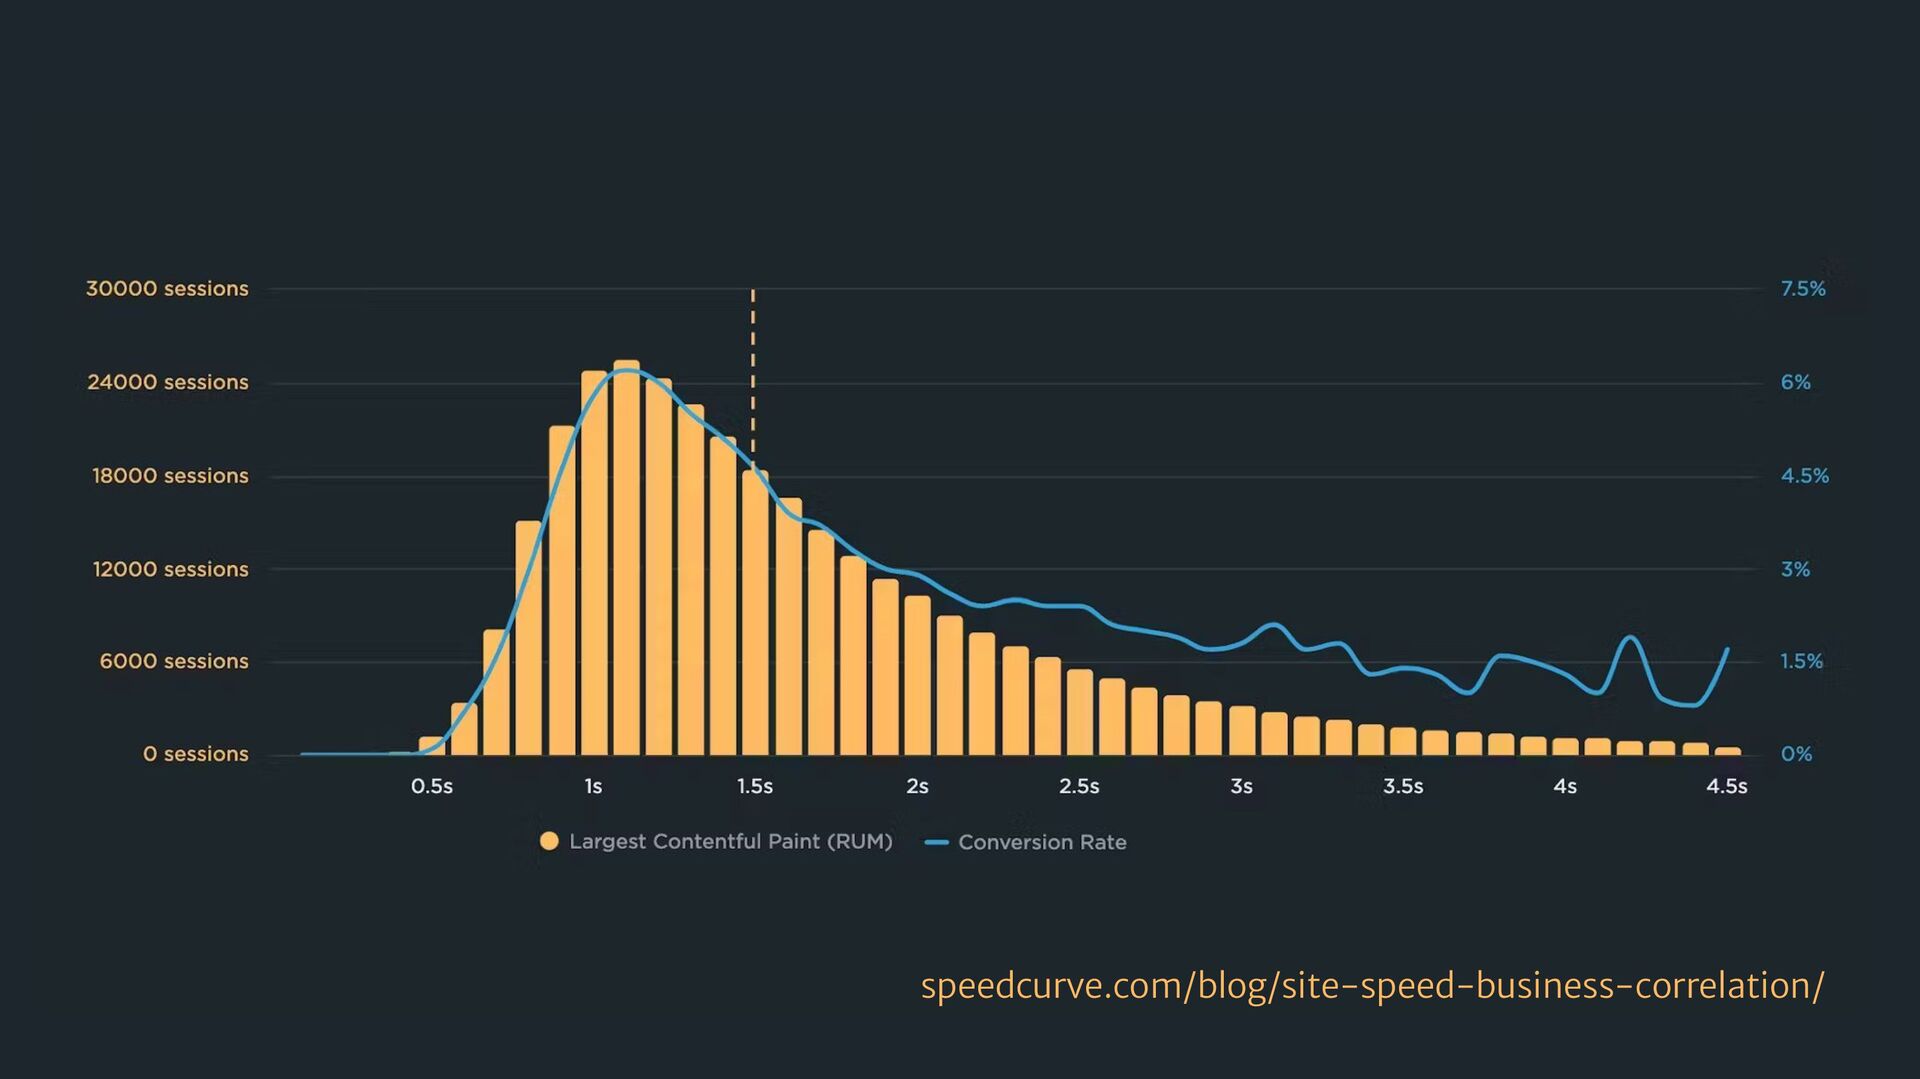
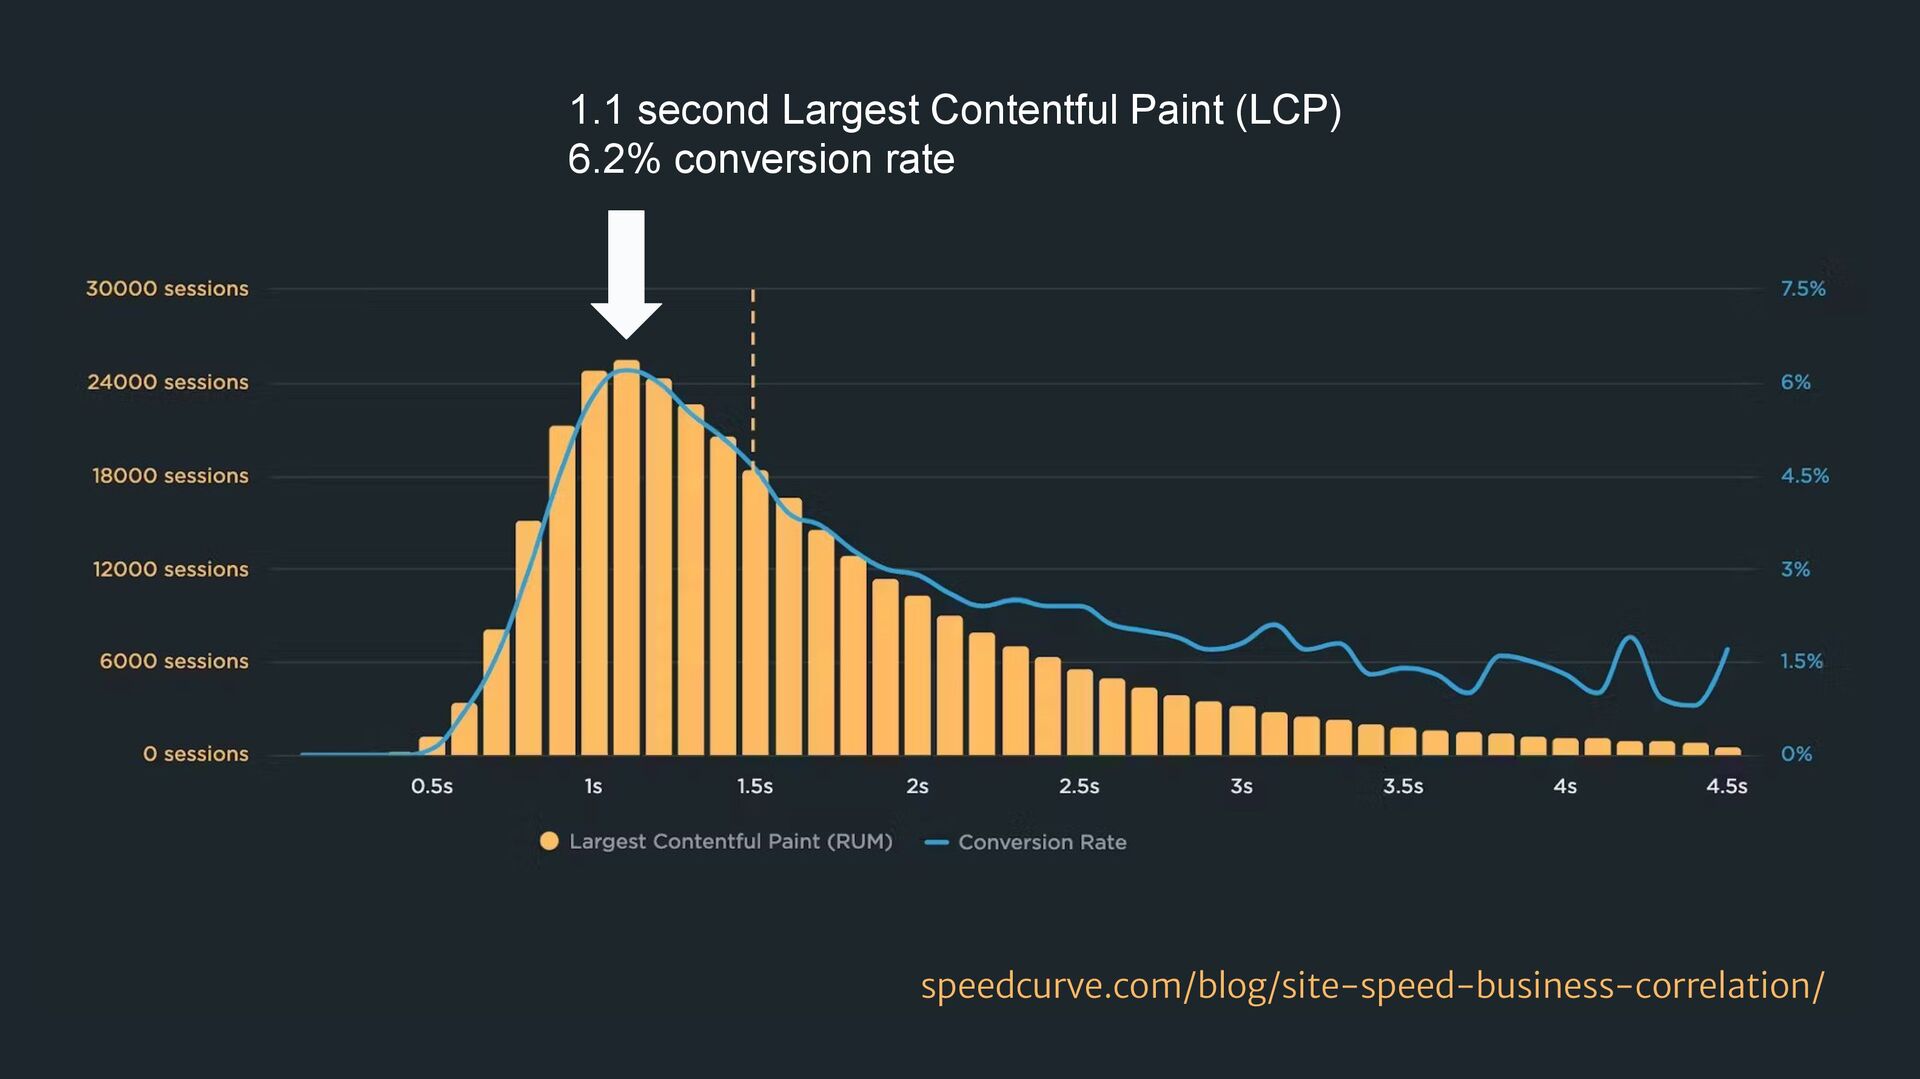
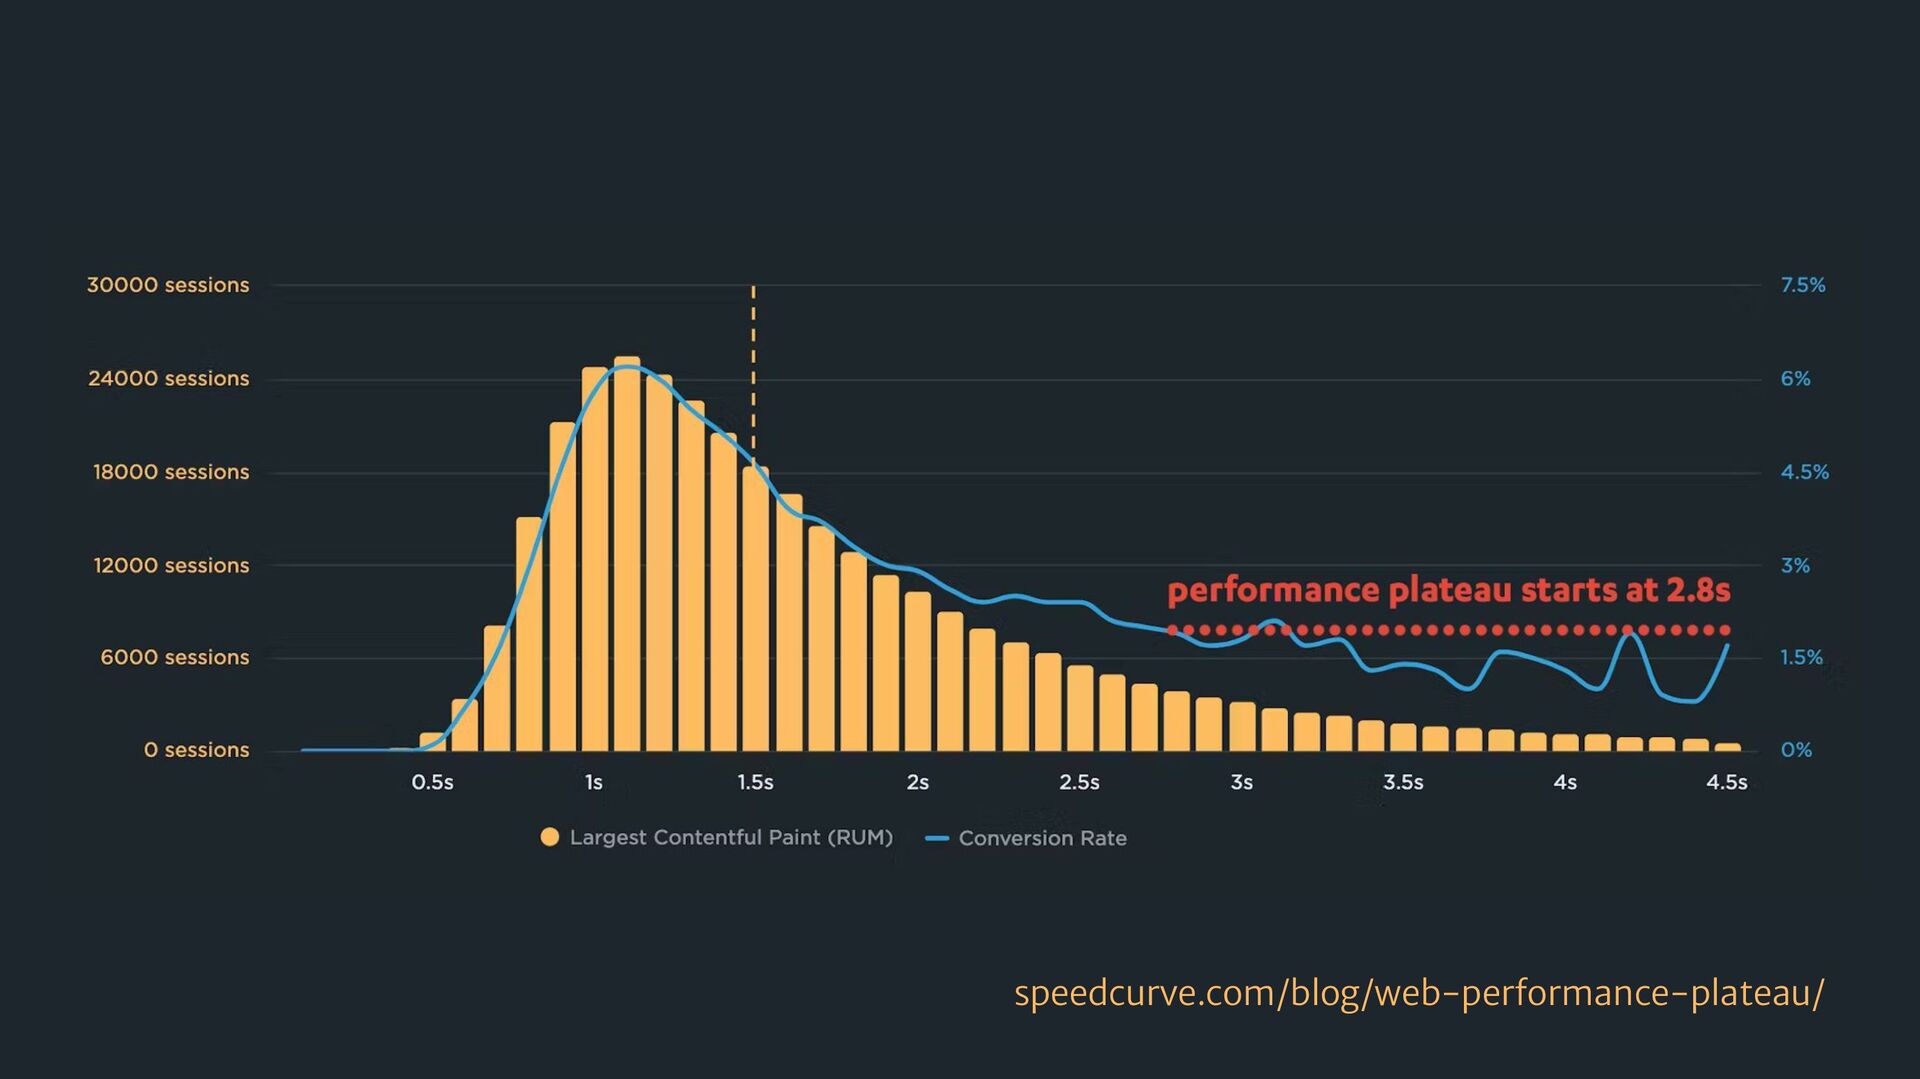
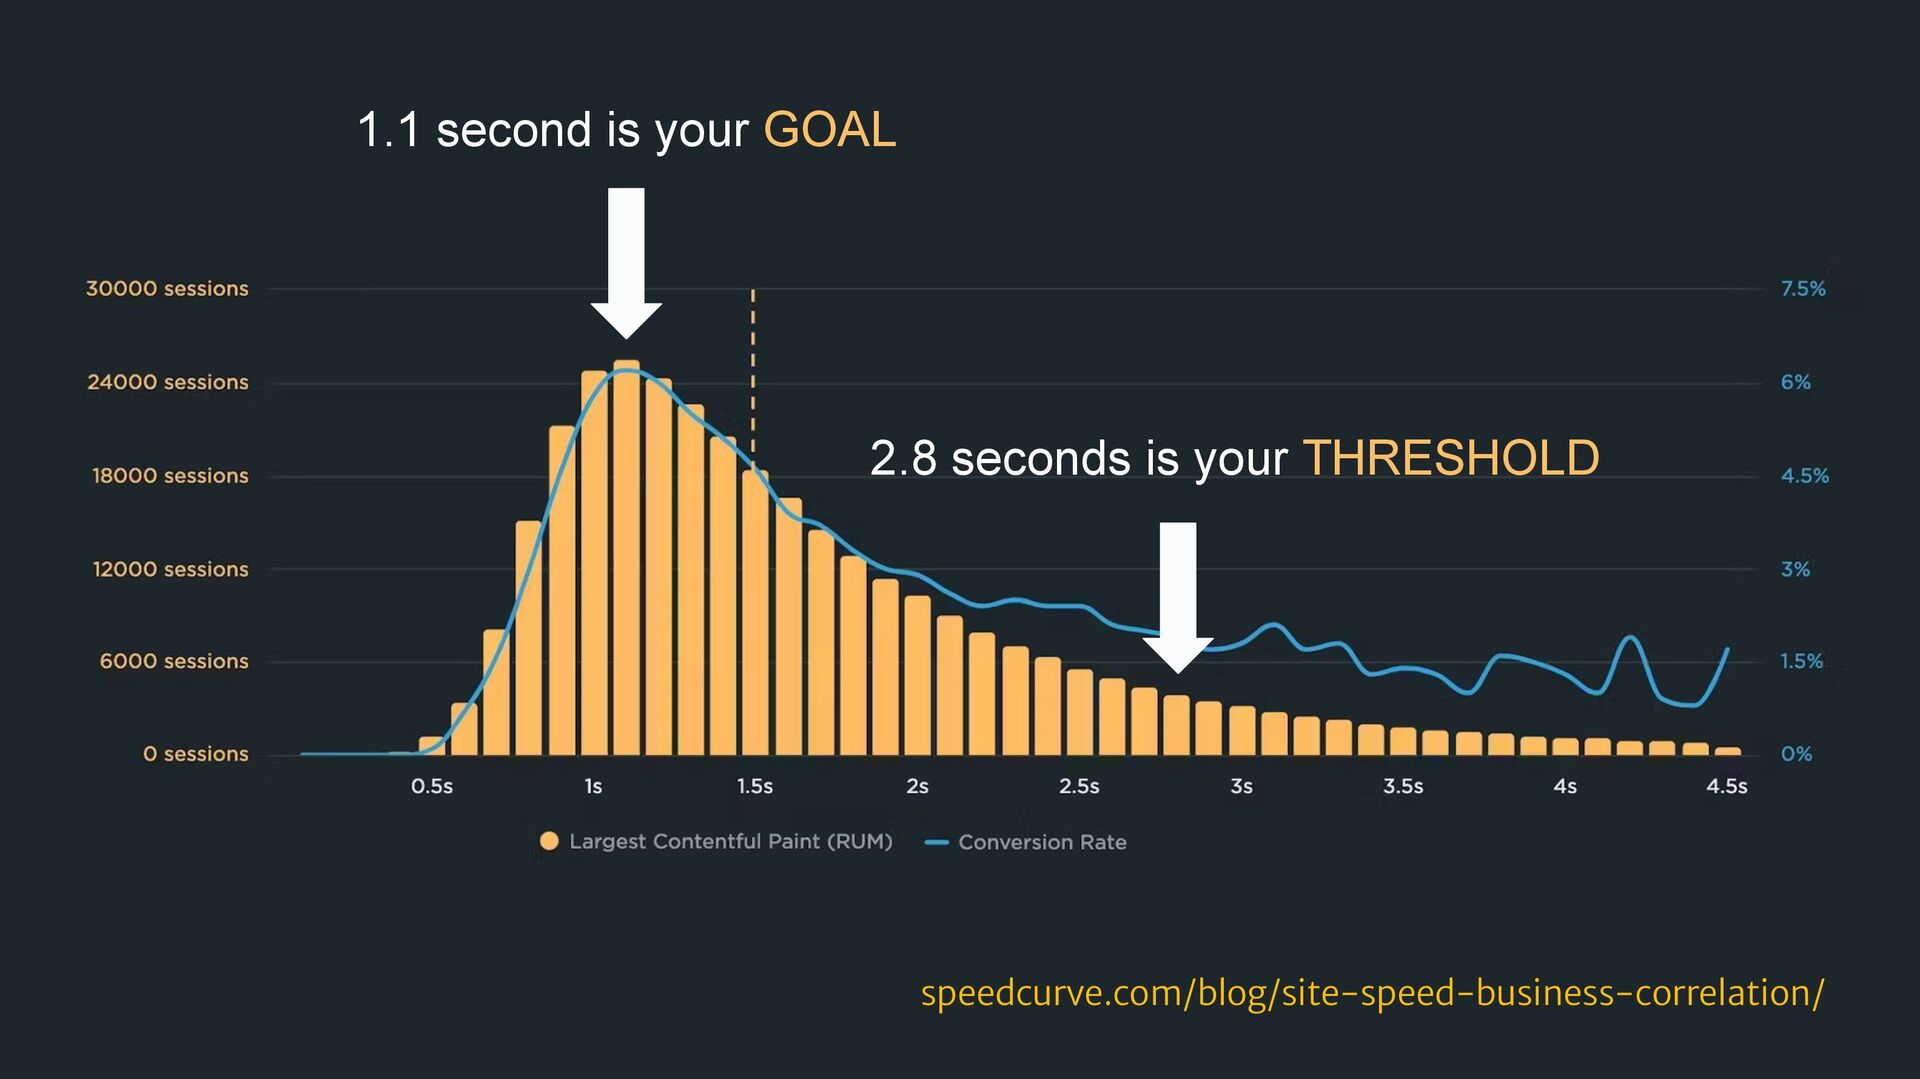
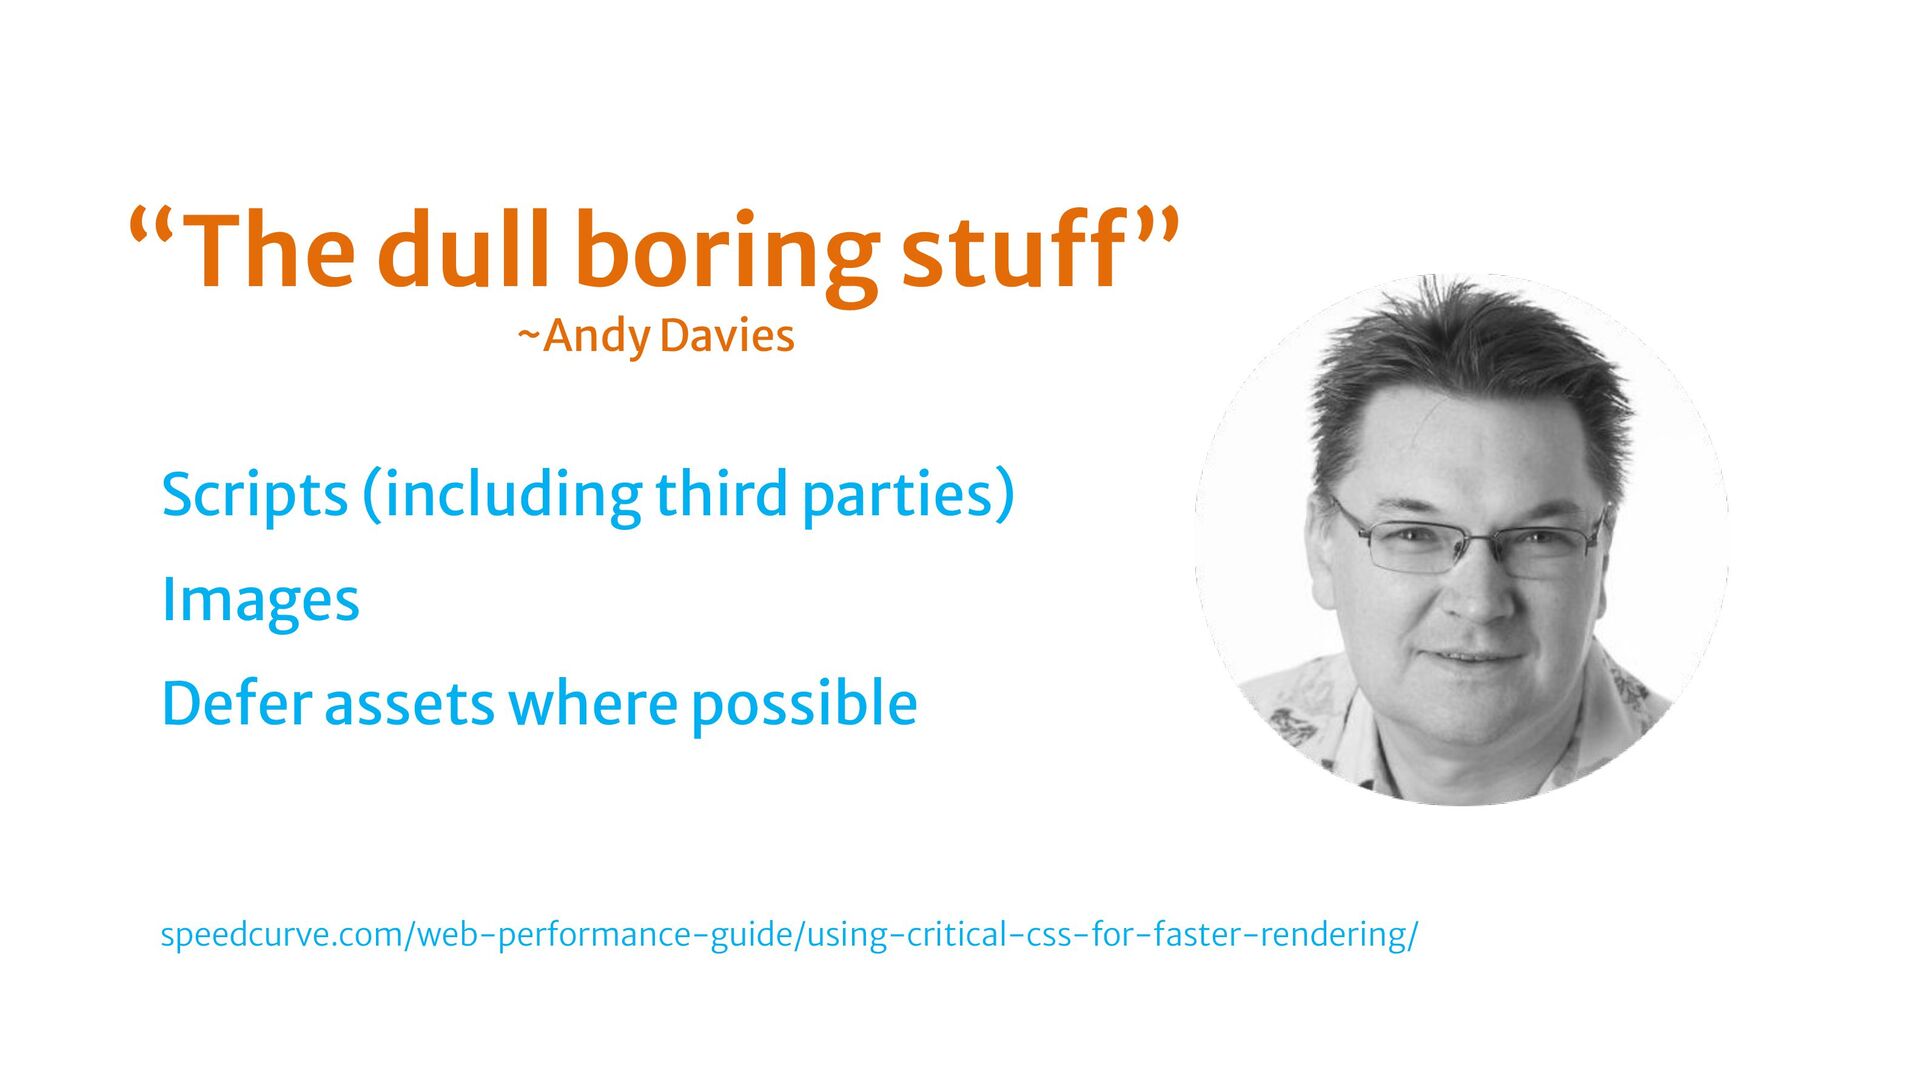
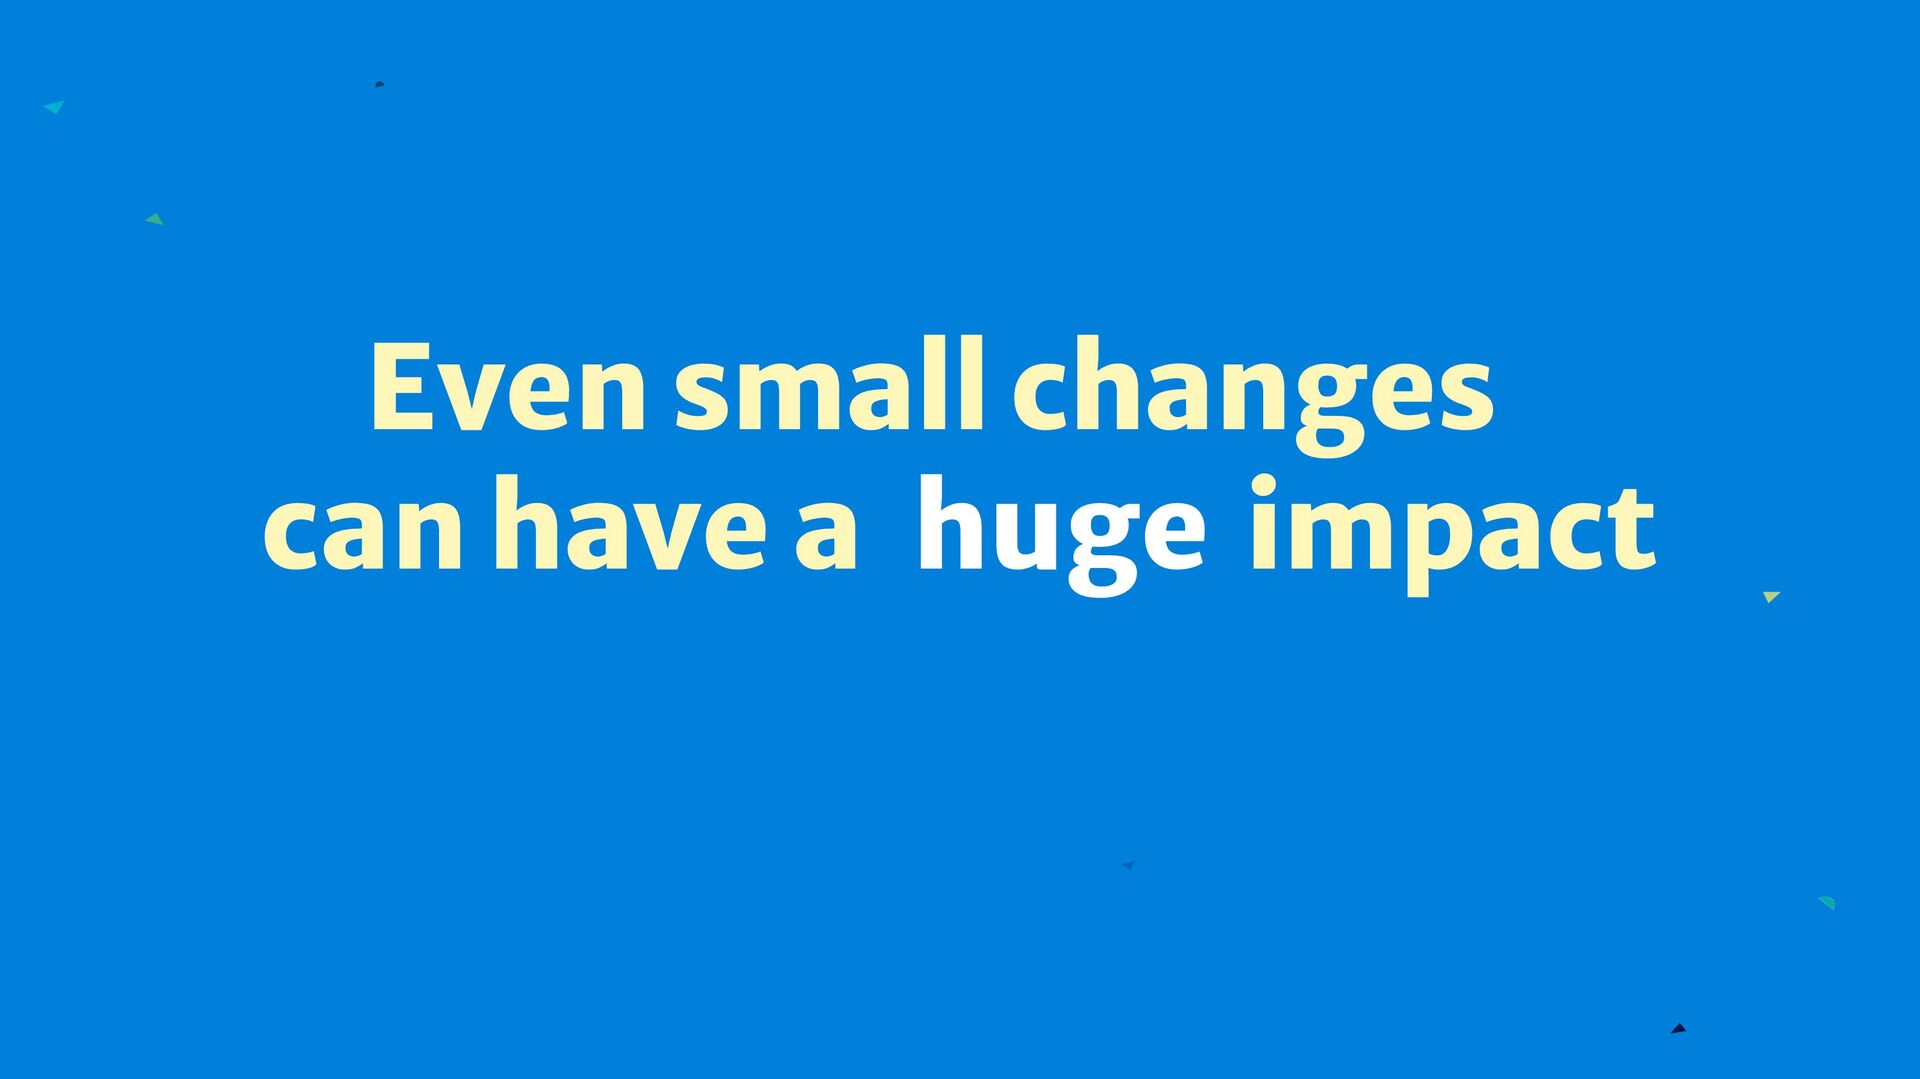
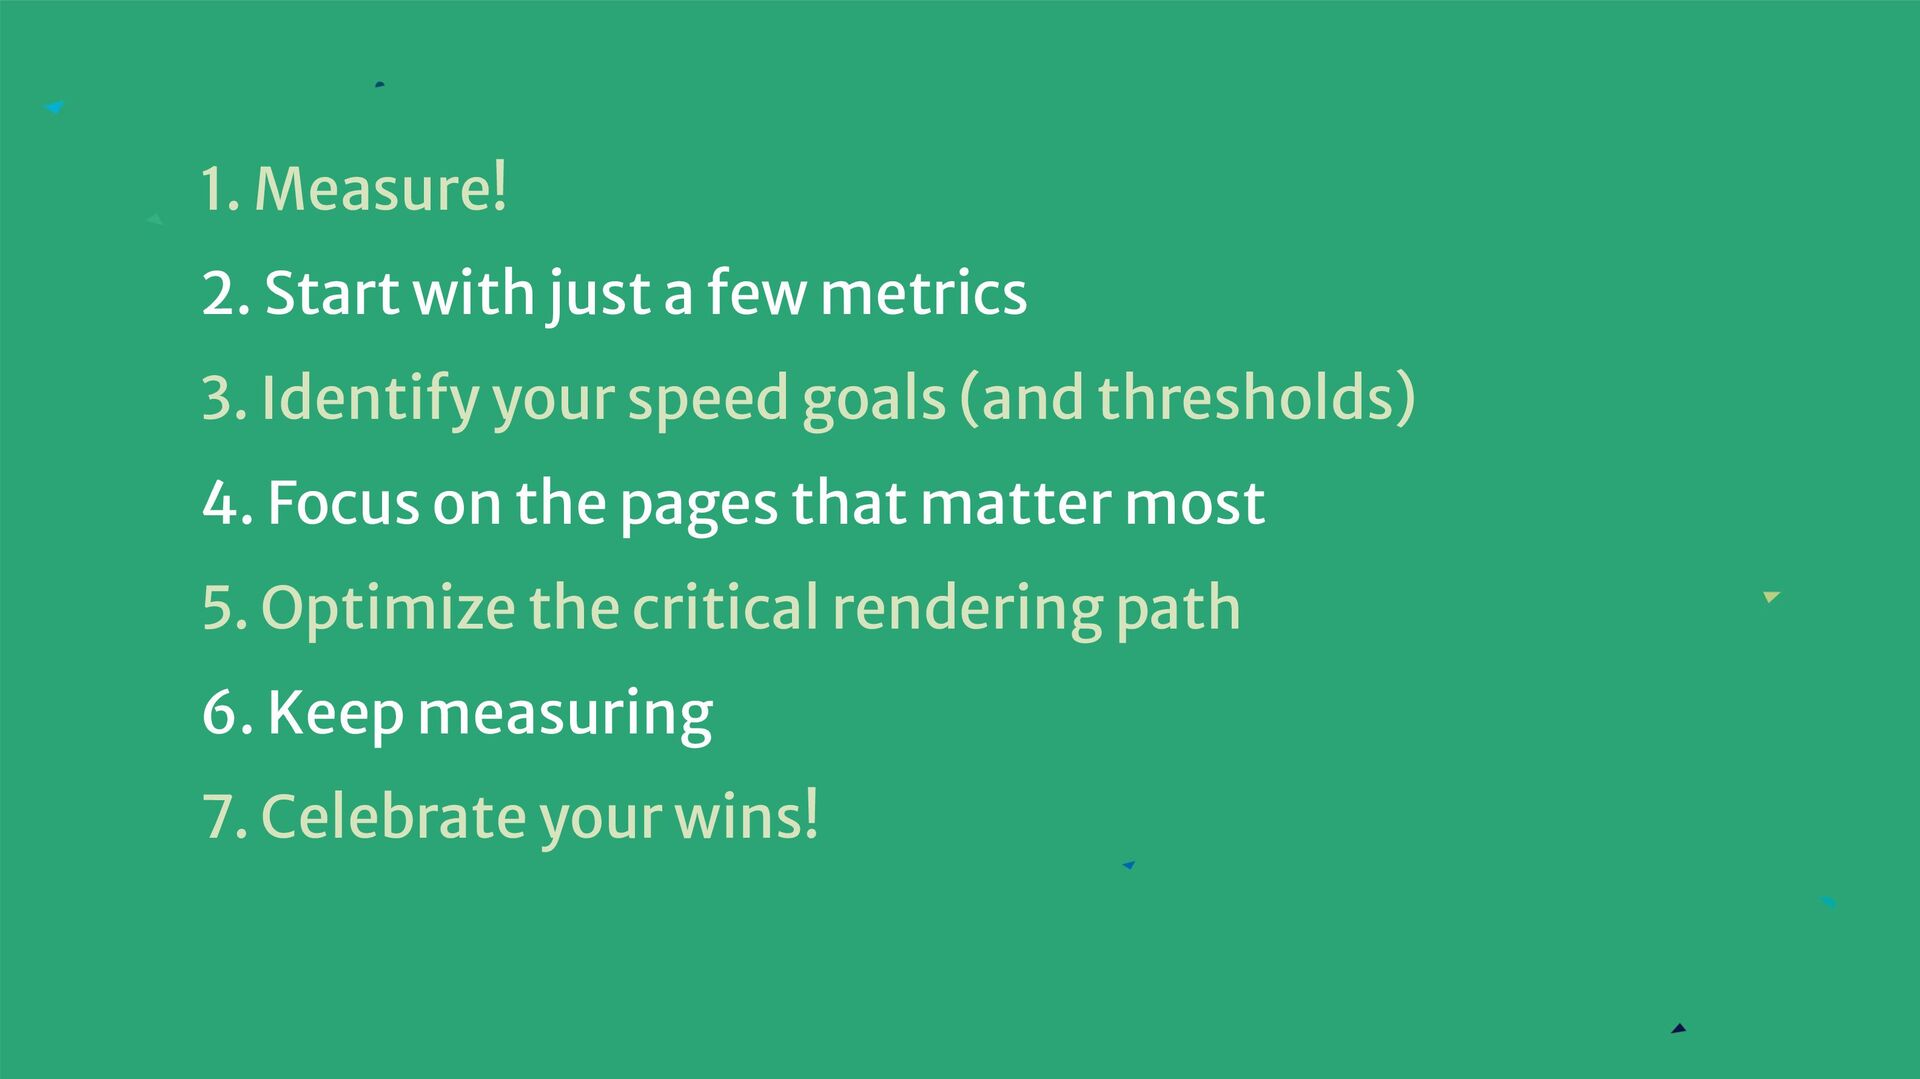
What do the most successful websites have in common? They’re all fast. Faster sites have happier users. Those happy users visit your site more often and spend more money. But how do you know how fast you need to be? Industry stats and case studies tell only part of the story. You need to analyse your own user data to know when your site is fast enough to benefit your business – and when page slowdowns are hurting it.

In this talk, I share insights from my research into the business value of site speed. I also demonstrate how (and why) to gather real user data, know how fast YOU need to be, create a better user experience, and improve the business metrics that matter to you – from bounce rate to conversions.

Avatar for Tammy Everts

Tammy Everts

May 30, 2025
Tweet

More Decks by Tammy Everts

Other Decks in Technology

Transcript

  1. 2

  2. Why should I care? How do I measure site speed?

    How fast should my site be? How do I make it faster?
  3. If you do not consider time as a usability factor,

    you are missing a fundamental aspect of the user experience.
  4. Performance monitoring tools Synthetic monitoring (lab) Mimics defined network &

    browser conditions No installation required Limited URLs Limited test locations Compare any sites Detailed analysis & visuals Real user monitoring (field) Real network & browser conditions Requires JavaScript installation Large sample size (up to 100%) Geographic spread Only measure your own site Correlation with other metrics (e.g., bounce rate)
  5. Is the page loading? Can I use it? How does

    it feel? Does it correlate with business metrics?
  6. Meaningful content Usable out of the box Broad browser support

    Synthetic RUM Correlates to business/UX Time to First Byte ★ ★ ★ ★ ☆ Start Render ☆ ★ ★ ★ ★ ★ Largest Contentful Paint ☆ ★ ★ ★ ★ Cumulative Layout Shift ☆ ★ ★ ★ Interaction to Next Paint ★ ★ ★ speedcurve.com/web-performance-guide/glossary-of-web-performance-metrics/
  7. 1. Product 2. Category 3. Home 4. Cart 5. Search

    Conversion impact // retail sites
  8. 1. Article 2. Search 3. Department 4. Home 5. About

    Engagement impact // media sites
  9. Largest Contentful Paint (LCP) When the main visual element has

    rendered in the viewport After LCP From a user’s perspective, none of this matters (It does actually matter, but not for our purposes today)
  10. Largest Contentful Paint (LCP) When the main visual element has

    rendered in the viewport After LCP From a user’s perspective, none of this matters (It does actually matter, but not for our purposes today) critical rendering path
  11. “The dull boring stuff” ~Andy Davies Scripts (including third parties)

    speedcurve.com/web-performance-guide/best-practices-for-optimizing-javascript/
  12. “The dull boring stuff” ~Andy Davies Scripts (including third parties)

    Images speedcurve.com/web-performance-guide/best-practices-for-optimizing-images/
  13. “The dull boring stuff” ~Andy Davies Scripts (including third parties)

    Images Defer assets where possible speedcurve.com/web-performance-guide/using-critical-css-for-faster-rendering/
  14. 1. Compressed images 2. Deferred image sprite that was blocking

    rendering 3. Optimized CSS and JS on the critical rendering path
  15. 1. Measure! 2. Start with just a few metrics 3.

    Identify your speed goals (and thresholds) 4. Focus on the pages that matter most 5. Optimize the critical rendering path 6. Keep measuring 7. Celebrate your wins!