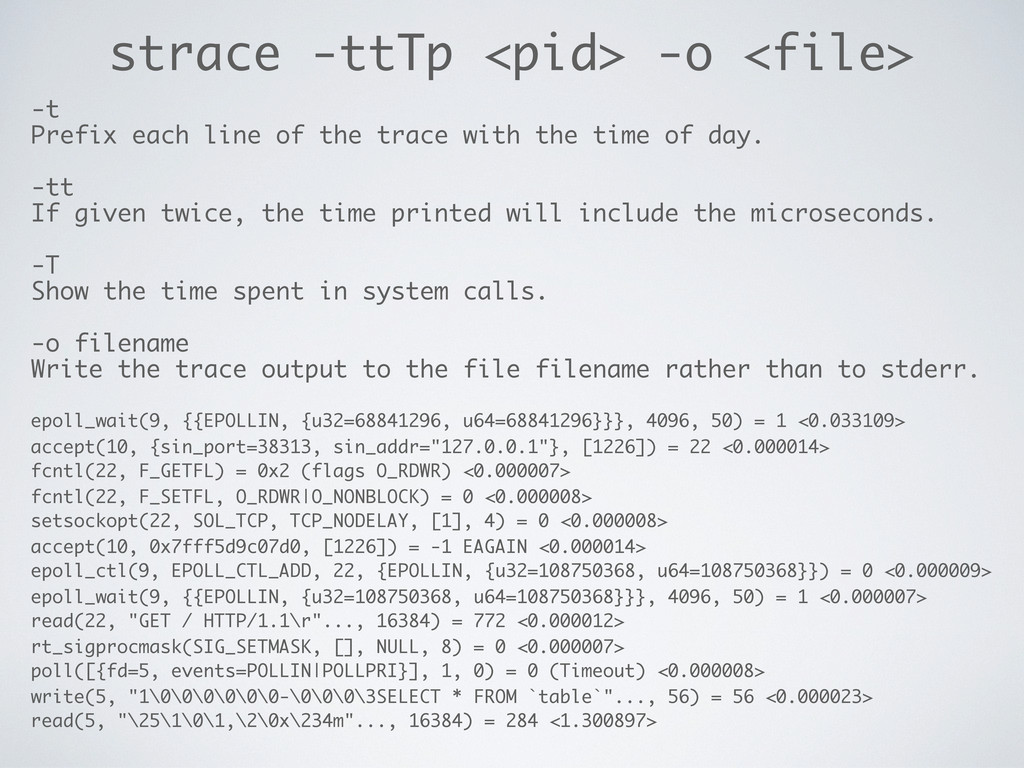
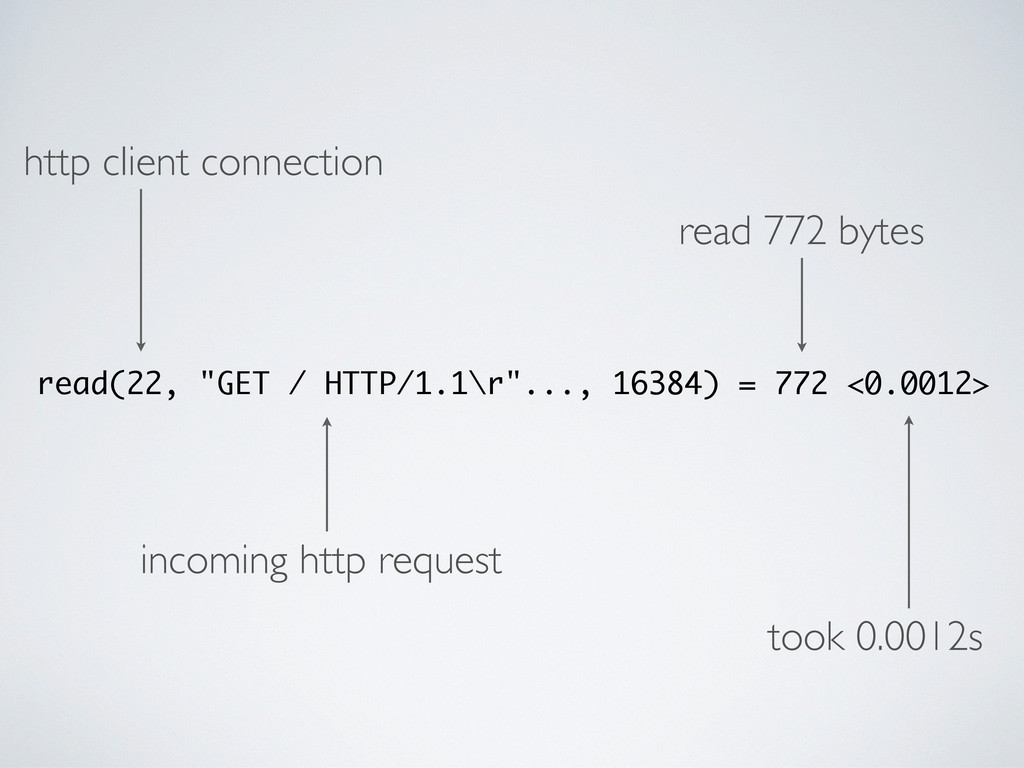
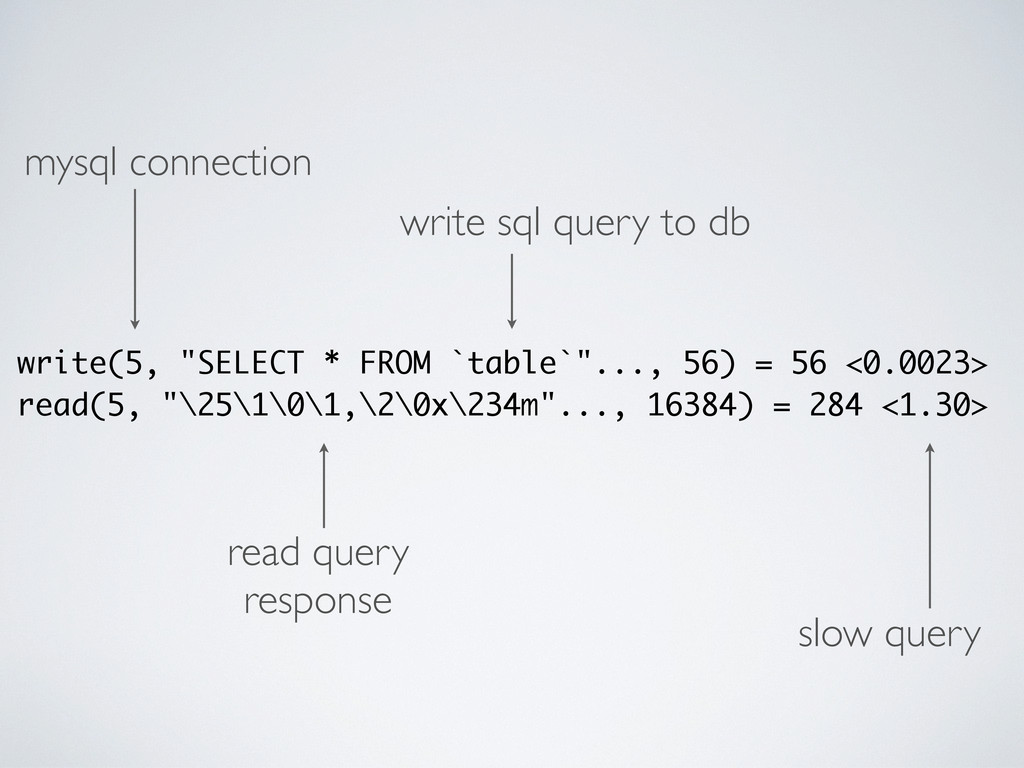
the trace with the time of day. -tt If given twice, the time printed will include the microseconds. -T Show the time spent in system calls. -o filename Write the trace output to the file filename rather than to stderr. epoll_wait(9, {{EPOLLIN, {u32=68841296, u64=68841296}}}, 4096, 50) = 1 <0.033109> accept(10, {sin_port=38313, sin_addr="127.0.0.1"}, [1226]) = 22 <0.000014> fcntl(22, F_GETFL) = 0x2 (flags O_RDWR) <0.000007> fcntl(22, F_SETFL, O_RDWR|O_NONBLOCK) = 0 <0.000008> setsockopt(22, SOL_TCP, TCP_NODELAY, [1], 4) = 0 <0.000008> accept(10, 0x7fff5d9c07d0, [1226]) = -1 EAGAIN <0.000014> epoll_ctl(9, EPOLL_CTL_ADD, 22, {EPOLLIN, {u32=108750368, u64=108750368}}) = 0 <0.000009> epoll_wait(9, {{EPOLLIN, {u32=108750368, u64=108750368}}}, 4096, 50) = 1 <0.000007> read(22, "GET / HTTP/1.1\r"..., 16384) = 772 <0.000012> rt_sigprocmask(SIG_SETMASK, [], NULL, 8) = 0 <0.000007> poll([{fd=5, events=POLLIN|POLLPRI}], 1, 0) = 0 (Timeout) <0.000008> write(5, "1\0\0\0\0\0\0-\0\0\0\3SELECT * FROM `table`"..., 56) = 56 <0.000023> read(5, "\25\1\0\1,\2\0x\234m"..., 16384) = 284 <1.300897>
![Unicorn::App#call(env['PATH_INFO']="/cakephp/cakephp/downloads") Smoke::Git#cat_ref(args=["2.0.0-dev"]) <0.046590> Smoke::Git#cat_ref(args=["1.3-dev"]) <0.053170> Smoke::Git#cat_ref(args=["1.3.7"]) <0.046643> Smoke::Git#cat_ref(args=["1.3.6"]) <0.045075> Smoke::Git#cat_ref(args=["1.3.5"])](https://files.speakerdeck.com/presentations/4dd3e5315753080234000001/slide_30.jpg)
![Albino#colorize(@target.size=180, @options[:l]="plain") <0.151861> Albino#colorize(@target.size=1009, @options[:l]="ruby") <0.233931> Albino#colorize(@target.size=9024, @options[:l]="js") <0.278415> Albino#colorize(@target.size=243,](https://files.speakerdeck.com/presentations/4dd3e5315753080234000001/slide_32.jpg)
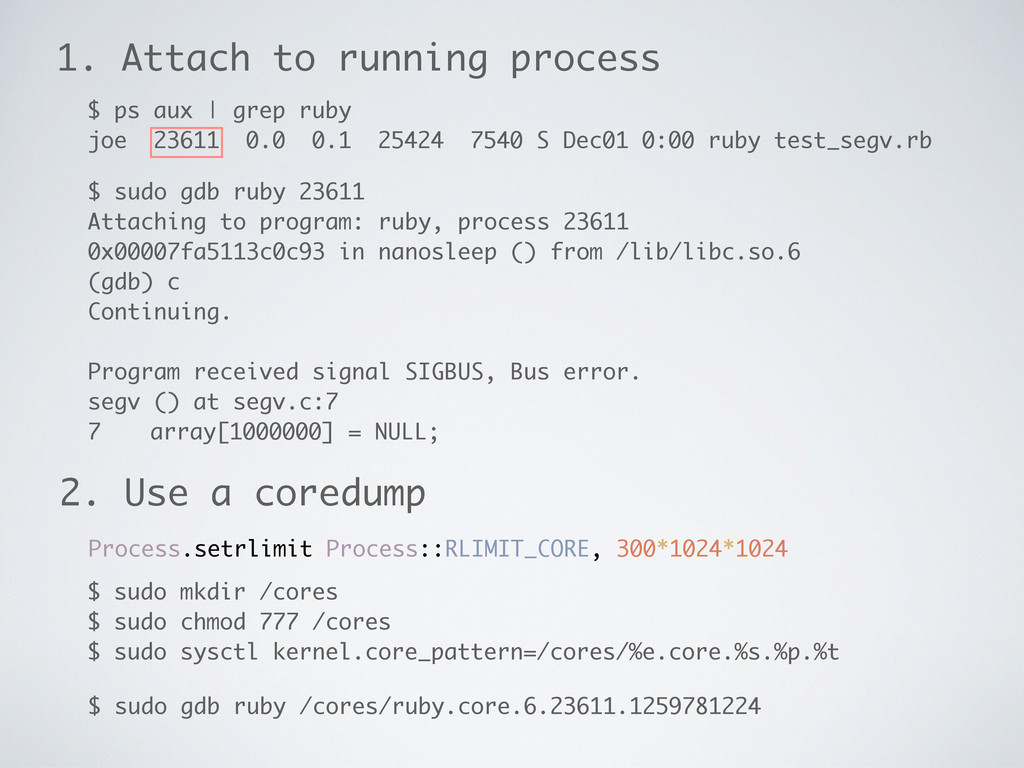
![Debugging Ruby Segfaults #include "ruby.h" VALUE segv() { VALUE array[1];](https://files.speakerdeck.com/presentations/4dd3e5315753080234000001/slide_51.jpg)