Upgrade to Pro
— share decks privately, control downloads, hide ads and more …
Speaker Deck
Features
Speaker Deck
PRO
Sign in
Sign up for free
Search
Search
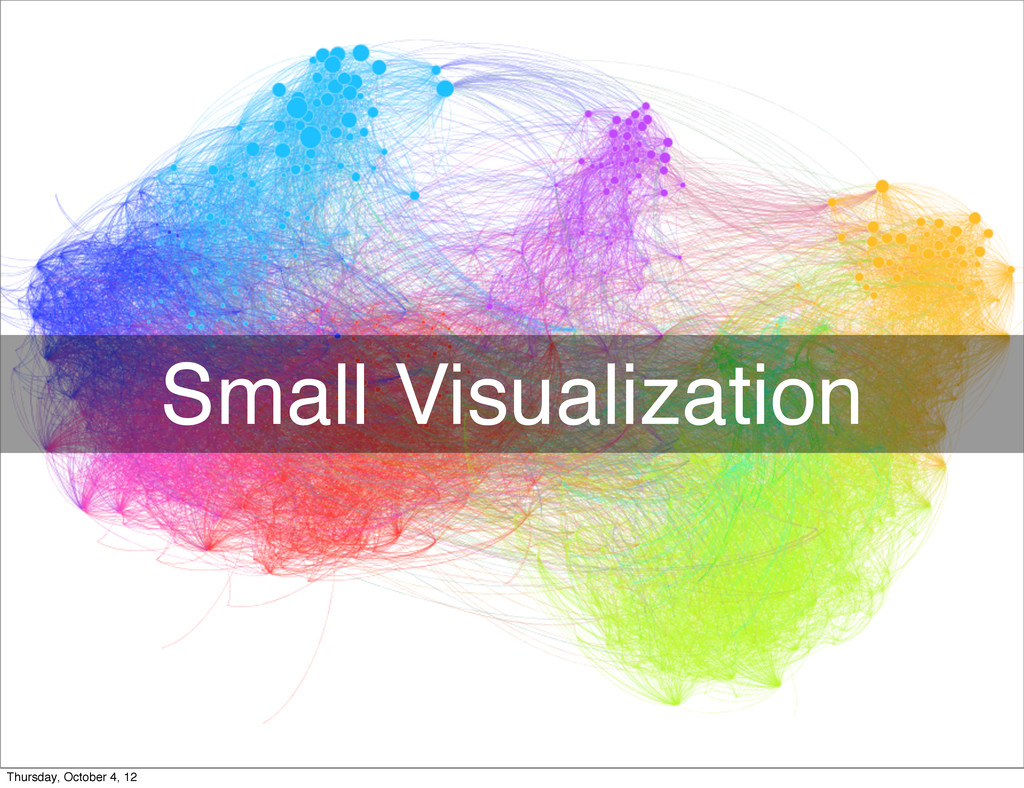
Small Visualization
Search
Sponsored
·
Your Podcast. Everywhere. Effortlessly.
Share. Educate. Inspire. Entertain. You do you. We'll handle the rest.
→
binx
October 04, 2012
360
3
Share
Embed
Copy iframe code
Copy JS code
Copy link
Start on current slide
Small Visualization
Presented at Cybera Summit, in Banff, Alberta, October 2012
binx
October 04, 2012
More Decks by binx
See All by binx
On the Importance of Iteration
binx
0
140
Designing for Spacecraft Operations
binx
2
650
Place and Space
binx
0
550
Error: Success
binx
0
550
Peak Visualization?
binx
1
620
The Data Visualization Hustle
binx
2
490
People, Not Users
binx
2
270
Data Collection and Memory
binx
1
250
The Road To Code
binx
1
420
Featured
See All Featured
[Rails World 2023 - Day 1 Closing Keynote] - The Magic of Rails
eileencodes
38
2.9k
Future Trends and Review - Lecture 12 - Web Technologies (1019888BNR)
signer
PRO
0
3.7k
End of SEO as We Know It (SMX Advanced Version)
ipullrank
3
4.3k
ラッコキーワード サービス紹介資料
rakko
1
4.1M
Fight the Zombie Pattern Library - RWD Summit 2016
marcelosomers
234
17k
Paper Plane (Part 1)
katiecoart
PRO
1
9.9k
Exploring the Power of Turbo Streams & Action Cable | RailsConf2023
kevinliebholz
37
6.5k
Evolving SEO for Evolving Search Engines
ryanjones
0
250
Marketing to machines
jonoalderson
1
5.6k
Hiding What from Whom? A Critical Review of the History of Programming languages for Music
tomoyanonymous
3
1.1k
"I'm Feeling Lucky" - Building Great Search Experiences for Today's Users (#IAC19)
danielanewman
230
23k
Leveraging Curiosity to Care for An Aging Population
cassininazir
1
440
Transcript
Small Visualization Thursday, October 4, 12
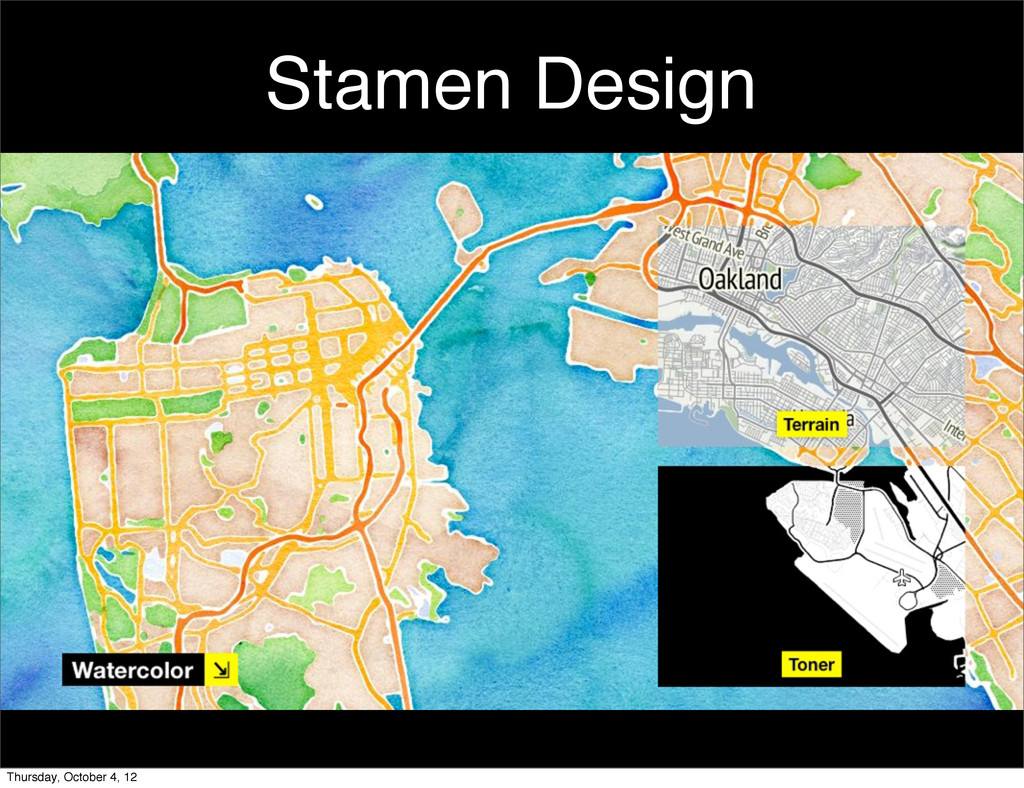
Stamen Design Thursday, October 4, 12
Thursday, October 4, 12
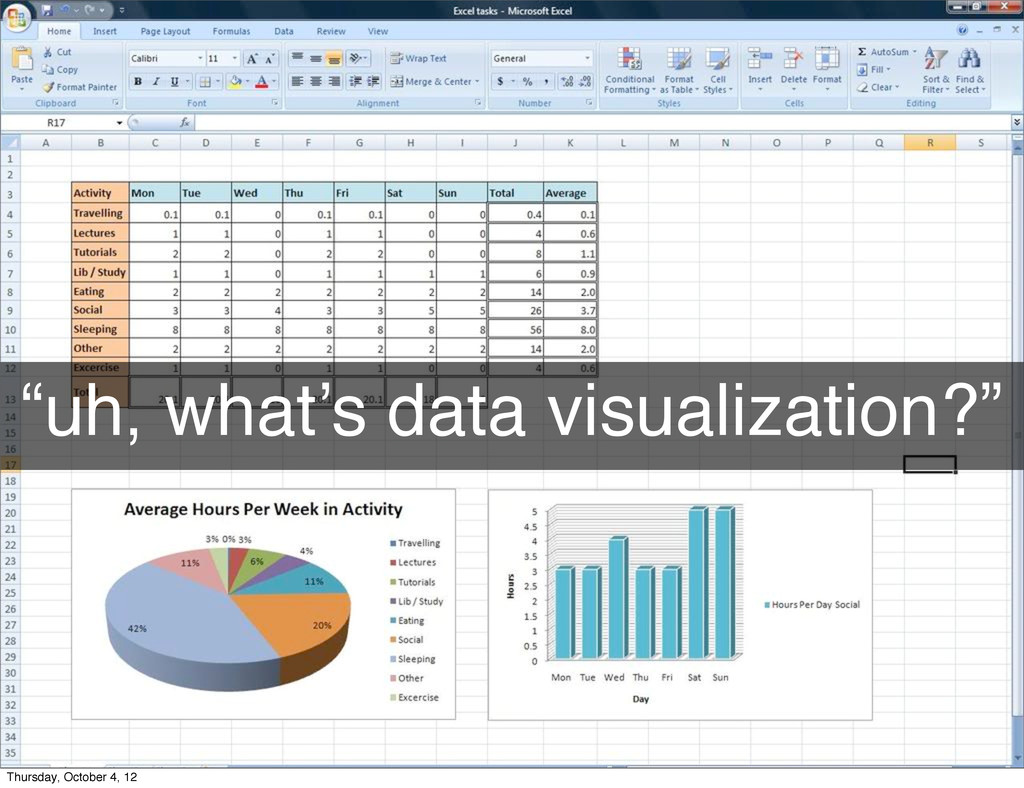
“uh, what’s data visualization?” Thursday, October 4, 12
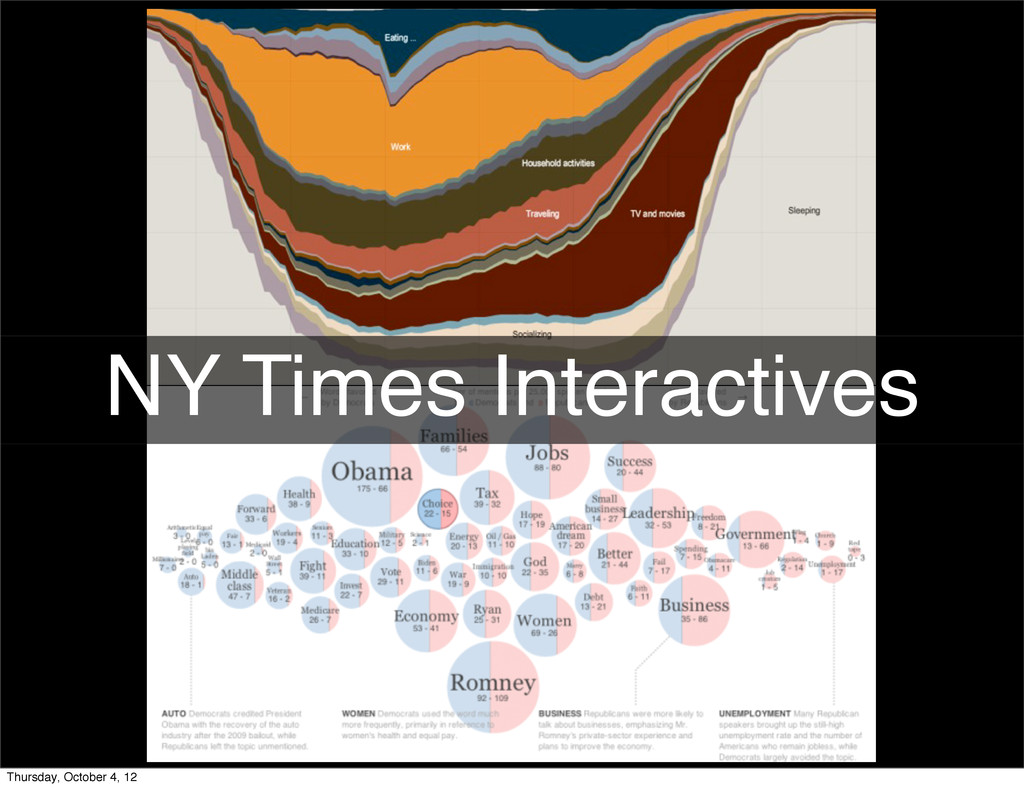
NY Times Interactives Thursday, October 4, 12
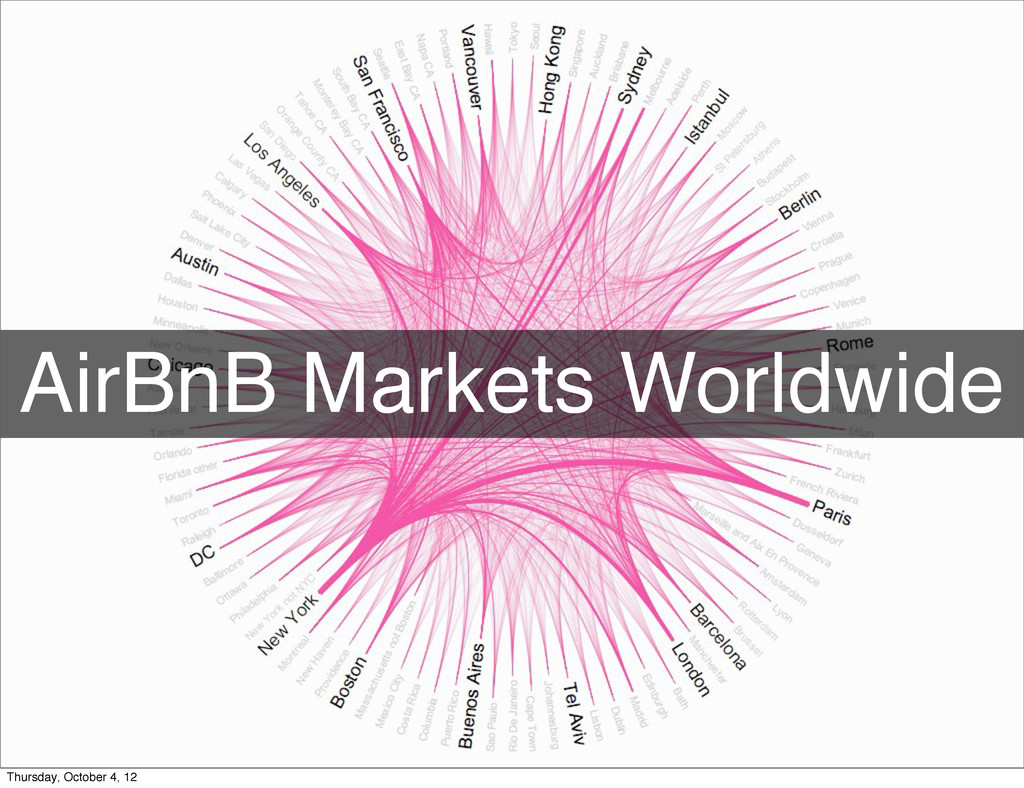
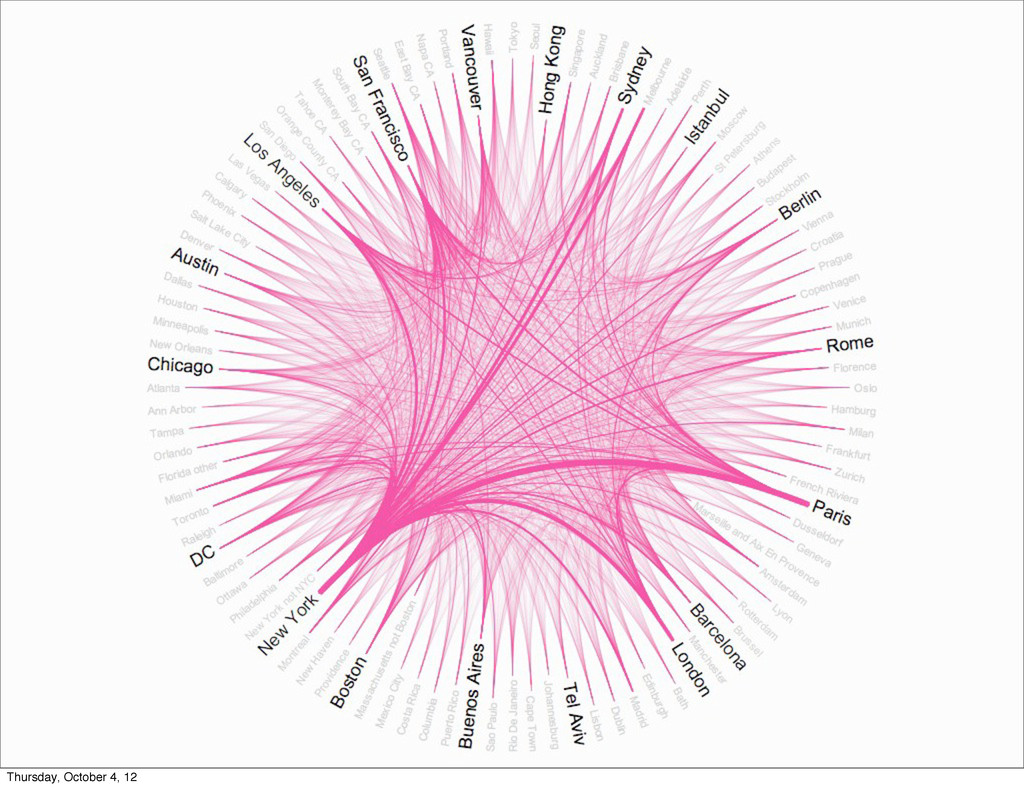
AirBnB Markets Worldwide Thursday, October 4, 12
Thursday, October 4, 12
Small Data, Small Visualization Thursday, October 4, 12
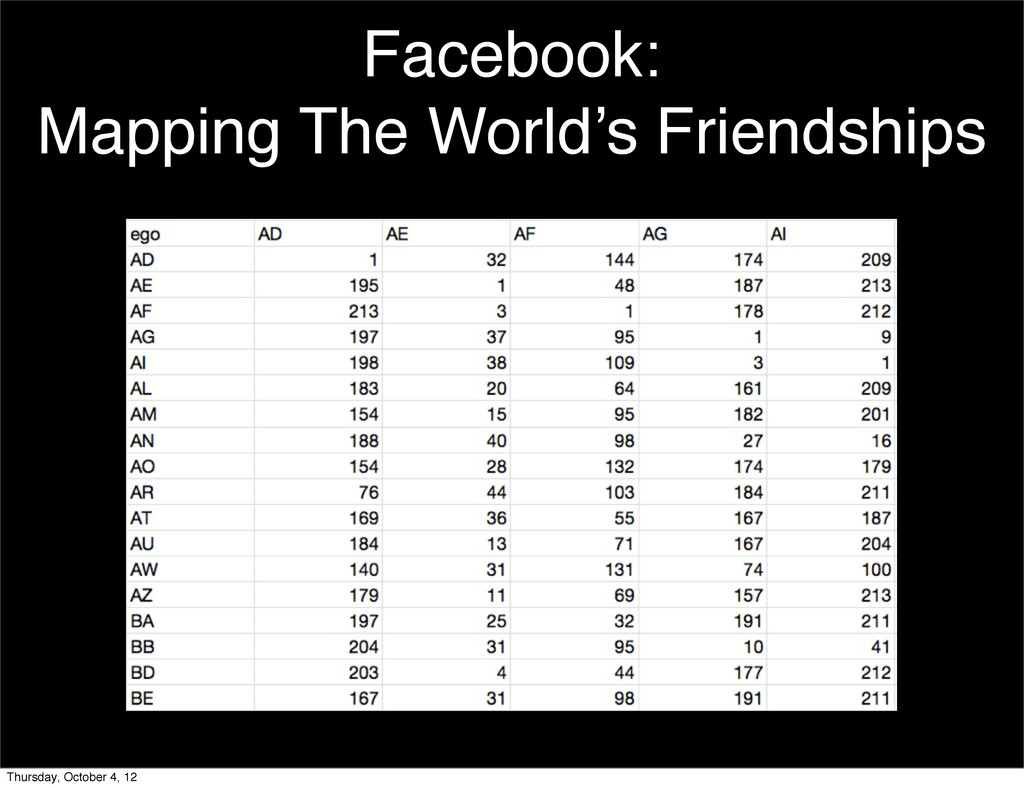
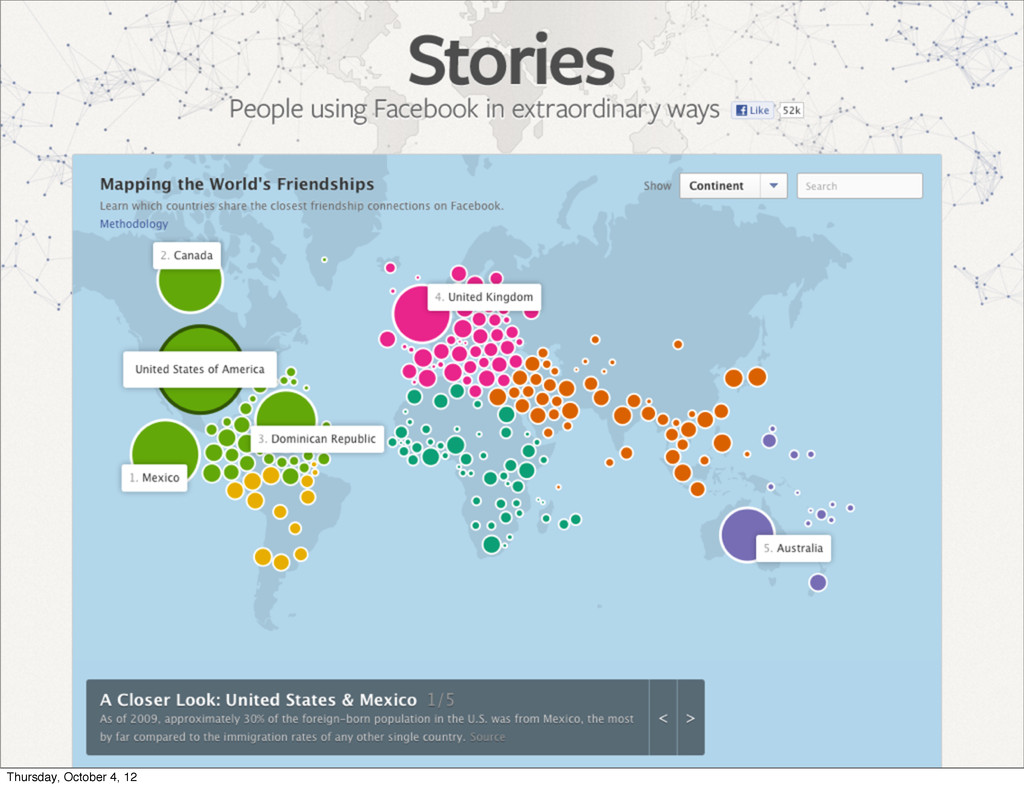
Facebook: Mapping The World’s Friendships Thursday, October 4, 12
Thursday, October 4, 12
Thursday, October 4, 12
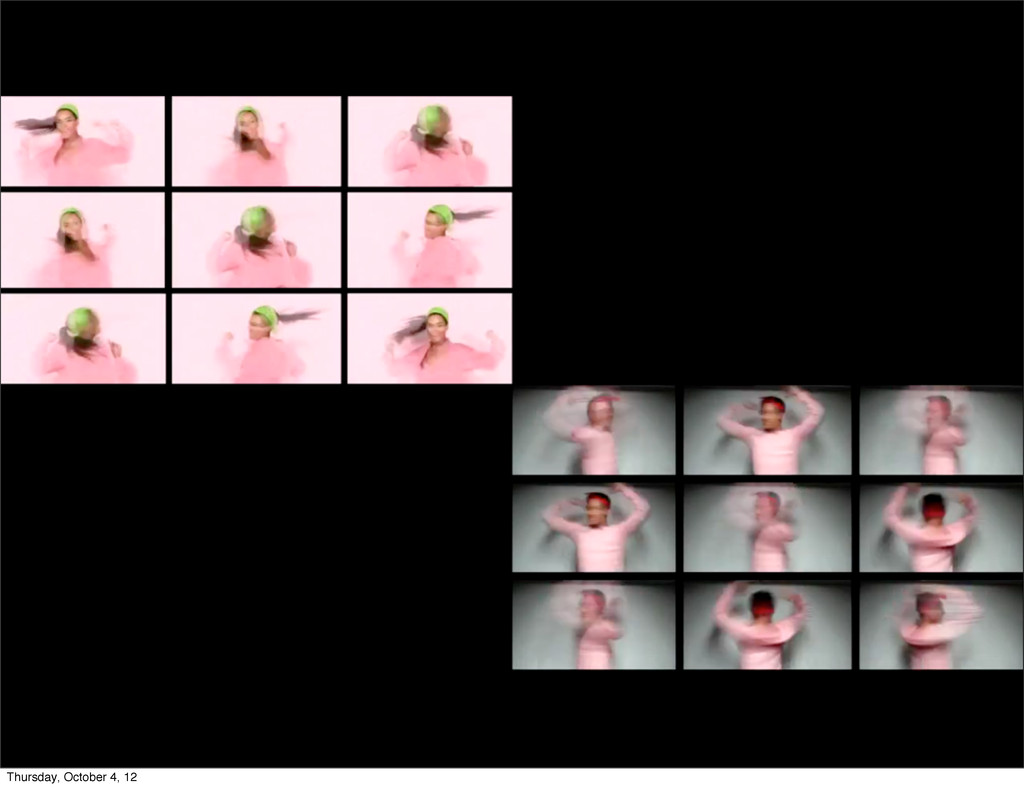
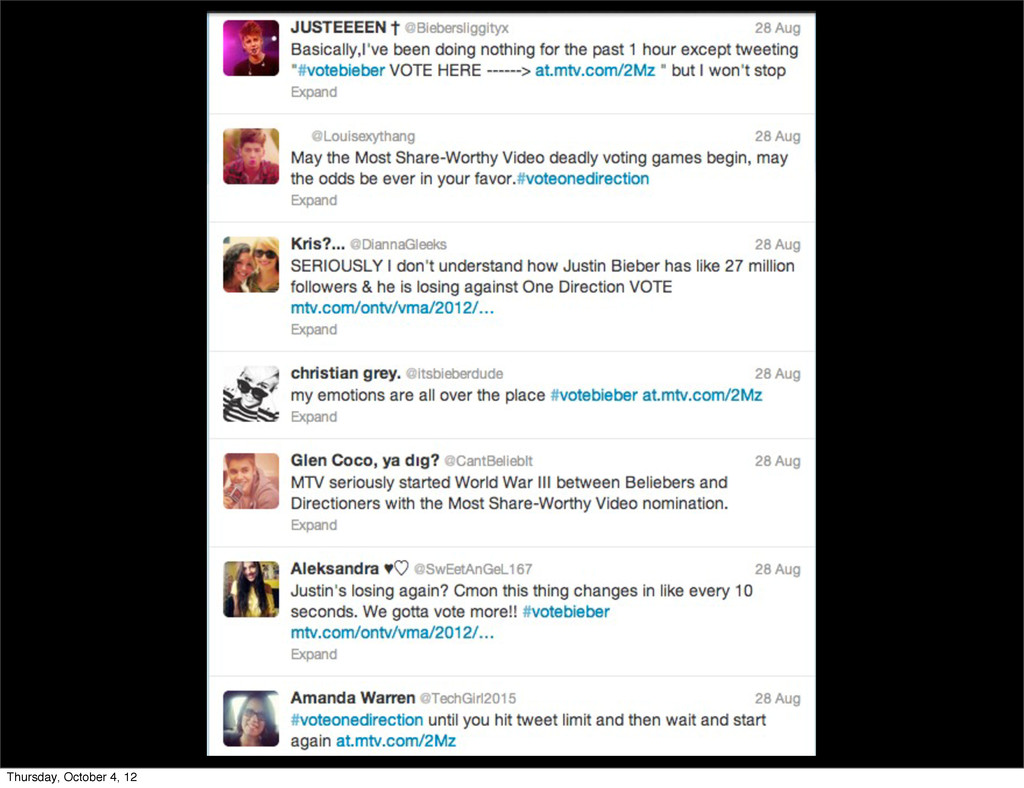
The Importance of the Human Connection Thursday, October 4, 12
Thursday, October 4, 12
Thursday, October 4, 12
Thursday, October 4, 12
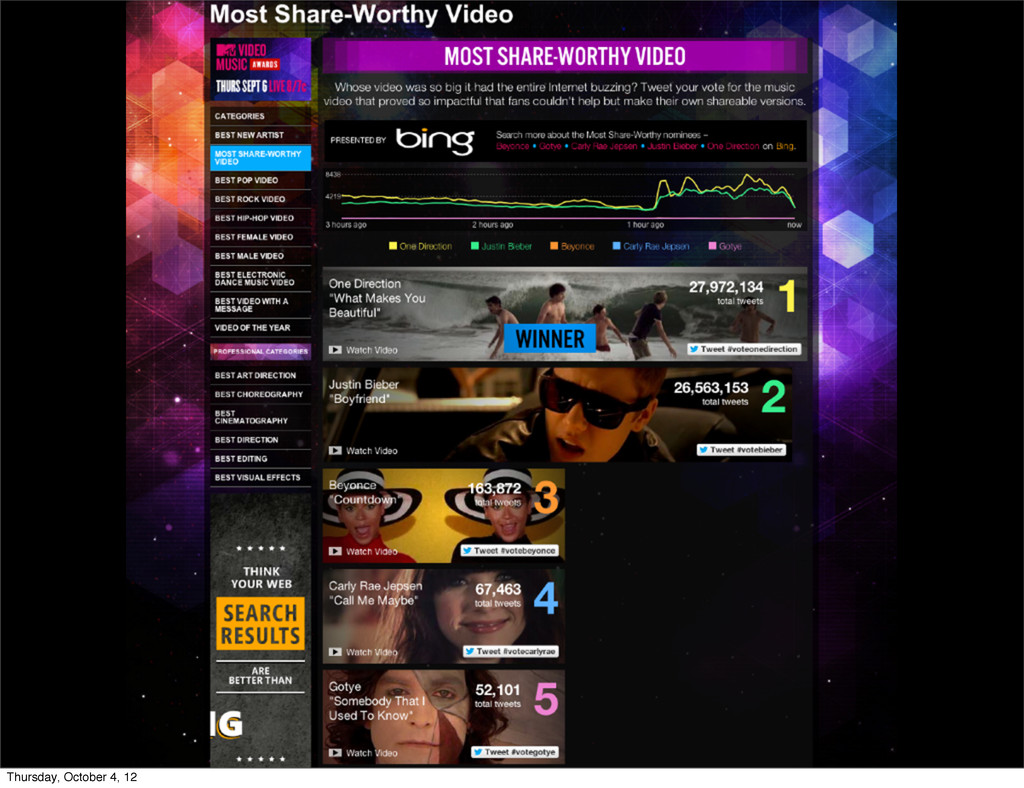
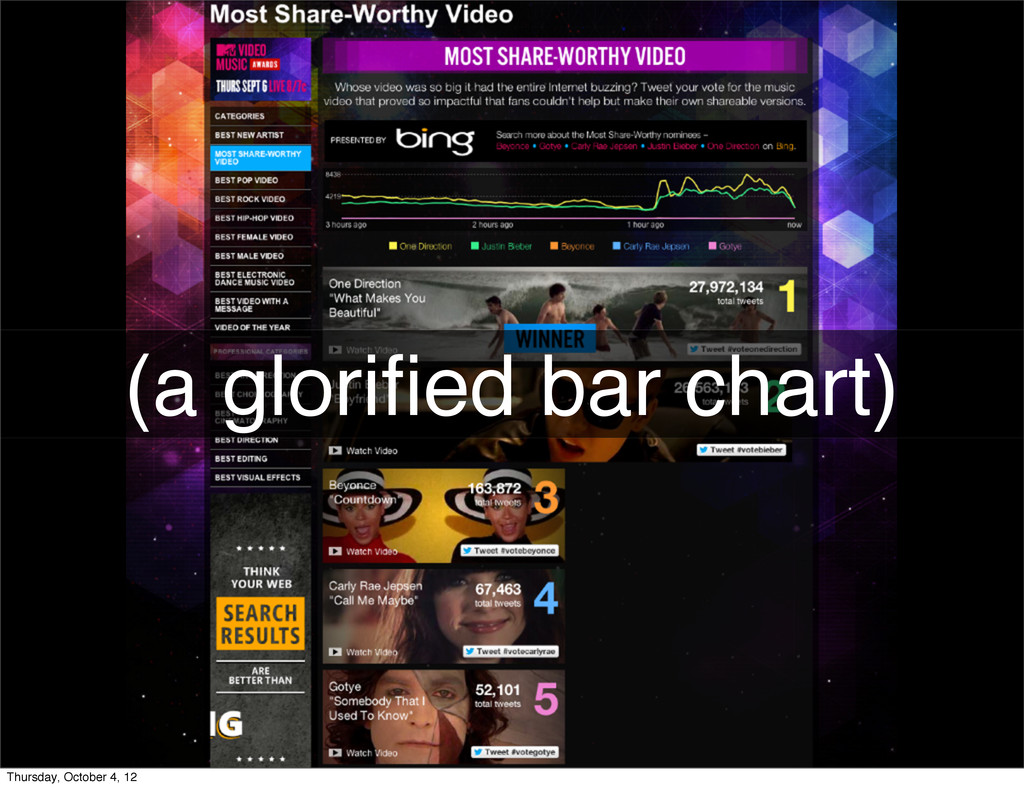
(a glorified bar chart) Thursday, October 4, 12
Thursday, October 4, 12
Thursday, October 4, 12
If Data Visualization Is To Survive, It Will Become Invisible
Thursday, October 4, 12
Thursday, October 4, 12
Thursday, October 4, 12
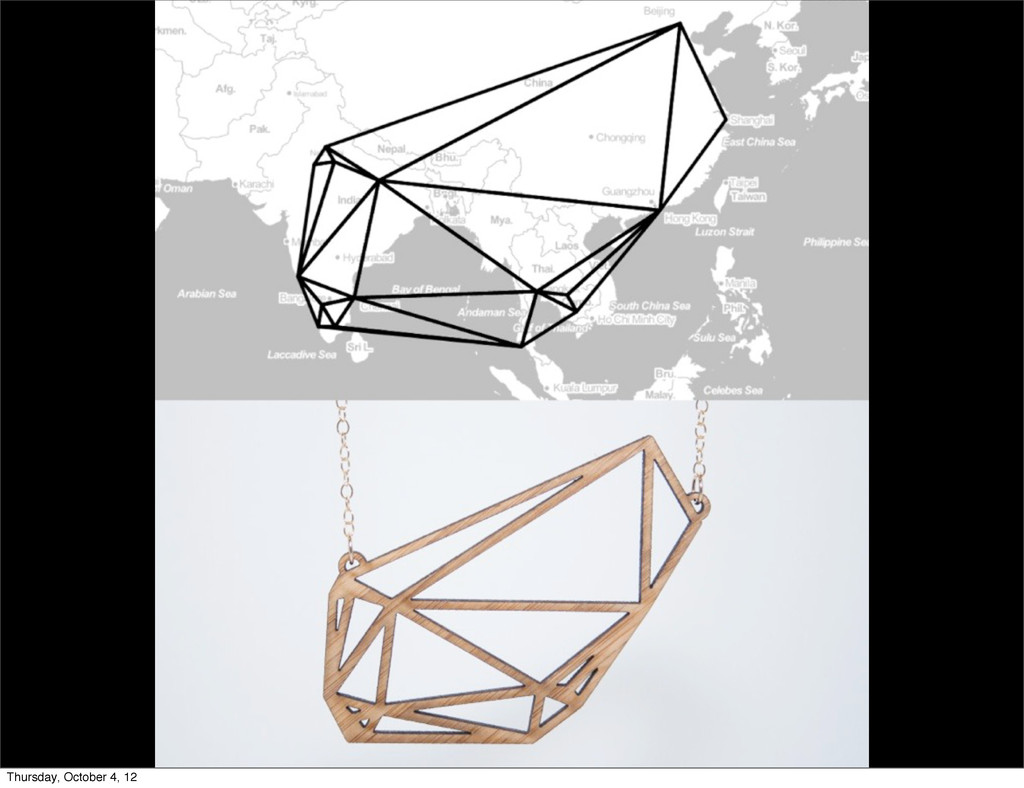
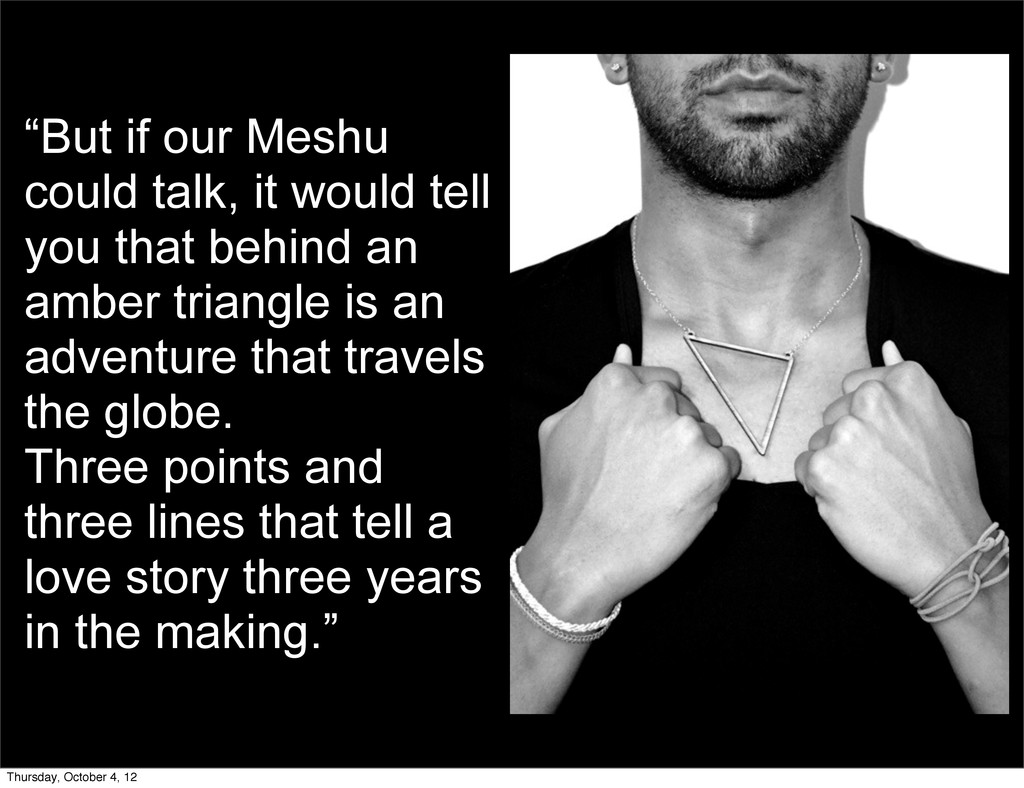
“But if our Meshu could talk, it would tell you
that behind an amber triangle is an adventure that travels the globe. Three points and three lines that tell a love story three years in the making.” Thursday, October 4, 12
Create Visualizations That People Can Connect To. Thursday, October 4,
12
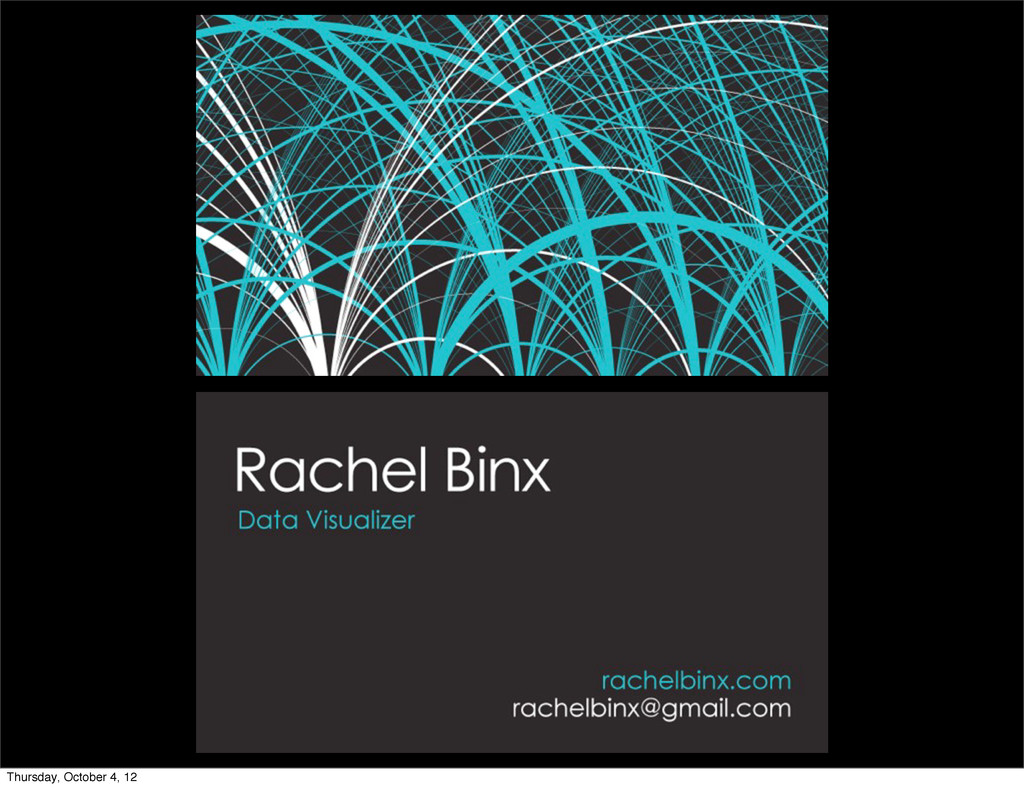
Thanks! @rachelbinx
[email protected]
Thursday, October 4, 12
![Thanks! @rachelbinx [email protected] Thursday, October 4, 12](https://files.speakerdeck.com/presentations/506def3002144e000200e075/slide_23.jpg)