Upgrade to Pro
— share decks privately, control downloads, hide ads and more …
Speaker Deck
Features
Speaker Deck
PRO
Sign in
Sign up for free
Search
Search
The Introduction of Data Visualization
Search
Dreampuf
September 21, 2012
Technology
380
1
Share
Embed
Copy iframe code
Copy JS code
Copy link
Start on current slide
The Introduction of Data Visualization
This slide is talk about the data visualization
Dreampuf
September 21, 2012
More Decks by Dreampuf
See All by Dreampuf
Python Magic Methods
dreampuf
6
480
D3Js
dreampuf
2
210
Pythonic
dreampuf
34
2.5k
PythonProfiling.pdf
dreampuf
4
210
Other Decks in Technology
See All in Technology
『三匹の子ぶた』から学ぶネットワークセキュリティの昔と今 / Network Security: Then and Now Through the Lens of The Three Little Pigs
nttcom
1
680
実践が先生だった— 新卒サーバーエンジニア1年目のリアル
mixi_engineers
PRO
0
220
オートロックマンションなのに、各部屋は施錠なし!? 攻撃者が組織内ネットワークで大暴れする理由 / The Front Door Is Locked, but the Rooms Are Wide Open: Why Attackers Move Freely Inside Enterprise Networks
nttcom
0
650
QAタスクをスキル化したいときに考えること
aomoriringo
0
140
VPCセキュリティ対応の最新事情
nagisa53
2
350
SnowflakeCoCoでデータエンジニアリング!
foursue
0
110
AIQAのナレッジ構築について
qatonchan
1
140
Amazon Bedrock Managed Knowledge Base Dive Deep
ren8k
0
320
PLaMo 3.0 Primeの構造化出力サポート
pfn
PRO
0
160
NetBoxを利用した作業効率化の試み_NetDevNight4
tnoha
0
420
AWS環境のセキュリティ不安を解消した企業事例 ~よくある課題と対策を一挙公開~
asanoharuki
1
270
書籍セキュアAPIについて
riiimparm
0
400
Featured
See All Featured
Designing Powerful Visuals for Engaging Learning
tmiket
1
470
A brief & incomplete history of UX Design for the World Wide Web: 1989–2019
jct
2
430
New Earth Scene 8
popppiees
3
2.4k
Why Your Marketing Sucks and What You Can Do About It - Sophie Logan
marketingsoph
0
340
Highjacked: Video Game Concept Design
rkendrick25
PRO
1
420
Designing for Timeless Needs
cassininazir
1
430
Reflections from 52 weeks, 52 projects
jeffersonlam
356
21k
個人開発の失敗を避けるイケてる考え方 / tips for indie hackers
panda_program
123
22k
CoffeeScript is Beautiful & I Never Want to Write Plain JavaScript Again
sstephenson
162
16k
Chasing Engaging Ingredients in Design
codingconduct
0
250
Applied NLP in the Age of Generative AI
inesmontani
PRO
4
2.4k
[Rails World 2023 - Day 1 Closing Keynote] - The Magic of Rails
eileencodes
38
2.9k
Transcript
The Introduction of Data Visualization Dreampuf Aug, 2012
Agenda •数据可视化 •可视化实例 •颜色搭配 •目前工作
None
None
None
None
None
None
None
数据可视化 “利用图形、图像处理、计算机视觉以及用户界面,通过 表达、建模以及对立体、表面、属性以及动画的显示, 对数据加以可视化解释。” Paul Reilly, S. P. Q. Rahtz
(eds.) 1992. Archaeology and the Information Age: A Global Perspective. p.92.
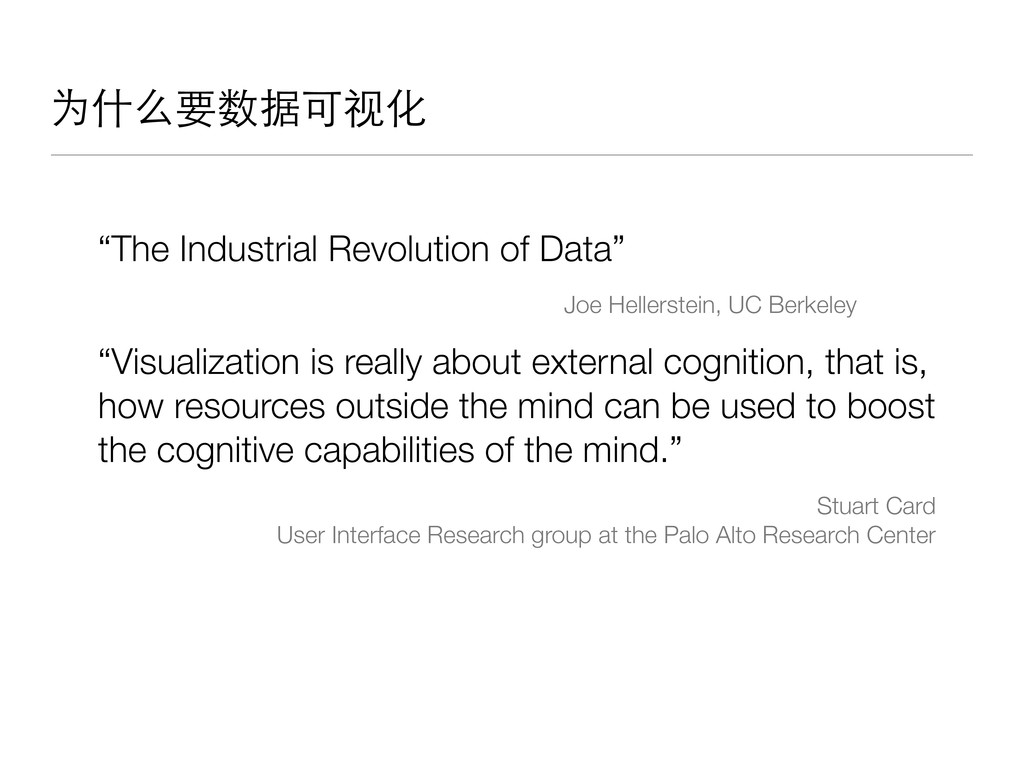
为什么要数据可视化 “The Industrial Revolution of Data” Joe Hellerstein, UC Berkeley
“Visualization is really about external cognition, that is, how resources outside the mind can be used to boost the cognitive capabilities of the mind.” Stuart Card User Interface Research group at the Palo Alto Research Center
为什么要数据可视化 •帮助思考 •感性表达 •增强认知 •用户交互
数据可视化领域划分 •信息可视化 •科学可视化 •可视分析 •交互界面
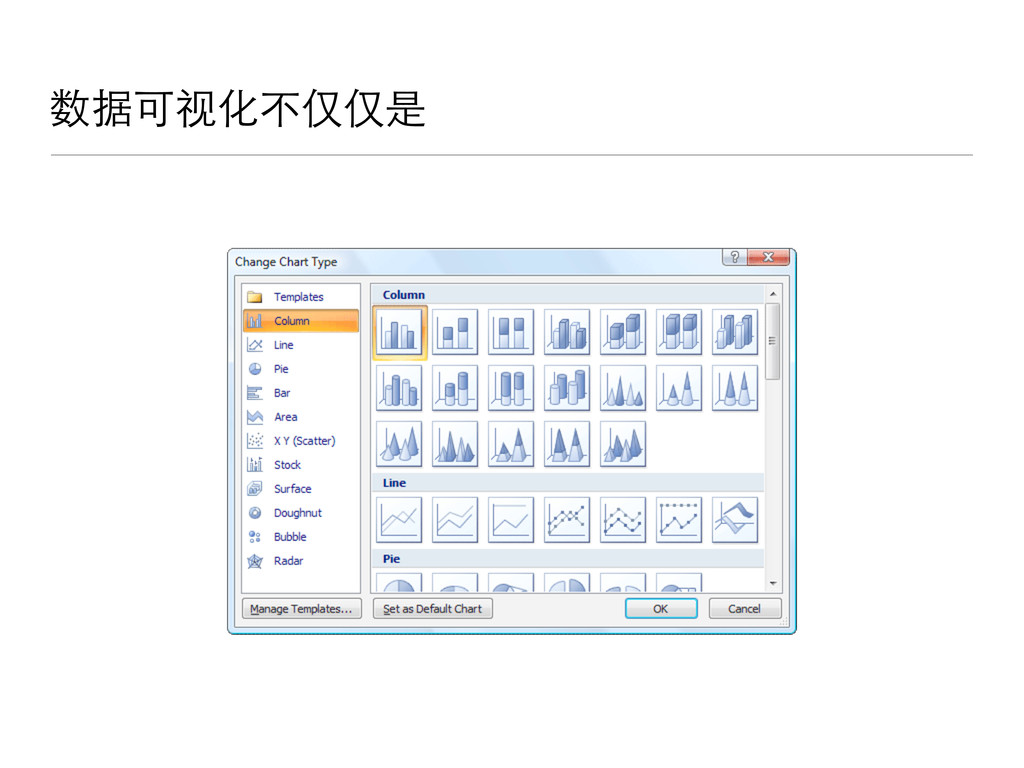
数据可视化不仅仅是
None
None
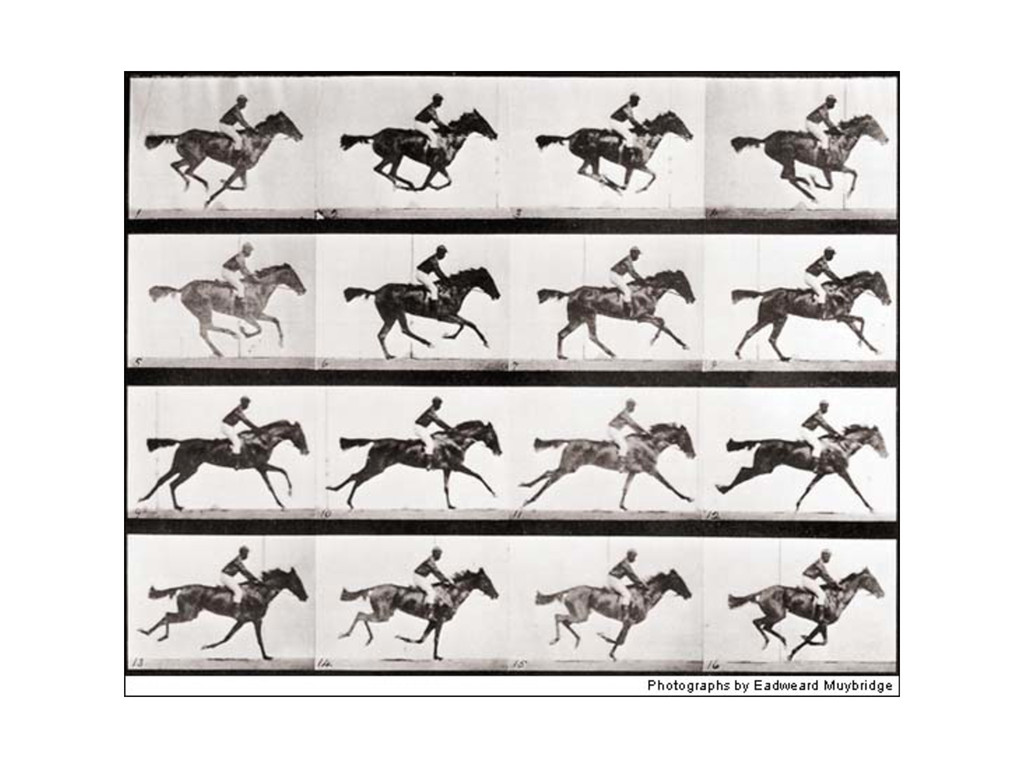
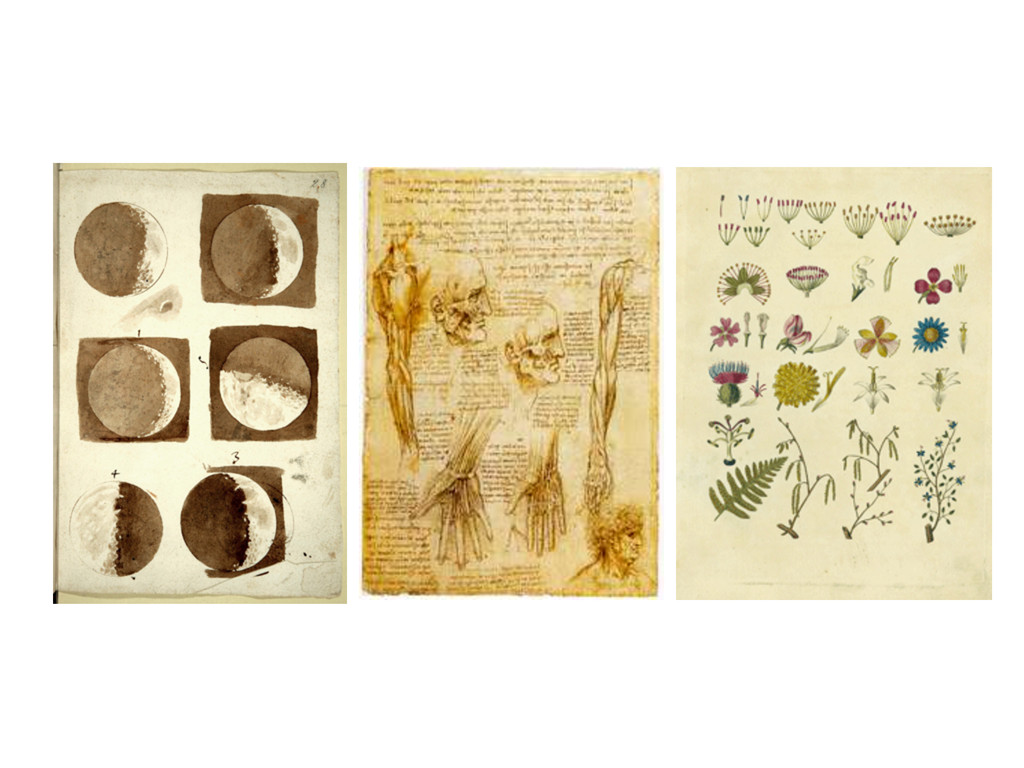
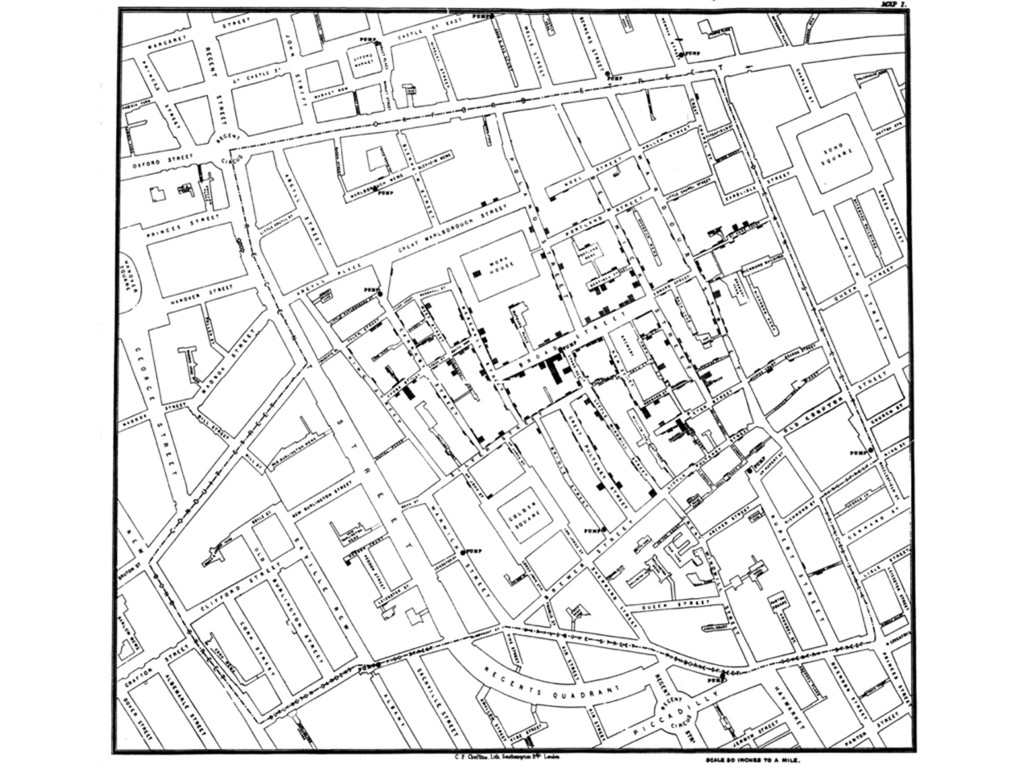
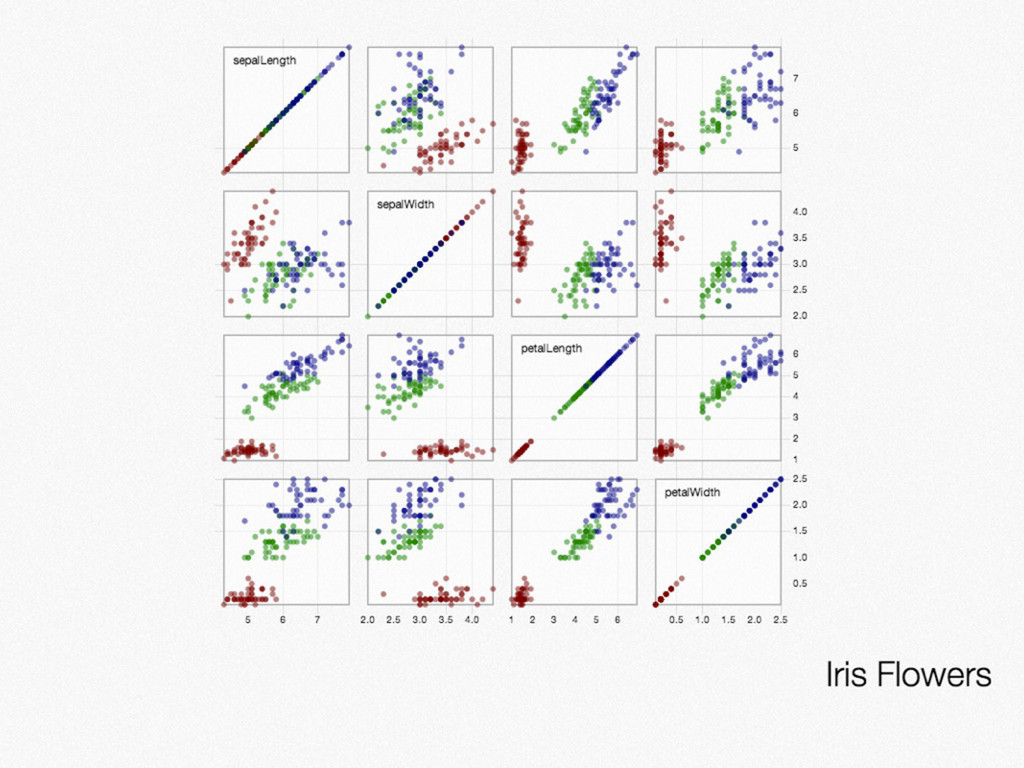
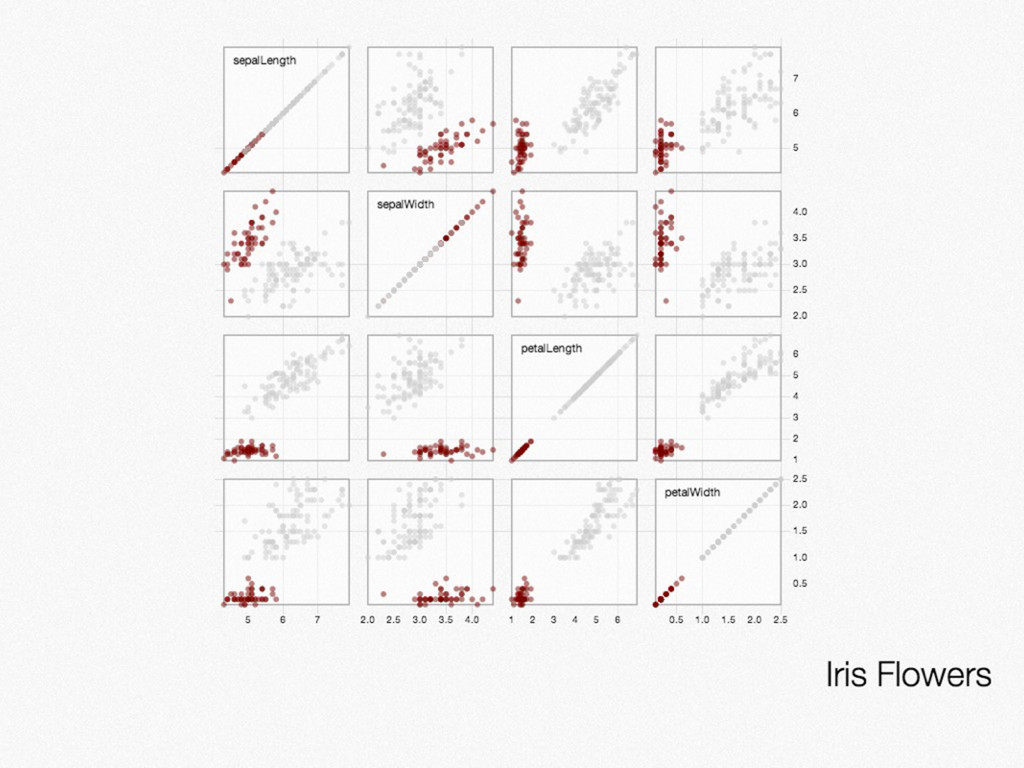
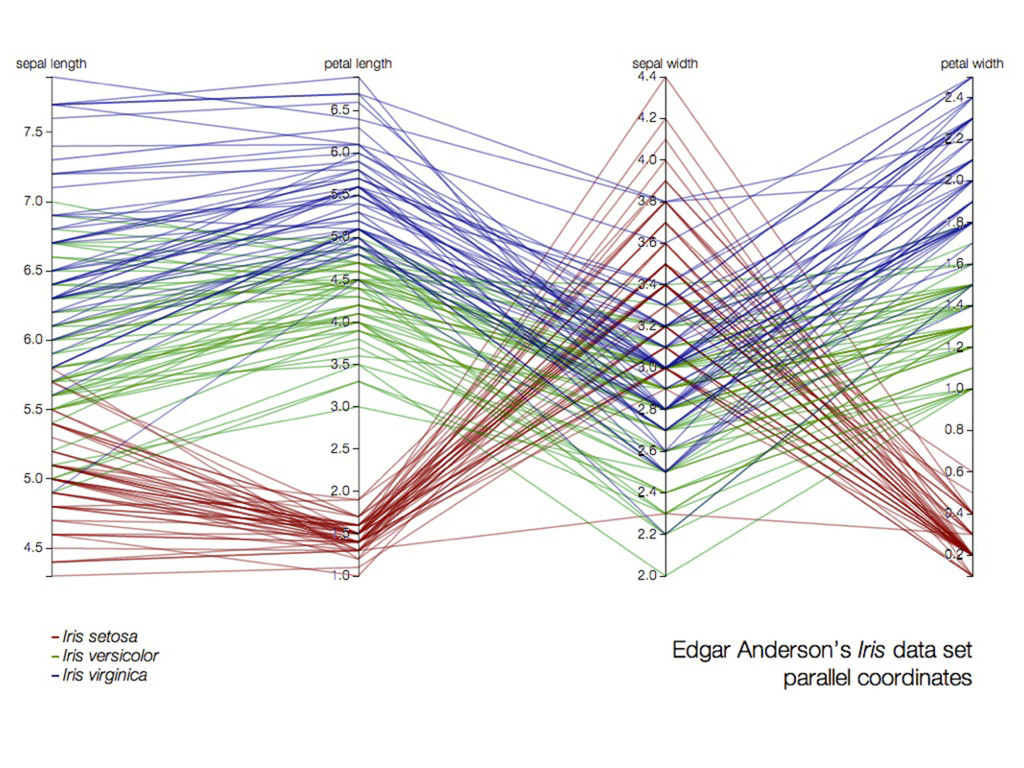
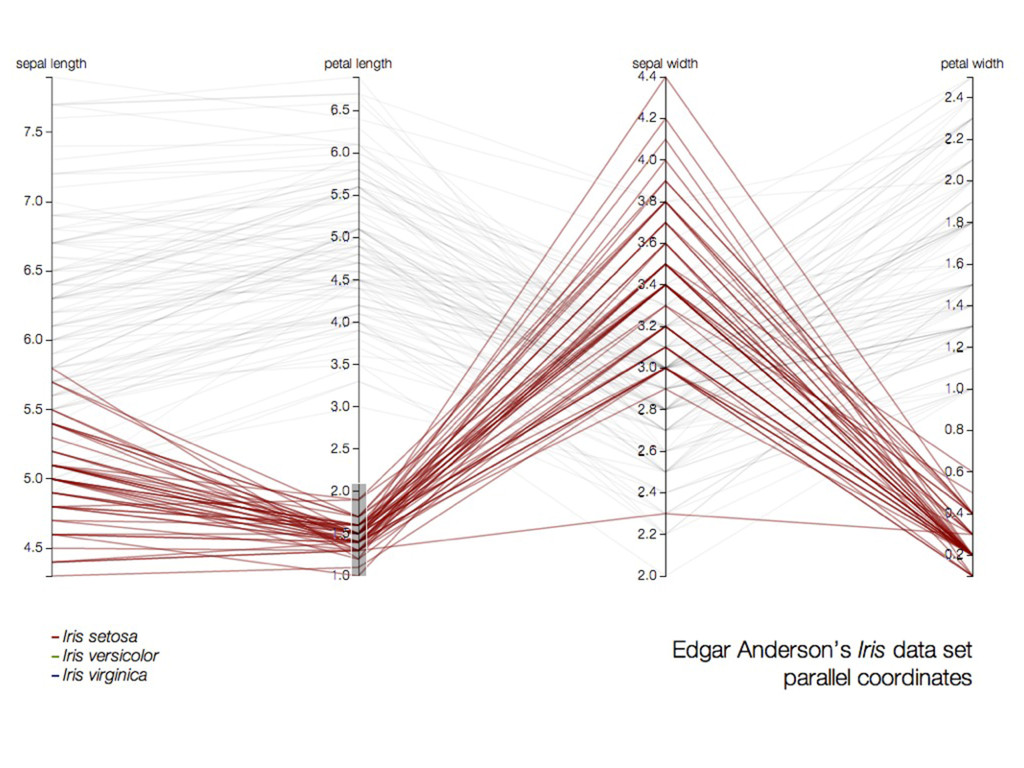
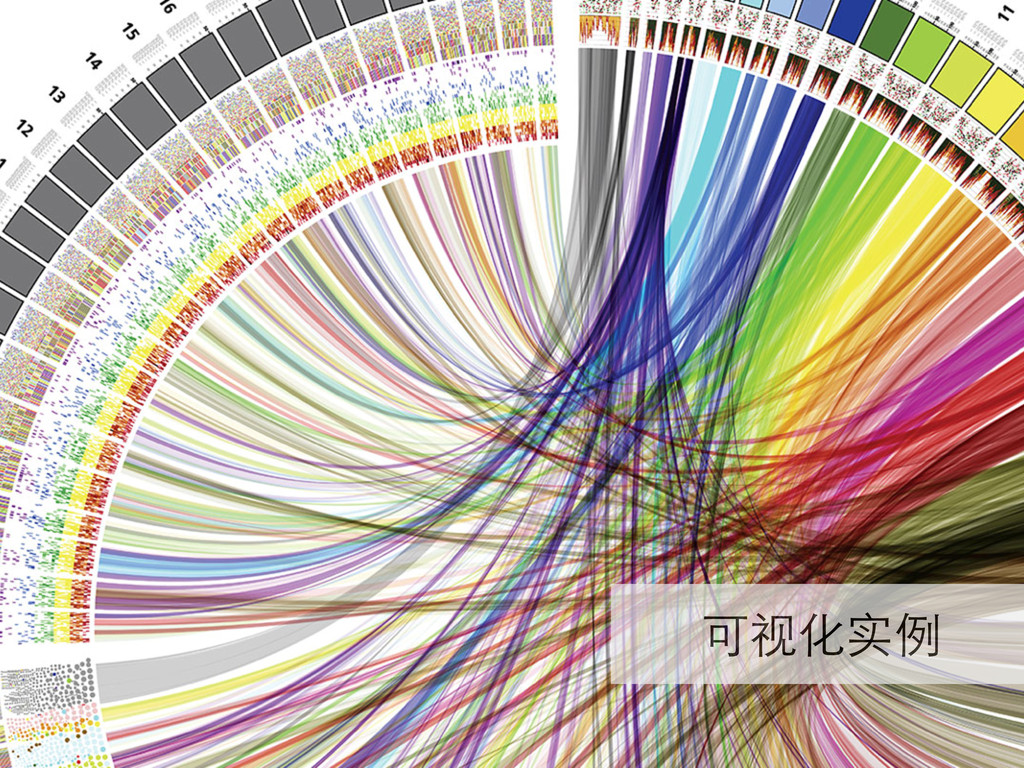
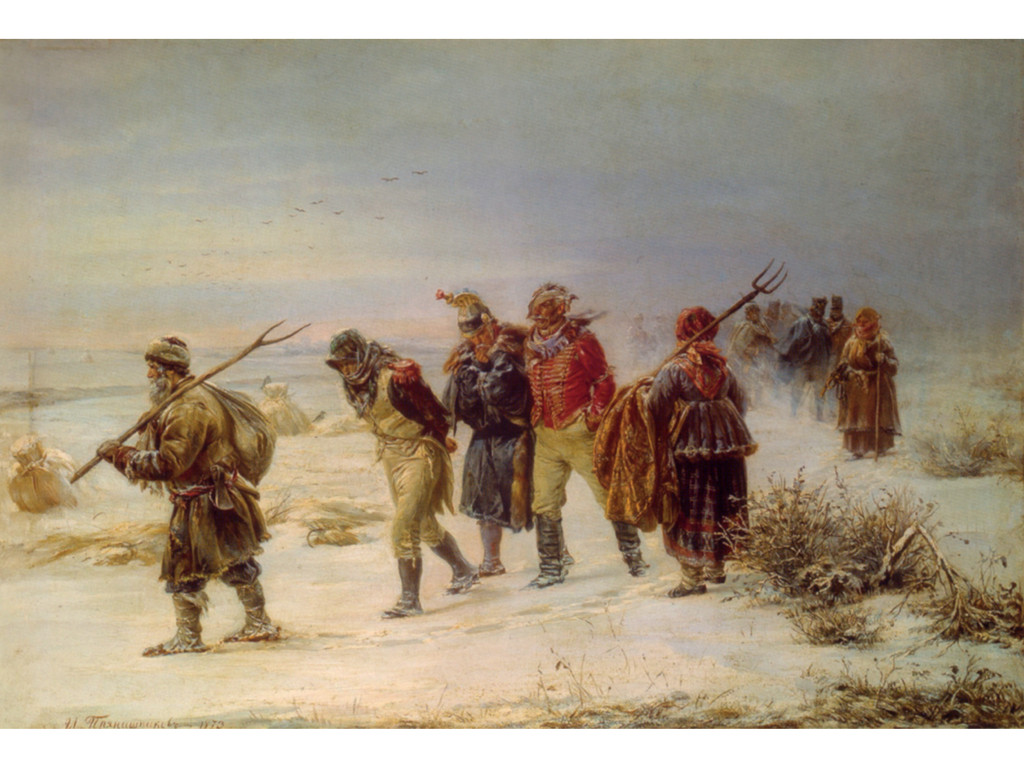
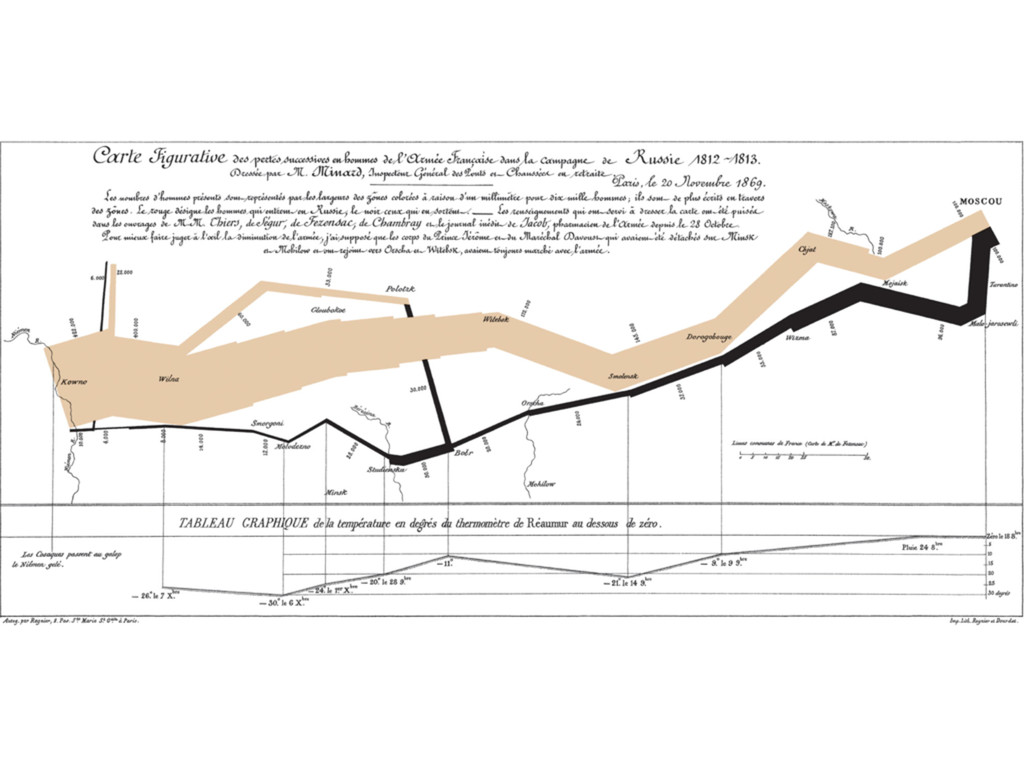
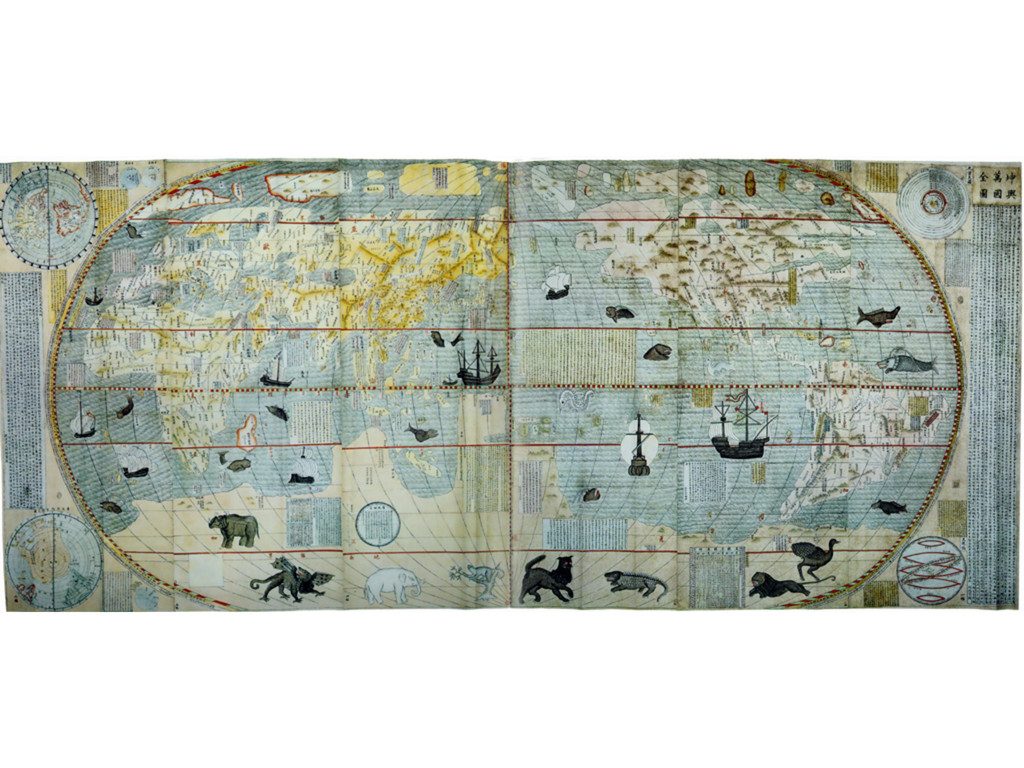
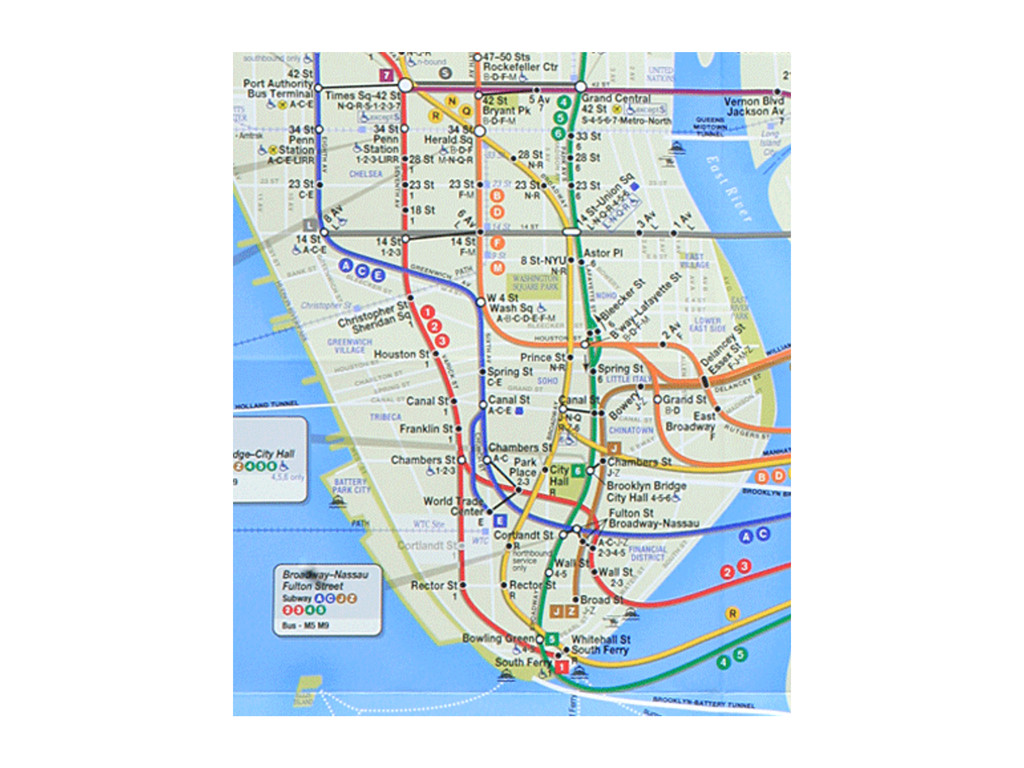
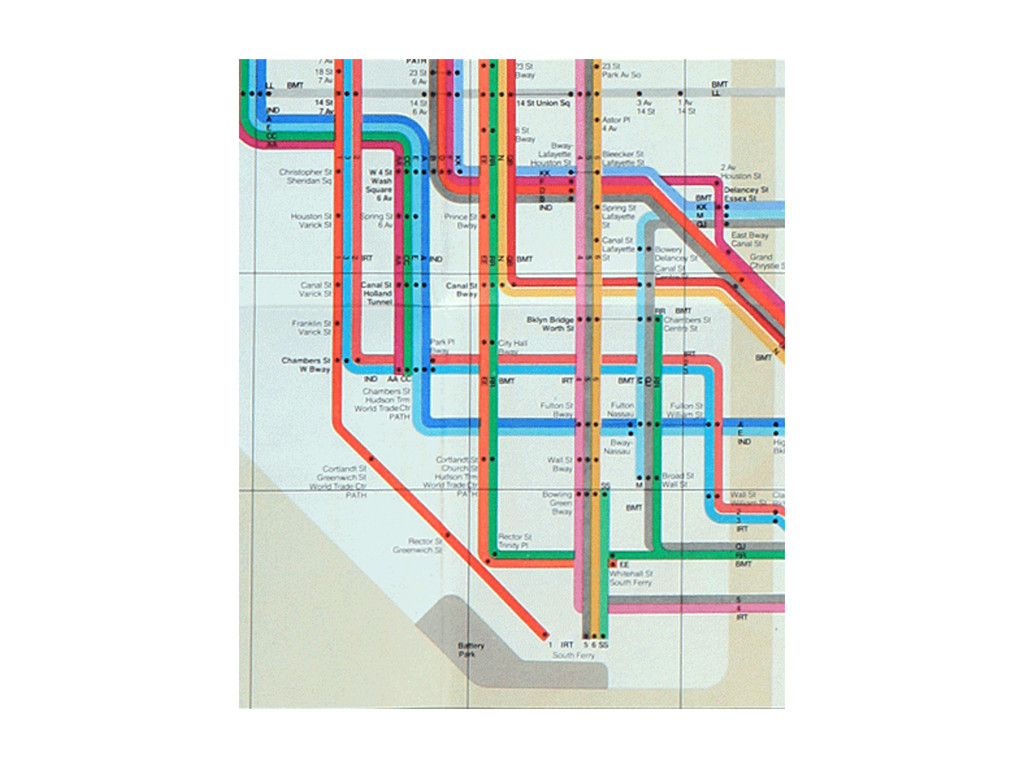
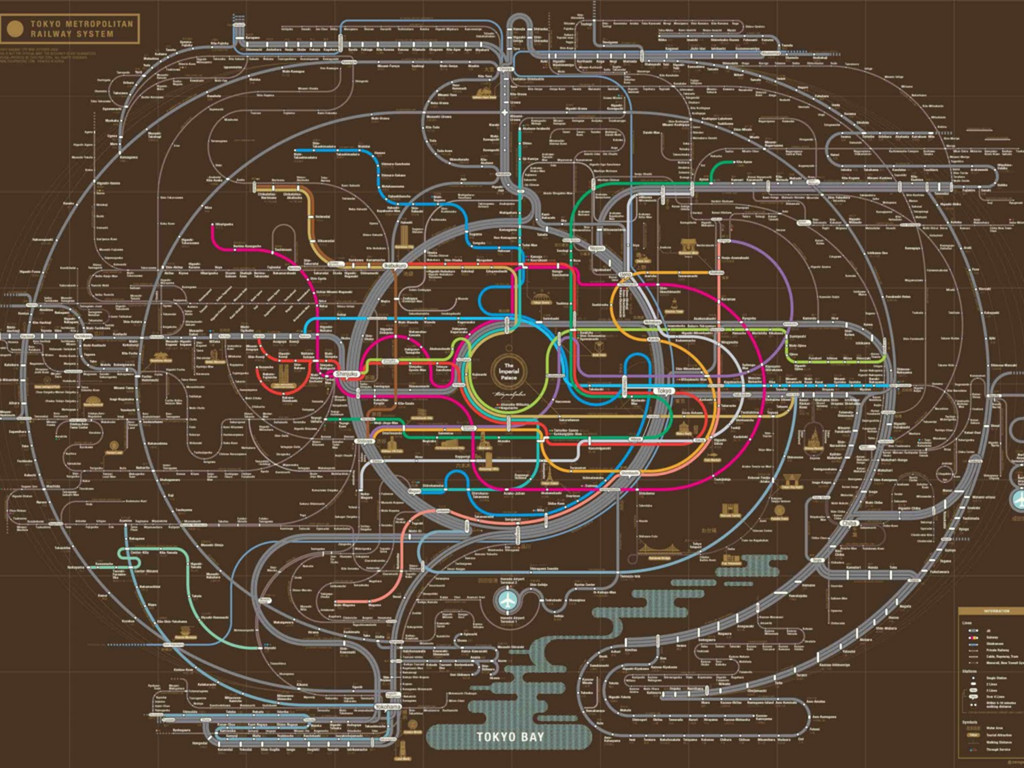
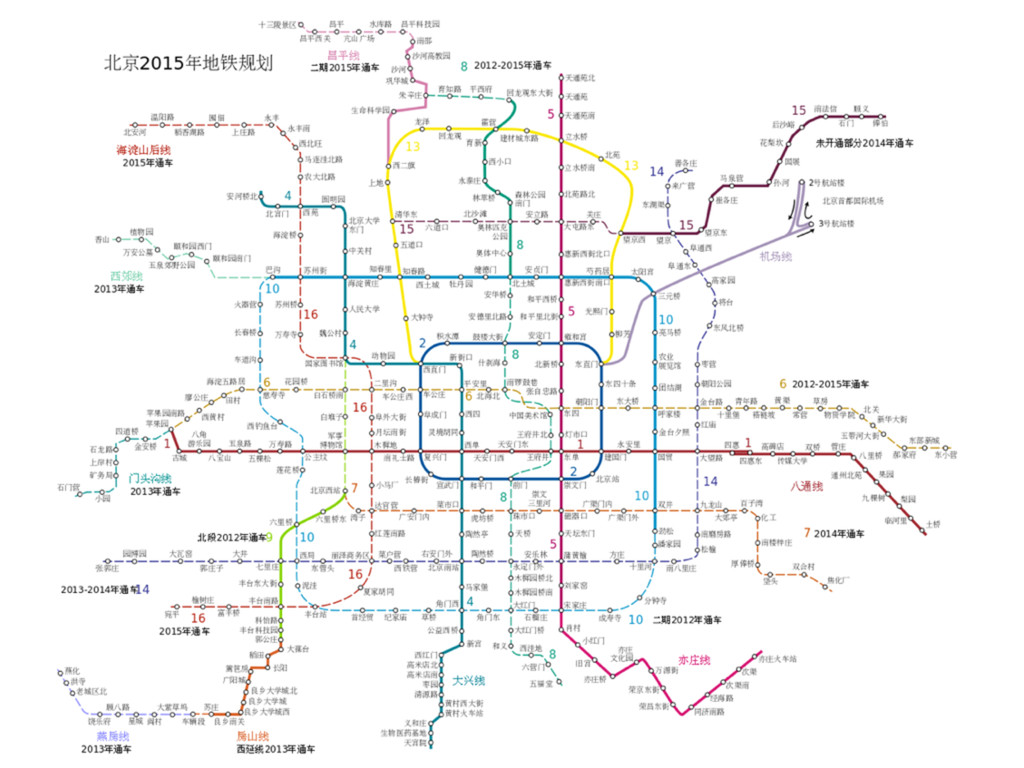
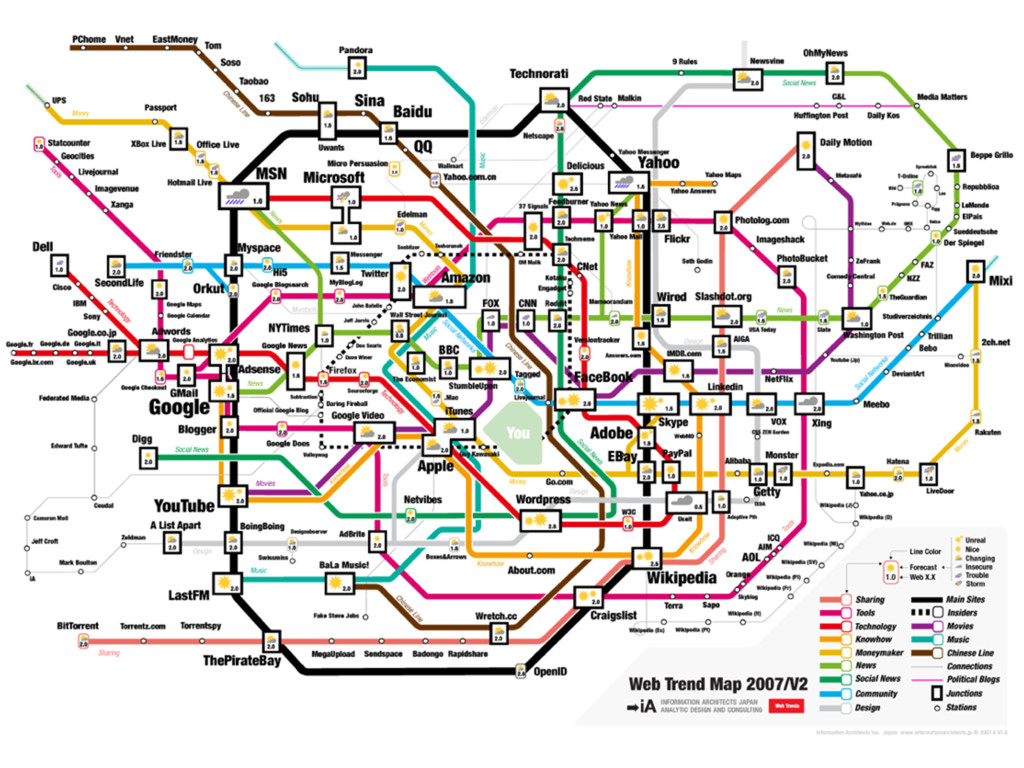
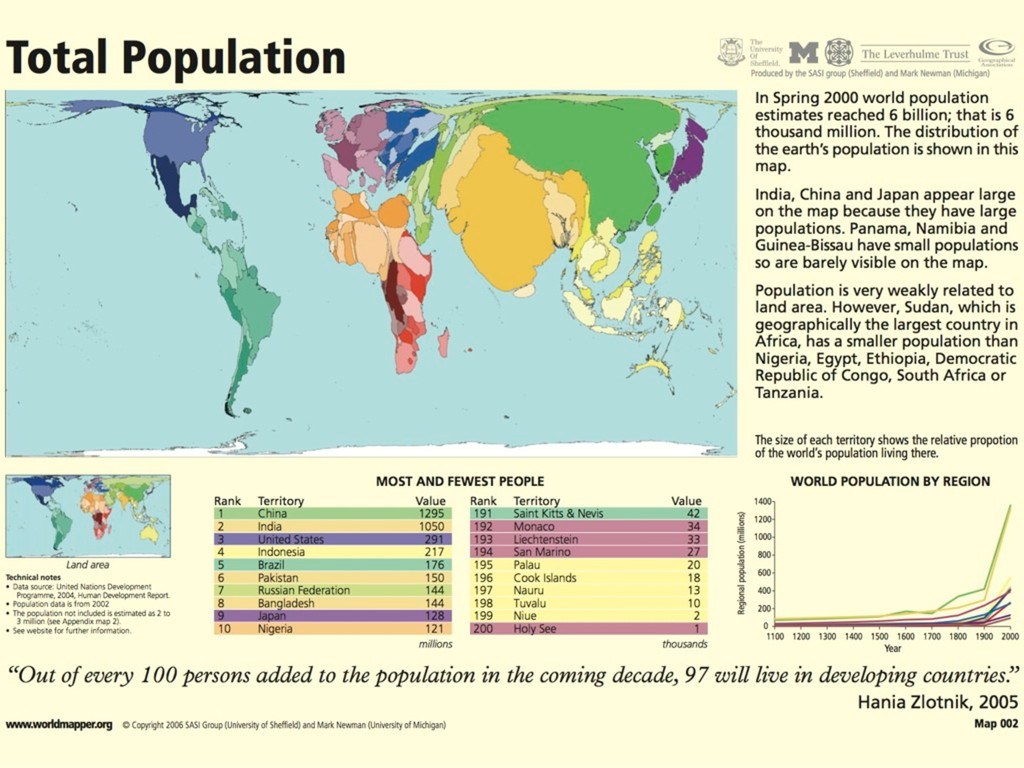
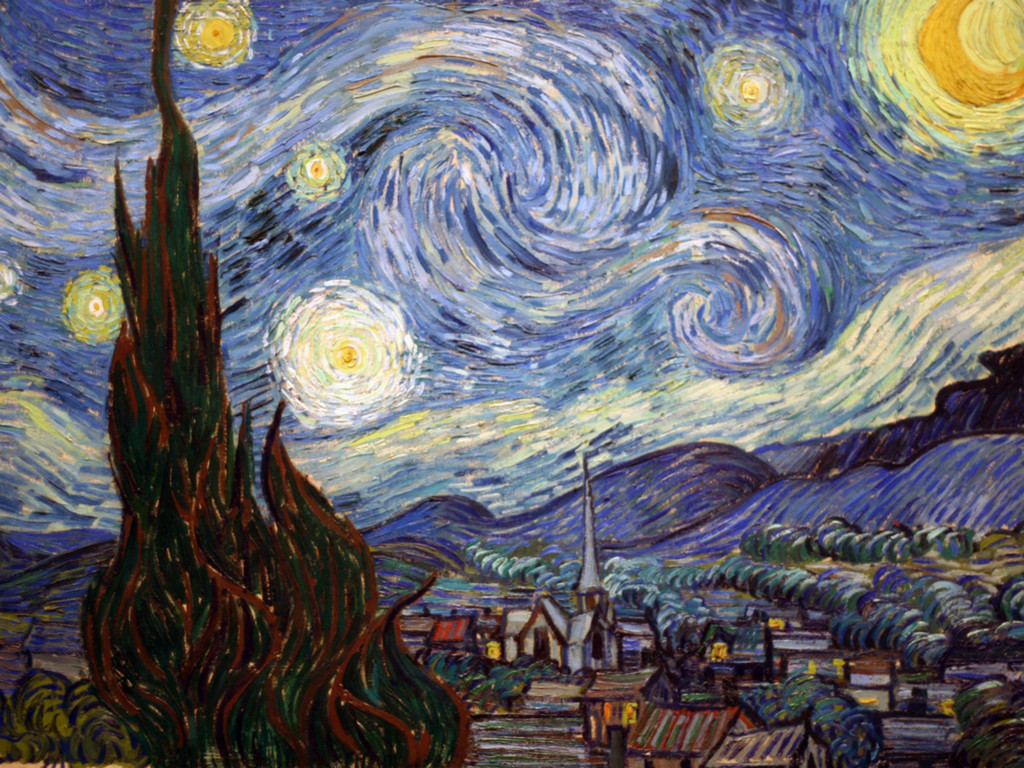
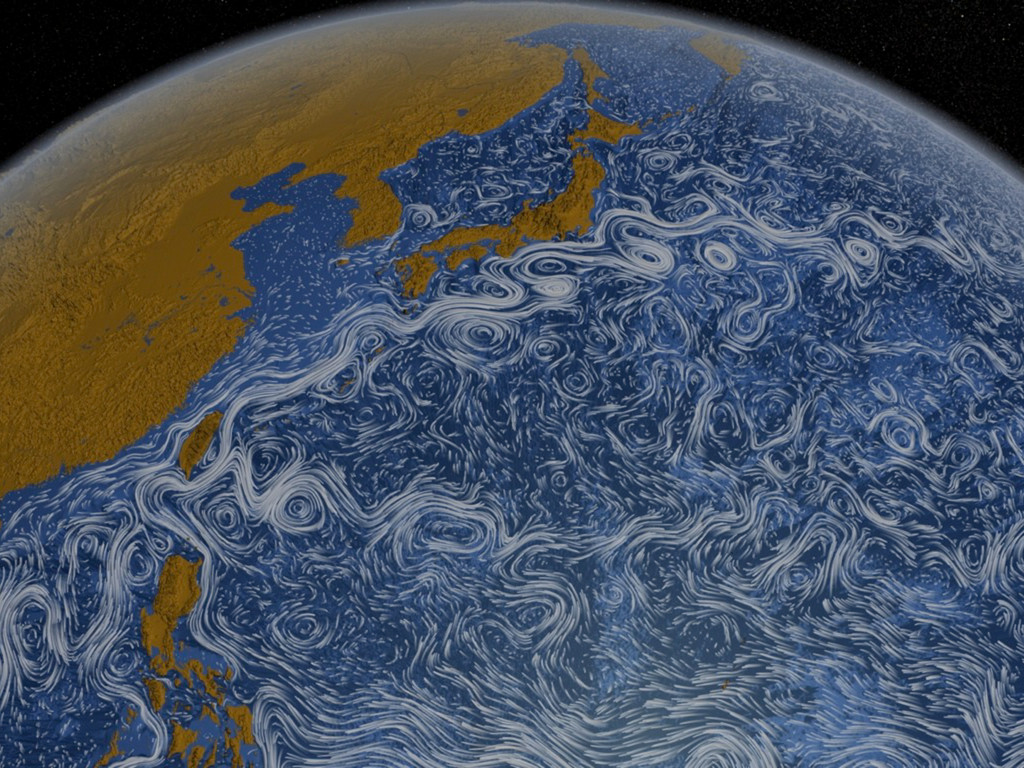
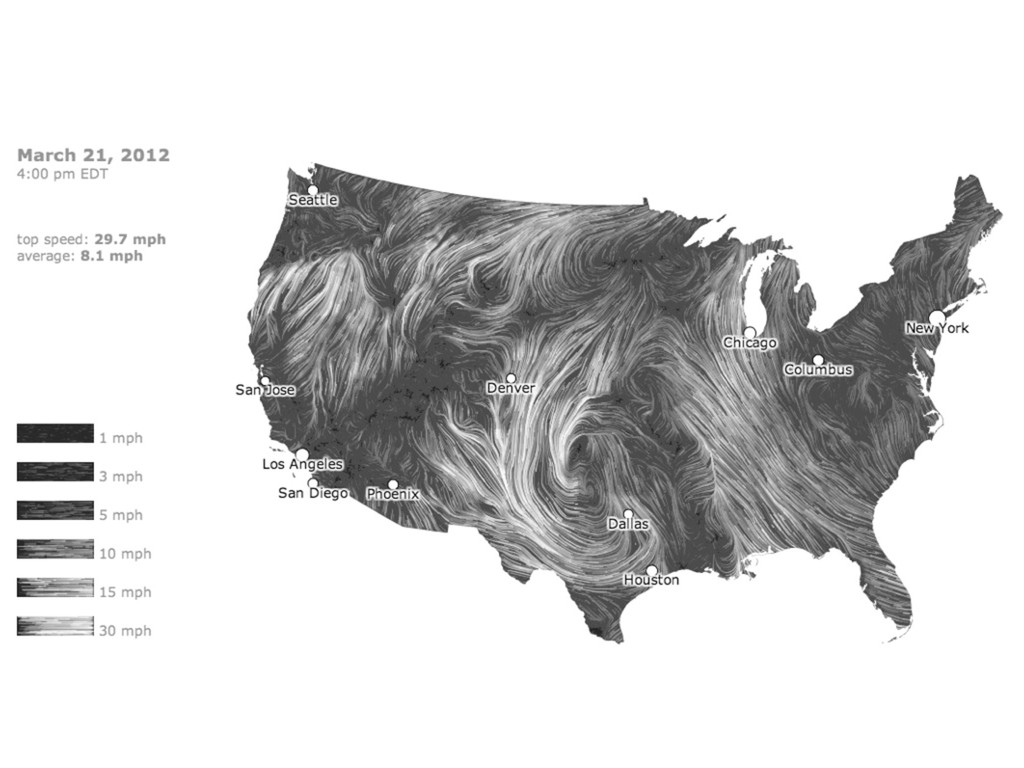
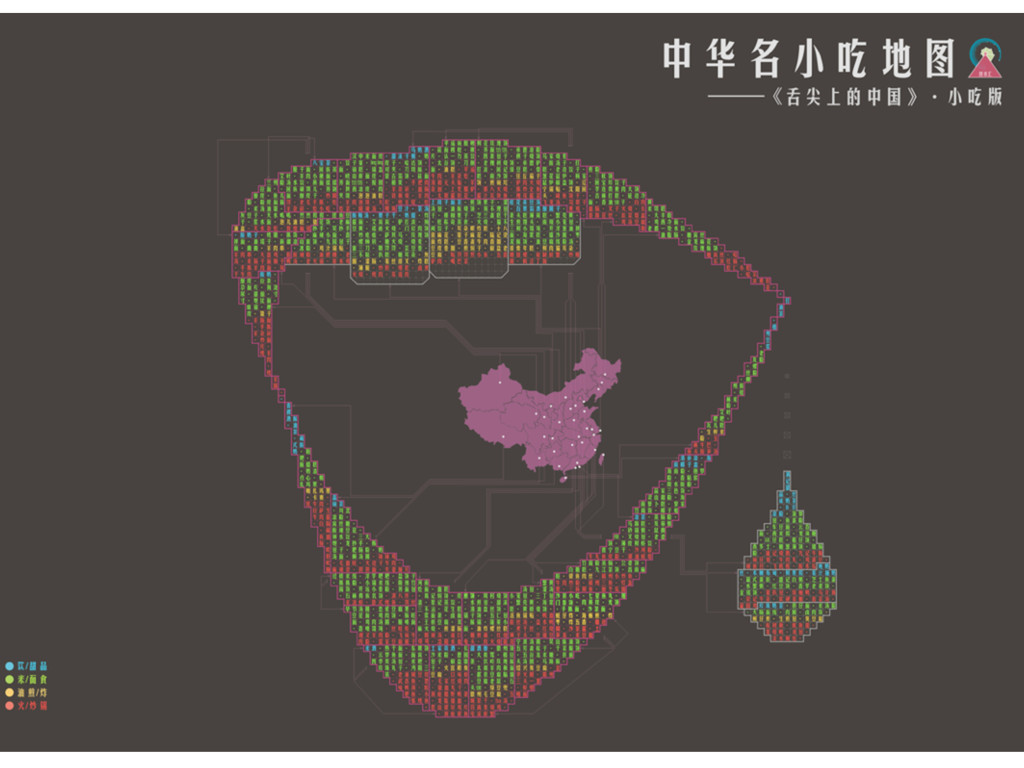
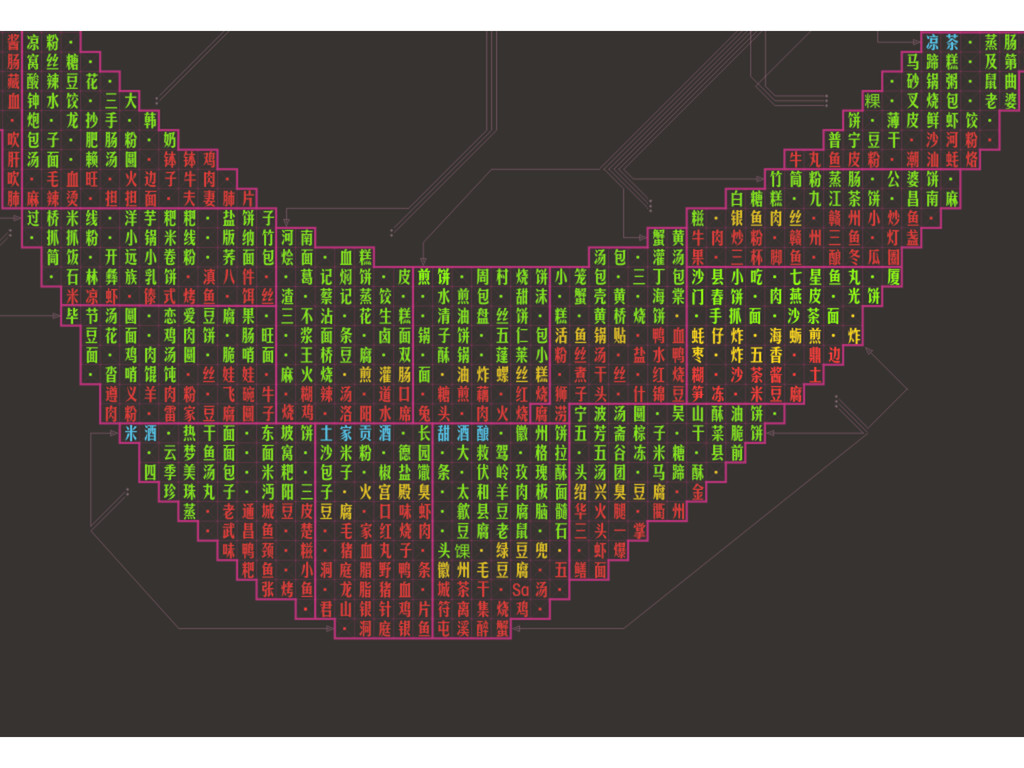
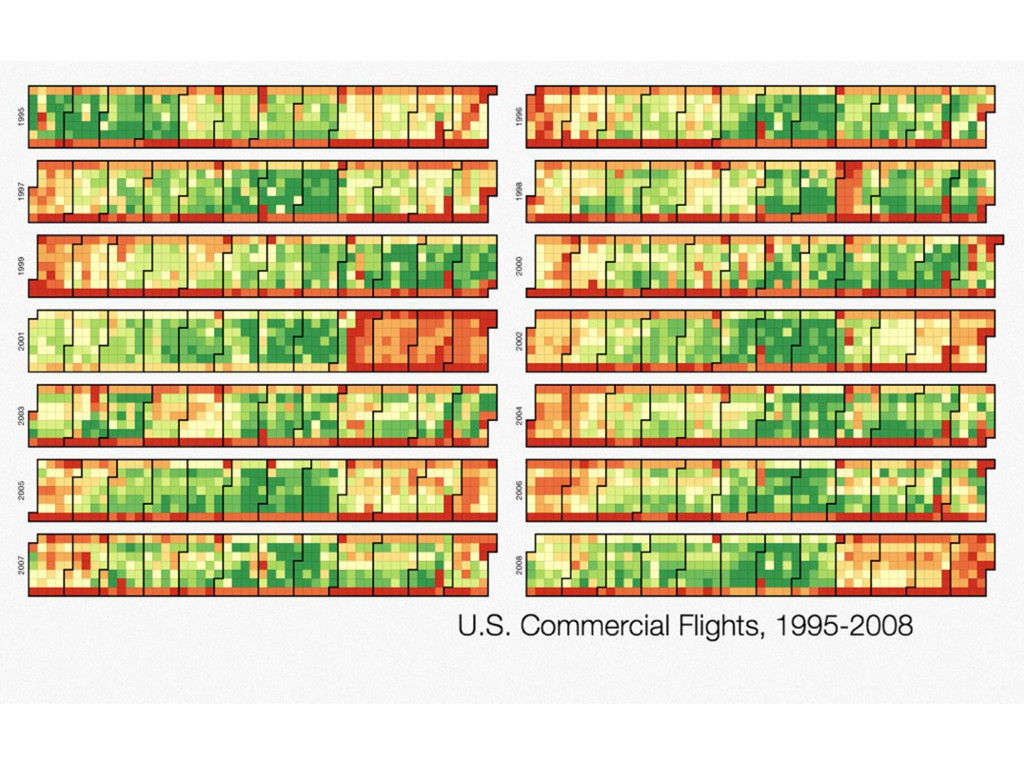
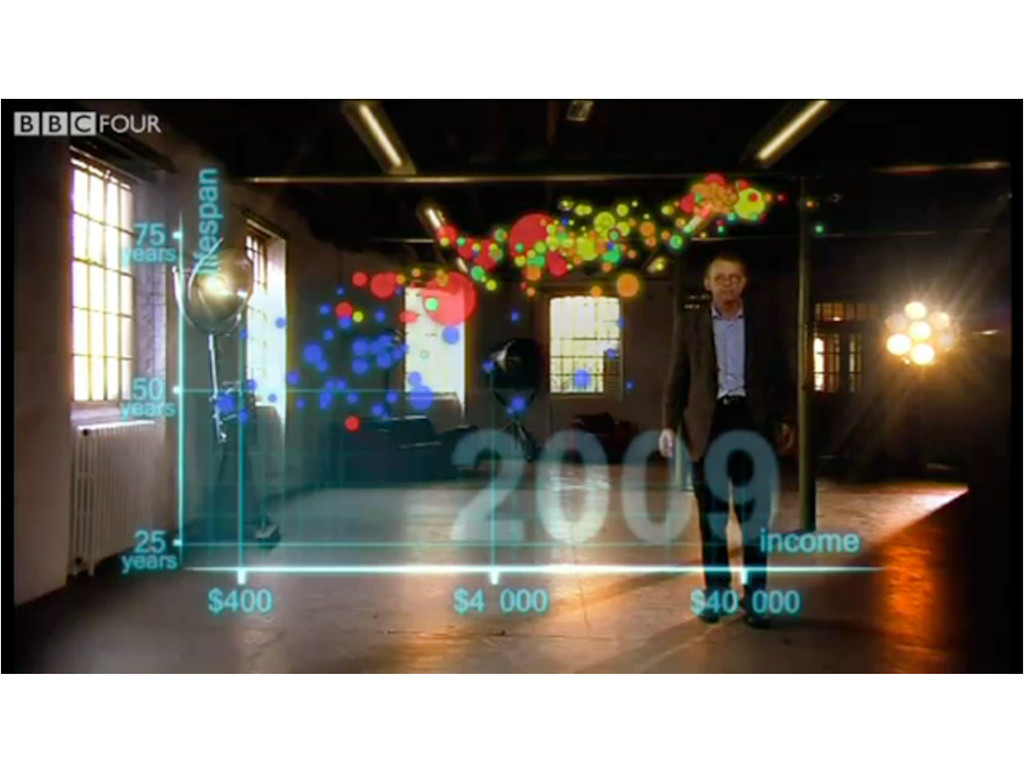
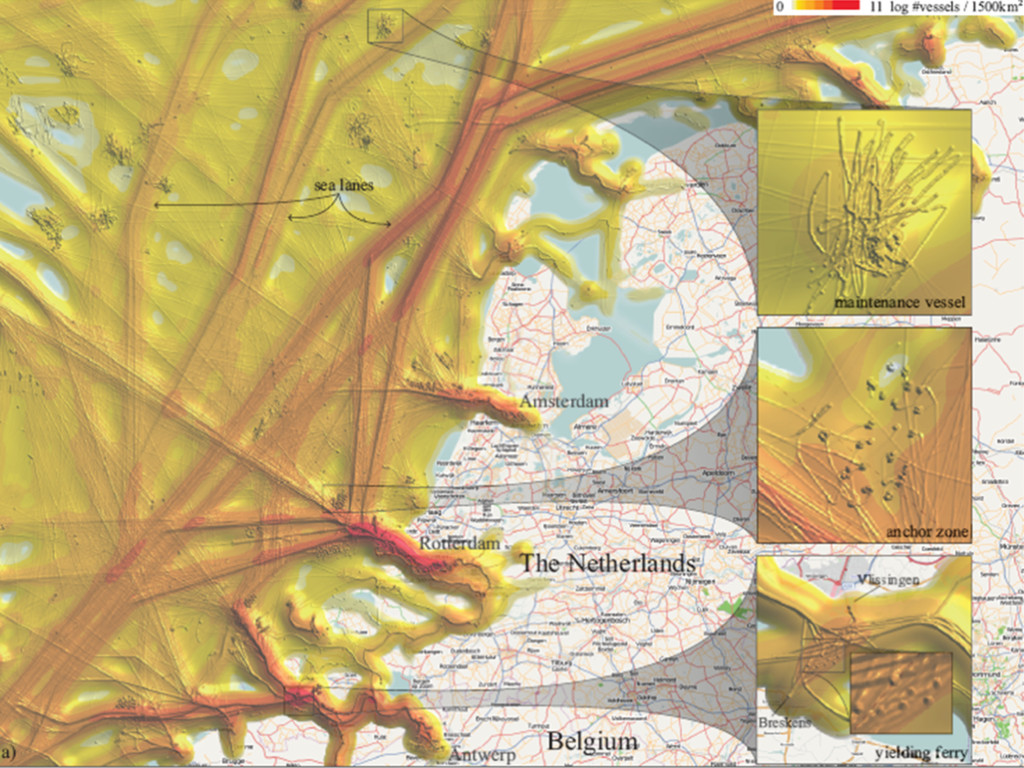
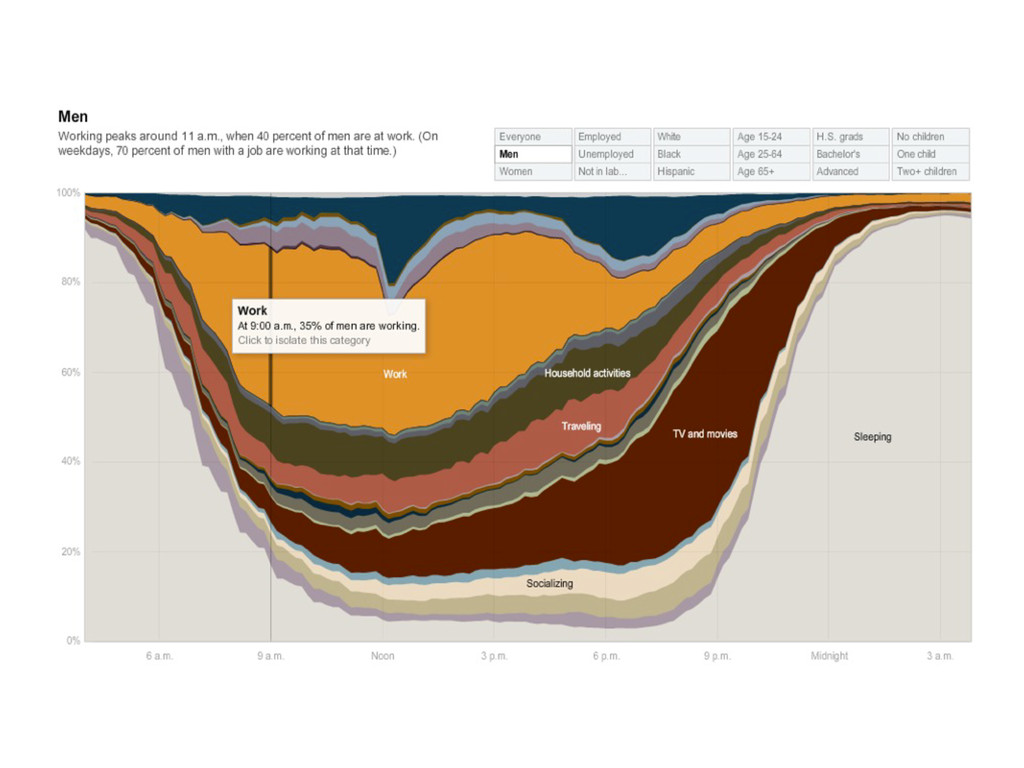
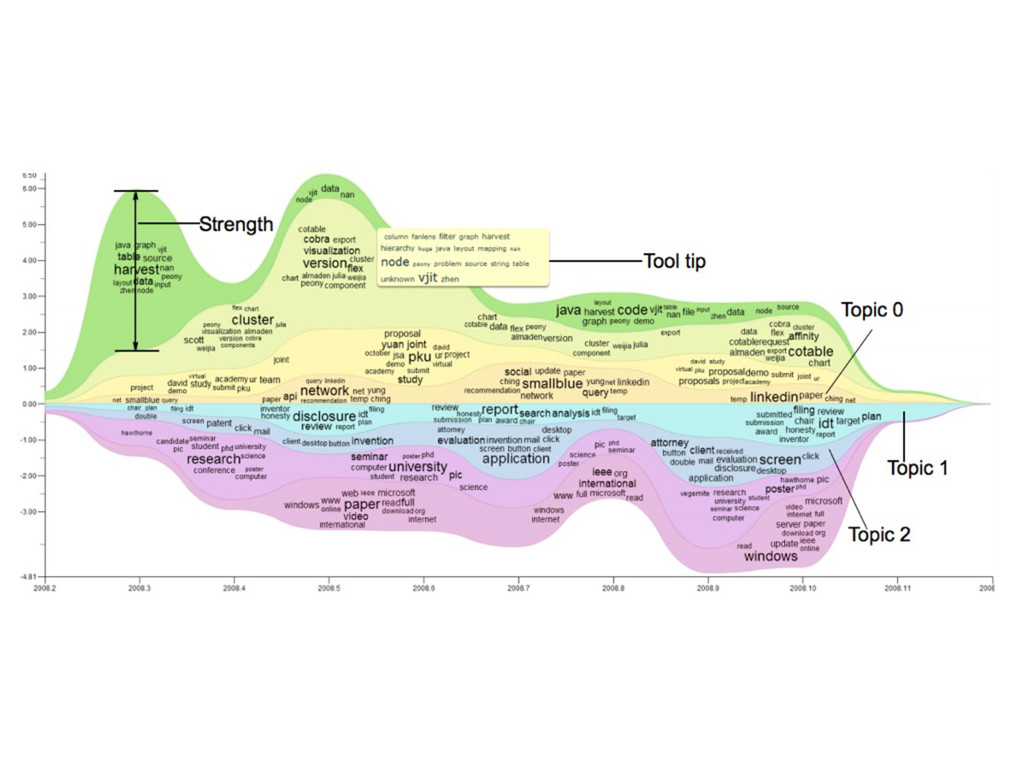
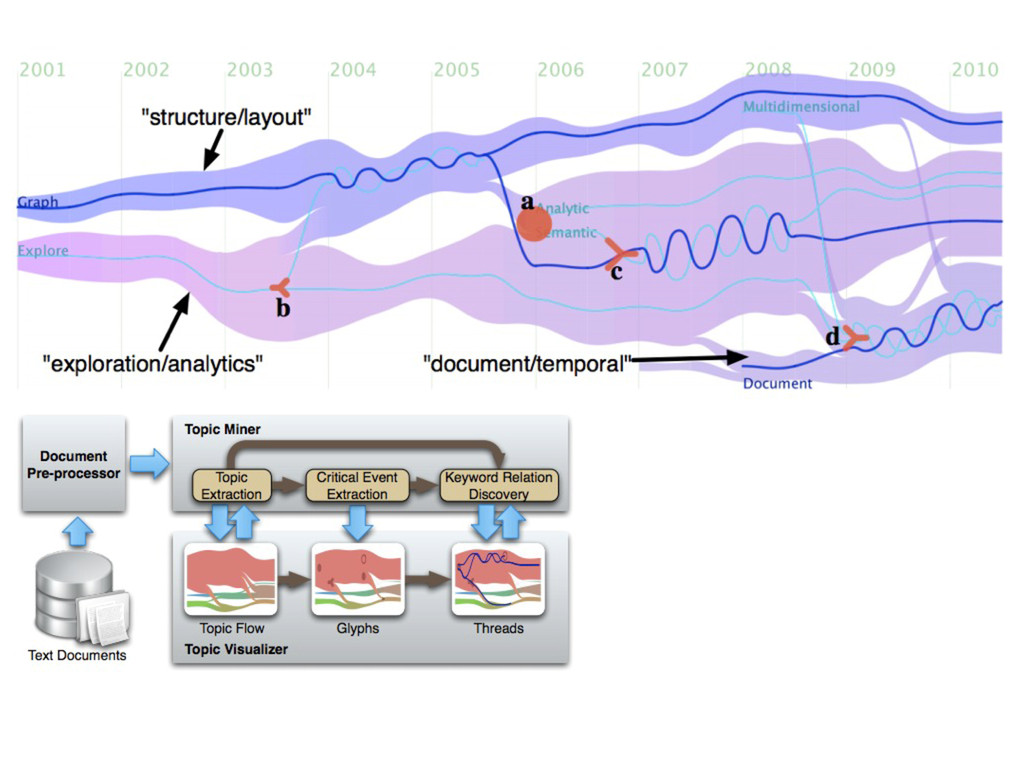
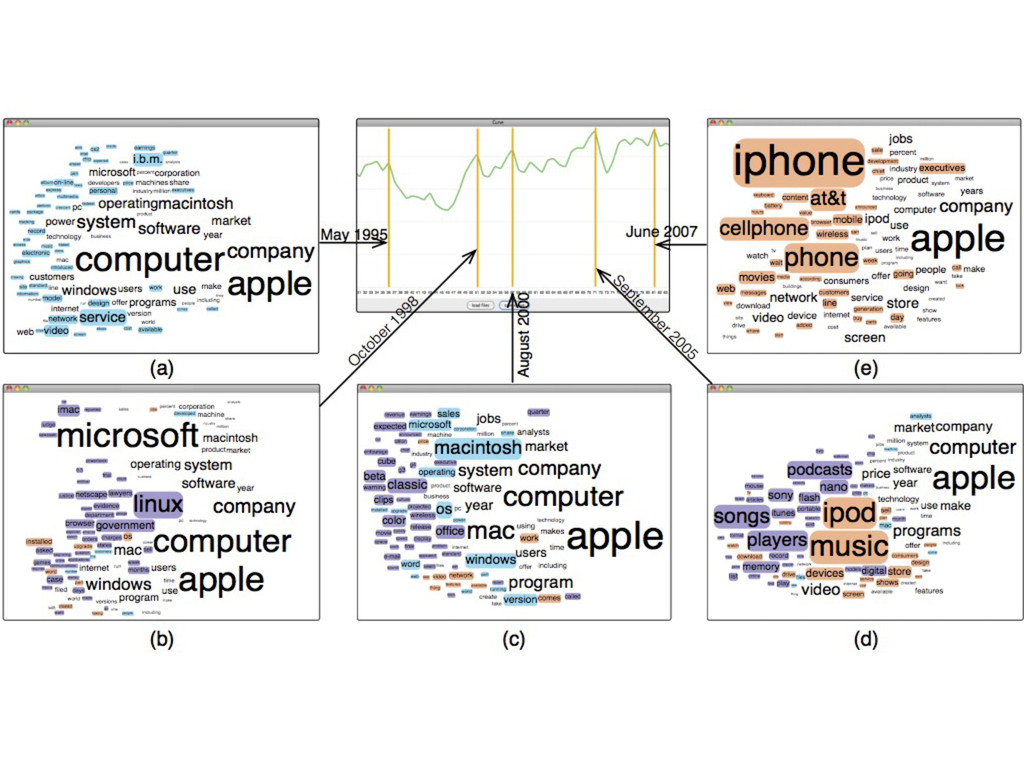
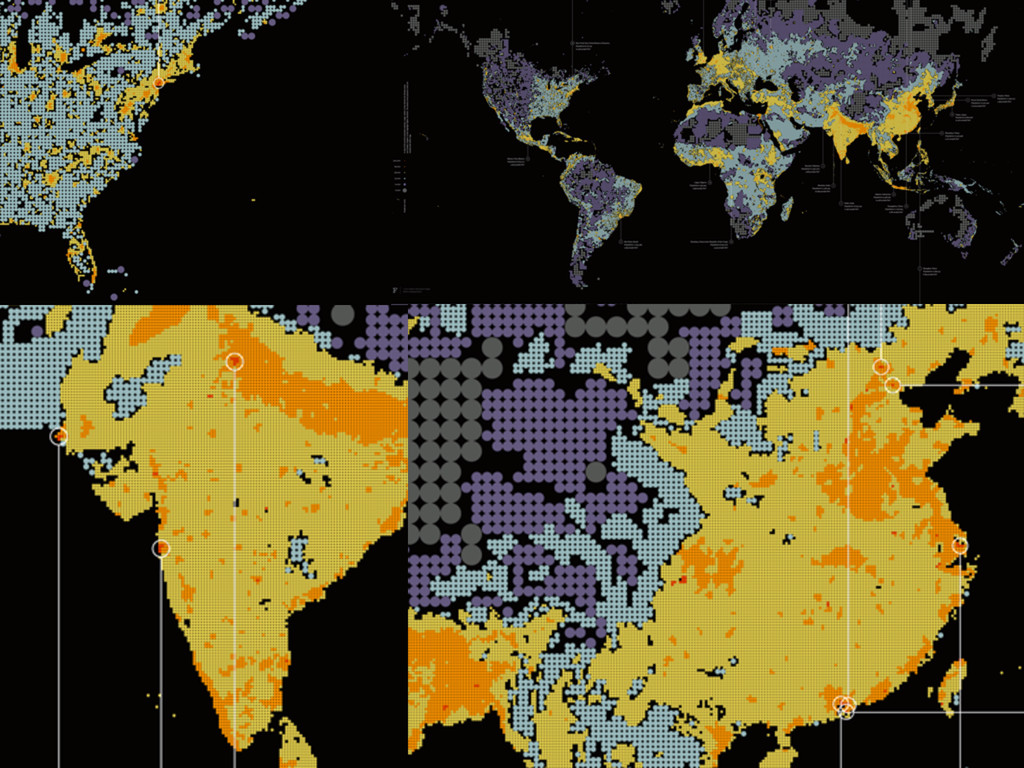
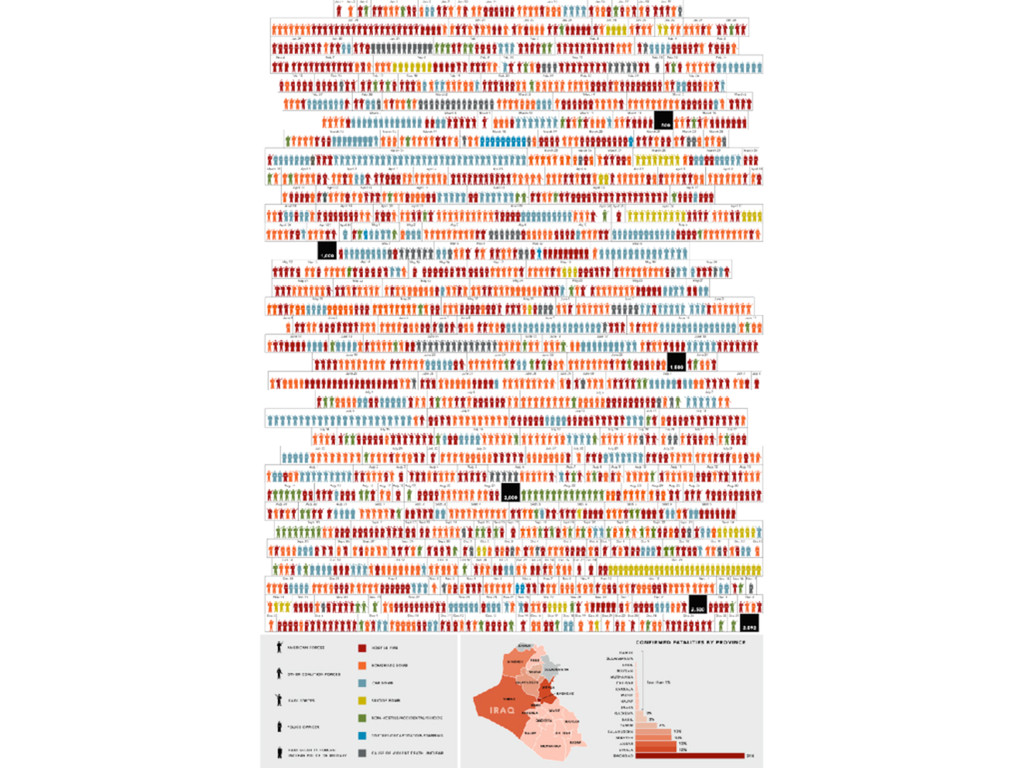
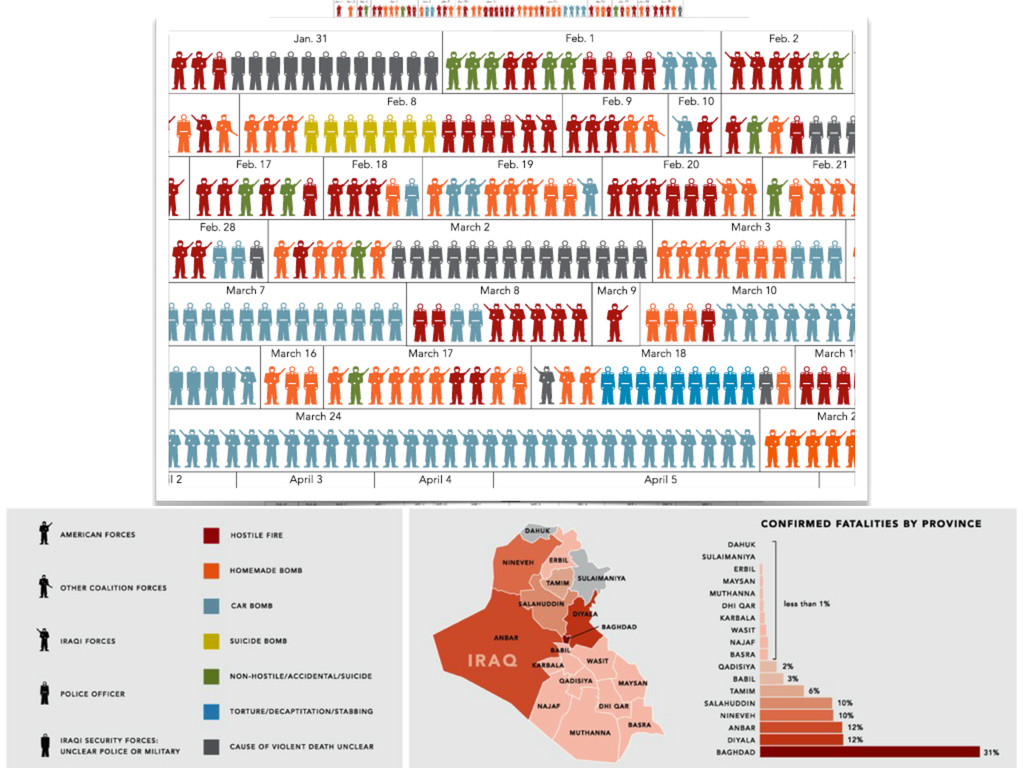
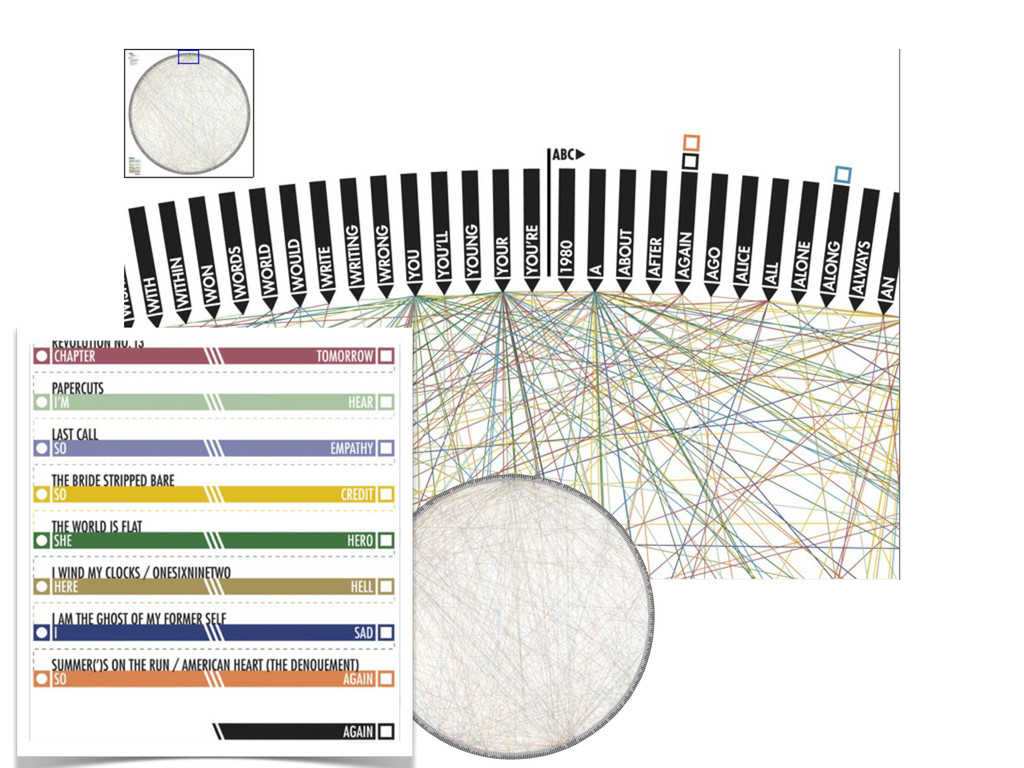
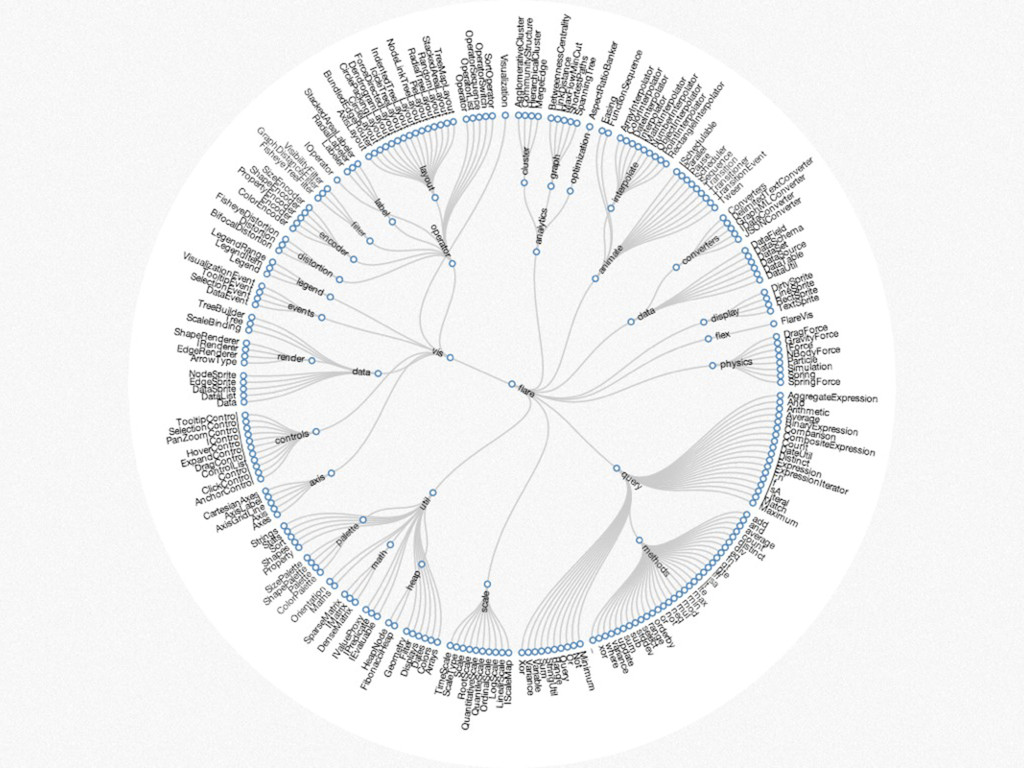
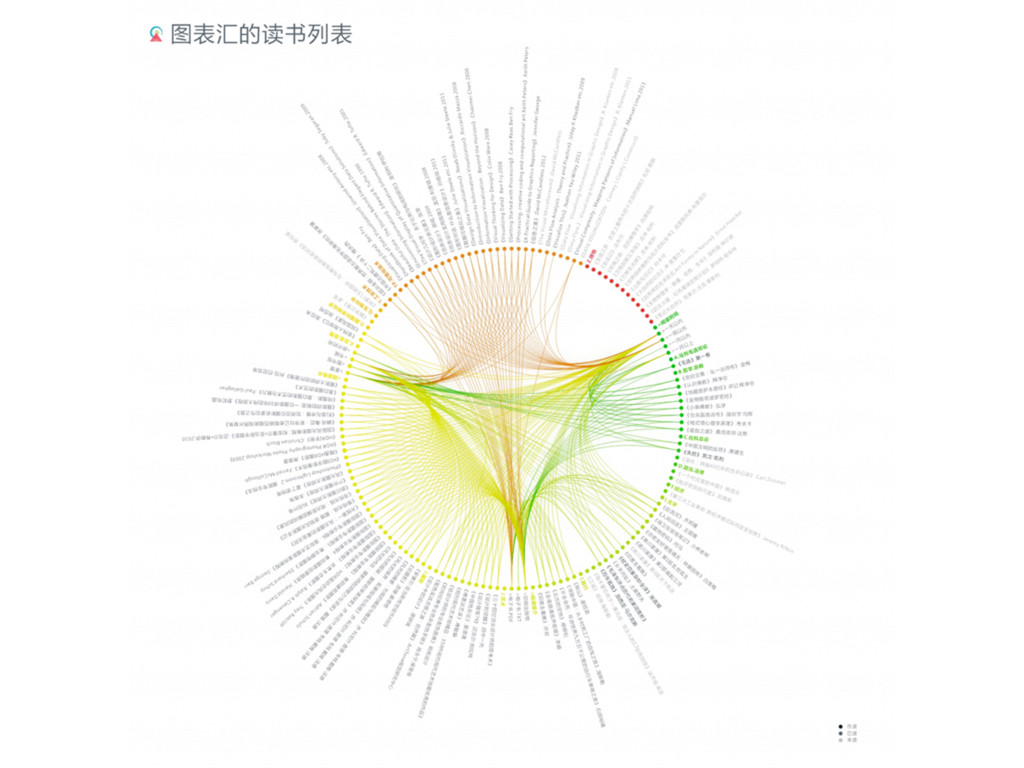
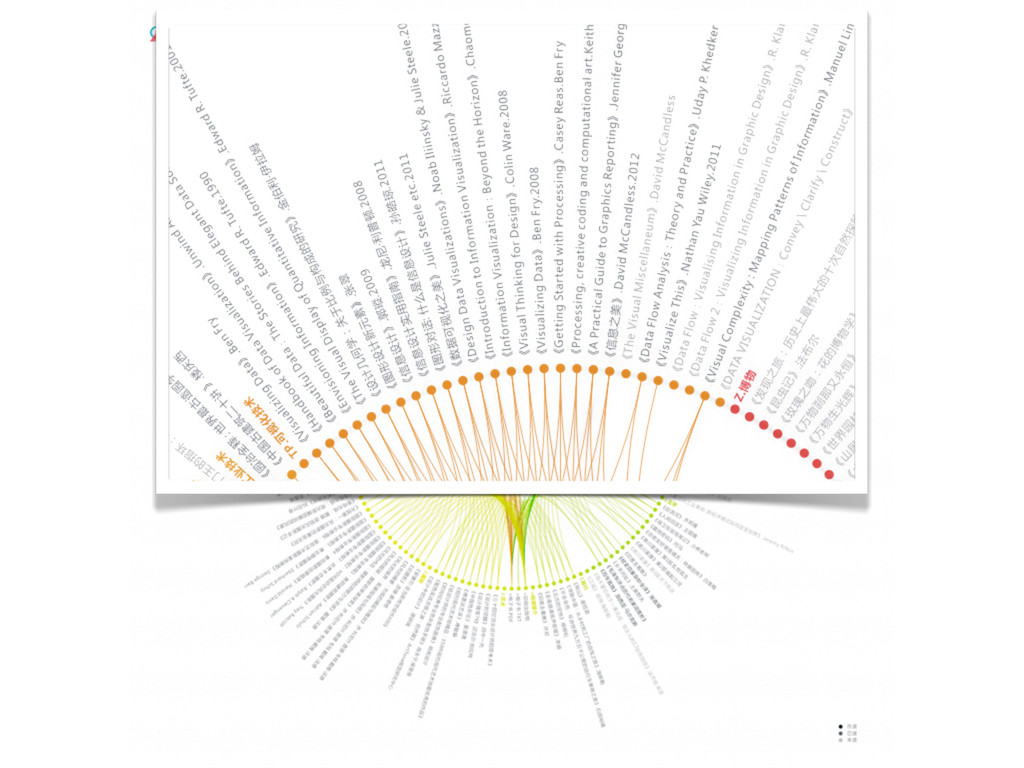
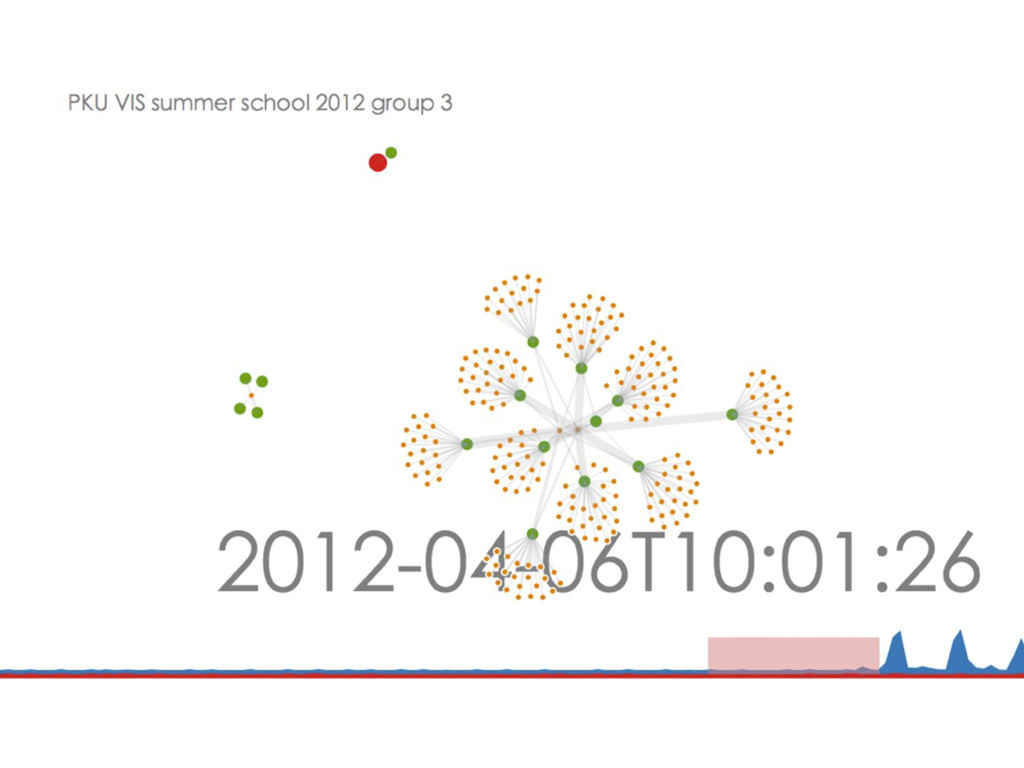
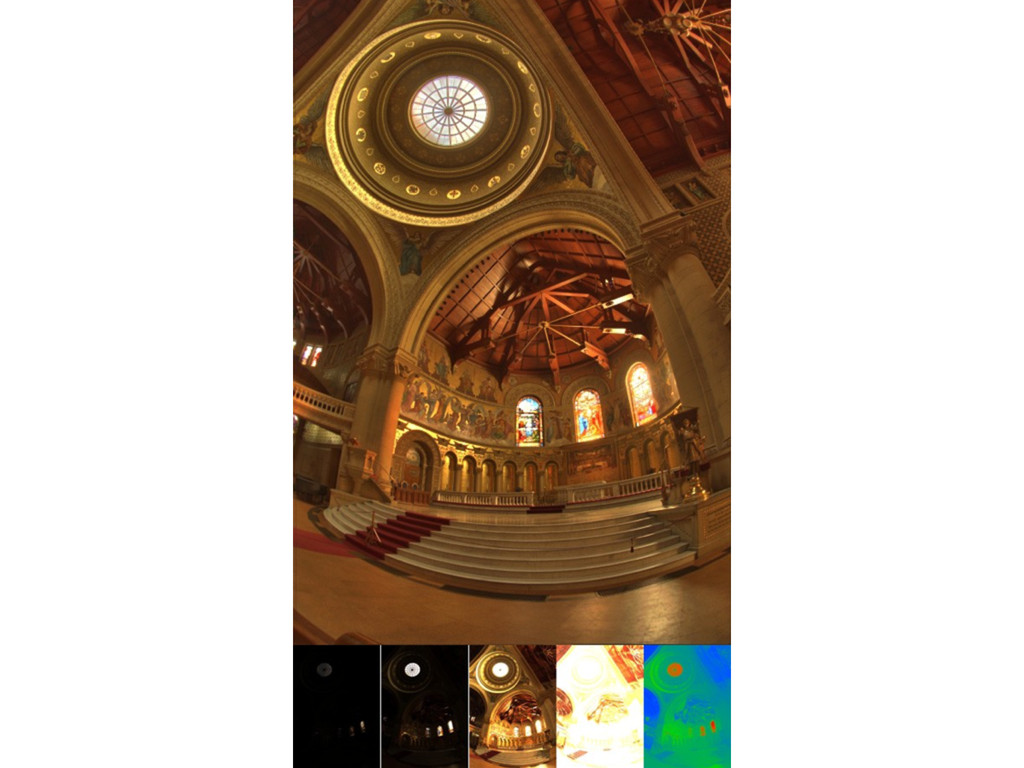
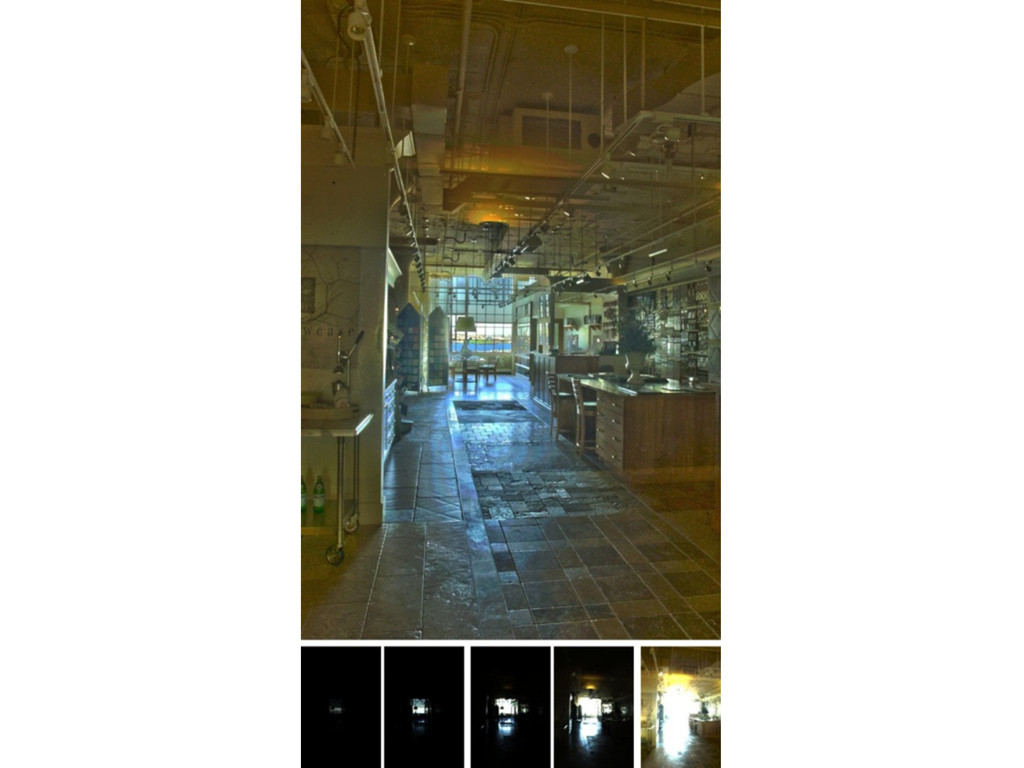
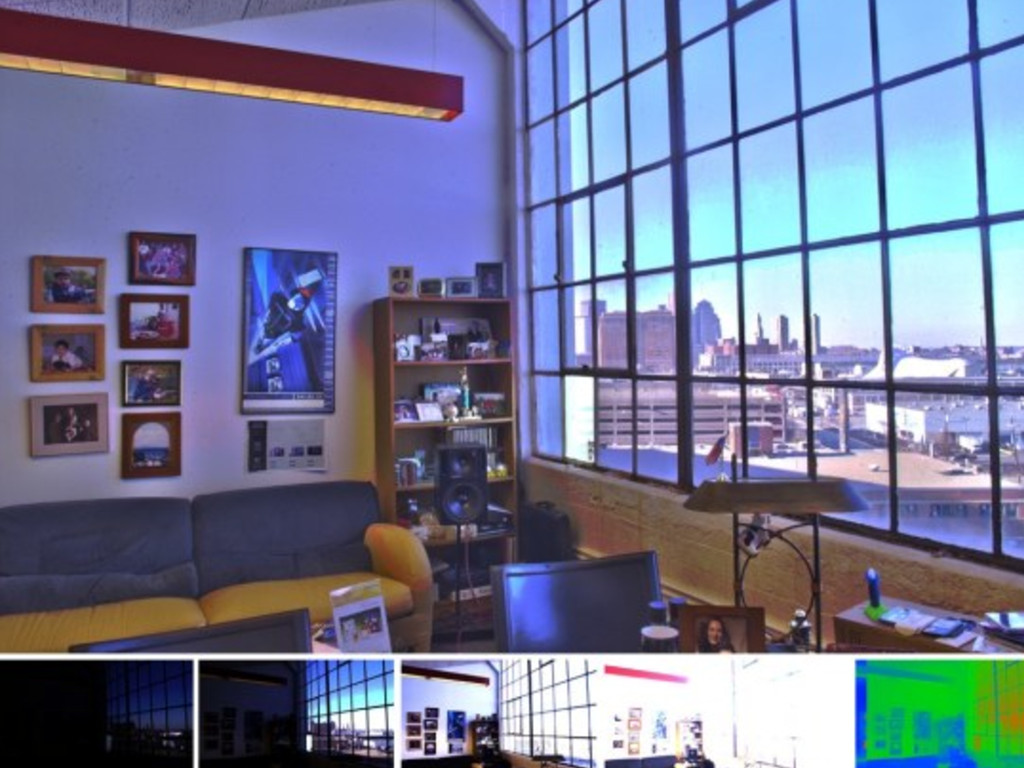
可视化实例
None
None
None
None
None
None
None
None
None
None
None
None
None
None
None
None
None
None
None
None
None
None
None
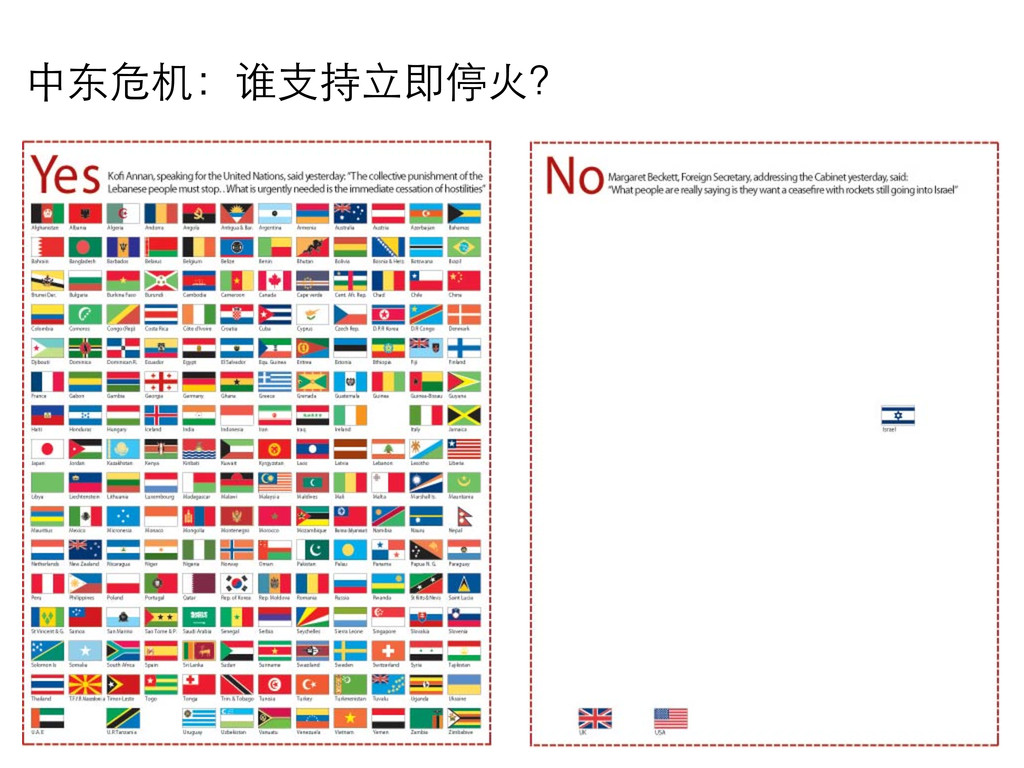
中东危机:谁支持立即停火?
None
None
None
None
None
None
None
None
None
None
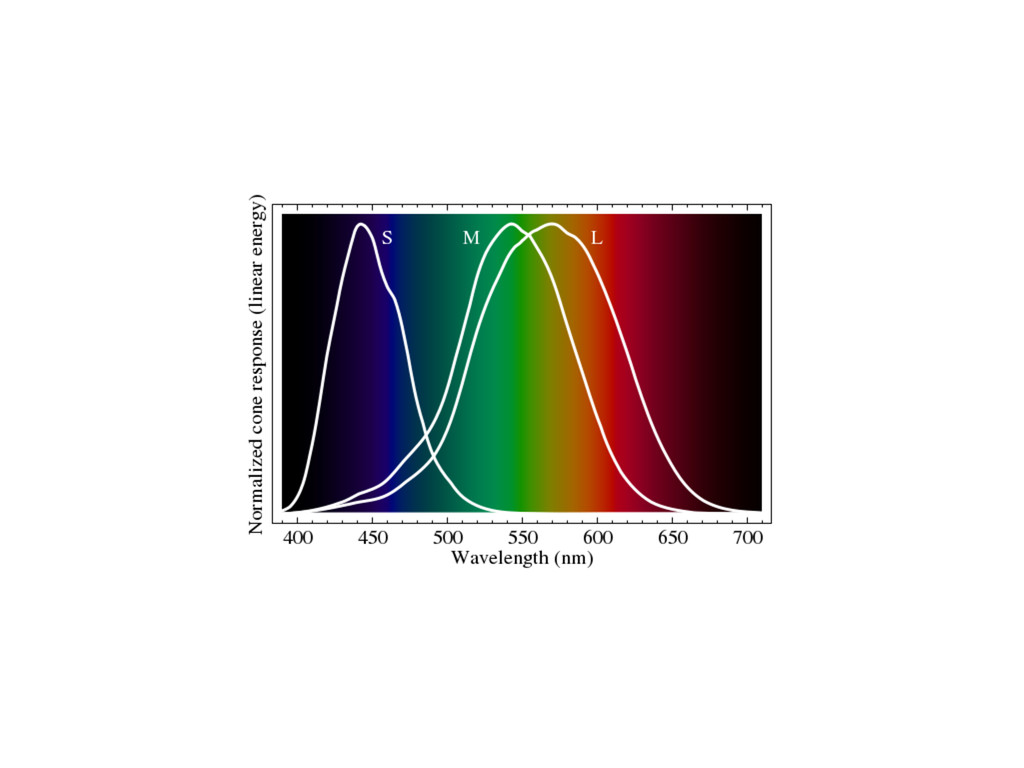
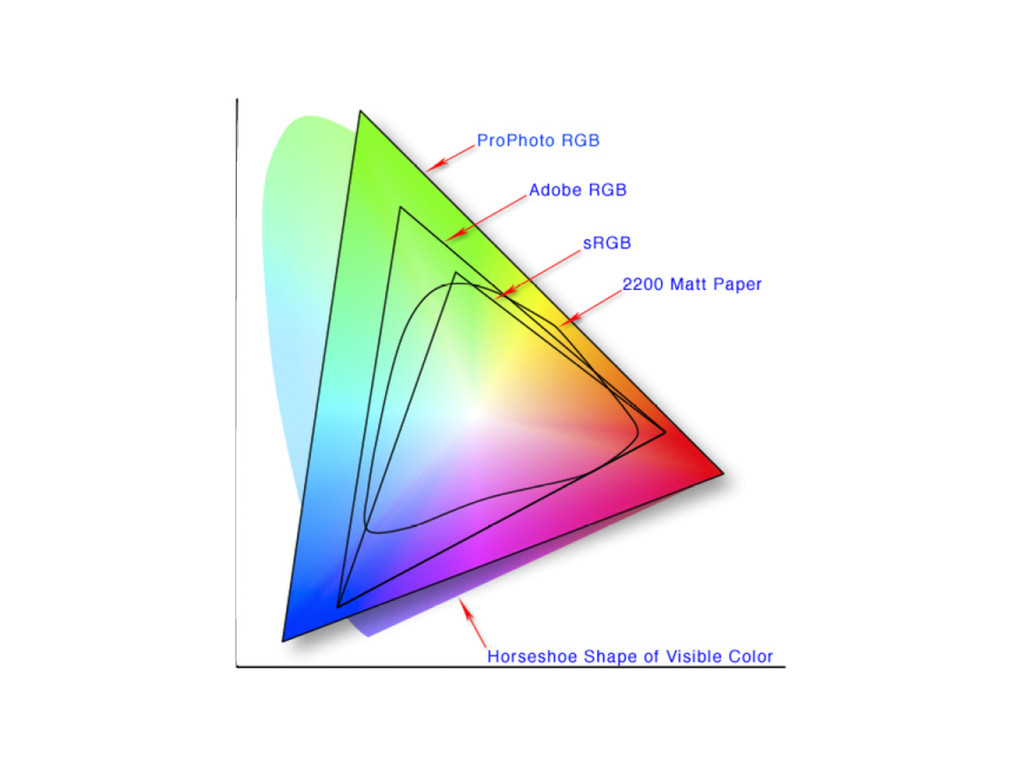
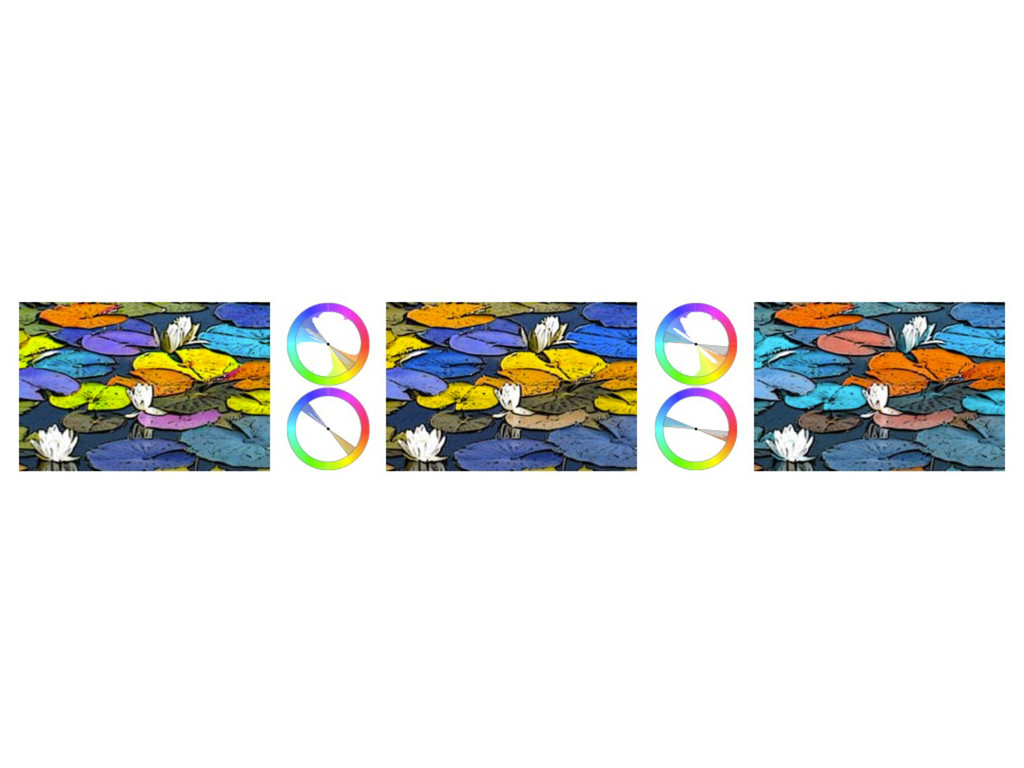
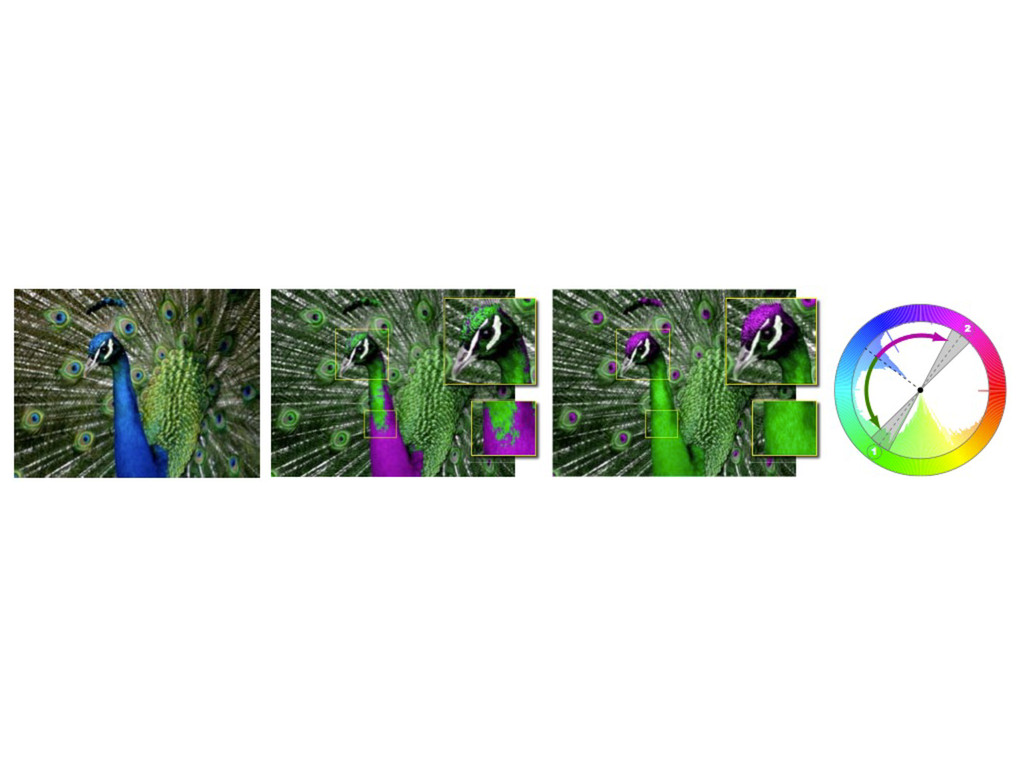
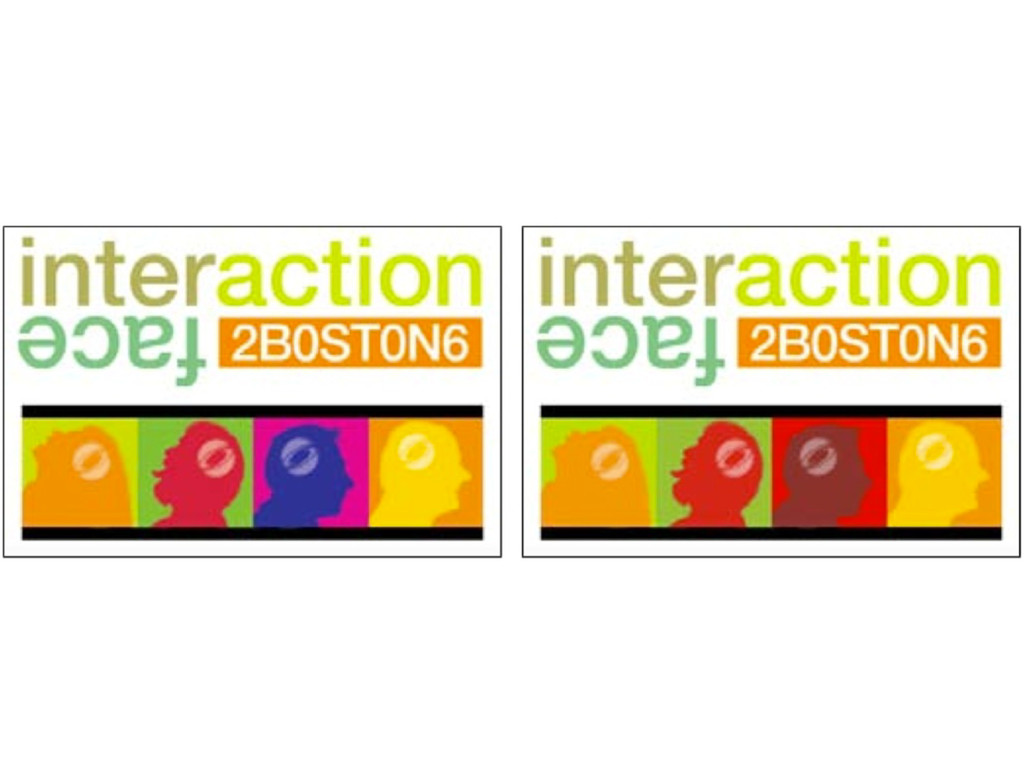
色彩
LOOK AT ME
LOOK AT ME
None
None
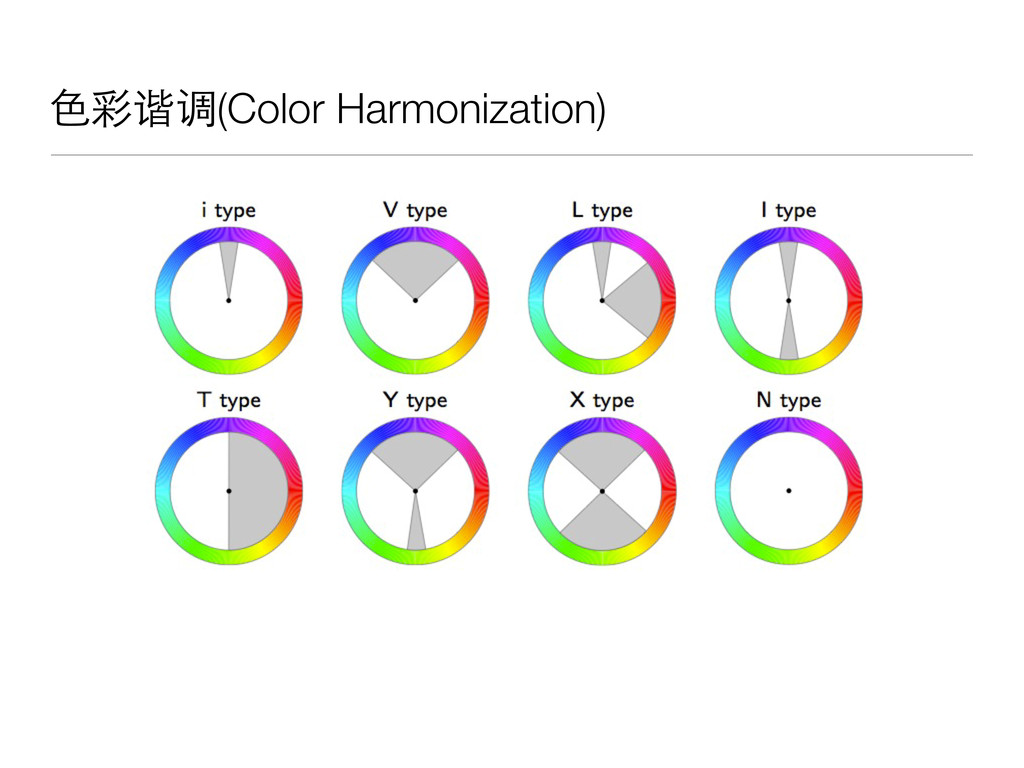
色彩谐调(Color Harmonization)
None
None
None
None
目前工作
None
None
Guokr GapMinder Demo
Thank you!
None
None
None
None
None
None