Upgrade to Pro — share decks privately, control downloads, hide ads and more …

Building a Multi-Tenant Observability Pipeline ...

Building a Multi-Tenant Observability Pipeline with OpenTelemetry

An walkthrough of a multi-tenant observability pipeline using OpenTelemetry, Jaeger, Prometheus, Kafka and Cassandra

Avatar for Joy Bhattacherjee

Joy Bhattacherjee

November 12, 2020
Tweet

More Decks by Joy Bhattacherjee

Other Decks in Technology

Transcript

  1. The Three Pillars, a Taxonomy Logs Metrics Traces Plantext Structured

    Binary RED USE SLI SLO Violation Alerting Playbooks Recovery Tracing Exception Handling Debugging Profiling RCA RCA Audit Anomaly Capacity
  2. Distributed Tracing: Logging + Context • Assign UUID to Each

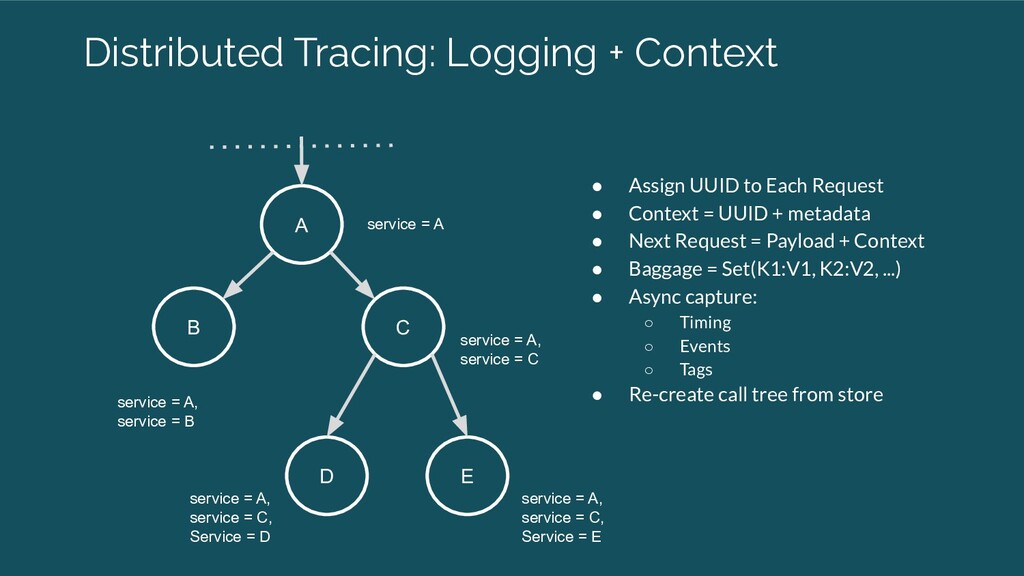
    Request • Context = UUID + metadata • Next Request = Payload + Context • Baggage = Set(K1:V1, K2:V2, ...) • Async capture: ◦ Timing ◦ Events ◦ Tags • Re-create call tree from store A B C D E service = A service = A, service = B service = A, service = C service = A, service = C, Service = D service = A, service = C, Service = E
  3. Why We Chose OpenTelemetry • Three Pillars under one roof

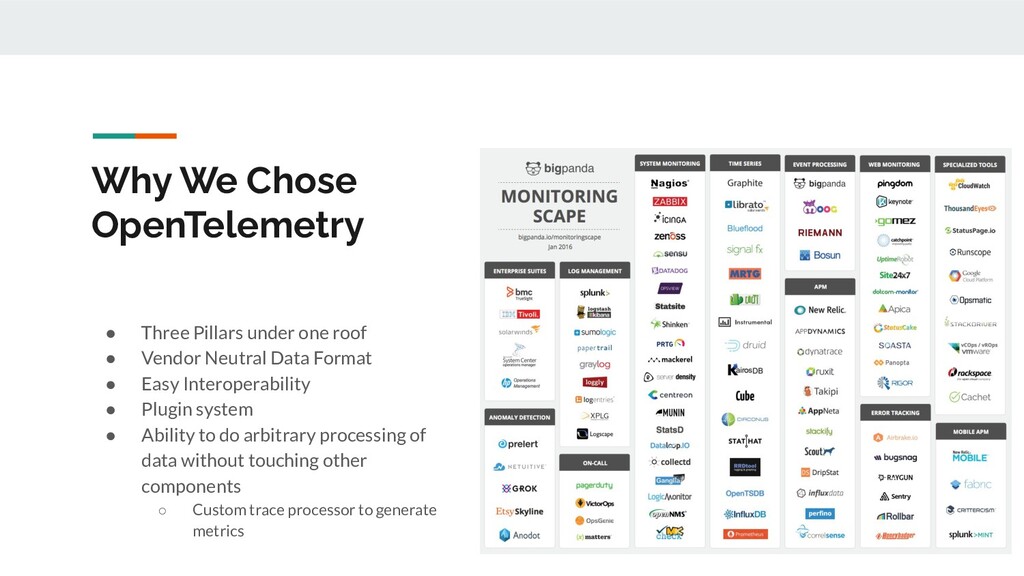
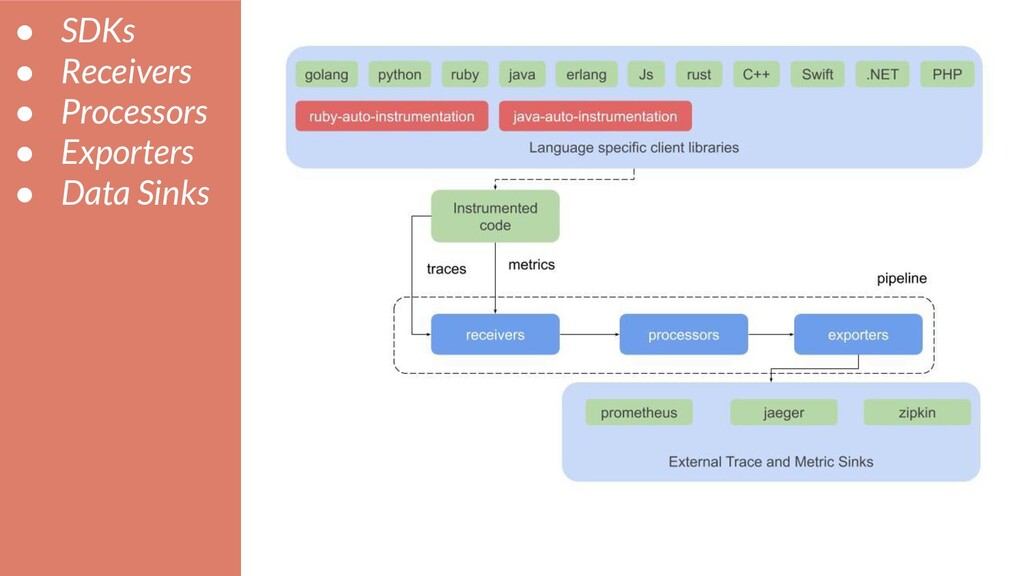
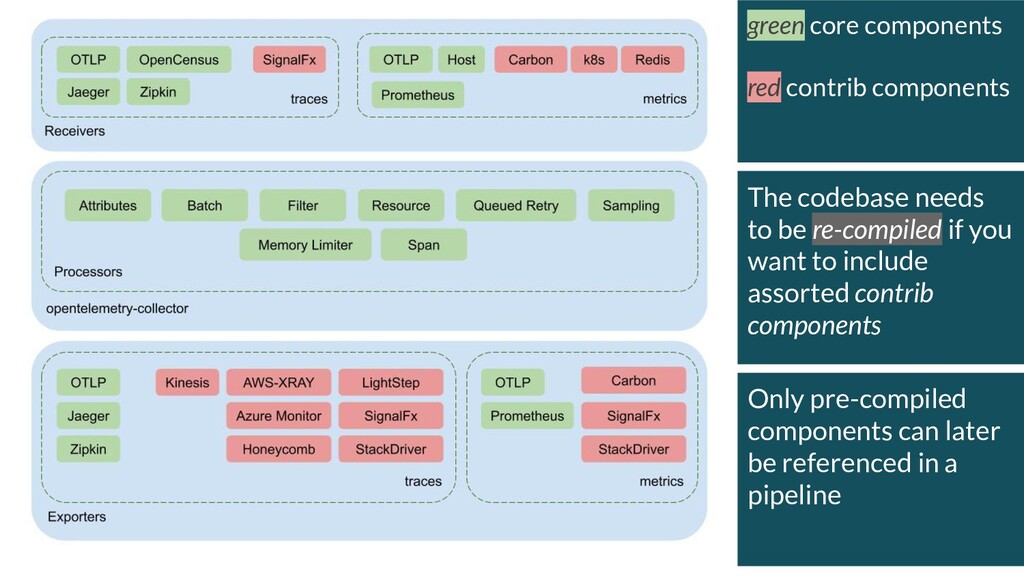
    • Vendor Neutral Data Format • Easy Interoperability • Plugin system • Ability to do arbitrary processing of data without touching other components ◦ Custom trace processor to generate metrics
  4. green core components red contrib components The codebase needs to

    be re-compiled if you want to include assorted contrib components Only pre-compiled components can later be referenced in a pipeline
  5. • Stage 01: ◦ Client Data Emulation: ▪ Load-generator ◦

    Client-side Agent ▪ Otel-agent ◦ Server Side Consumer and Data Transformer ▪ Otel-collector ◦ Server Side Data Sink ▪ We’ll get to this...
  6. Pipeline definition receivers: opencensus: zipkin: endpoint: 0.0.0.0:9411 jaeger: protocols: thrift_http:

    prometheus: config: scrape_configs: - job_name: 'load_generator_app' scrape_interval: 3s static_configs: - targets: ['load-generator:9001'] exporters: opencensus: endpoint: "otel-collector:55678" insecure: true logging: loglevel: debug processors: batch: queued_retry: service: pipelines: traces: receivers: [opencensus, jaeger, zipkin] processors: [batch, queued_retry] exporters: [opencensus, logging] metrics: receivers: [opencensus, prometheus] exporters: [logging,opencensus]
  7. Tail Sampling processors: tail_sampling: decision_wait: 10s num_traces: 100 expected_new_traces_per_sec: 10

    policies: [ { name: sampleNoErrors, type: numeric_attribute, numeric_attribute: {key: status.code, min_value: 0, max_value: 0} }, { name: sample200, type: string_attribute, string_attribute: {key: http.status_code, values: ["200"]} }, { name: ratelimit35, type: rate_limiting, rate_limiting: {spans_per_second: 35} } ]
  8. • Stage 02: ◦ Per tenant data sinks ▪ Metrics

    • Prometheus CR ▪ Traces • Jaeger CR • Streaming mode with kafka ◦ Long Term Storage (common) ▪ Metrics • Cortex ◦ Cassandra ▪ Traces • Jaeger Streaming with Cassandra backend ◦ Unified Data Sink ▪ Cassandra Keyspaces • tenant-N-trace • tenant-N-metrics ▪ Now, we can build a query api layer • Requirements ◦ Prometheus Operator ◦ Jaeger Operator ◦ Kafka Operator ◦ Cassandra ▪ bitnami-cassandra ▪ Scylla-operator ◦ Cortex ▪ Consul
  9. • Kubernetes Namespace Level Multi-tenancy ◦ Each client’s data flows

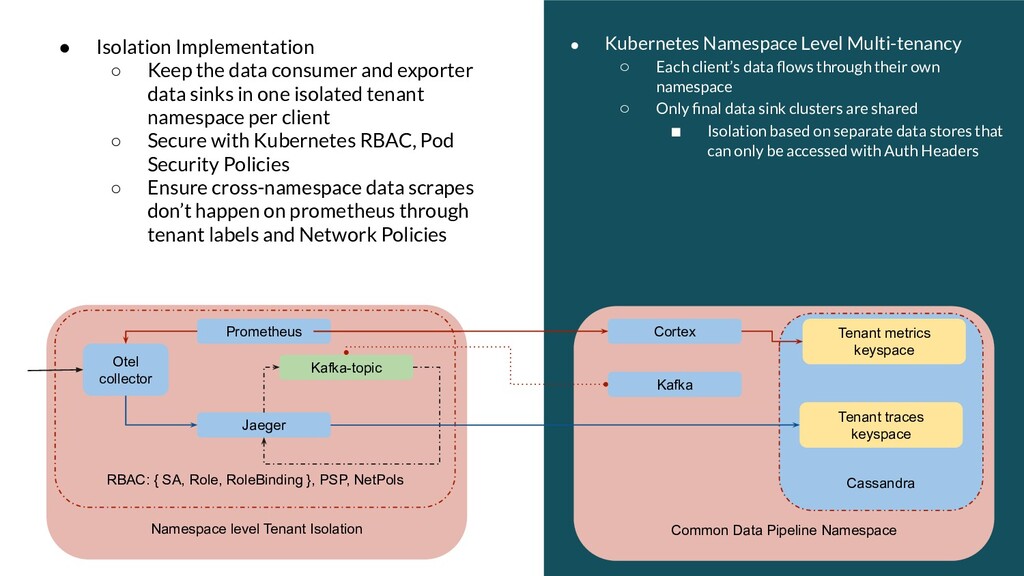
    through their own namespace ◦ Only final data sink clusters are shared ▪ Isolation based on separate data stores that can only be accessed with Auth Headers • Isolation Implementation ◦ Keep the data consumer and exporter data sinks in one isolated tenant namespace per client ◦ Secure with Kubernetes RBAC, Pod Security Policies ◦ Ensure cross-namespace data scrapes don’t happen on prometheus through tenant labels and Network Policies Namespace level Tenant Isolation RBAC: { SA, Role, RoleBinding }, PSP, NetPols Prometheus Otel collector Jaeger Kafka-topic Common Data Pipeline Namespace Cortex Cassandra Tenant metrics keyspace Tenant traces keyspace Kafka
  10. References • https://storage.googleapis.com/pub-tools-public-publicati on-data/pdf/36356.pdf • https://opensource.googleblog.com/2018/01/opencensus .html • https://blog.twitter.com/engineering/en_us/a/2012/distri buted-systems-tracing-with-zipkin.html

    • https://eng.uber.com/distributed-tracing/ • https://medium.com/opentracing/towards-turnkey-distri buted-tracing-5f4297d1736 • https://medium.com/@AloisReitbauer/trace-context-and- the-road-toward-trace-tool-interoperability-d4d5693236 9c • https://medium.com/opentracing/merging-opentracing-and- opencensus-f0fe9c7ca6f0 • https://github.com/open-telemetry/opentelemetry-collec tor • https://github.com/open-telemetry/opentelemetry-specifi cation https://pastebin.com/8dYNk0sR