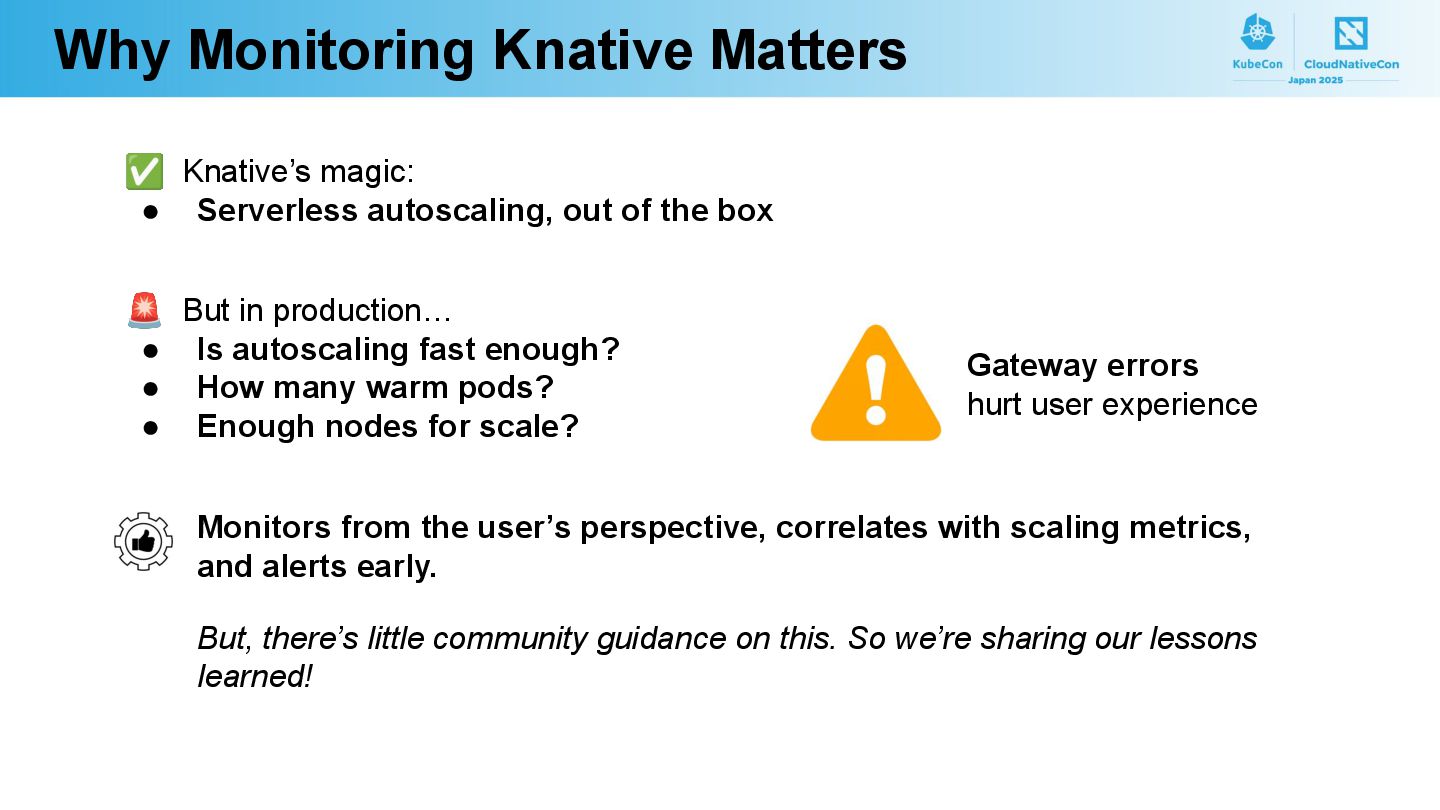
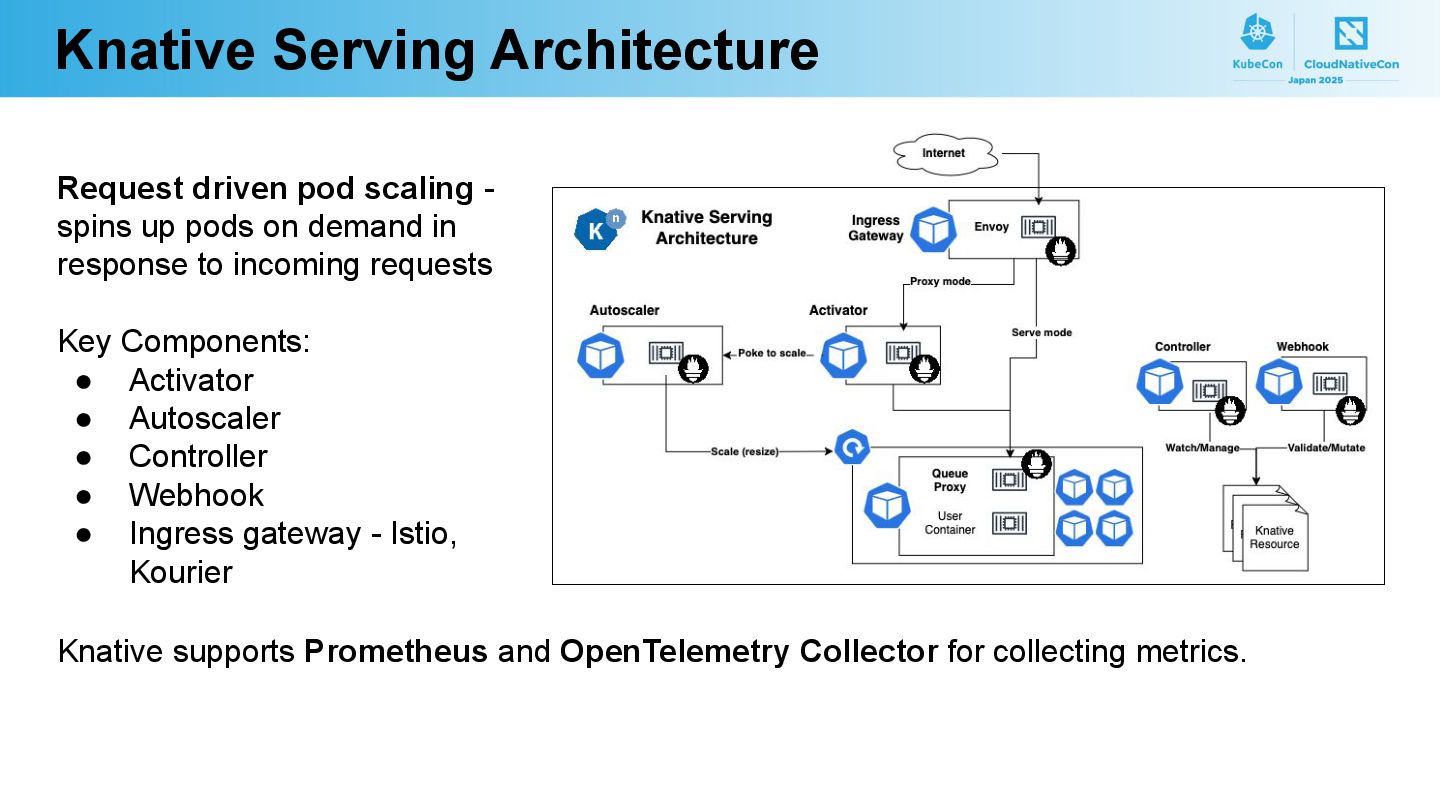
Knative is a widely adopted CNCF-hosted software for running serverless applications using Kubernetes. Knative Serving consists of many system components, such as Activator, Autoscaler, Controller, Webhook, and Istio or Kourier as an ingress gateway. Therefore, end users need to implement monitors for common error patterns and best metrics from many metrics. However, there is relatively little knowledge and resources for Knative end users.
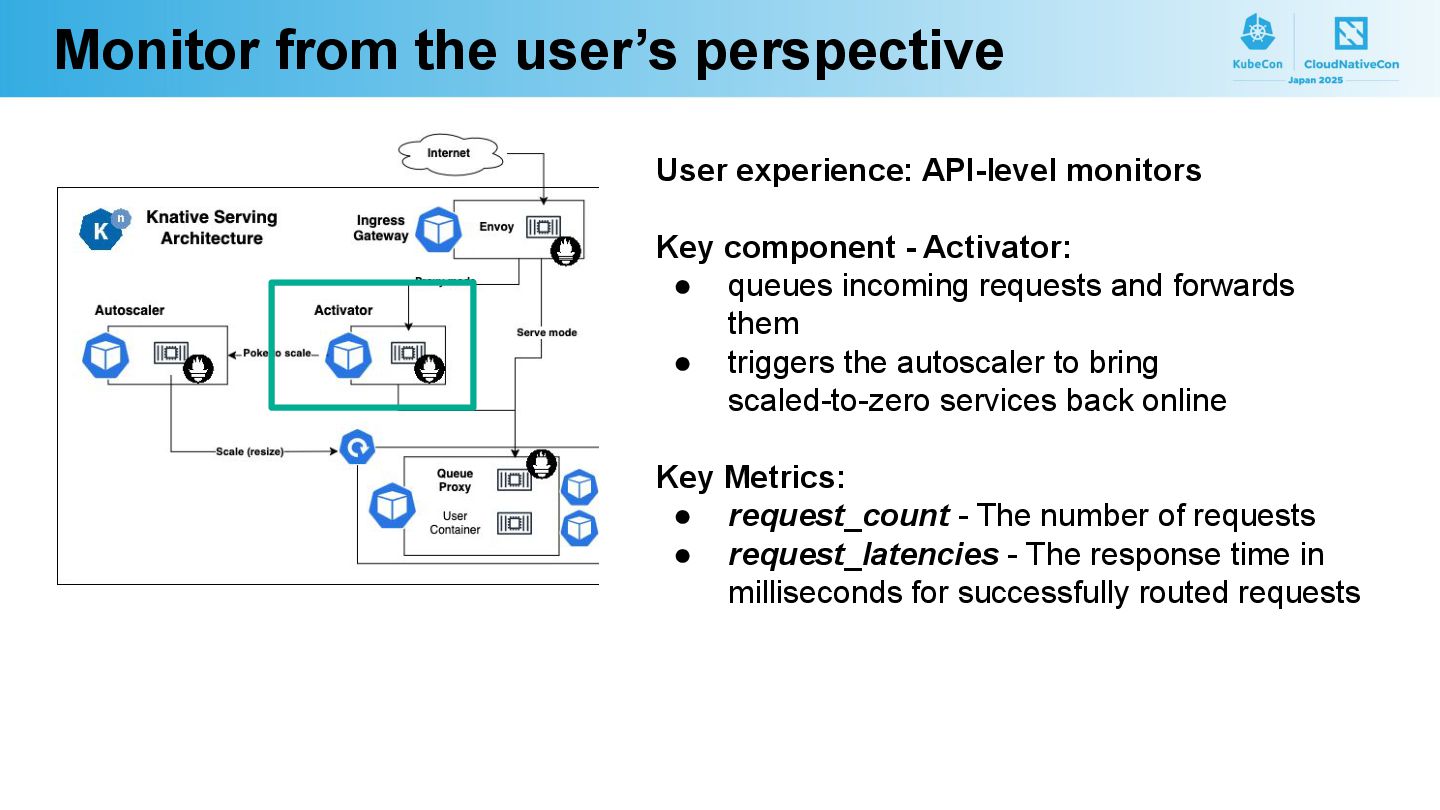
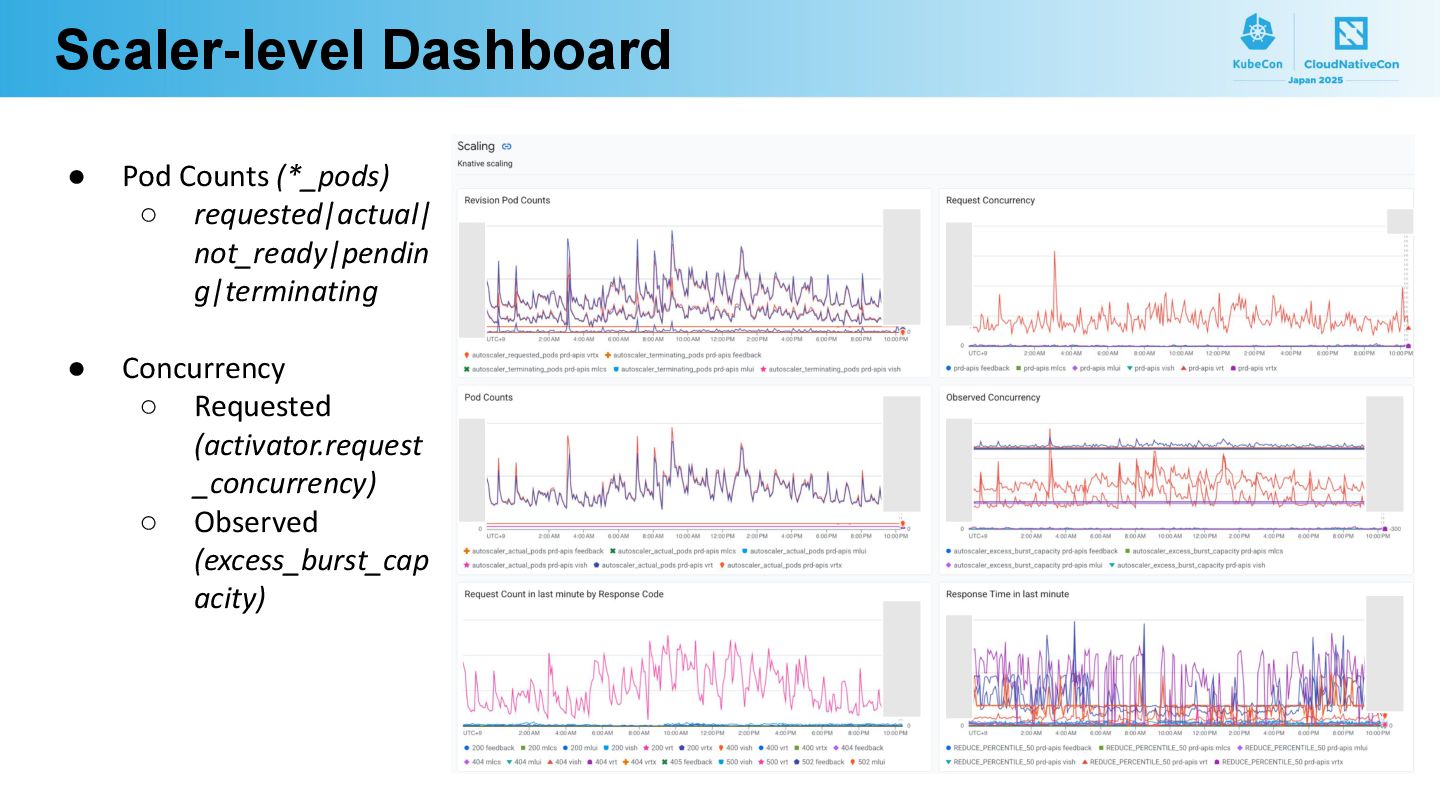
This talk will present a production case study of monitoring for Knative Service. Specifically, it will explain how we can monitor Knative control plane efficiency, reconciliation operations, pod scaling health, concurrency observation, HTTP request success rate, and more.
That includes how Knative components implement Prometheus metrics, metrics pipelines (on Google Kubernetes Engine), dashboards and alerts.
This case study will benefit existing Knative users and potential users considering employing Knative in their Kubernetes clusters.