Upgrade to Pro — share decks privately, control downloads, hide ads and more …

Ruby メモリ管理 プログラミング

Ruby メモリ管理 プログラミング

Yusuke Kawatsu

July 17, 2024
Tweet

More Decks by Yusuke Kawatsu

Other Decks in Programming

Transcript

  1. 2
 © Link and Motivation 株式会社リンクアンドモチベーション エンジニアリングマネージャー 川津 雄介 Yusuke

    Kawatsu • 前職は某複写機メーカーでエンジニアしてた • OSレイヤーからWeb/モバイルまで何でもやる • 開発室全体を横断した生産性向上に注力! https://github.com/megmogmog1965 https://qiita.com/megmogmog1965 https://twitter.com/KawatsuYusuke
  2. コンテンツ 入門的な内容なのであまり深い・難しい内容 までは言及しません。 1. 物理メモリと仮想メモリ (MMU) 2. プロセスの仮想メモリ空間 3. Ruby

    ヒープと Garbage Collector 4. メモリリークする API コード 5. プロファイラ 〜推測するな、計測せよ〜
  3. プロセスのデータは、物理メモリ上に分散している プログラム本体 生成したデータ1 生成したデータ2 プログラム本体 生成したデータ1 生成したデータ2 … … …

    … プロセスの仮想メモリ MMU (Memory Management Unit) 物理メモリ 仮想 物理 00h AAh XXh BBh YYh CCh 00h XXh YYh AAh BBh CCh プロセスからはすべて地続き のメモリに見えている 実際には 物理メモリ上に点在
  4. Ruby, Python インタプリタから見るとこう スタック領域 ヒープ領域 テキスト領域 00h 静的領域 プログラム (.exe)

    生成したオブジェクトの置き場 ローカル変数、関数の引数 変数参照だけで、 オブジェクト実体は ヒープ領域にある
  5. テキスト領域 スタック領域 ヒープ領域 テキスト領域 00h 静的領域 #include <stdio.h> int add(int

    x, int y) { return x + y; } int main(int argc, char *argv[]) { int a = 1; int b = 2; int result = add(a, b); } 1⃣命令をロード 2⃣命令を実行 3⃣プログラム カウンタを進める ※実際にはコンパイル済みのアセンブラコードが実行されます CPU
  6. ヒープ領域 msg = "hello" ※システムコール呼び出し String オブジェクト char 配列と RVALUE

    構造体 確保したヒープ領域 (メモリマップ) Ruby コード インタプリタ (C言語コード) OS (Unix 系) 命令文 実行母体 生成物 要求メモリサイズ = 文字列サイズ + Ruby オブジェクト構造体サイズ ptr = malloc(SIZE); strcpy(ptr, "hello"); struct RString *str; NEWOBJ(str, struct RString..); MEMCPY(str->as.heap.ptr..);
  7. スタック領域 #include <stdio.h> int add(int x, int y) { return

    x + y; } int main(int argc, char *argv[]) { int a = 1; int b = 2; int result = add(a, b); } 右部のサンプルコード (C言語) で、プログラムの実行時に ス タック領域がどの様に利用されるかを説明します。 main() 関数の呼び出し 1. ローカル変数 a = 1, b = 2, result = ? をスタックに積む add() 関数の呼び出し 1. 引数 x = 1, y = 2 をスタックに積む 2. 関数 add() の処理終了後に戻って来る先アドレスをスタックに積む 3. 関数 add() のプログラム上のアドレス (※テキスト領域) に飛ぶ add() から main() に戻ってくる 1. 戻り値である x + y 演算の結果を eax レジスタに格納する 2. 呼び出し元の main() 関数コード行に戻る a. 前手順で戻り先アドレスはスタックに積まれている 3. eax レジスタに格納された関数の戻り値をローカル変数 result に セット
  8. Ruby インタプリタのヒープメモリと OS ヒープ領域 スタック領域 ヒープ領域 テキスト領域 00h 静的領域 インタプリタ

    (実行ファイル) Rubyスクリプト Ruby ヒープ (eden & tomb) C 配列 (文字列, binary) OSヒープ領域の一部が Ruby 言語のヒープメモリ
  9. 一般的な Garbage Collection Array<String> オブジェクト String “A” オブジェクト String “B”

    オブジェクト String “C” オブジェクト ローカル変数 参照 メンバ変数 参照 メソッド `func` の実行が終わると ローカル変数参照はなくなる ローカル変数参照がなくなるとGC の対象に。 GC で全ての String へのメンバ参照はなくなる どこからも変数参照がされなく なるので、GC対象になる $global = 'C' # ローカル変数スコープ def func array = ['A', 'B', $global] puts array end # function call. func グローバル 参照 こいつだけは 消えない
  10. Ruby の Garbage Collection Ruby Heap Eden Tomb Allocated Heap

    Memory (OS) 空になったページ 再利用 メモリ確保 メモリ開放 Heap Page Slots: *Empty String オブジェクト Array オブジェクト XXX オブジェクト 40 Bytes 削除フラグだが メモリはまだある ・ ・ ・ 40 Bytes 40 Bytes 40 Bytes
  11. 1⃣ メモリリークの代表例 昔からあるあるは「グローバル変数」のケースですが、昨今 Web フレームワークが発達し てからは、こういった過ちは起きづらくなりました。 $array = [] class

    GlobalVarController < App… def index $array << Random.rand() p $array end end class ClassVarController < App… @@array = [] def index @@array << Random.rand() p $array end end グローバル変数 クラス変数 HTTP リクエストの度に 開放されないメモリが増える 永久に 消えない参照
  12. 2⃣ リークではないが... API や、長時間にわたる非同期ワーカー処理など、実際起きやすいのはこちら。 def maleAverageAge() # 処理中に徐々に開放不可メモリが増加し、最終的には 100000 レコードのデータがメモリに乗る。

    users = getAllUsers() # 男性の平均年齢を算出 . # (クエリでやれ!というツッコミはなしで ...) ages = users.select { |u| u.gender == "male" }.map { |u| u.age } ages.sum / ages.size end # offset/limit でデータベースから全ユーザーを取ってくるメソッド . def getAllUsers() all = 100000 limit = 100 (0...(all/limit)).flat_map { |i| getUsers(i * limit, limit) } end # データベースの `Users` テーブルへのアクセスを模倣した関数 . def getUsers(offset, limit) # name, age, height, weight, gender. (0...limit).map { |_| {name: "Taro", age: 28, h: 165, w: 58, gender: "male"} } end 時間 メモリ(件数) 100,000件 時間とともに 線形増加する
  13. # Chunk の時点で演算し、結果だけを返すようにする . def maleAverageAge() all = 100000 limit

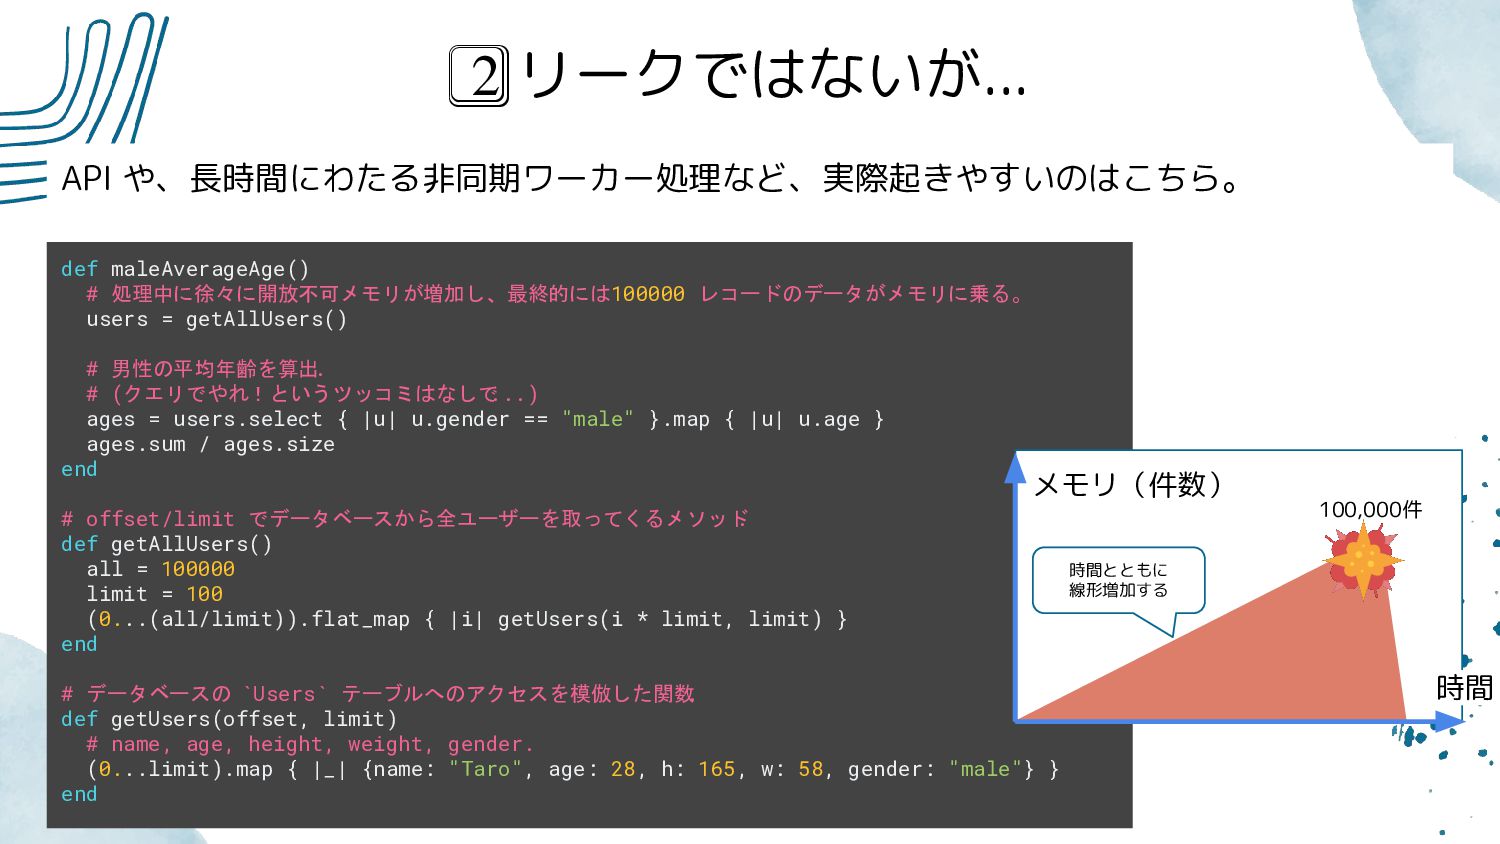
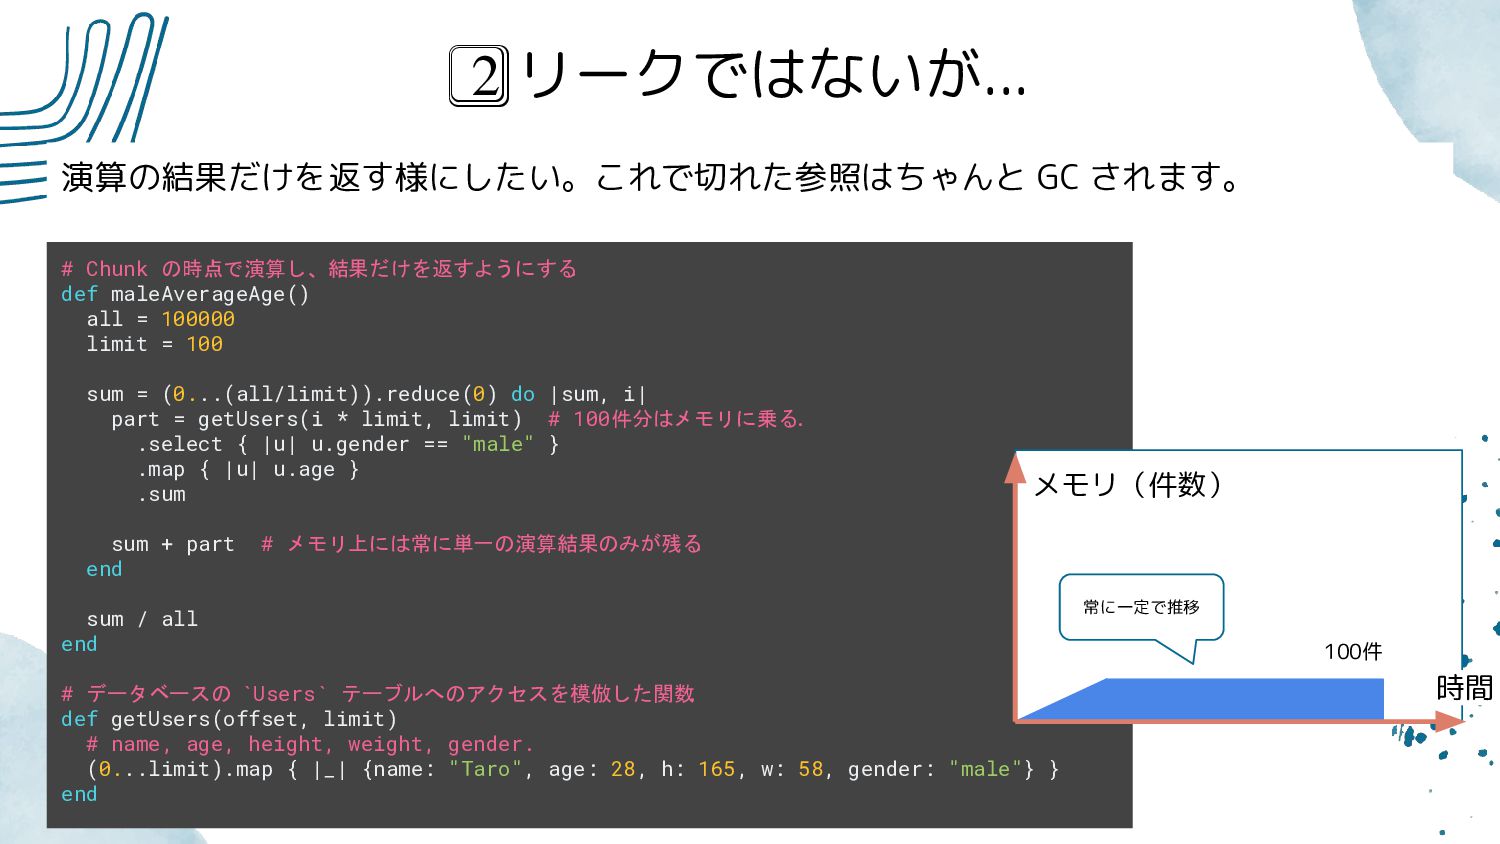
    = 100 sum = (0...(all/limit)).reduce(0) do |sum, i| part = getUsers(i * limit, limit) # 100件分はメモリに乗る . .select { |u| u.gender == "male" } .map { |u| u.age } .sum sum + part # メモリ上には常に単一の演算結果のみが残る . end sum / all end # データベースの `Users` テーブルへのアクセスを模倣した関数 . def getUsers(offset, limit) # name, age, height, weight, gender. (0...limit).map { |_| {name: "Taro", age: 28, h: 165, w: 58, gender: "male"} } end 2⃣ リークではないが... 演算の結果だけを返す様にしたい。これで切れた参照はちゃんと GC されます。 時間 メモリ(件数) 100件 常に一定で推移
  14. # 本番にいれると性能劣化するので、 # 通常は profile 等で適用対象を制限すること . gem "memory_profiler" gem

    "ruby-prof" Ruby メモリ・プロファイラ ここからは実際にメモリの増加(GC されないオブジェクト)が発生した際に、どうやって 追うのか? 次の2つの gem を使って説明します。 Gemfile :
  15. gem "memory_profiler" class HelloController < ApplicationController def index # start

    profiling. MemoryProfiler.start # call funcs. res1 = light res2 = heavy res3 = heavy_without_leak # end profiling. MemoryProfiler.stop.pretty_print(to_file: "./report.txt") end private def light (0...1000).map { |_| Object.new } end def heavy (0...10000).map { |_| Object.new } end def heavy_without_leak (0...10000).each { |_| Object.new } end end 計測開始 計測終了 1,000 Objects の参照保持 10,000 Objects の参照保持 10,000 Objects 生成 するが保持はしない この試行では、次の3メソッドを呼び出して "memory_profiler" で計測します。 1. light() : 1,000 Object の参照保持 2. heavy() : 10,000 Object の参照保持 3. heavy_without_leak() : 参照保持しない #1, 2 のメソッドで生成された Object は GC で 解放できないことが期待値です。 一方 #3 は解放されることを期待しています。
  16. gem "memory_profiler" Total allocated: 941552 bytes (21002 objects) Total retained:

    541552 bytes (11002 objects) allocated memory by location ----------------------------------- 489712 /Users/me/src/hello_app/app/controllers/hello_controller.rb:21 400000 /Users/me/src/hello_app/app/controllers/hello_controller.rb:25 51840 /Users/me/src/hello_app/app/controllers/hello_controller.rb:17 retained memory by location ----------------------------------- 489712 /Users/me/src/hello_app/app/controllers/hello_controller.rb:21 51840 /Users/me/src/hello_app/app/controllers/hello_controller.rb:17 以下は "memory_profiler" のレポート結果です。 • allocated はメモリ確保された総量です。 • retained は未だ参照が保持されている量を示します。 .rb:25 は、参照を保持しない heavy_without_leak() 呼び出し
  17. gem "ruby-prof" class HelloController < ApplicationController def index # start

    profiling. RubyProf.measure_mode = RubyProf::MEMORY RubyProf.start # call funcs. res1 = light res2 = heavy res3 = heavy_without_leak # end profiling. result = RubyProf.stop File.open("./graph.html", "w") do |f| RubyProf::GraphHtmlPrinter.new(result).print(f) end end private def light (0...1000).map { |_| Object.new } end def heavy (0...10000).map { |_| Object.new } end def heavy_without_leak (0...10000).each { |_| Object.new } end end 前述の "memory_profiler" だけでは、メ ソッド呼び出しの前後関係 (stacktrace) が分かりづらかったりします。 "ruby-prof" を使うと、メモリを多く消費 しているメソッドの親子関係を可視化でき ます。 計測開始 計測終了