Upgrade to Pro — share decks privately, control downloads, hide ads and more …

Breaking down the Pillars of Observability: From data to outcomes

Prathamesh Sonpatki
October 26, 2023
20

Breaking down the Pillars of Observability: From data to outcomes

Prathamesh Sonpatki

October 26, 2023
Tweet

Transcript

  1. 2

  2. 5

  3. Why this matters today? • Workloads have changed • Infra

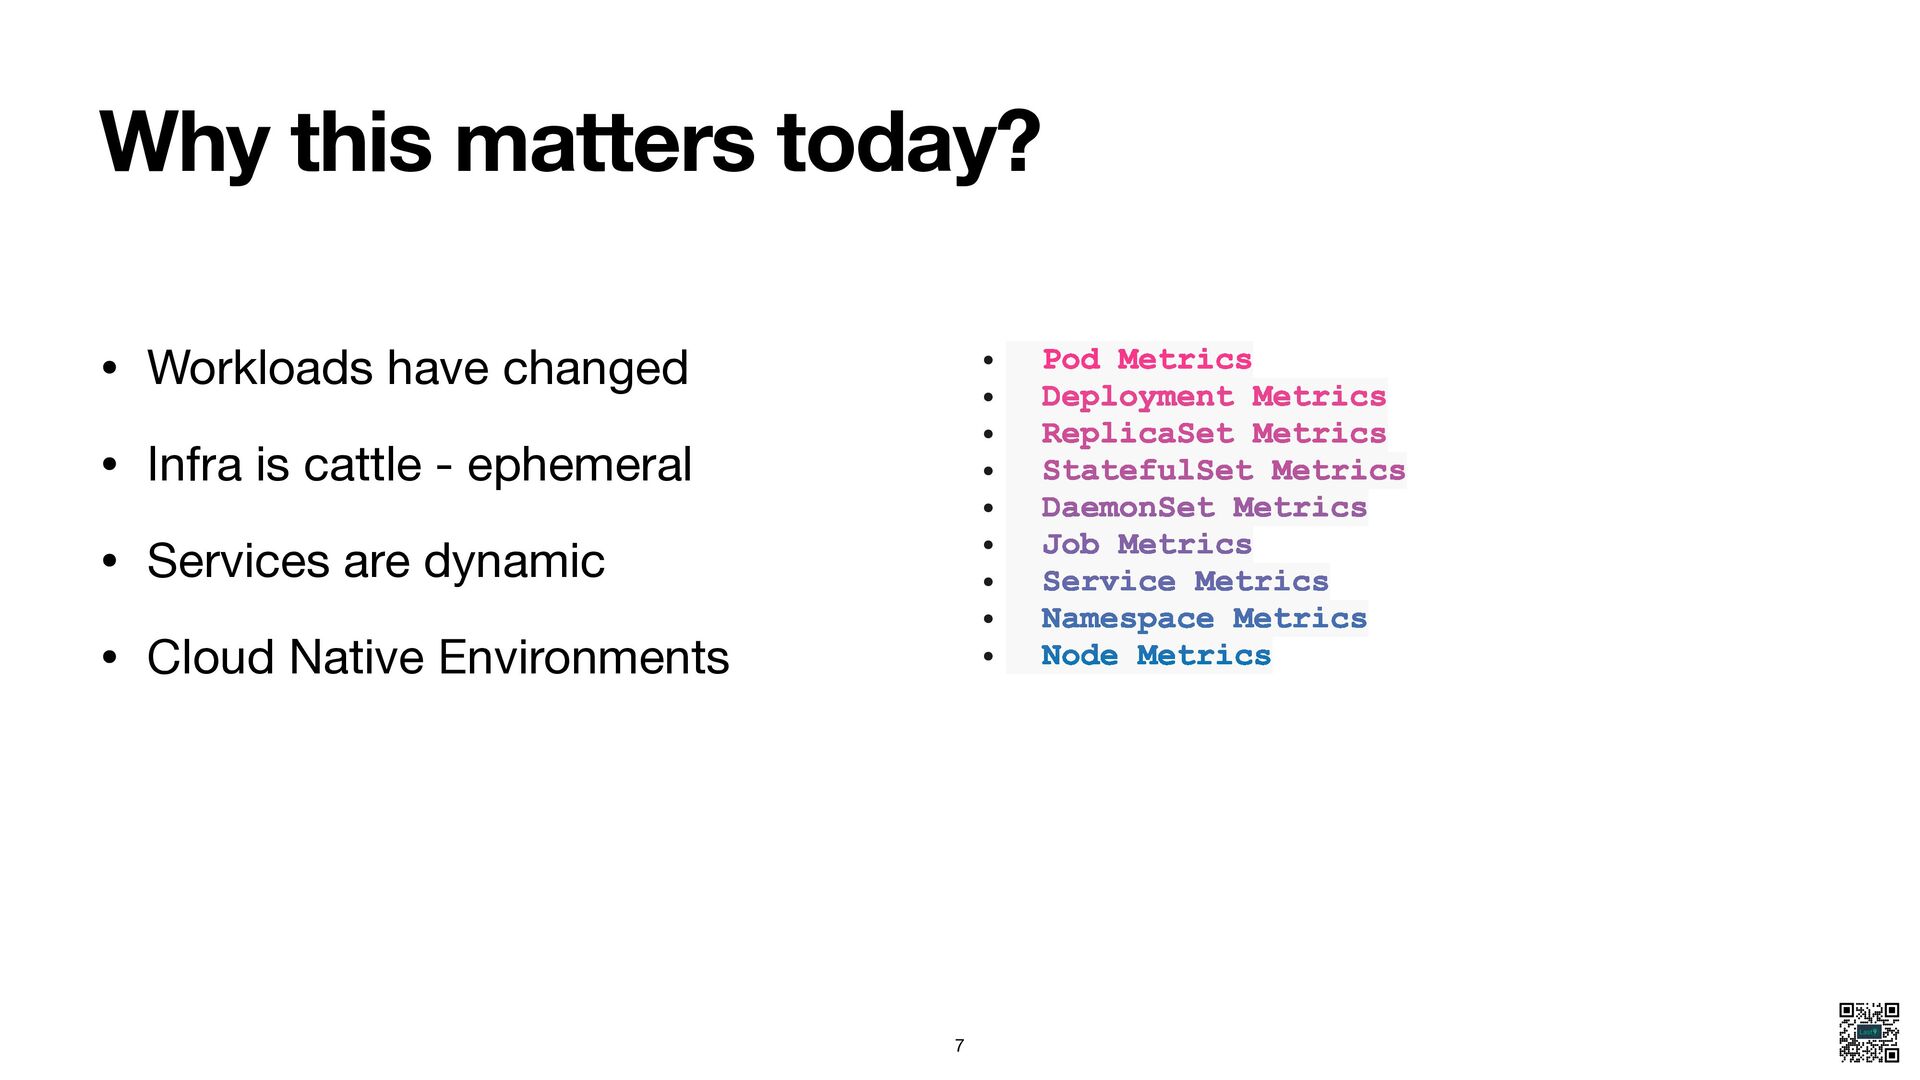
    is cattle - ephemeral • Services are dynamic • Cloud Native Environments A 3 node cluster running 10 namespaces with 5 deployments with a replica set of ~3-5 with 10 config maps emits whooping 16566 time series per minute using the popular kube-state-metrics library 6
  4. Why this matters today? • Workloads have changed • Infra

    is cattle - ephemeral • Services are dynamic • Cloud Native Environments • Pod Metrics • Deployment Metrics • ReplicaSet Metrics • StatefulSet Metrics • DaemonSet Metrics • Job Metrics • Service Metrics • Namespace Metrics • Node Metrics 7
  5. Why this matters today? • Volume • Velocity • Variety

    • Complexity •C.O.S.T. - Cardinality - Operations - Scale - Toil 9
  6. 10

  7. Outcomes we want • To not have downtimes • To

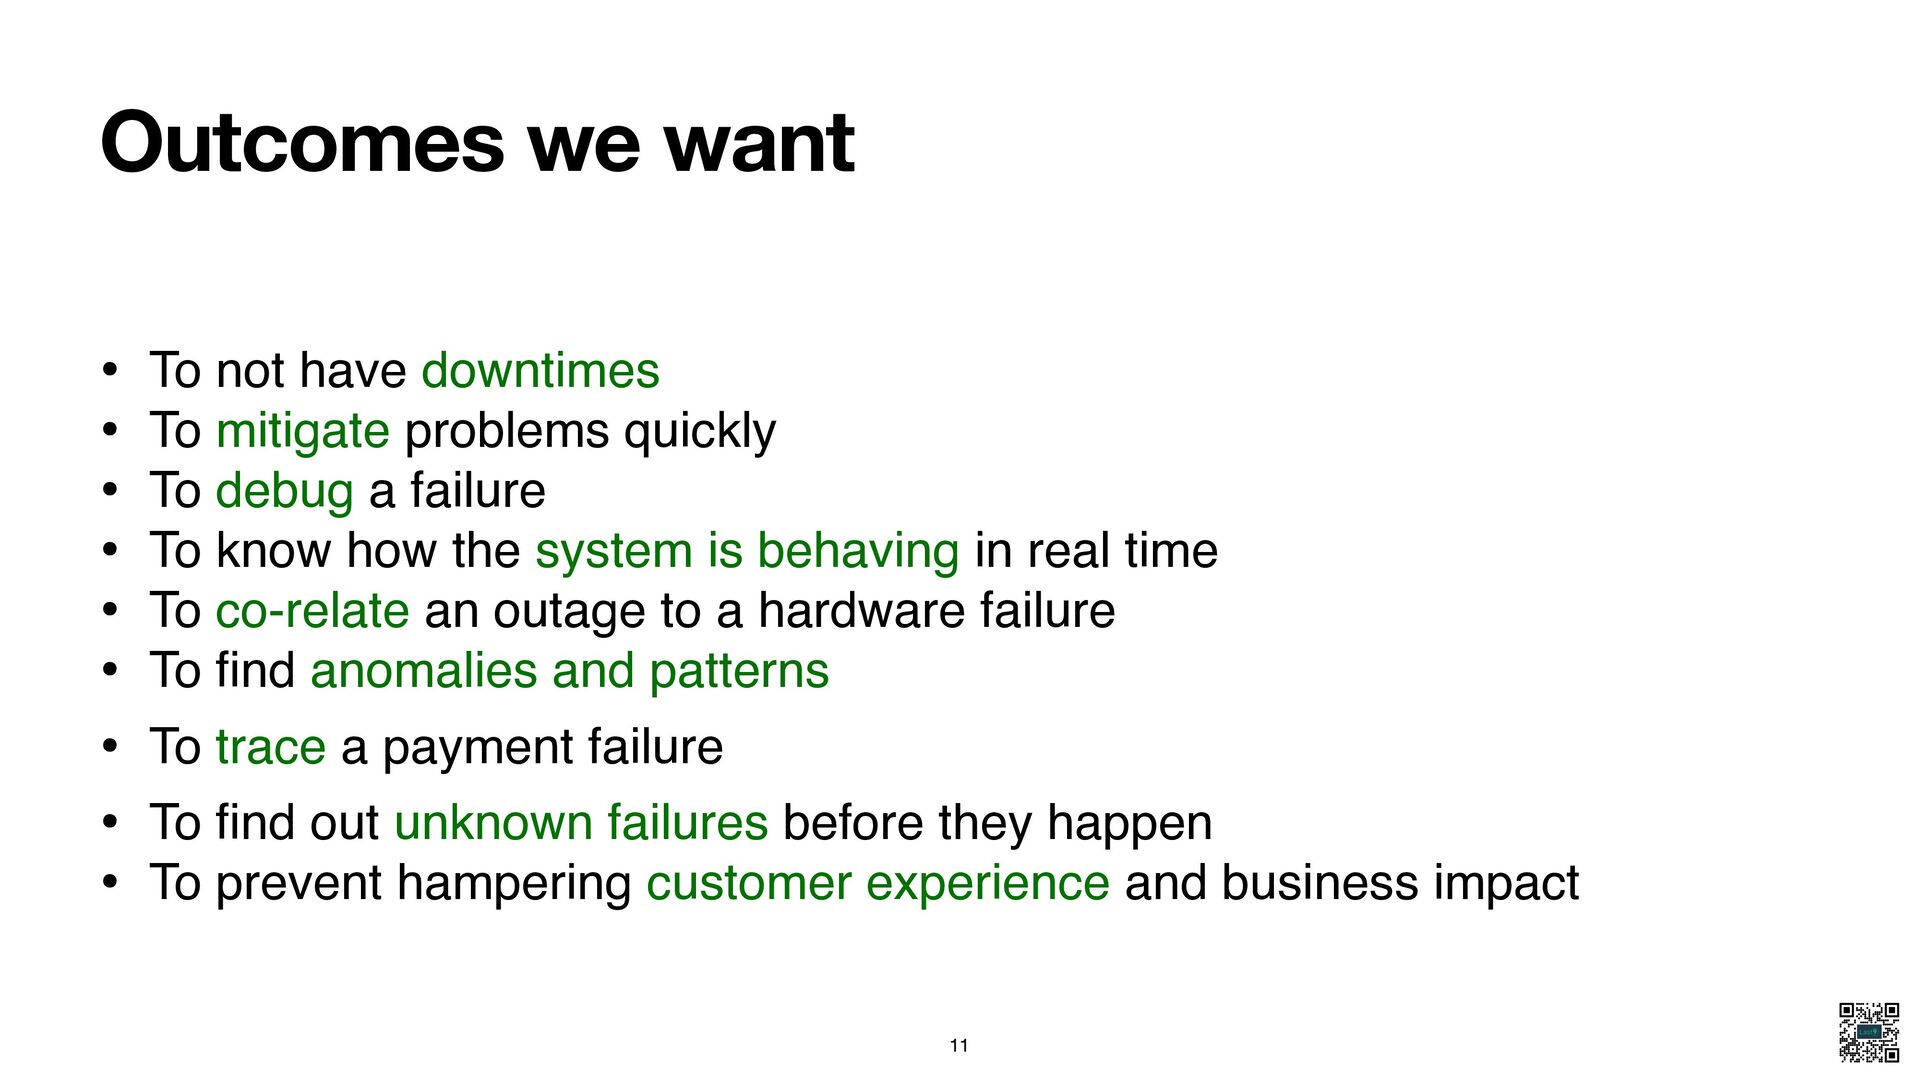
    mitigate problems quickly • To debug a failure • To know how the system is behaving in real time • To co-relate an outage to a hardware failure • To fi nd anomalies and patterns • To trace a payment failure • To fi nd out unknown failures before they happen • To prevent hampering customer experience and business impact 11
  8. Questions we ask • What is wrong? • Did we

    change anything? • What do we do so this doesn’t repeat? 12
  9. Answers we want • Know • Communicate • Recover •

    Analyse • Debug • Root cause 13
  10. Answers we want • System Health • Quick Decisions •

    Time • Root Cause • Testing • Correctness 14
  11. Logs • Can be literally anything -> Unstructured logs •

    Standard programs -> Structured logs 17
  12. • Getting Started ✅ • Adoption ✅ • Debugging ✅

    • Relationships 🥲 Logs • Volume 🥲 • Standardisation 🥲 • Health 🥲 • System insights 🥲 18
  13. • Getting Started 😐 • Adoption ✅ • Debugging 🥲

    • Relationships 🥲 Metrics • Volume 😐 • Standardisation ✅ • Health ✅ • System insights ✅ 21
  14. • Getting Started 😐 • Adoption 🥲 • Debugging ✅

    • Relationships ✅ Traces • Volume 😐 • Standardisation ✅ • Health 🥲 • System insights 🥲 24
  15. Events • Structured logs? • Schema based? • Domain Events

    • Easier to adopt? • Can unlock co-relation • Dimensionality 26
  16. • Getting Started 😐 • Adoption 🥲 • Debugging ✅

    • Relationships 🥲 Events • Volume ✅ • Standardisation 🥲 • Health ✅ • System insights ✅ 27
  17. Answers we want • Know • Communicate • Recover •

    Analyse • Debug • Root cause Real Time Post Factor 28
  18. Answers we want • Know • Communicate • Recover •

    Analyse • Debug • Root cause SRE/DevOps Programmer/Developers 29
  19. 80% of Telemetry data is unused • Yet, we store

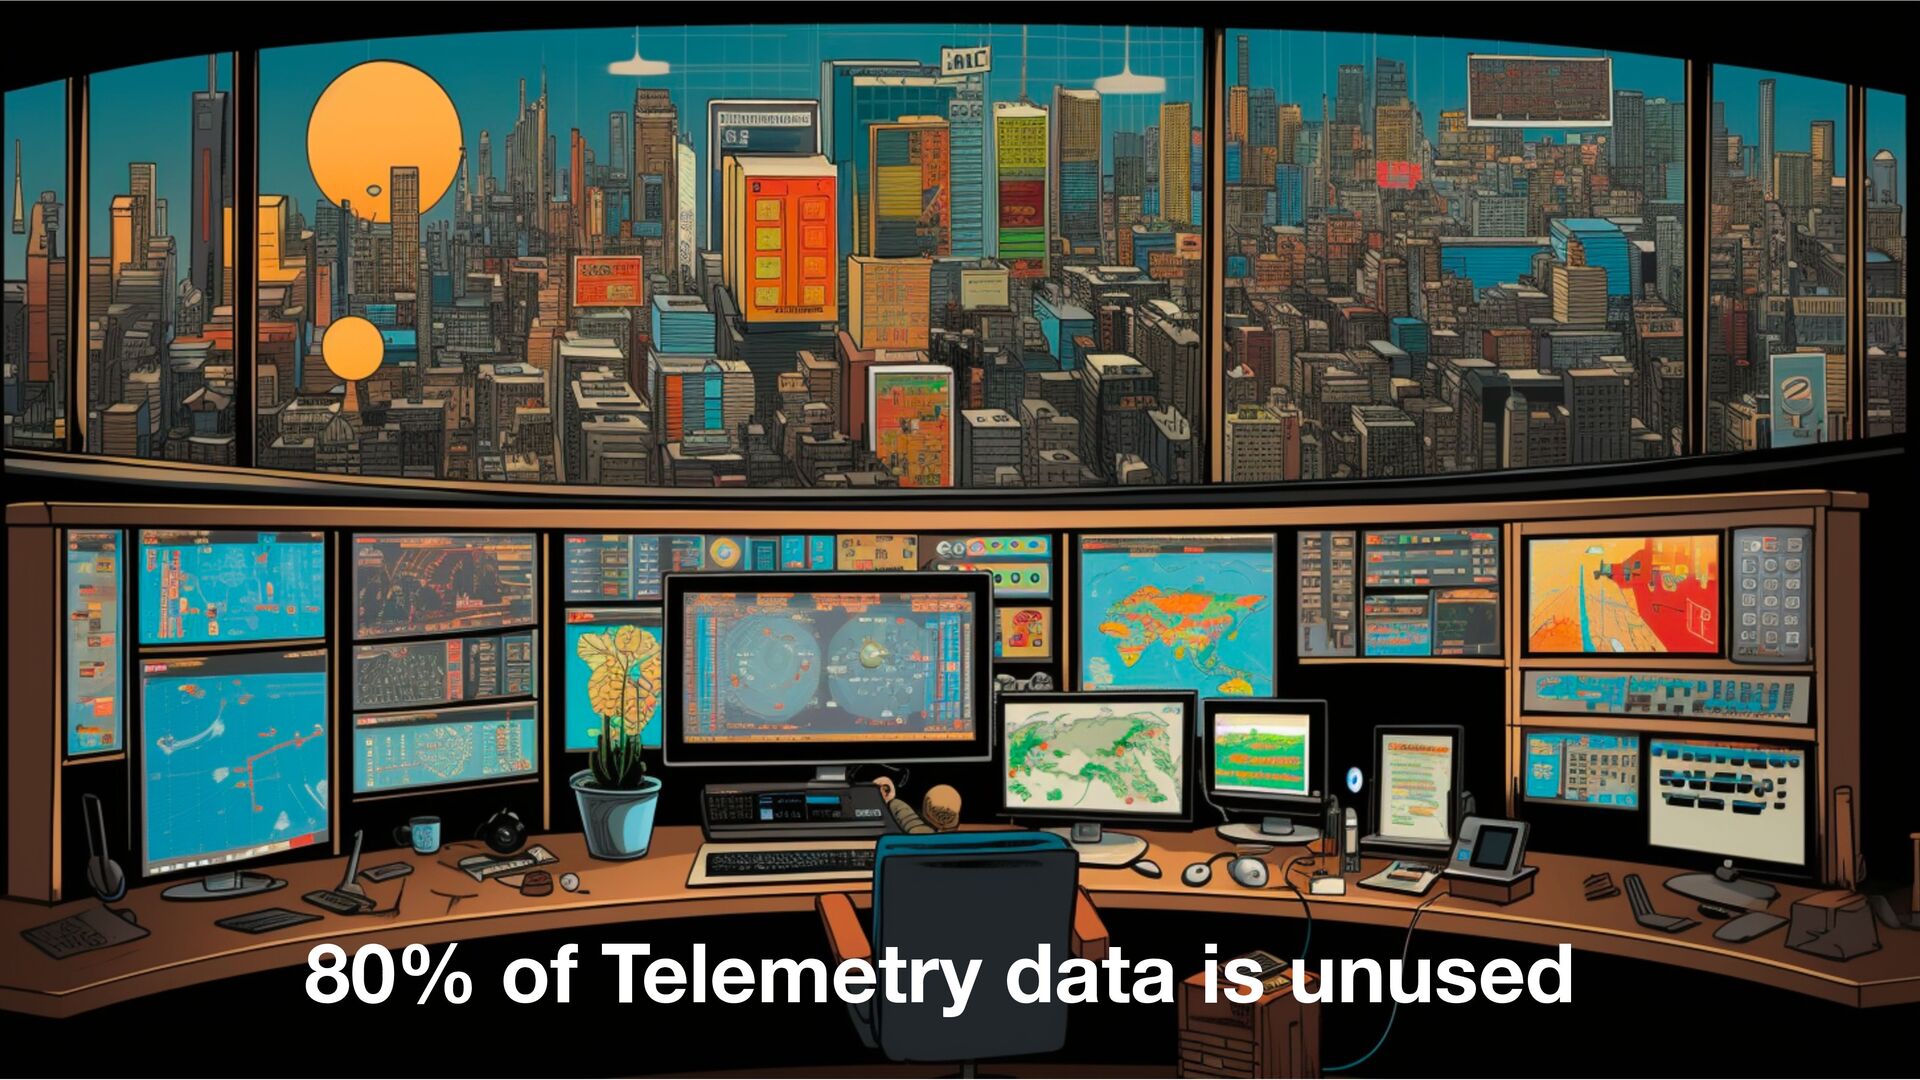
    it and pay for the data that is unused! • Slow dashboards, concurrent access woes • No real time alerting • Cost vs. Performance vs. Retention tradeo ff s 31
  20. Control Levers • Treat workloads di ff erently • Fast

    vs. Slow Data Tiers • Policies • Declarative Observability 33