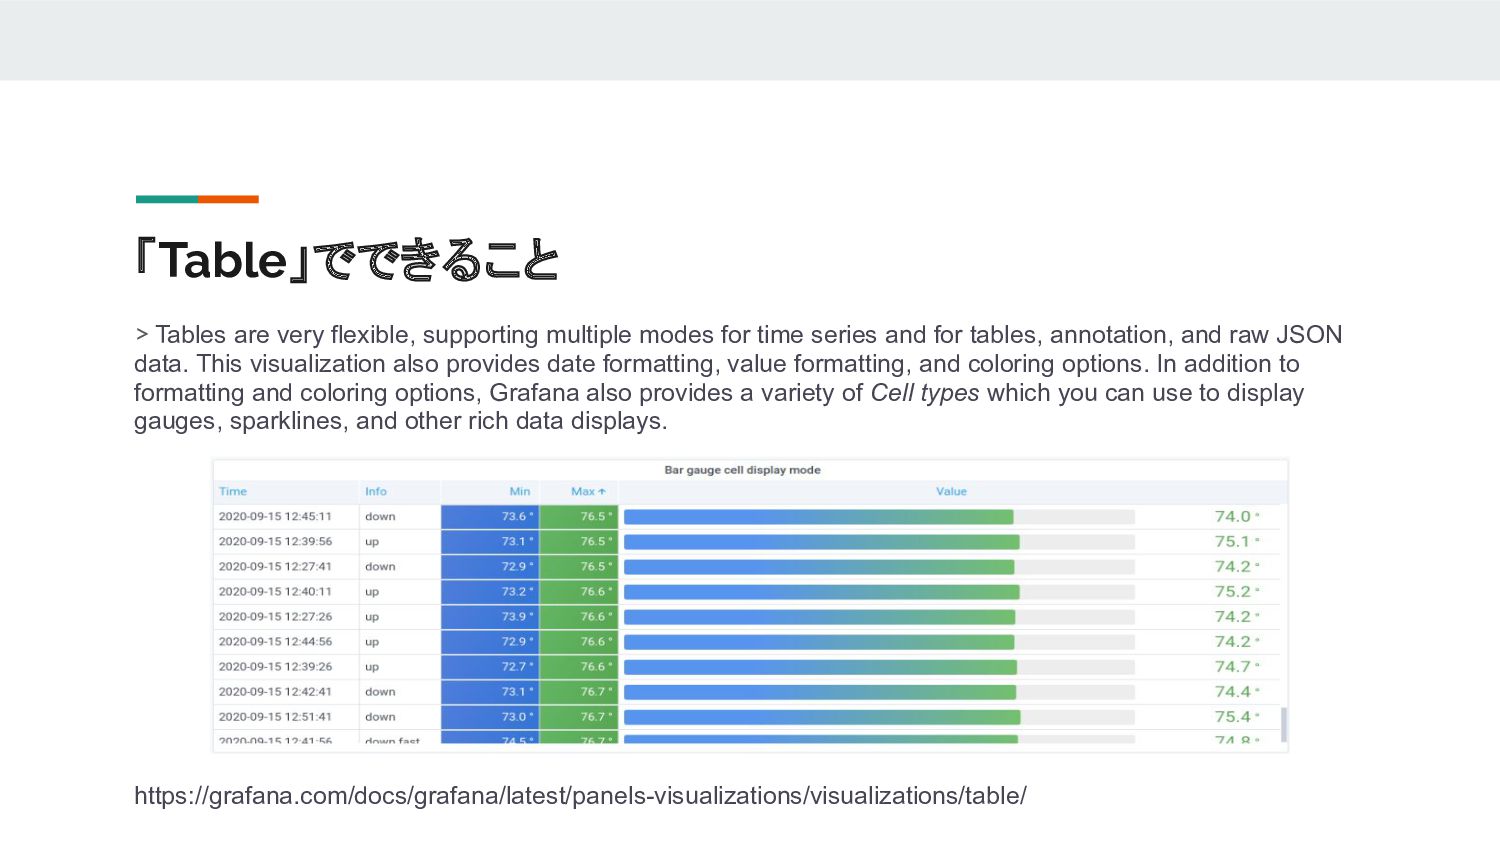
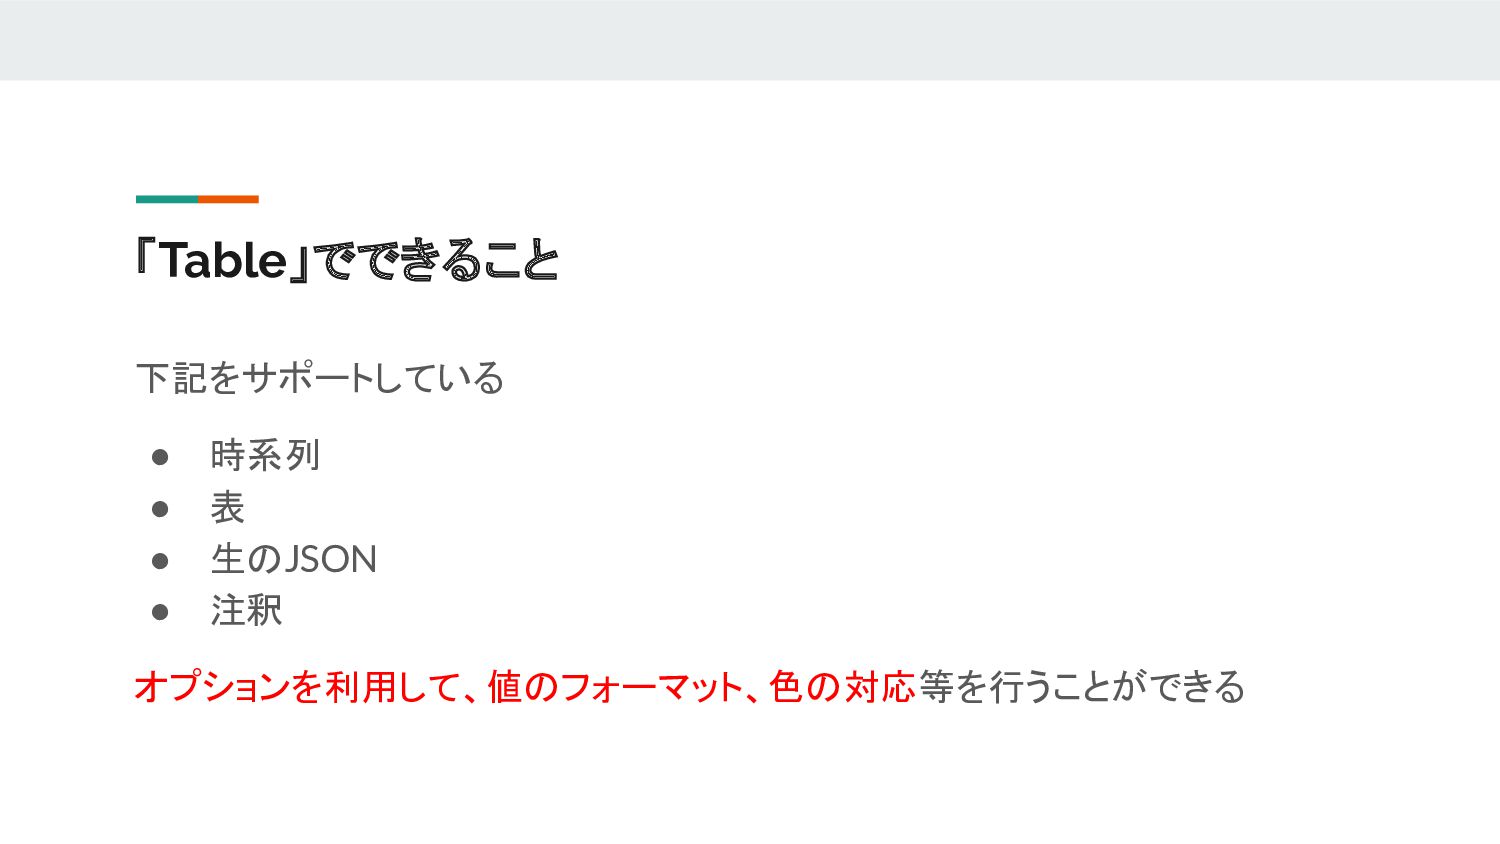
time series and for tables, annotation, and raw JSON data. This visualization also provides date formatting, value formatting, and coloring options. In addition to formatting and coloring options, Grafana also provides a variety of Cell types which you can use to display gauges, sparklines, and other rich data displays. https://grafana.com/docs/grafana/latest/panels-visualizations/visualizations/table/
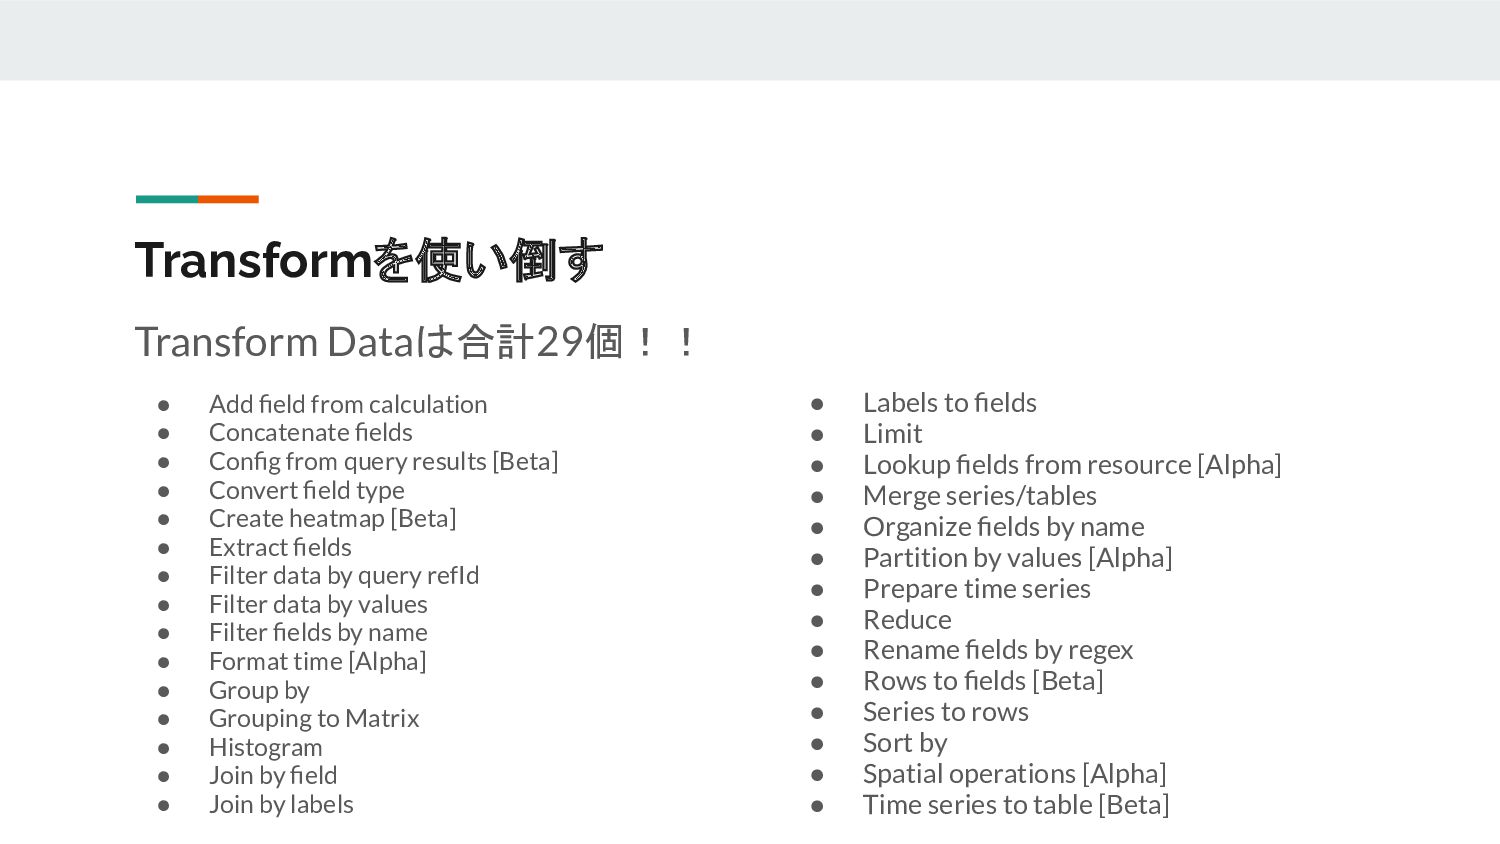
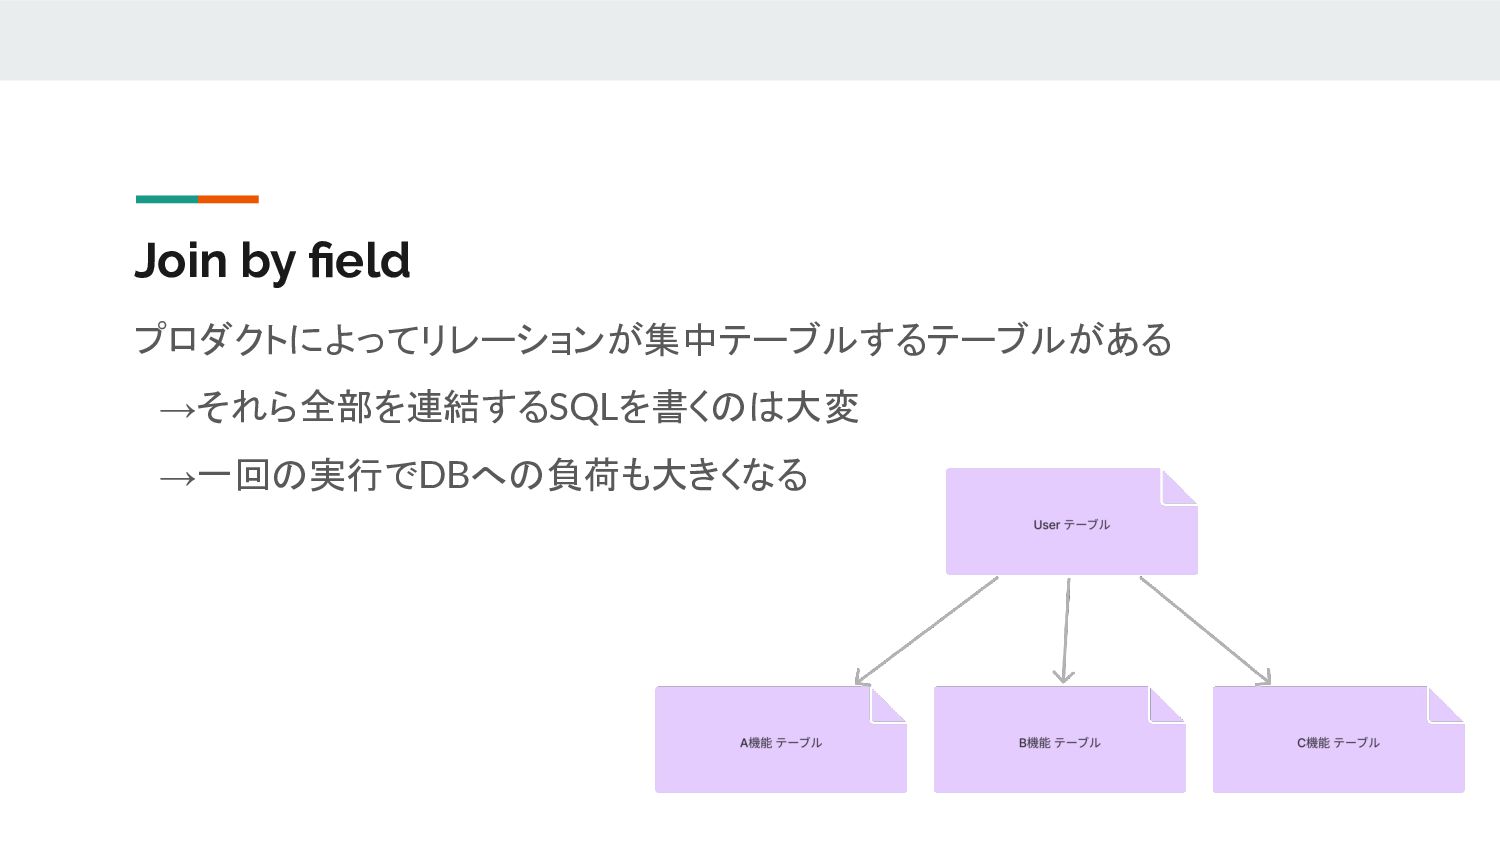
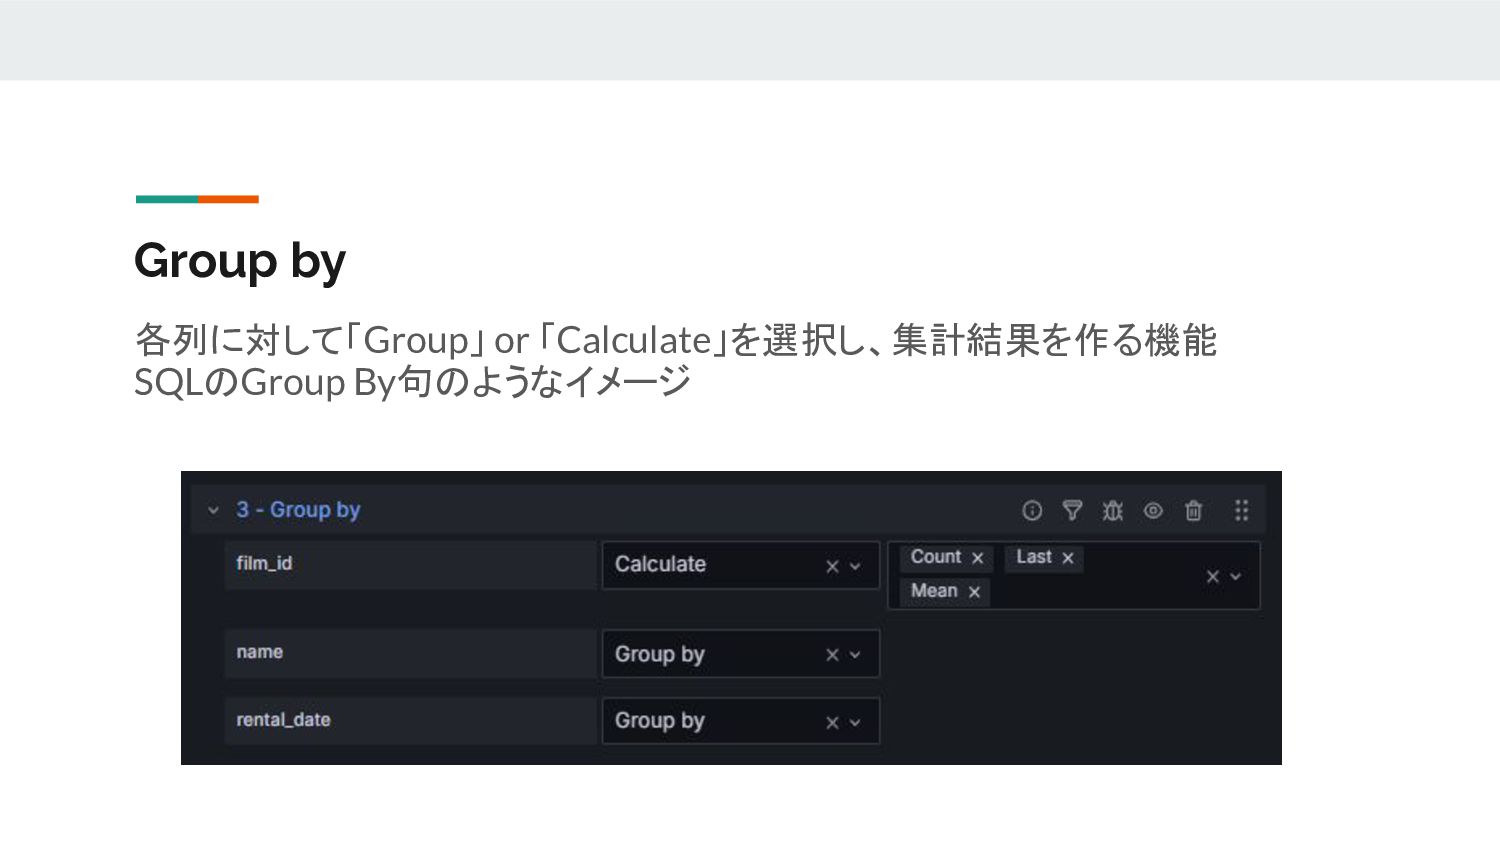
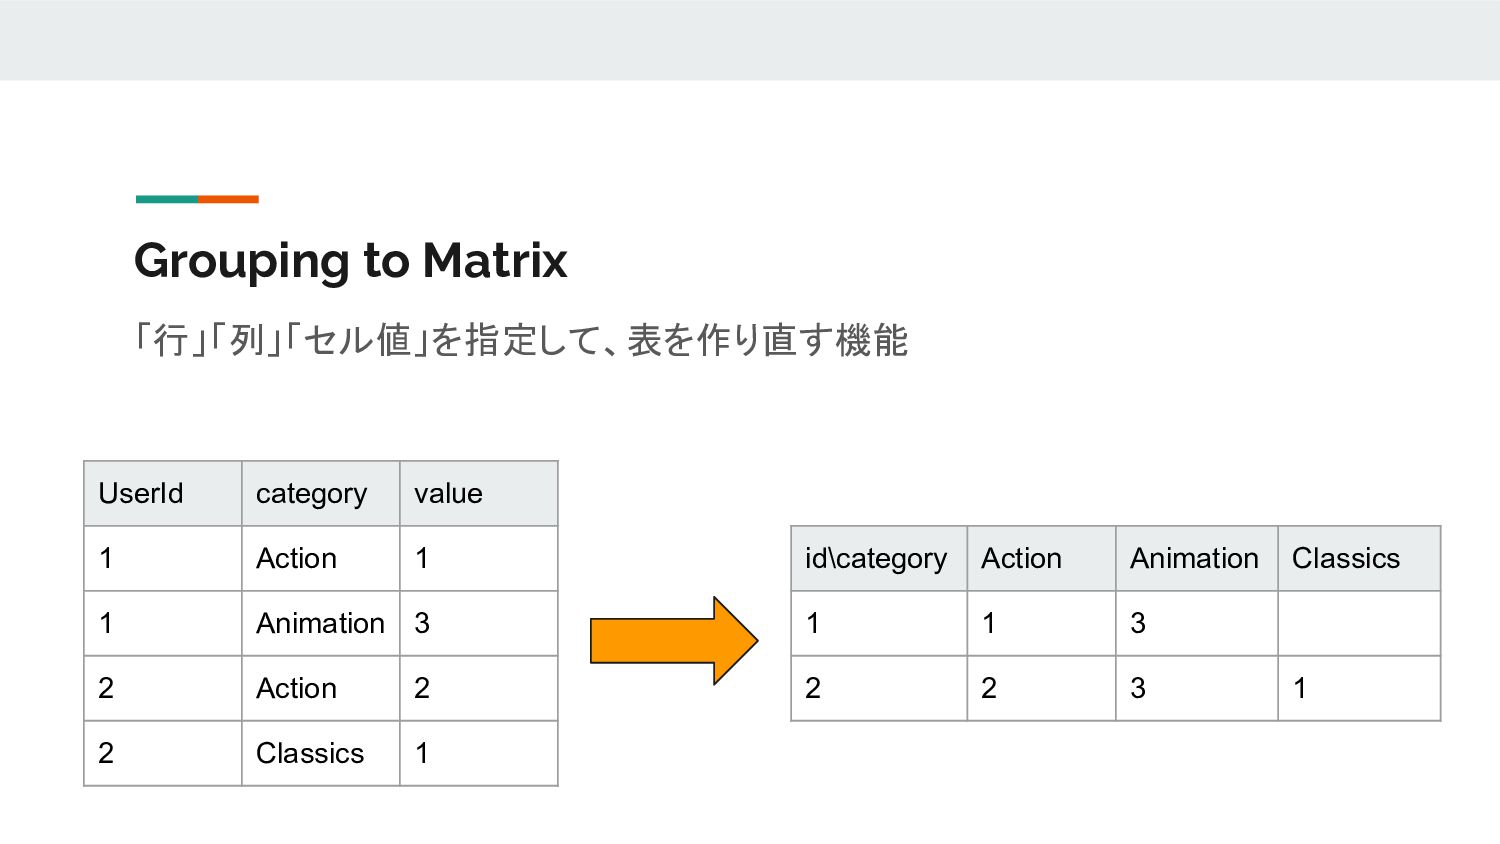
fields • Config from query results [Beta] • Convert field type • Create heatmap [Beta] • Extract fields • Filter data by query refId • Filter data by values • Filter fields by name • Format time [Alpha] • Group by • Grouping to Matrix • Histogram • Join by field • Join by labels • Labels to fields • Limit • Lookup fields from resource [Alpha] • Merge series/tables • Organize fields by name • Partition by values [Alpha] • Prepare time series • Reduce • Rename fields by regex • Rows to fields [Beta] • Series to rows • Sort by • Spatial operations [Alpha] • Time series to table [Beta]