Upgrade to Pro — share decks privately, control downloads, hide ads and more …

Profiling and Debugging Erlang Systems

Profiling and Debugging Erlang Systems

Profiling and debugging complex Erlang systems can be a challenging
and time-consuming task, even for an experienced Erlang developer. In this talk we share our experiences, by covering:

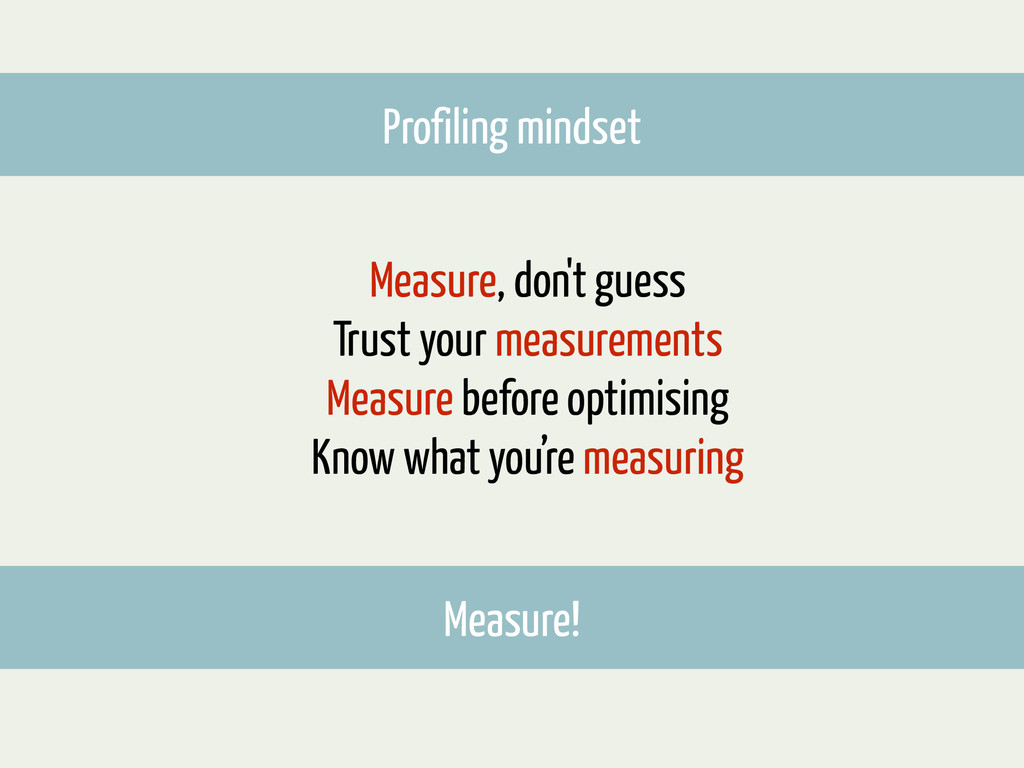
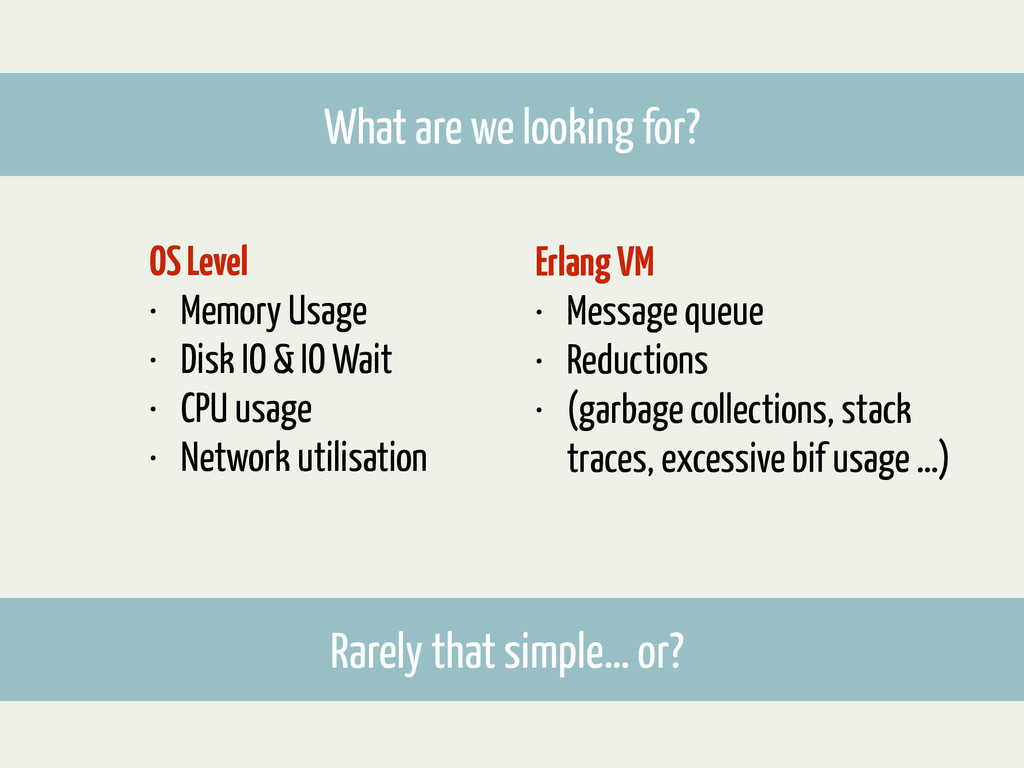
* The right mindset and what to look for
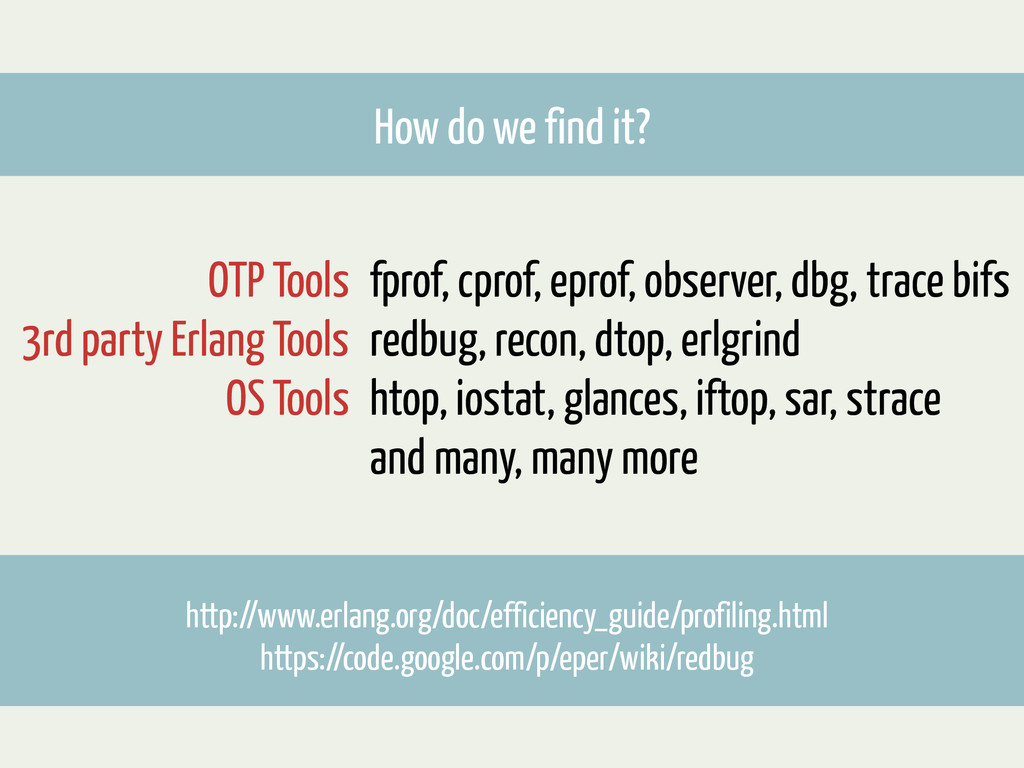
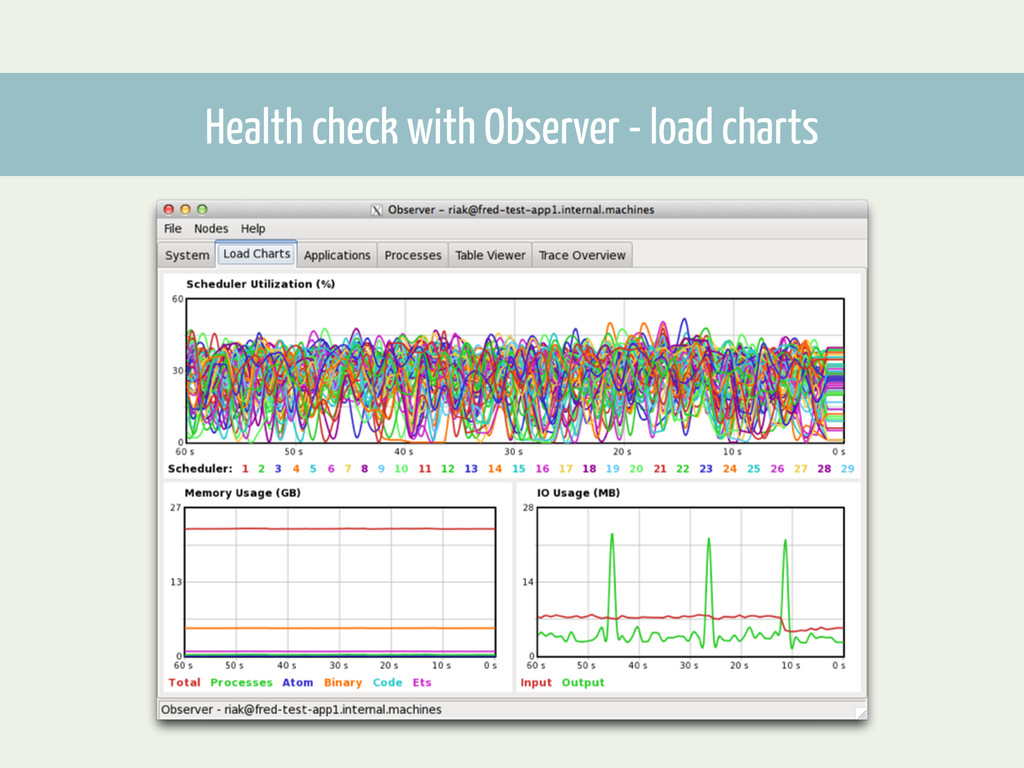
* An overview of available tools and some considerations from using them
* Useful Erlang system information and metrics to consider
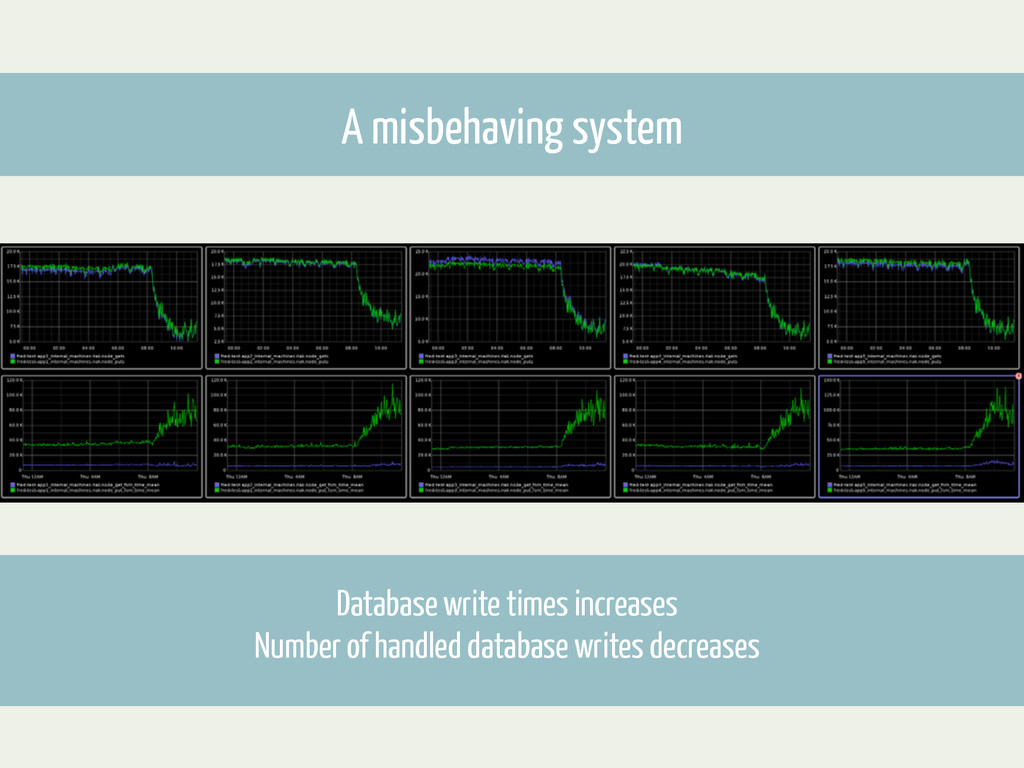
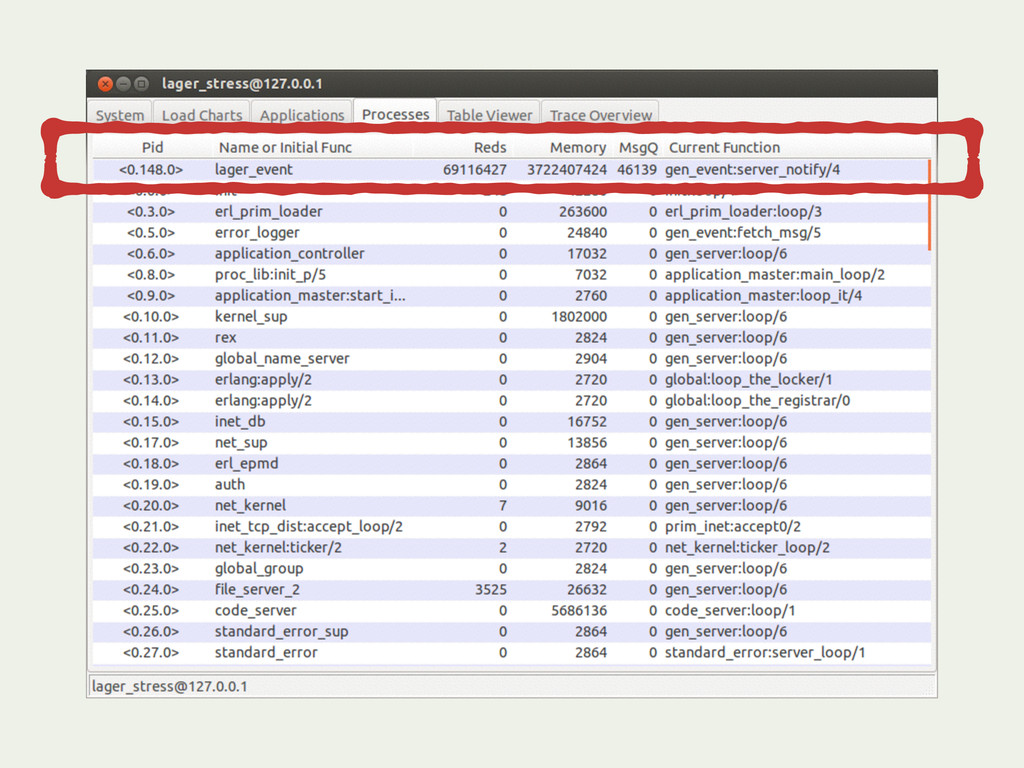
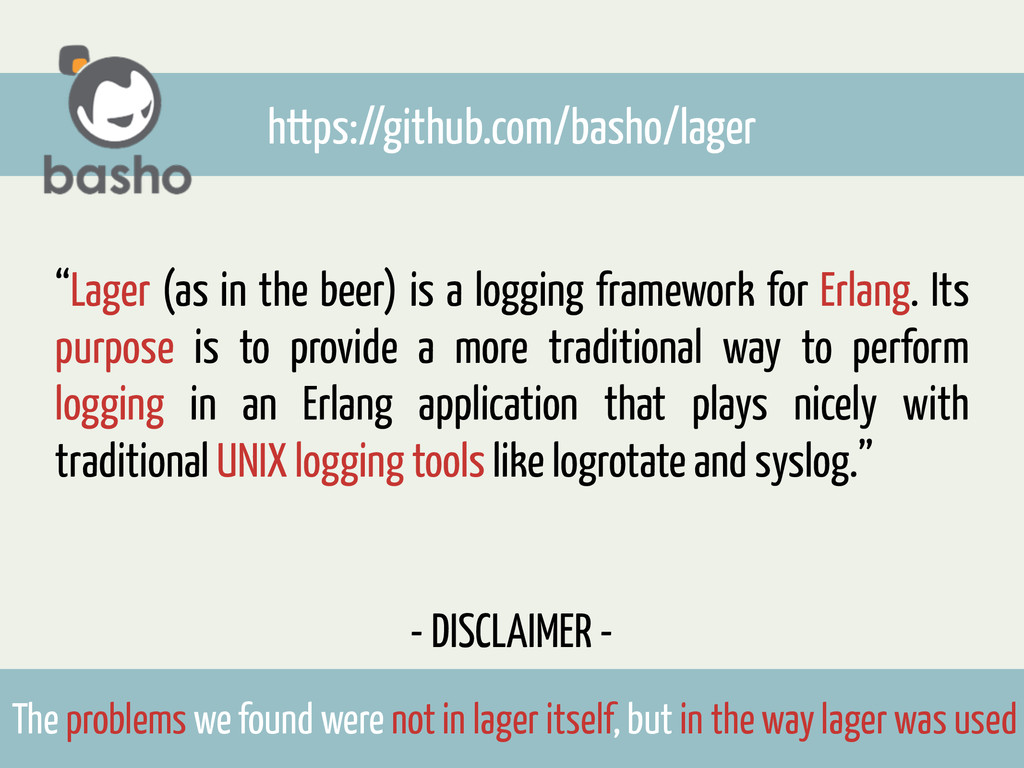
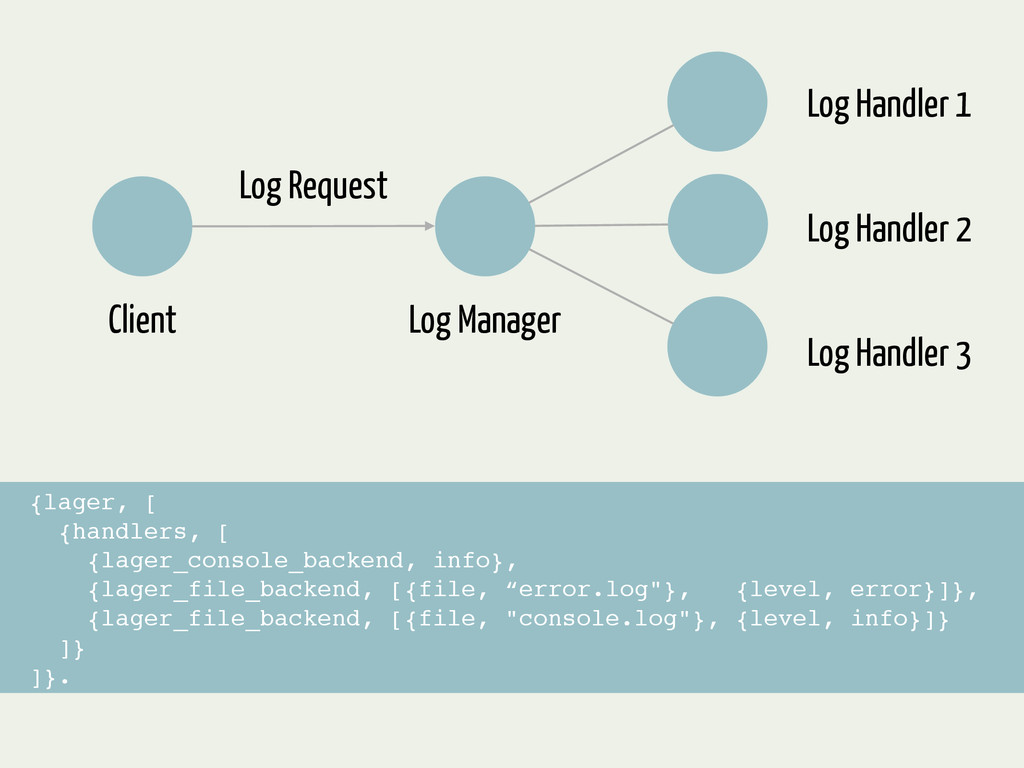
* War stories (including a widely used piece of Erlang software)
* Common pitfalls and caveats

Talk objectives:

- Share experiences about profiling and debugging Erlang systems
- Give an overview of existing tools
- Highlight common pitfalls, caveats and gotchas

Target audience:

Erlang developers and operators who want to:

- Learn more about profiling and debugging complex Erlang systems
- Be more productive when debugging an Erlang system
- Measure performance of their systems under load
- Improve performance of their systems
- Spot bottlenecks
- Learn from others' mistakes

Roberto Aloi

June 10, 2014
Tweet

More Decks by Roberto Aloi

Other Decks in Programming

Transcript

  1. M.Sc in Computer Engineering Working with Erlang technologies since 2007

    Senior Consultant and Trainer at Erlang Solutions Sicilian of origin, based in Stockholm M.Sc in Computer Science, almost Working with Erlang Technologies since 2005 Developer at Klarna
  2. Mindset & what to look for Useful tools & their

    usage Case study of a well-known Erlang system and maybe mild criticism? Intro Tools War Story Conclusions & QA Contents
  3. Profiling and Debugging? Not enough to determine where a system

    spends time - why it takes time needs to be answered too Shared toolset for both profiling and debugging You find - you fix!
  4. Measure, don't guess Trust your measurements Measure before optimising Know

    what you’re measuring Profiling mindset Measure!
  5. What are we looking for? OS Level • Memory Usage

    • Disk IO & IO Wait • CPU usage • Network utilisation ! Rarely that simple… or? Erlang VM • Message queue • Reductions • (garbage collections, stack traces, excessive bif usage …)
  6. How do we find it? http://www.erlang.org/doc/efficiency_guide/profiling.html https://code.google.com/p/eper/wiki/redbug fprof, cprof, eprof,

    observer, dbg, trace bifs redbug, recon, dtop, erlgrind htop, iostat, glances, iftop, sar, strace and many, many more OTP Tools 3rd party Erlang Tools OS Tools
  7. Health check with Observer - load charts Database write times

    increases Number of handled database writes decreases
  8. Inspect info from Observer closer with redbug (user@db-node)1> redbug:start(“gen_fsm:loop"). 23:54:04

    <{db_core_vnode,init,1}> {gen_fsm,loop, [<0.192.0>,<0.5143.0>,active, {state, 1370157784997721485815954530671515330927436759040, db_kv_vnode, {state, 1370157784997721485815954530671515330927436759040, db_kv_multi_backend, {state, [{<<"memory_multi">>, db_kv_memory_backend, {state,103678989,103547916, undefined,undefined,0,undefined}}, ! Code inspection showed this to be expected
  9. Average values since last invocation (or system start) On linux,

    use -x and keep an eye on await (i/o op latency in ms) Use watch: watch -n 5 iostat -x OS Tools - iostat
  10. Swap in use but large amount of free memory? On

    redhat-like systems, /proc/buddyinfo holds memory fragmentation info: Node 0, zone DMA 2 1 1 1 1 0 1 0 1 1 3 Node 0, zone DMA32 397 281 227 485 417 263 144 52 83 11 6 Node 0, zone Normal 1043 830 485 194 69 375 265 72 18 35 21 Node 1, zone Normal 2981 435 411 251 0 44 0 20 0 6 1 ! Use watch to monitor: watch -n5 cat /proc/buddyinfo ! ! Dropping page cache restored write performance to initial numbers. ! ! Not all bottlenecks directly visible!
  11. A few last words Powerful but complex, use redbug when

    debugging under load. Profile the entire system including disk, network & third party software It depends - but use observer Yes! and visualise your measurements Trace BIFs ! What to profile? ! Which tools? Measure?
  12. Debug Read other people’s code Cry Drink Coffee Laugh Profile

    Learn from mistakes Observer Redbug Is that a timer:sleep? eprof prof cprof flags dtop percept Scream Priority Ask that guy with the beard Bugs everywhere! Nobody Knows Why Works on my machine Pain Optimize I should have studied law instead Strace Reductions WAR STORY Cry Throughput My eyes hurt Everyone else is at the party 95th Percentile load Tracing htop percept2 Graphite UI sucks Stress Test microseconds kcachegrind Queues Expectations Metrics Latency WTF Measure It’s dark outside erlgrind kcachegrind suspend Garbage Collection scheduler make_ref I cannot believe it
  13. https://github.com/basho/lager “Lager (as in the beer) is a logging framework

    for Erlang. Its purpose is to provide a more traditional way to perform logging in an Erlang application that plays nicely with traditional UNIX logging tools like logrotate and syslog.” - DISCLAIMER - The problems we found were not in lager itself, but in the way lager was used
  14. Log Manager Log Handler 1 Log Handler 2 Log Handler

    3 Client {lager, [! {handlers, [! {lager_console_backend, info},! {lager_file_backend, [{file, “error.log"}, {level, error}]},! {lager_file_backend, [{file, "console.log"}, {level, info}]}! ]}! ]}. Log Request
  15. Did you know? In the Erlang gen_event behaviour event manager

    and event handlers run within the same context
  16. Lesson #1 USE gen_event cautiously Avoid synchronous calls in the

    handlers Use the manager as a “dispatcher” Spawn new processes whenever meaningful Avoid too many handlers
  17. WHY IS A BIG MESSAGE QUEUE BAD? (Aside from the

    obvious reasons, such as memory consumption and having an overloaded process) OK, THERE IS A QUEUE IN THE EVENT MANAGER
  18. Did you know? In Erlang if you send a message

    to a process which has a big mailbox you get punished https://github.com/erlang/otp/blob/master/erts/emulator/beam/bif.c if (erts_use_sender_punish) res *= 4; else res = 0;
  19. Lager Overload Protection log(Event) -> case lager_config:get(async, false) of true

    -> gen_event:notify(lager_event, Event); false -> gen_event:sync_notify(lager_event, Event) end; async flag automatically toggled based on the mailbox size async messaging used until the message exceeds async_threshold! sync messaging used after the the threshold is passed async messaging reverted when size is back below async_threshold - async_threshold_window Lager 2.x
  20. https://github.com/basho/lager/pull/113 “The problem with the current behaviour is it just

    pushes the problem onto the rest of the app. Sure, you don't have queuing in lager's mailbox, but now the rest of the app is slowed down instead. This isn't the right tradeoff for me at all. Logging should have minimal impact on the performance of the rest of the system, but instead we're effectively blocking at every log statement.” “So, assuming you're logging at a rate faster than you can actually write those logs to disk/syslog/whatever, your choice is either: slow down the rest of the app to compensate or let the mailbox balloon and have logging slow to a crawl anyway and possibly OOM the node.”
  21. - After stopping the load generator lot of activity is

    visible in htop - Activity is restricted to one single core - dtop shows that lager_event is busy - no i/o wait is visible in the system An Interesting Behaviour
  22. A single file write operation takes 12 ms And we

    have 400.000 messages to log That’s more than 1 hour to catch up - Most of the time is spent in file:write/2 - ! redbug:start(“file:write->return”, [{print_msec, true}, {arity, true}]).
  23. Lesson #2 THE COST OF FILE:WRITE/2 is directly proportional to

    the length of the message queue of the writing process (at least in R15B03-1)
  24. execute_request(Pid, Request) -> Mref = erlang:monitor(process, Pid), Pid ! {io_request,

    self(), Request}, receive {io_reply, From, Reply} -> … SELECTIVE RECEIVE io.erl
  25. OTP-8623 == compiler erts hipe stdlib == ! Receive statements

    that can only read out a newly created reference are now specially optimized so that it will execute in constant time regardless of the number of messages in the receive queue for the process. ! See gen:do_call/4 for an example of a receive statement that will be optimized. A WORKAROUND (the make_ref trick) Erlang R14A (June 2010) Release Notes
  26. File handlers (debug, warning, error) Concurrent workers Log messages /

    sec Message size Minutes (interrupted) STRESS TEST SCENARIO 3 6 100 1Kb 10 - 1800 file write operation / second -
  27. Number of Messages 4500 9000 13500 18000 Seconds 1 5

    9 13 17 21 25 29 33 37 41 45 49 53 57 61 65 69 73 77 81 85 89 93 97 101 105 109 113 117 121 125 129 133 137 141 145 149 153 157 161 165 No Middleman Middleman MESSAGE QUEUE GROWTH
  28. FILE WRITE TIME msec / write 0.2 0.4 0.6 0.8

    Seconds 1 5 9 13 17 21 25 29 33 37 41 45 49 53 57 61 65 69 73 77 81 85 89 93 97 101 105 109 113 117 121 125 129 133 137 141 145 149 153 157 161 165 No Middleman Middleman