Upgrade to Pro — share decks privately, control downloads, hide ads and more …

Mozcon NYC 2025: Stop Losing SEO Traffic

Mozcon NYC 2025: Stop Losing SEO Traffic

Presented at Mozcon NYC 2025. For all mentioned resources, go to https://thegray.company/blog/mozcon-2025-nyc

Avatar for Sam Torres

Sam Torres

November 05, 2025
Tweet

More Decks by Sam Torres

Other Decks in Marketing & SEO

Transcript

  1. Which often leads to a scramble •Scrambling to find the

    right data •Cobbling different sources together •Too little insight leading to too much guesswork
  2. • Poor resource decisions • Lost revenue • Team burnout

    …which comes with business costs -$ -$ -$ -$ -$ -$
  3. You need a system, not a scramble • Most teams

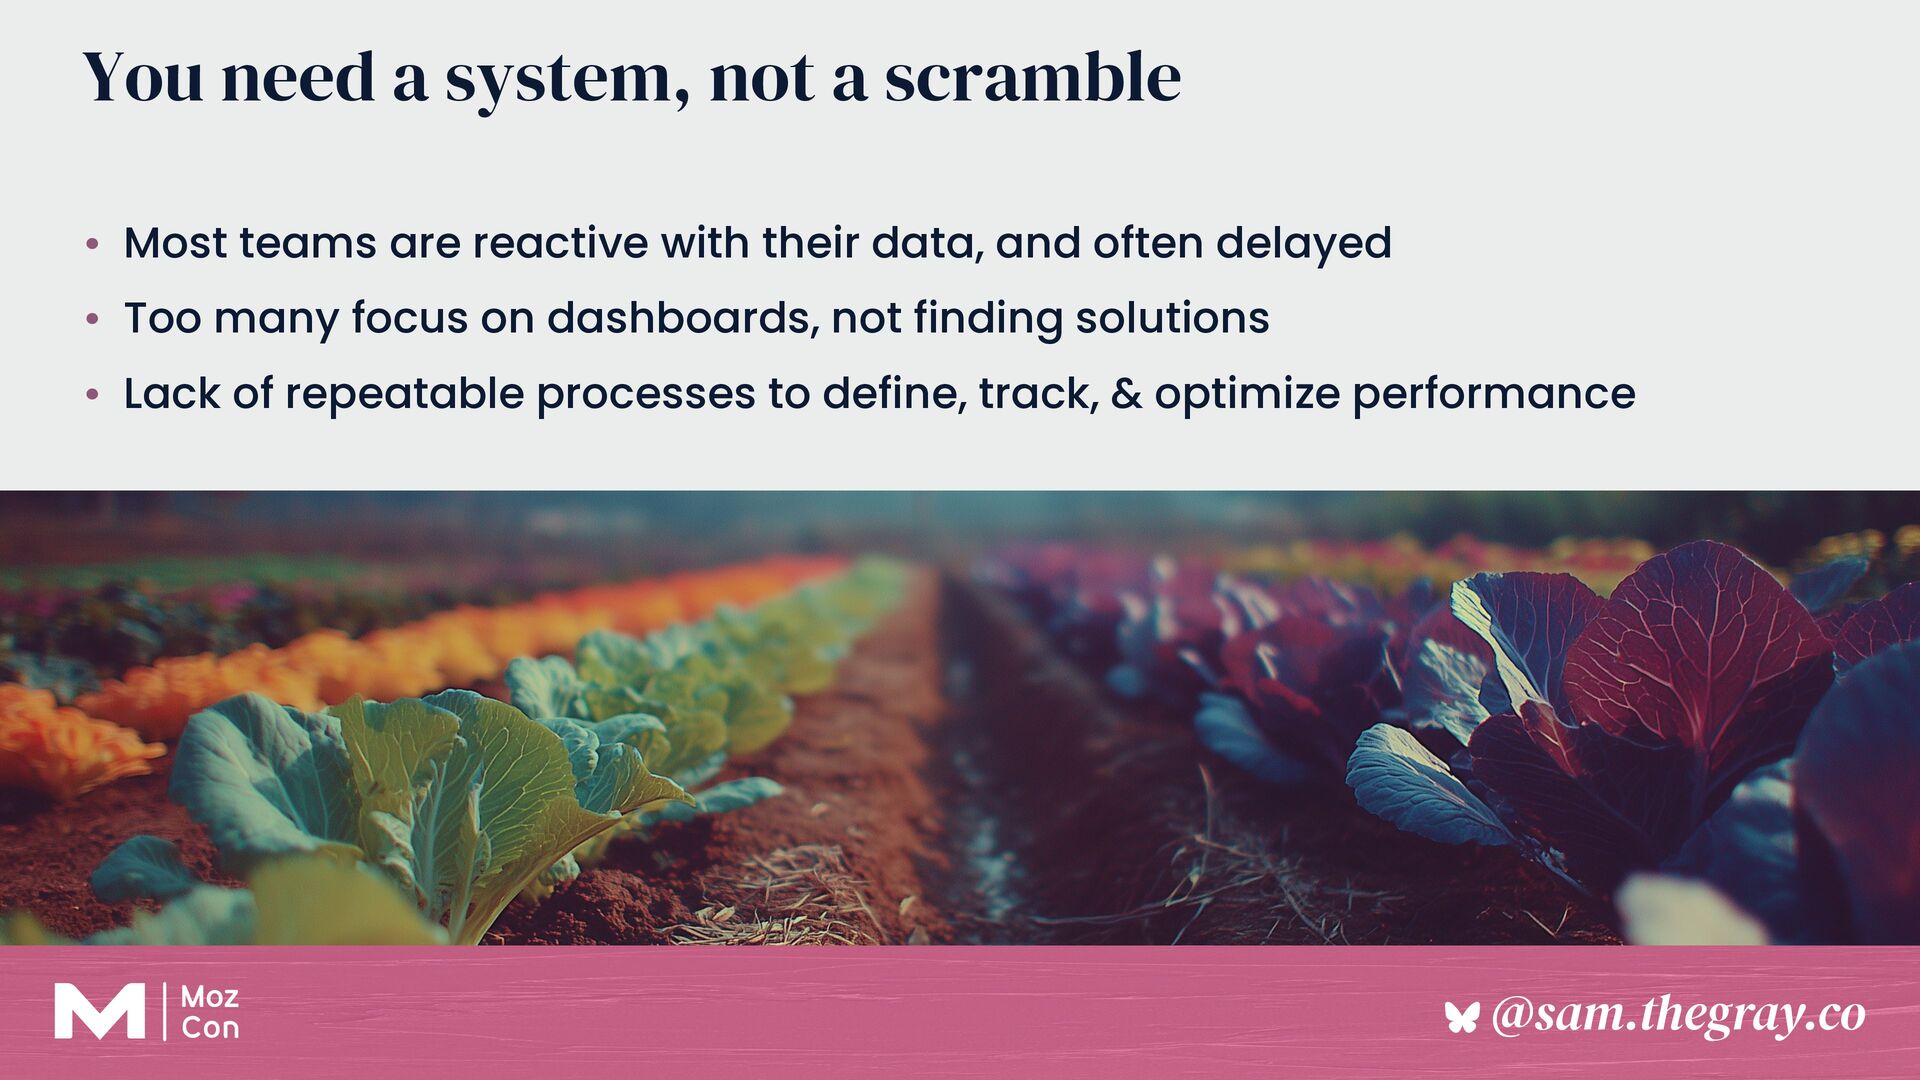
    are reactive with their data, and often delayed • Too many focus on dashboards, not finding solutions • Lack of repeatable processes to define, track, & optimize performance
  4. • Two-sided marketplace serving both consumers & service providers •

    ~1.3B impressions & ~25M clicks annually • International availability • Supports multiple services • Highly localized search intent = MANY search term variations Example Client Tons of Plant Varieties (Query Variations) Microclimates (Local Intent) Garden Beds (Services/Markets)
  5. the Problem Step 1 It’s all about how you slice

    the data to find the problem areas Pinpoint
  6. 1. Gather your GSC data using Search Analytics for Sheets

    2. Build traffic models using machine learning 3. Investigate anomalies Anomaly Detection with Machine Learning Pinpoint the Problem Step 1
  7. Building a Forecast Model Pinpoint the Problem Step 1 •

    Use Google Colab • Code your notebook with Claude • Recommended models: • Isolation forest • Local outlier factor • Forecast-residual approach
  8. Seasonality “Weather” Topic or intent query clusters “Plant Types/Species” URL

    groups (templates, directory/folder) “Garden Beds” SERP feature changes “Pollinators/competition” Search type “Indoor/outdoor” Geo/Local Intent “Microclimates” Device “Shade vs Sun”
  9. Step 2 Plan SEO playbook you know & love •

    Manual penalties • Tech health • Backlink profile • Algorithm updates • SERP changes • Site content quality • Competition • Market shifts
  10. • Check GSC messages weekly • Conduct logfile analysis regularly

    • Ensure site monitoring is enabled • Look for issues that scale by auditing templates Tech Health Plan Step 2
  11. • Quality over quantity • Disavow carefully • Engage in

    digital PR • Consistency in your entity Backlink Profile Plan Step 2
  12. • Use GSC Guardian Chrome extension • Marie Haynes’ Google

    algorithm update list • Join communities like Women in Tech SEO and The SEO Community Algorithm Updates & SERP Changes Plan Step 2
  13. • Benchmark content against new ranking leaders • Conduct gap

    analysis • Review for cannibalization • Own your topics • Prune the fluff Site Content Quality Plan Step 2
  14. Keyword Cannibalization Plan Step 2 • Identify content to consolidate,

    retire, or better differentiate • Recommended tools: SEO Gets, SEOTesting
  15. Conduct a competitive audit, looking at both on-page factors (UX,

    content quality) and domain-level factors (DA, referrals) Competition Plan Step 2
  16. Use Google Trends or top of the funnel keyword research

    to understand shifts in demand for overarching topics, products, and categories. Market Shifts Plan Step 2
  17. Google Trends Topics Plan Step 2 • Use “Categories” to

    drill down to your industry • Periodically review the Top and Rising topics
  18. • Gauge prevalence across site (as a share/percentage) • Estimate

    level of effort and impact How To Prioritize The Fixes Plan Step 2
  19. 3-Step SEO Triage Step 3 Prove Show ROI to secure

    buy-in • Relevant case studies • Small proof-of-concept tests • AI-powered forecasting models
  20. Building Proof of Concept Test Cases 1. Review your plan

    to see what can be broken down into smaller increments 2. Decide what kind of test: sampling, time-based, or user-based? 3. Calculate for statistical significance 4. Document what metrics you expect to be impacted 5. Run the test Prove Step 3
  21. Forecasting Models • Use fan charts to communicate confidence intervals

    / margin of error • Resource: Tom Capper's forecast model from the Moz blog Prove Step 3
  22. Let’s Be Data-first & Solution-driven • The answer isn’t yet

    another dashboard, it’s how to find meaning in the data • Adopt “here’s what we’re going to do” language instead of “here’s what happened”
  23. Use our system to… • Catch issues early • Show

    value fast • Build trust with stakeholders