Upgrade to Pro
— share decks privately, control downloads, hide ads and more …
Speaker Deck
Features
Speaker Deck
PRO
Sign in
Sign up for free
Search
Search
DTrace: printf debugging for seventh-level wizards
Search
Shawn Moore
January 14, 2012
Programming
1.3k
2
Share
Embed
Copy iframe code
Copy JS code
Copy link
Start on current slide
DTrace: printf debugging for seventh-level wizards
Shawn Moore
January 14, 2012
More Decks by Shawn Moore
See All by Shawn Moore
Right the First Time
sartak
0
550
Lifting Moose
sartak
0
700
Kindergarten Code
sartak
0
160
How to be Fluent in Japanese
sartak
0
220
DTrace War Stories
sartak
1
200
Moose Role Usage Patterns
sartak
5
6k
git-status-tackle
sartak
5
410
Extending Moose for Applications
sartak
1
410
API Design
sartak
4
1k
Other Decks in Programming
See All in Programming
琵琶湖の水は止められてもNet--HTTPのリトライは止められない / You might be able to stop the water flow of Lake Biwa but you can't stop Net::HTTP retries
luccafort
PRO
0
400
ITヒヤリハットを整理してみた ~ライフサイクルと原因から考える再発防止策~
koukimiura
1
110
act1-costs.pdf
sumedhbala
0
240
「正の参照」と 「負の導出」で組む ハーネスエンジニアリング
cottpan
1
140
【やさしく解説 設計編・中級 #4】ルールの寿命と、システムの年輪
panda728
PRO
2
150
PHP Application における Kubernetes 内 gRPC 通信
ganchiku
0
500
【やさしく解説 設計編 #1】「ドメイン駆動」と「実装駆動」ってなに? 〜設計の考え方を、たとえ話で学ぼう〜
panda728
PRO
1
120
Laravel Boostに学ぶ、AIにPHPを書かせる技術 〜OSSの実装から蒸留するエージェント制御の王道〜
kentaroutakeda
3
470
なぜ関数型プログラミングで「型」と「証明」が語られるのか #fp_matsuri
kajitack
3
960
Even G2とAWSで推しのエージェントを召喚しよう!
har1101
1
170
PHPだって関数型したい 〜できること、できないこと〜 / fp-in-php
jsoizo
0
220
Laravelで学ぶ Webアプリケーションチューニング入門/web_application_tuning_101
hanhan1978
4
930
Featured
See All Featured
Design of three-dimensional binary manipulators for pick-and-place task avoiding obstacles (IECON2024)
konakalab
0
490
Ecommerce SEO: The Keys for Success Now & Beyond - #SERPConf2024
aleyda
1
2.1k
Making Projects Easy
brettharned
120
6.7k
Utilizing Notion as your number one productivity tool
mfonobong
4
430
Building AI with AI
inesmontani
PRO
1
1.1k
Ethics towards AI in product and experience design
skipperchong
2
330
Design in an AI World
tapps
1
260
Evolving SEO for Evolving Search Engines
ryanjones
0
240
AI in Enterprises - Java and Open Source to the Rescue
ivargrimstad
0
1.4k
Breaking role norms: Why Content Design is so much more than writing copy - Taylor Woolridge
uxyall
0
350
Intergalactic Javascript Robots from Outer Space
tanoku
273
27k
sira's awesome portfolio website redesign presentation
elsirapls
0
300
Transcript
@sartak DTRACE printf debugging for seventh-level wizards 121݄14༵
ME ME ME ME ME ME ME Shawn M Moore
@sartak I’m Bawstin’ Moose-lover Infinity Interactive 121݄14༵
What’s my computer doing right now? Q: A: Find out
with DTrace 121݄14༵
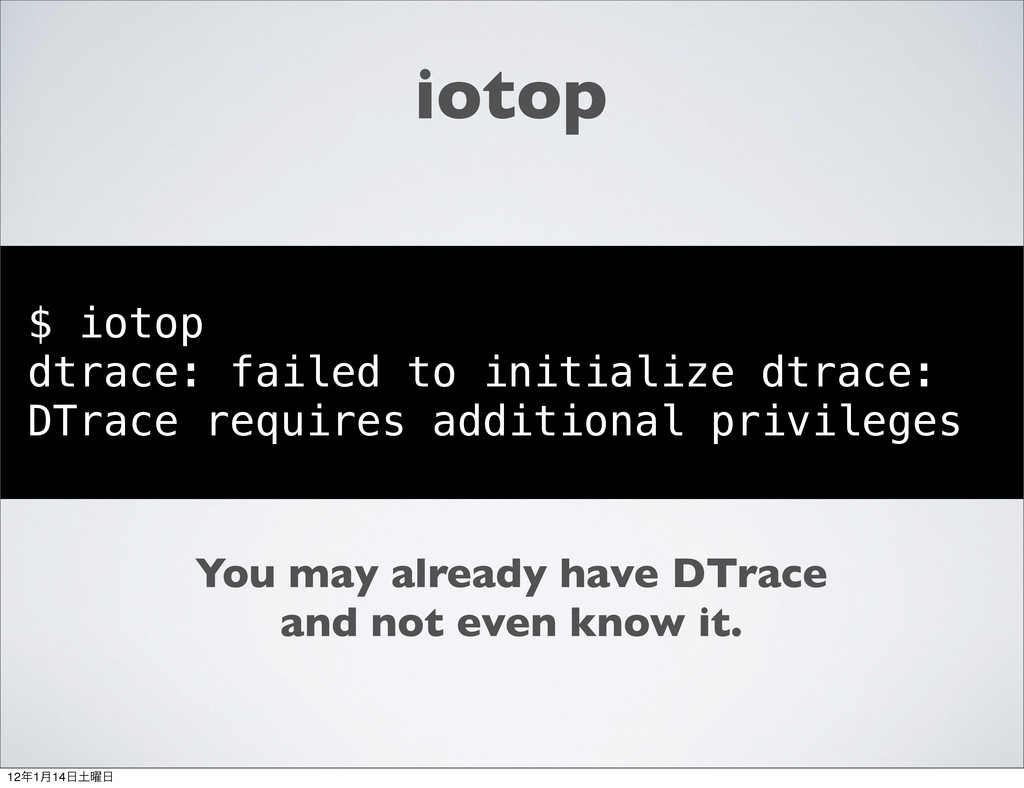
iotop $ iotop dtrace: failed to initialize dtrace: DTrace requires
additional privileges You may already have DTrace and not even know it. 121݄14༵
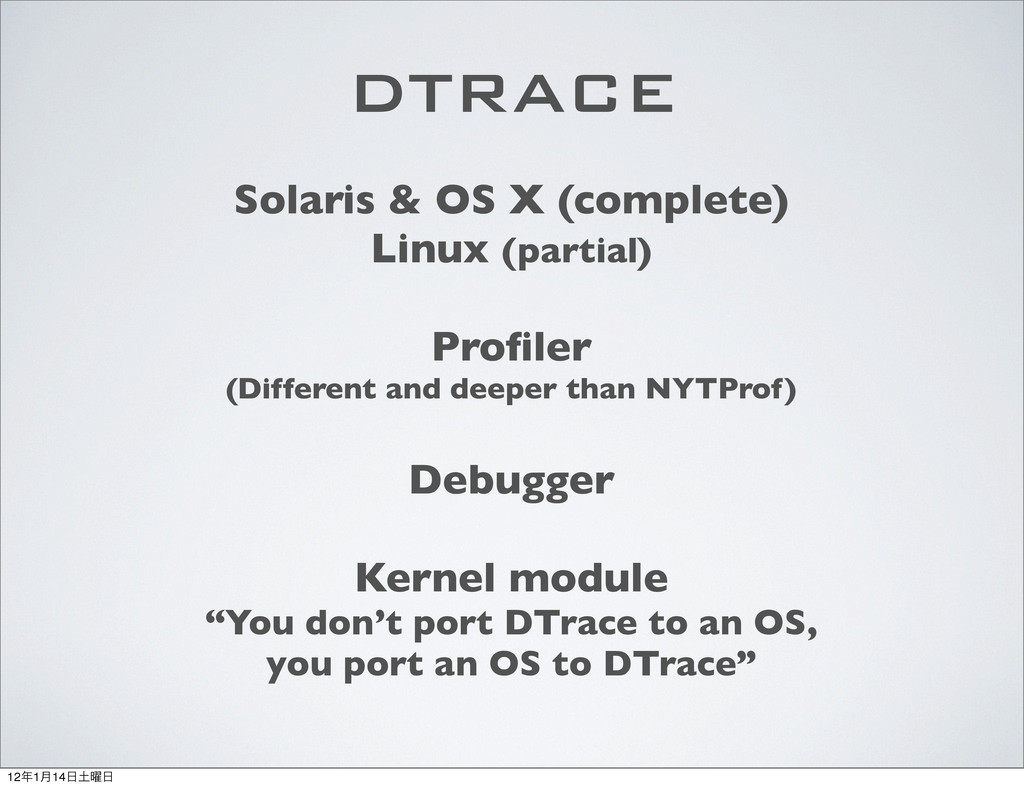
Solaris & OS X (complete) Linux (partial) Profiler (Different and
deeper than NYTProf) Debugger Kernel module “You don’t port DTrace to an OS, you port an OS to DTrace” DTRACE 121݄14༵
SAFE! ɾNo unwanted side effects ɾVery low overhead ɾDo it
in production! 121݄14༵
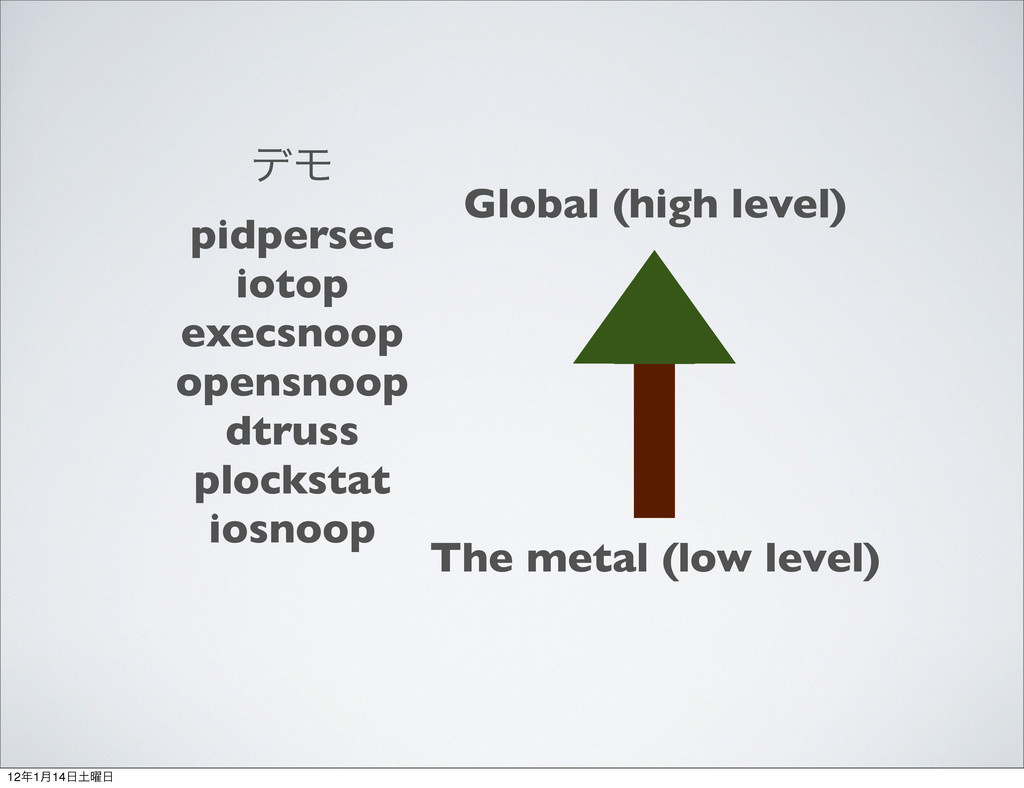
σϞ pidpersec iotop execsnoop opensnoop dtruss plockstat iosnoop Global (high
level) The metal (low level) 121݄14༵
σϞ pidpersec iotop execsnoop opensnoop dtruss plockstat iosnoop Global (high
level) The metal (low level) 121݄14༵
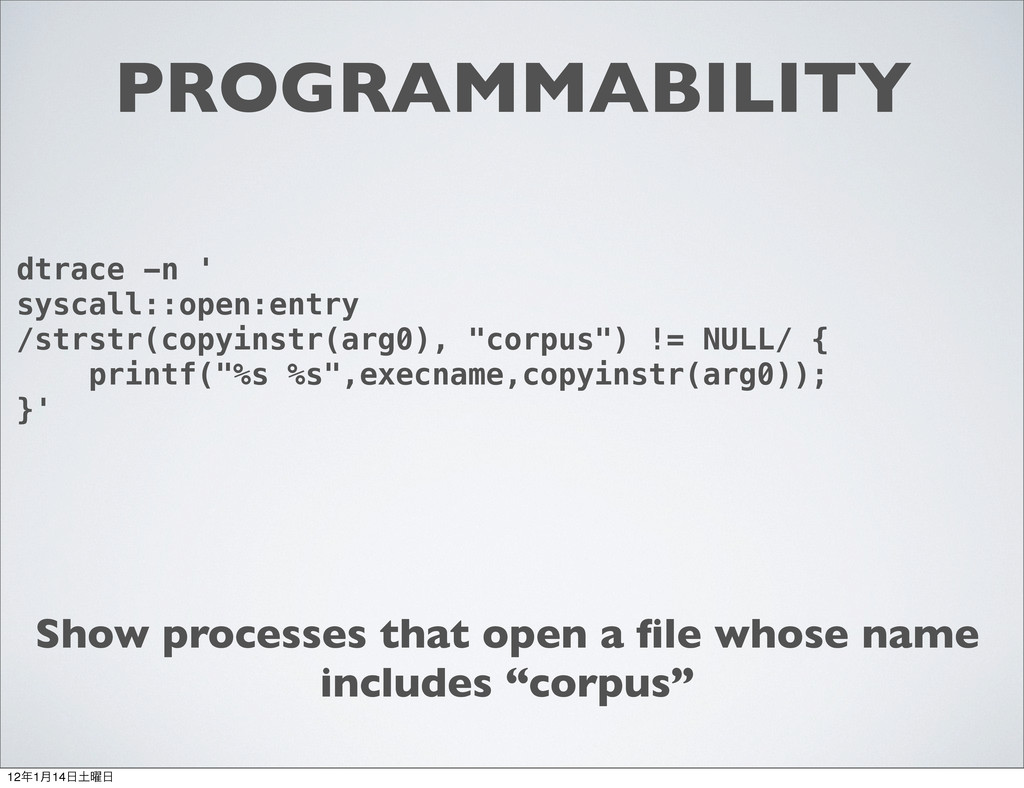
PROGRAMMABILITY dtrace -n ' syscall::open:entry /strstr(copyinstr(arg0), "corpus") != NULL/ {
printf("%s %s",execname,copyinstr(arg0)); }' Show processes that open a file whose name includes “corpus” 121݄14༵
PROGRAMMABILITY dtrace -n ' syscall::open:entry /strstr(copyinstr(arg0), "corpus") != NULL/ {
printf("%s %s",execname,copyinstr(arg0)); }' Show processes that open a file whose name includes “corpus” Event(Probe Description) 121݄14༵
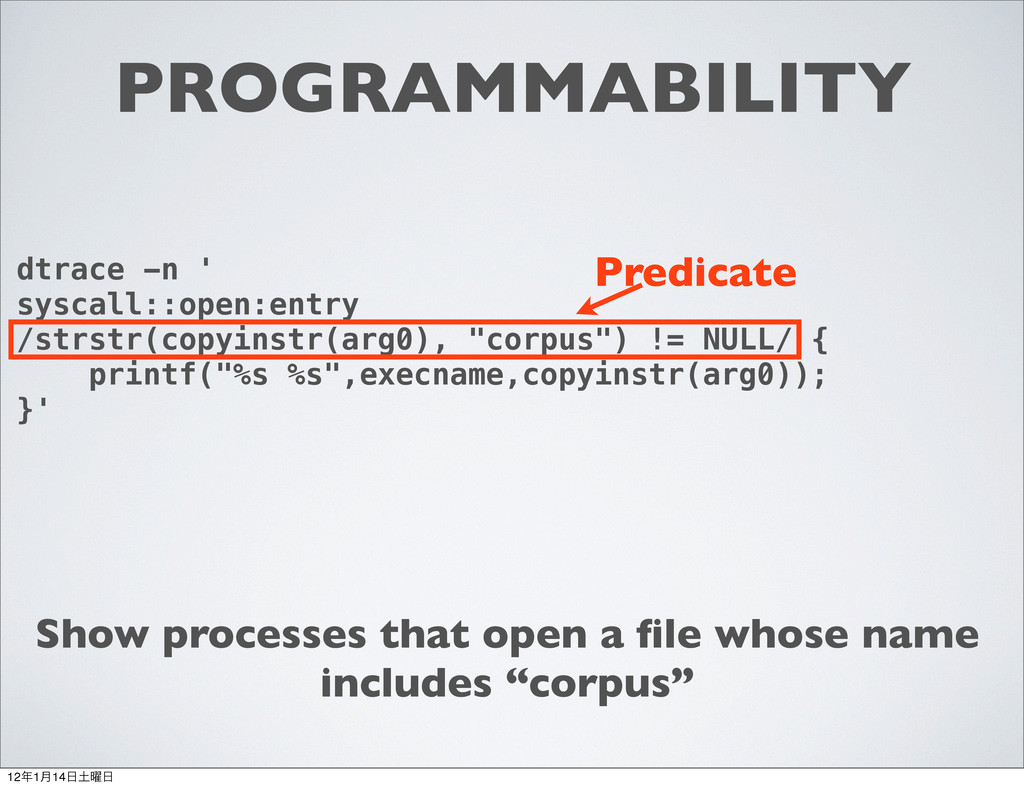
PROGRAMMABILITY dtrace -n ' syscall::open:entry /strstr(copyinstr(arg0), "corpus") != NULL/ {
printf("%s %s",execname,copyinstr(arg0)); }' Show processes that open a file whose name includes “corpus” Predicate 121݄14༵
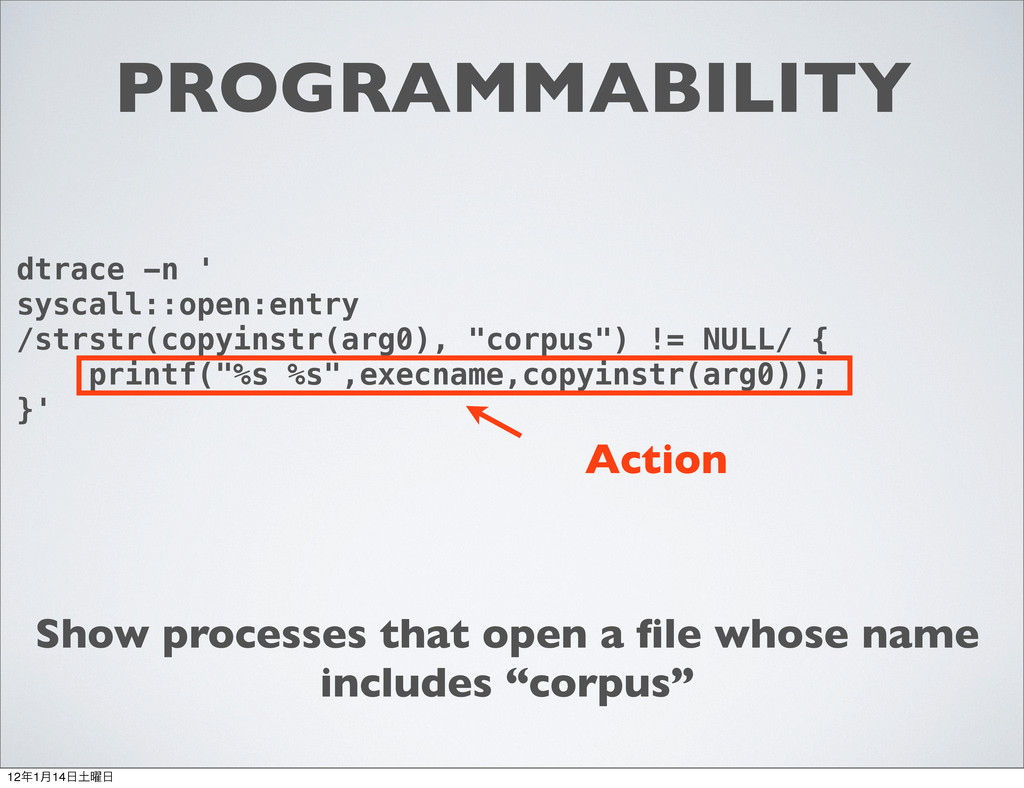
PROGRAMMABILITY dtrace -n ' syscall::open:entry /strstr(copyinstr(arg0), "corpus") != NULL/ {
printf("%s %s",execname,copyinstr(arg0)); }' Show processes that open a file whose name includes “corpus” Action 121݄14༵
PROGRAMMABILITY dtrace -n ' syscall::open:entry /strstr(copyinstr(arg0), "corpus") != NULL/ {
printf("%s %s",execname,copyinstr(arg0)); }' Show processes that open a file whose name includes “corpus” 121݄14༵
DTrace instrumentation points ɾKernel function calls/returns (syscalls too) ɾPerl function
calls/returns ɾSQL execution ɾthreads ɾsignals ɾmany more PROBES 121݄14༵
THE COOL DEMO HEY, FORGETFUL! DEMO THE GPG THING 121݄14༵
PROFILER Devel::NYTProf kicks ass 121݄14༵
PROFILER But there’s more than one way to do it
121݄14༵
PROFILER DEMO: syscalls intuit_method 121݄14༵
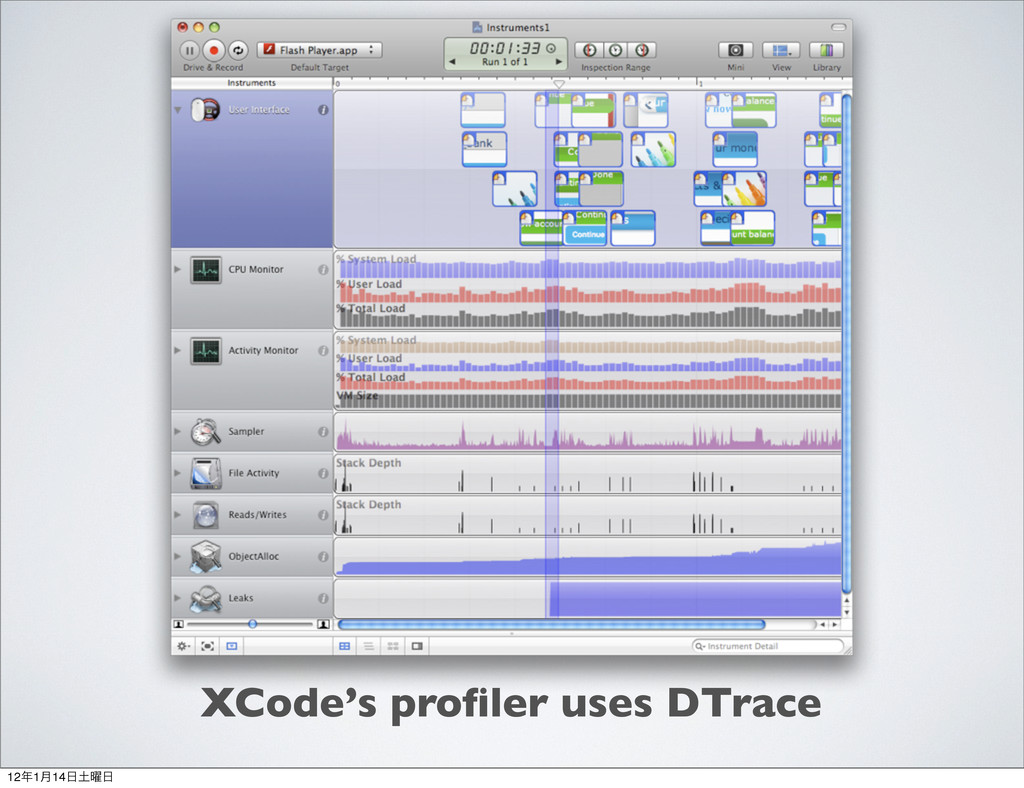
XCode’s profiler uses DTrace 121݄14༵
121݄14༵
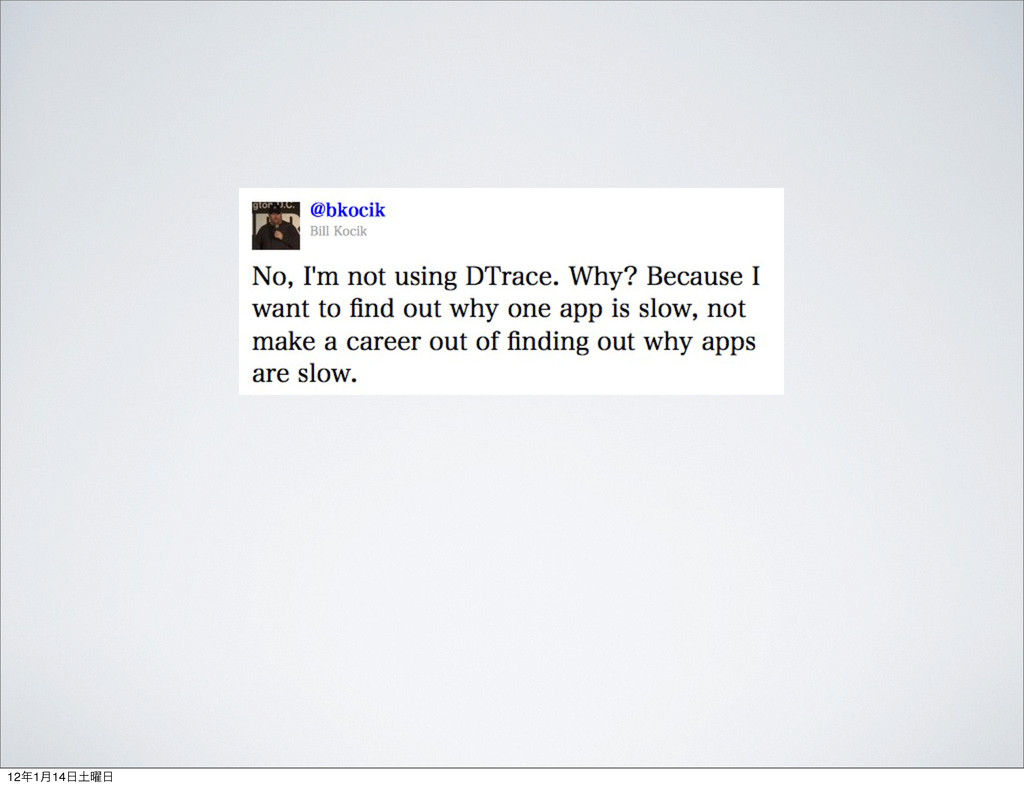
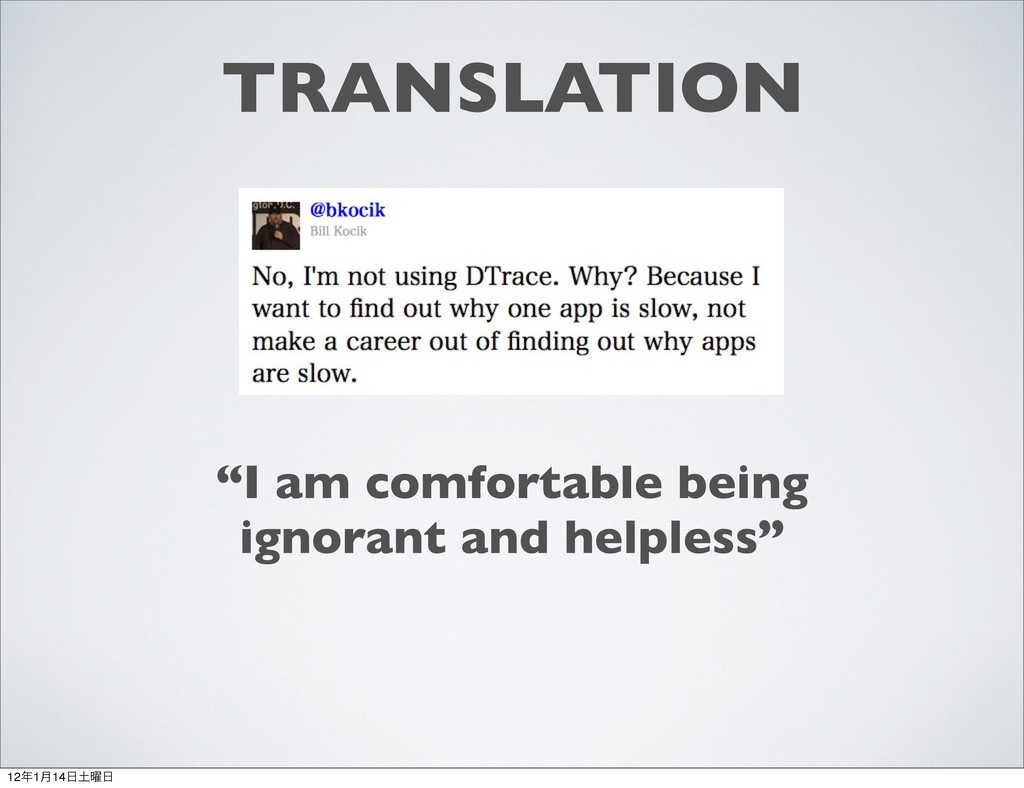
TRANSLATION “I am comfortable being ignorant and helpless” 121݄14༵
DEBUGGER Request Tracker (e.g. rt.cpan.org) was failing tests on mod_perl.
On only my computer. Probably because of all the Japanese. 121݄14༵
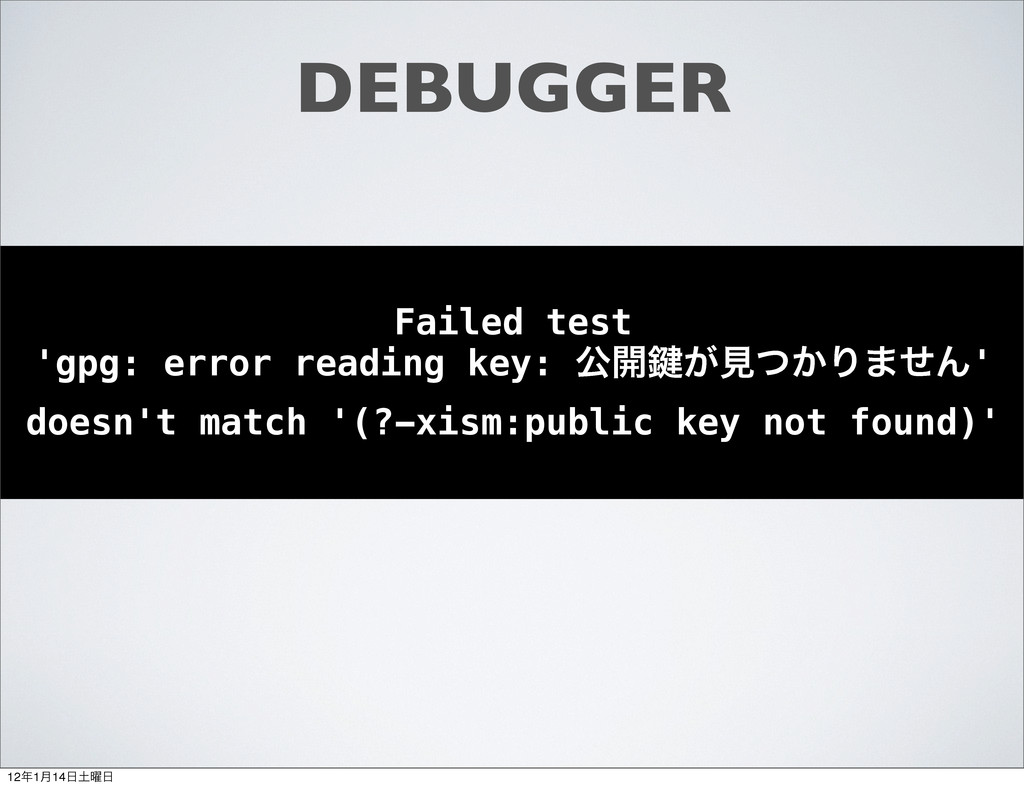
DEBUGGER Failed test 'gpg: error reading key: ެ։伴͕ݟ͔ͭΓ·ͤΜ' doesn't match
'(?-xism:public key not found)' 121݄14༵
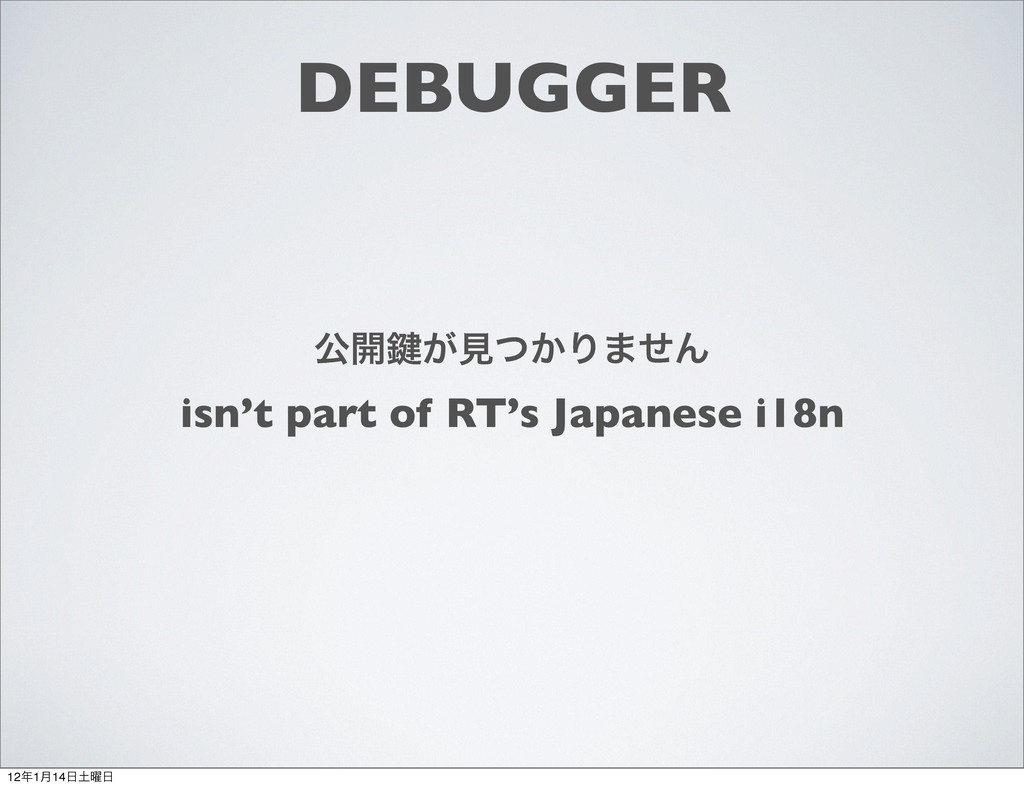
DEBUGGER ެ։伴͕ݟ͔ͭΓ·ͤΜ isn’t part of RT’s Japanese i18n 121݄14༵
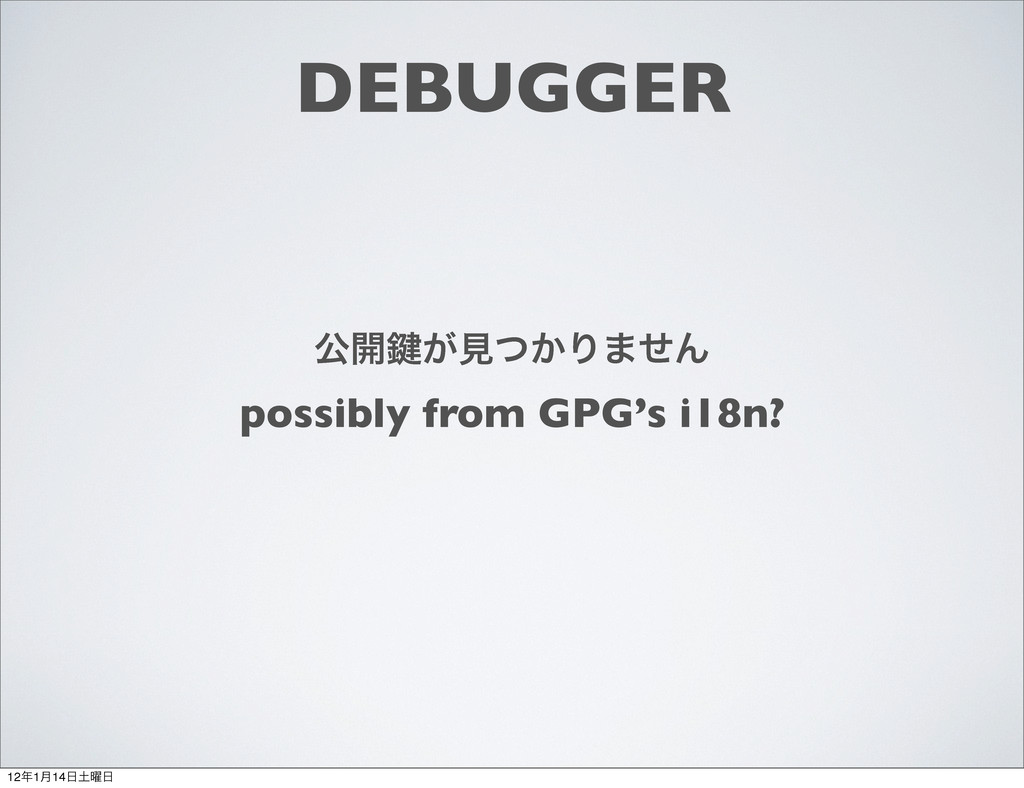
DEBUGGER ެ։伴͕ݟ͔ͭΓ·ͤΜ possibly from GPG’s i18n? 121݄14༵
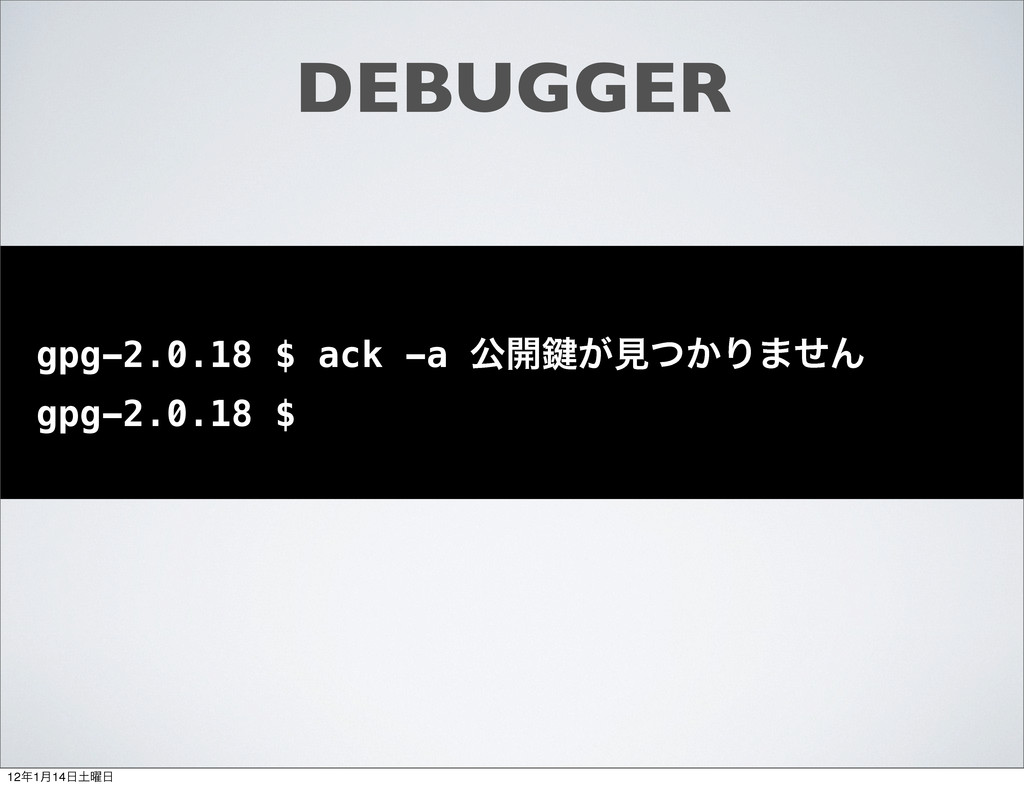
DEBUGGER gpg-2.0.18 $ ack -a ެ։伴͕ݟ͔ͭΓ·ͤΜ gpg-2.0.18 $ 121݄14༵
DEBUGGER gpg-2.0.18 $ echo "ެ։伴͕ݟ͔ͭΓ·ͤΜ" | iconv -f UTF-8 -t
EUCJP | xargs ack -ao | iconv -f EUCJP -t UTF-8 Binary file po/ja.gmo matches po/ja.po:2965:ެ։伴͕ݟ͔ͭΓ·ͤΜ po/ja.po:6525:ެ։伴͕ݟ͔ͭΓ·ͤΜ po/ja.po:8311:ެ։伴͕ݟ͔ͭΓ·ͤΜ gpg-2.0.18 $ 121݄14༵
DEBUGGER probably a mis-set $LANG, $LC_ALL? 121݄14༵
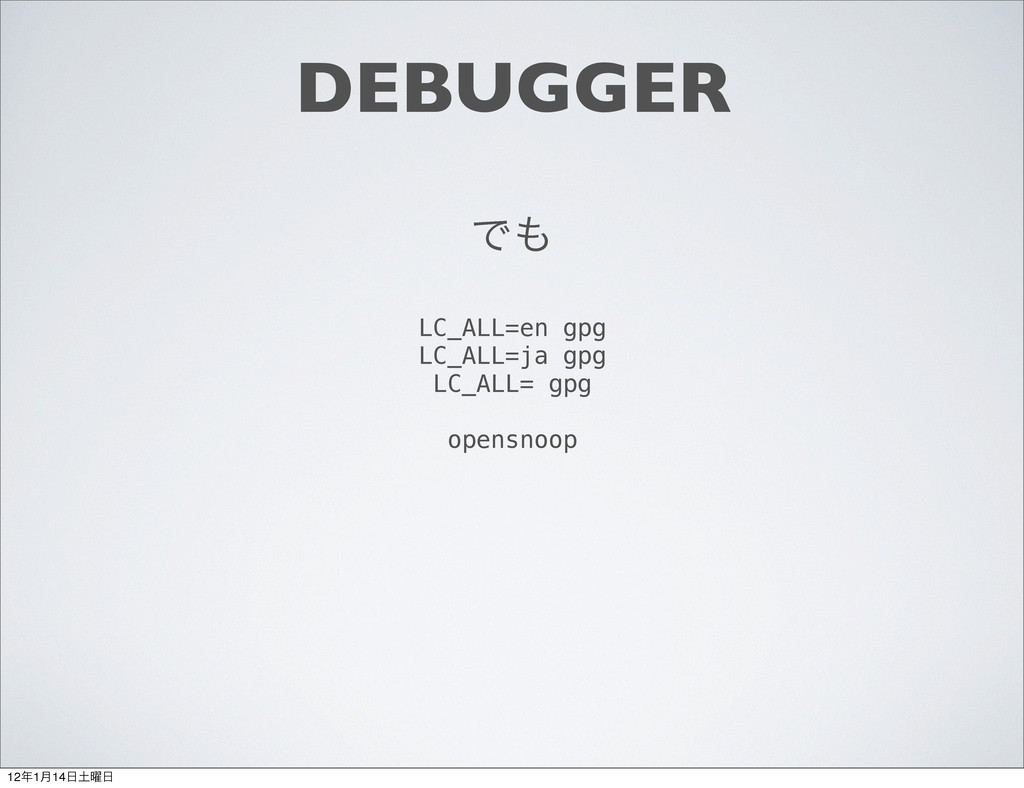
DEBUGGER Ͱ LC_ALL=en gpg LC_ALL=ja gpg LC_ALL= gpg opensnoop 121݄14༵
DEBUGGER Without DTrace, woulda had to add print statements to
GPG itself 121݄14༵
DEBUGGER then compiled it 121݄14༵
DEBUGGER then installed it 121݄14༵
DEBUGGER then repeated a couple of times because I’m a
“throw everything til something sticks” kinda guy 121݄14༵
DEBUGGER then cleaned up after all that hot mess 121݄14༵
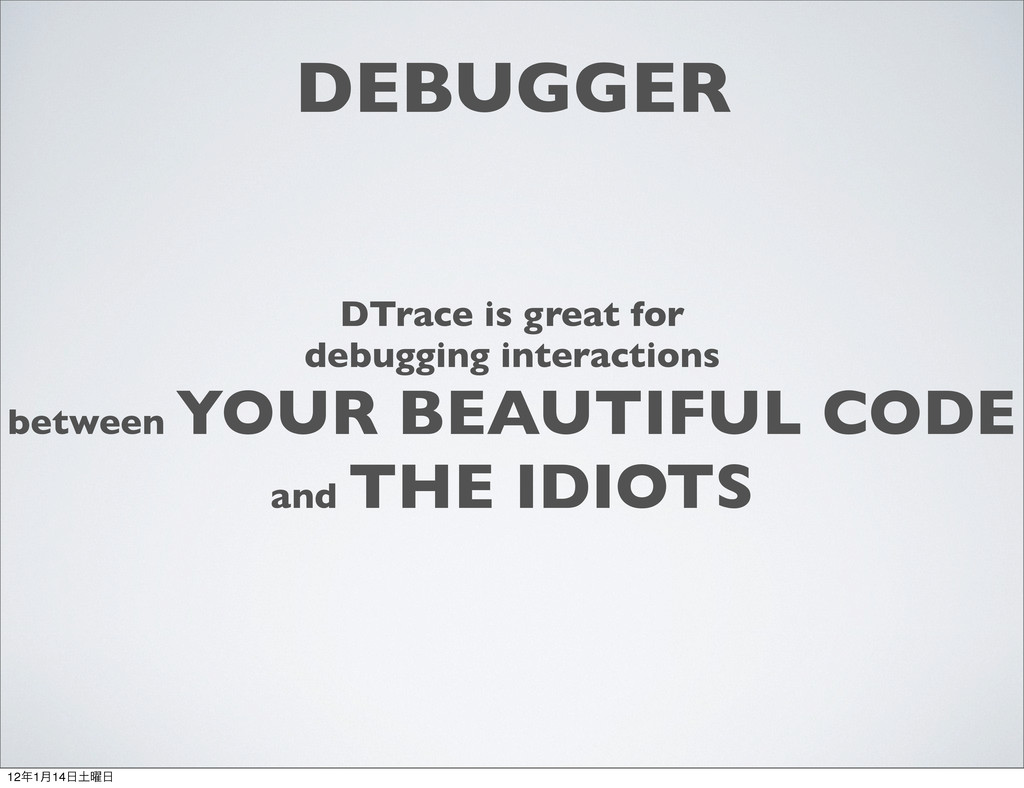
DEBUGGER DTrace is great for debugging interactions between programs 121݄14༵
DEBUGGER DTrace is great for debugging interactions between YOUR BEAUTIFUL
CODE and THE IDIOTS 121݄14༵
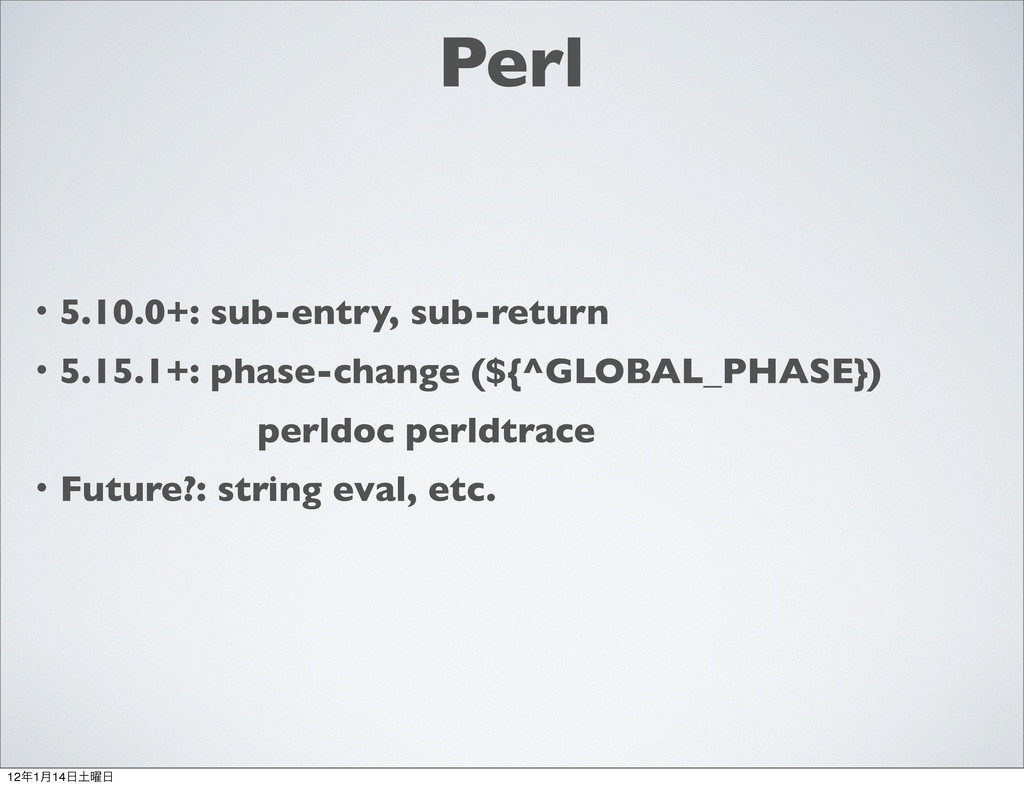
Perl ɾ5.10.0+: sub-entry, sub-return ɾ5.15.1+: phase-change (${^GLOBAL_PHASE}) ɹ ɾFuture?: string
eval, etc. perldoc perldtrace 121݄14༵
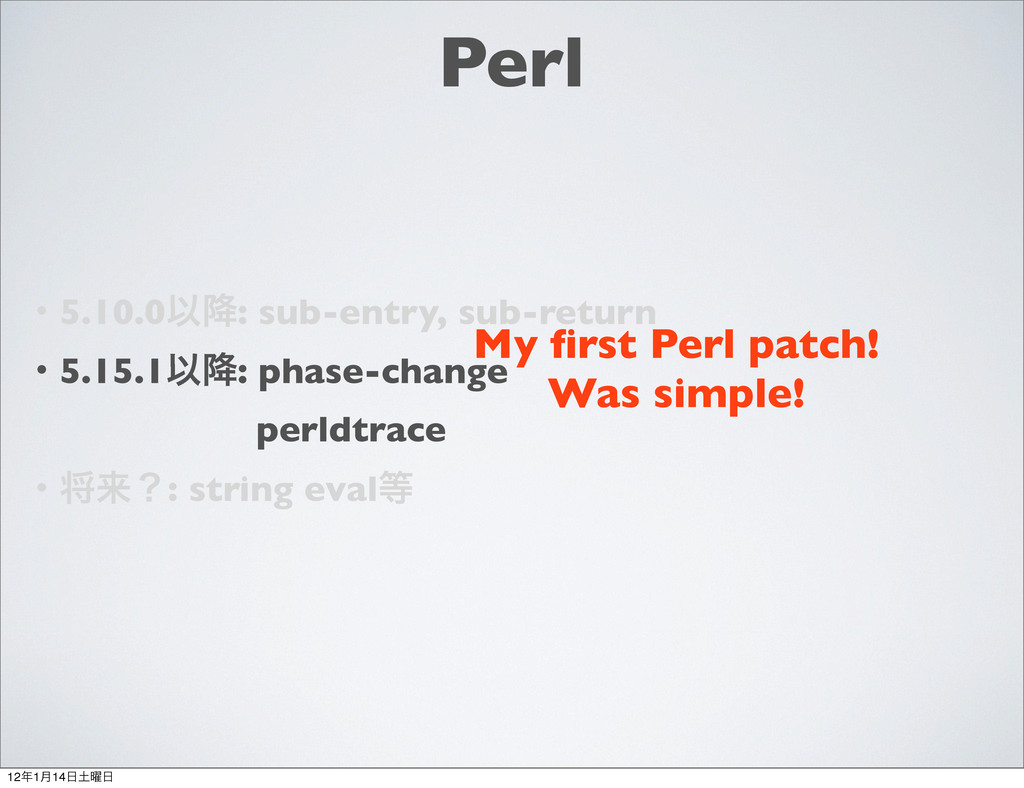
Perl ɾ5.10.0Ҏ߱: sub-entry, sub-return ɾ5.15.1Ҏ߱: phase-change ɹ ɾকདྷʁ: string eval
My first Perl patch! Was simple! perldtrace 121݄14༵
QUESTIONS? ຊޠͰ̤̠Ͱ͢ʂ slides: http://twitter.com/sartak 121݄14༵