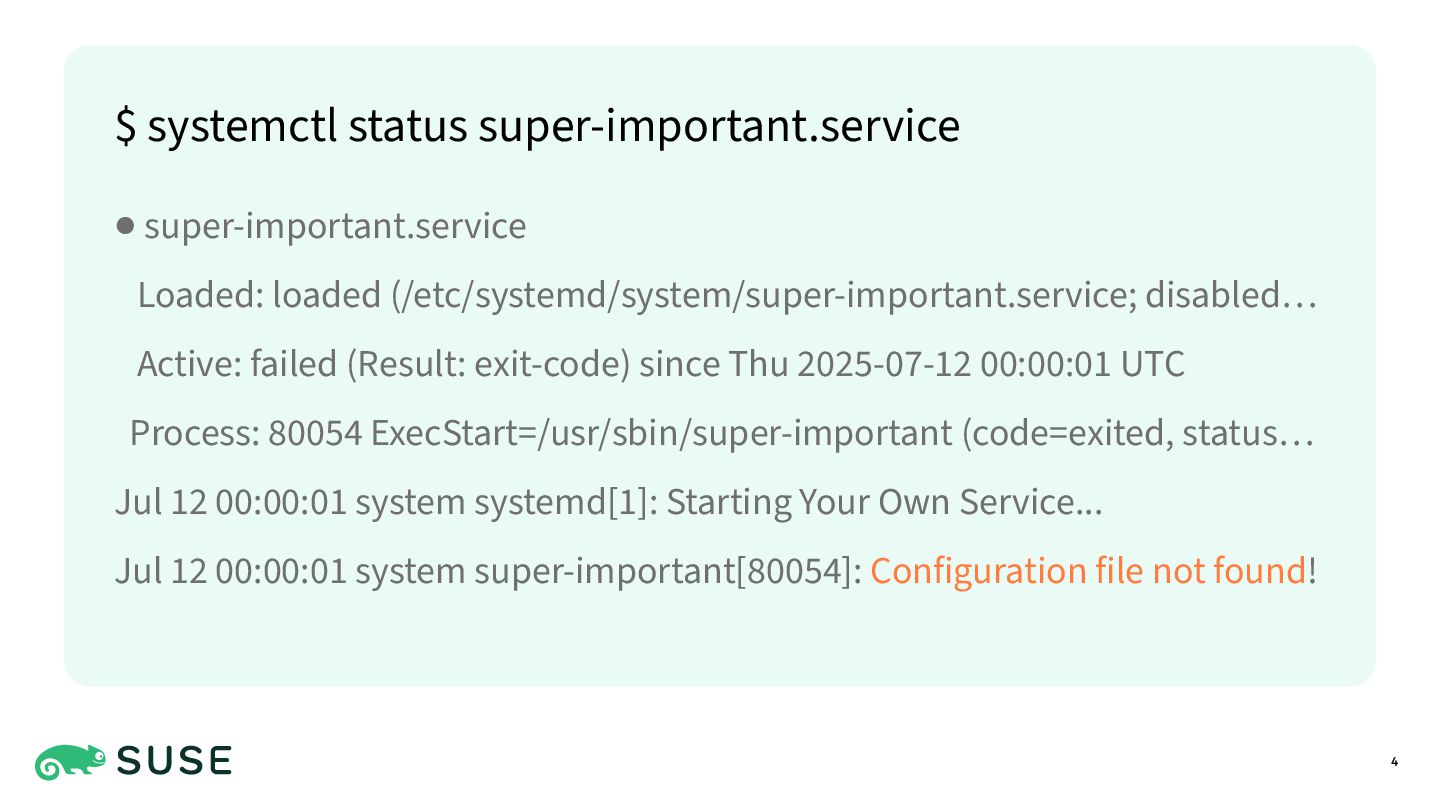
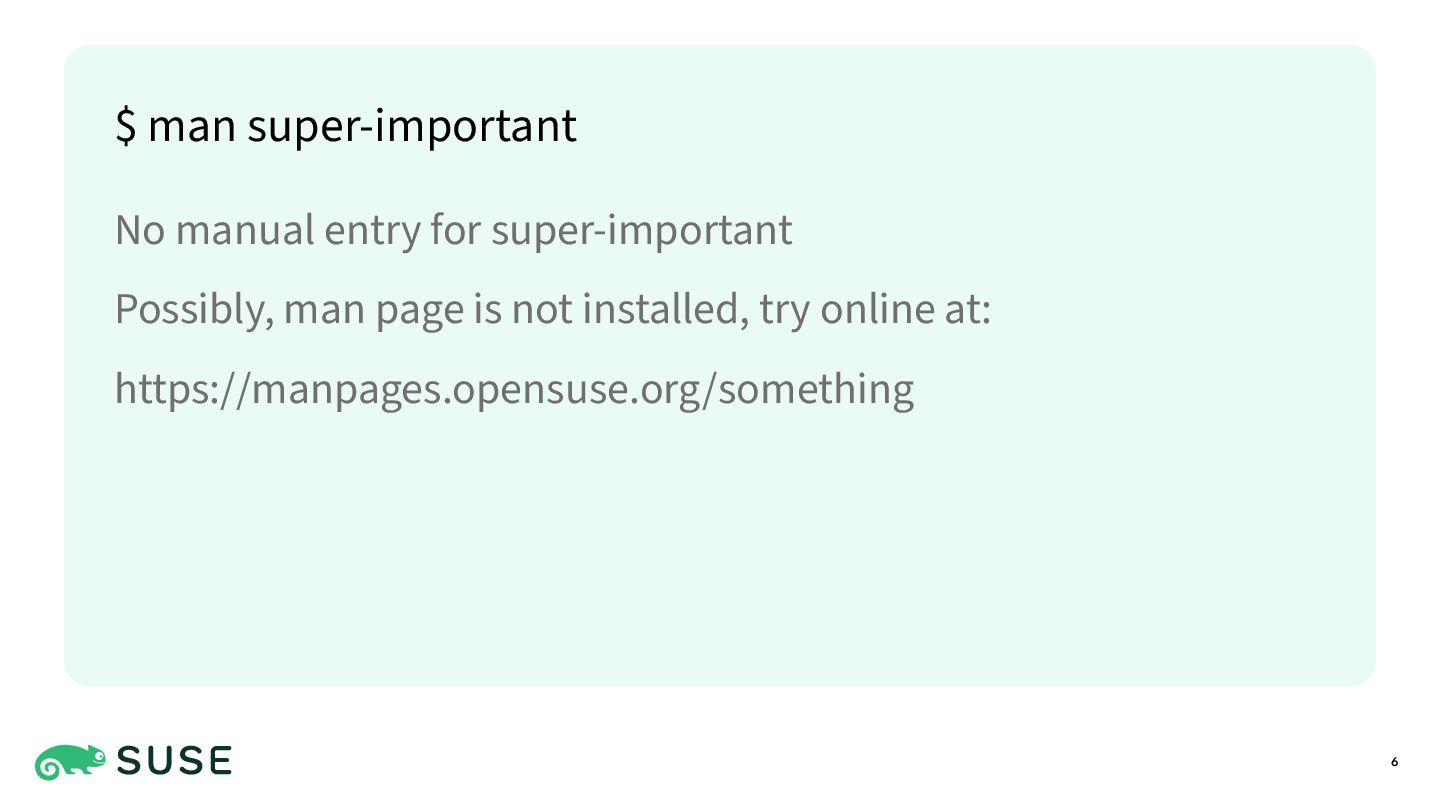
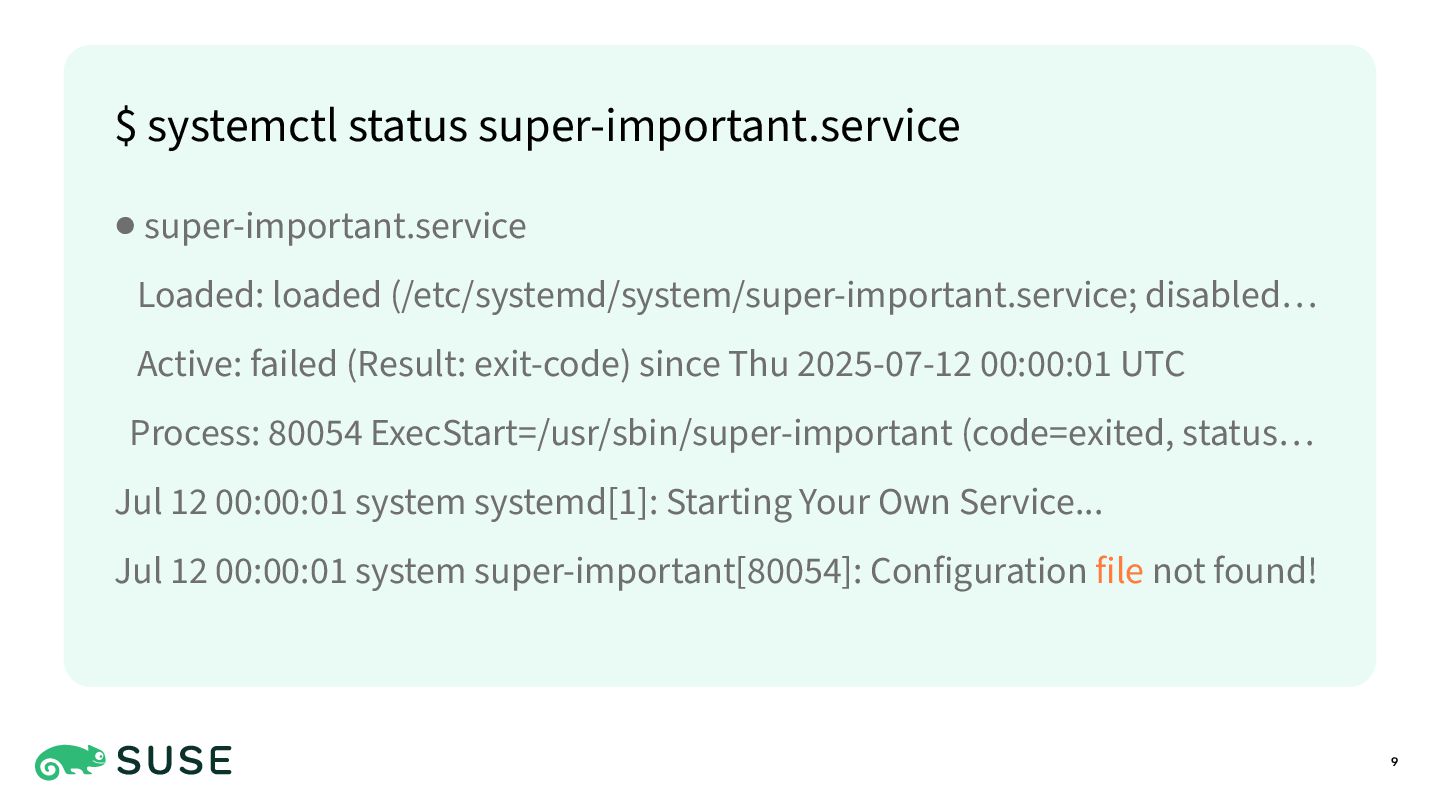
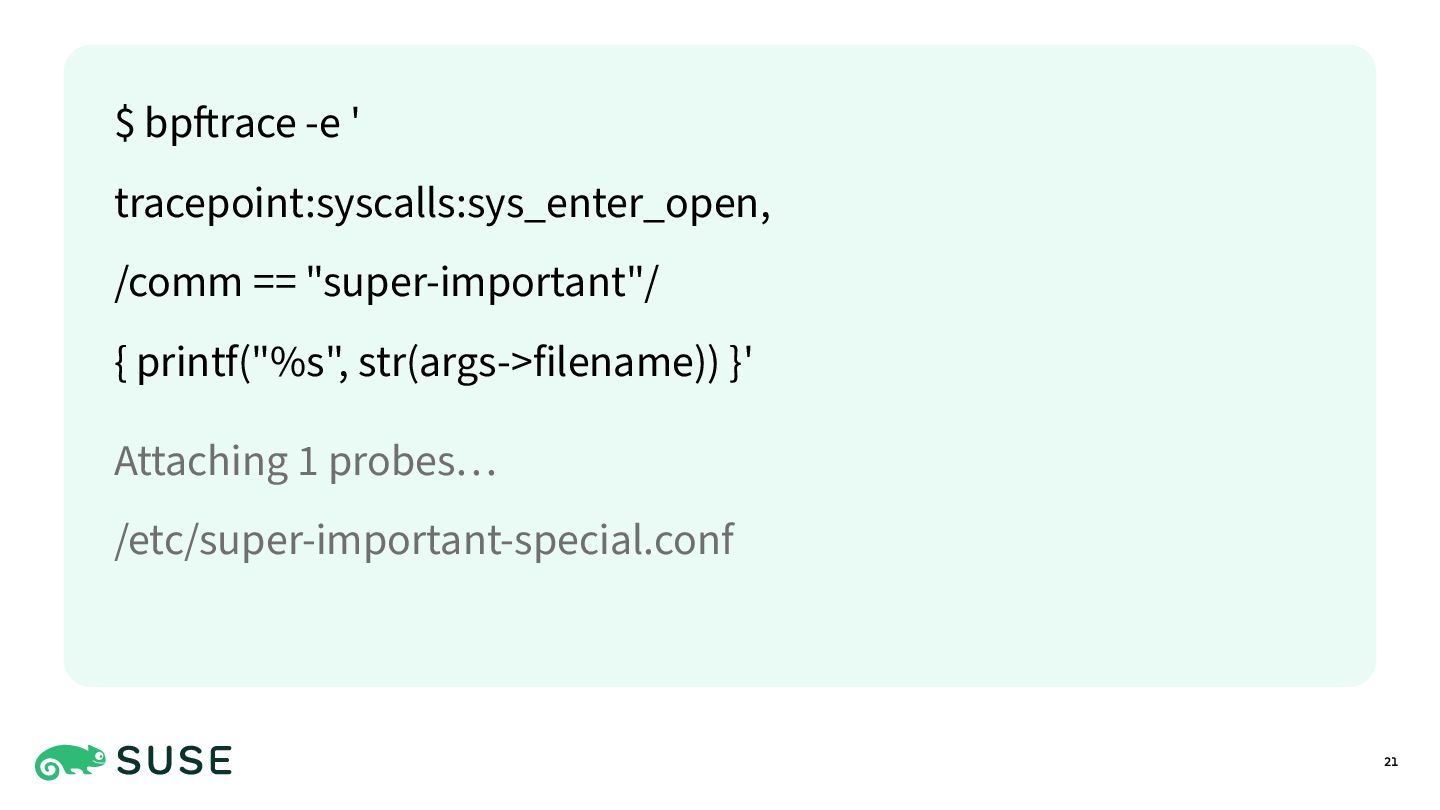
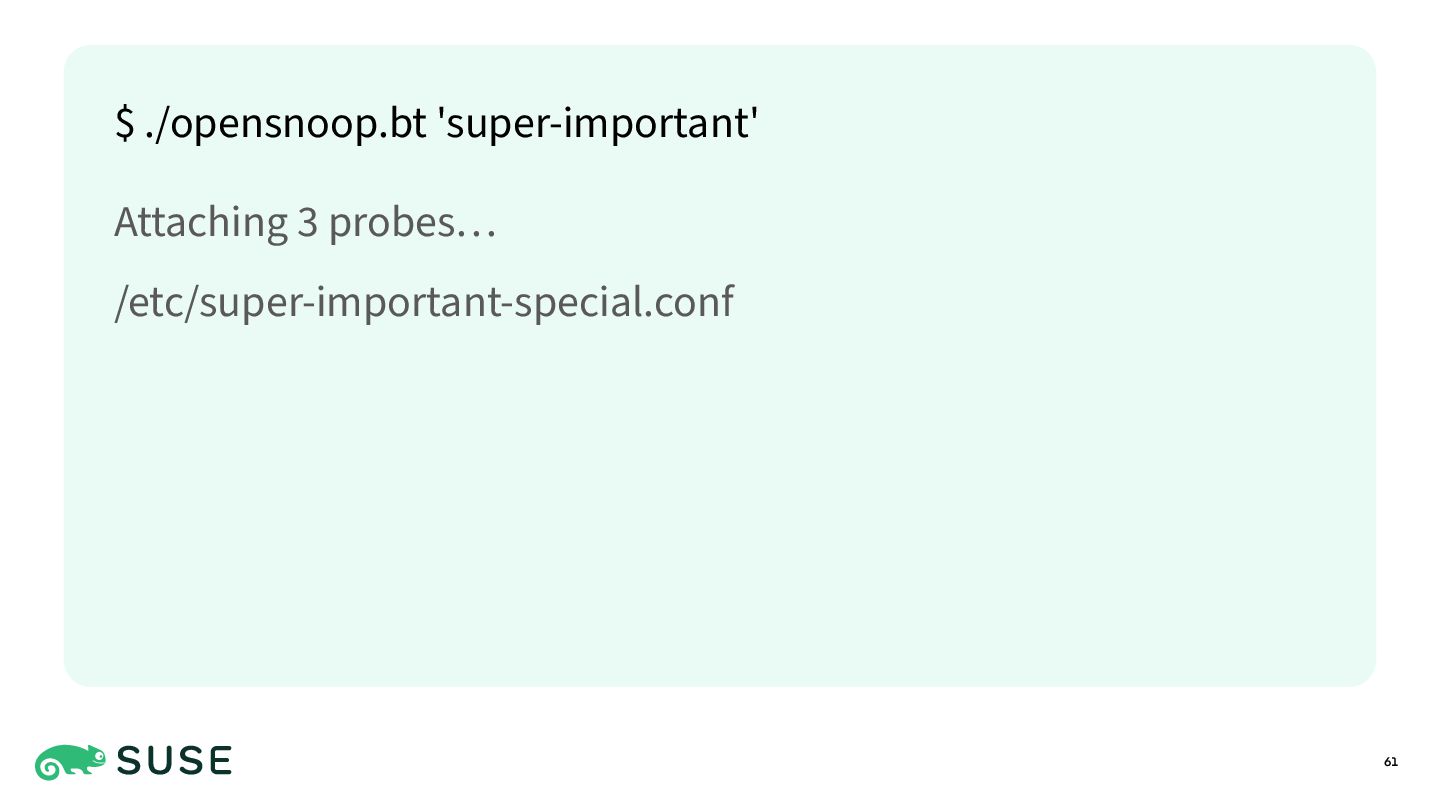
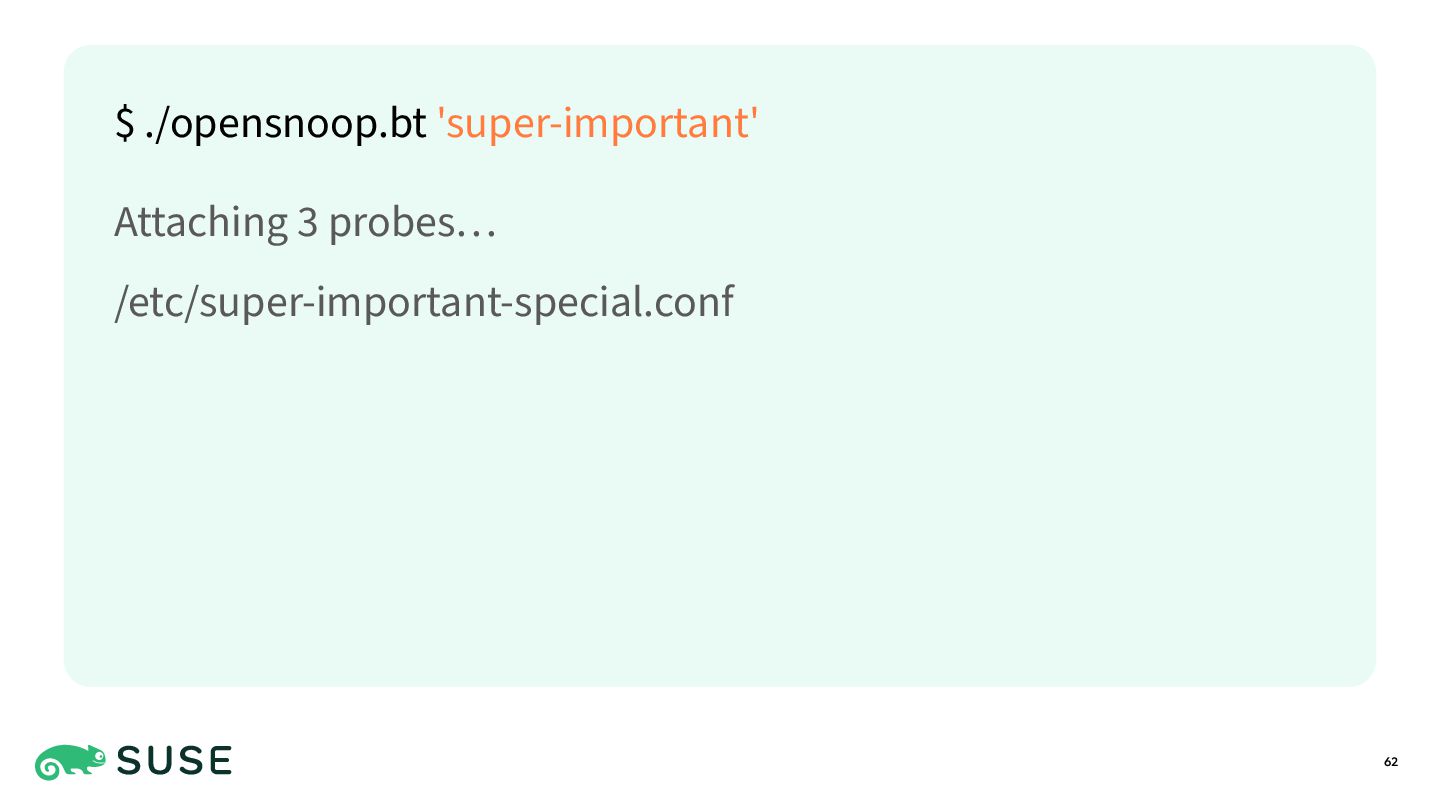
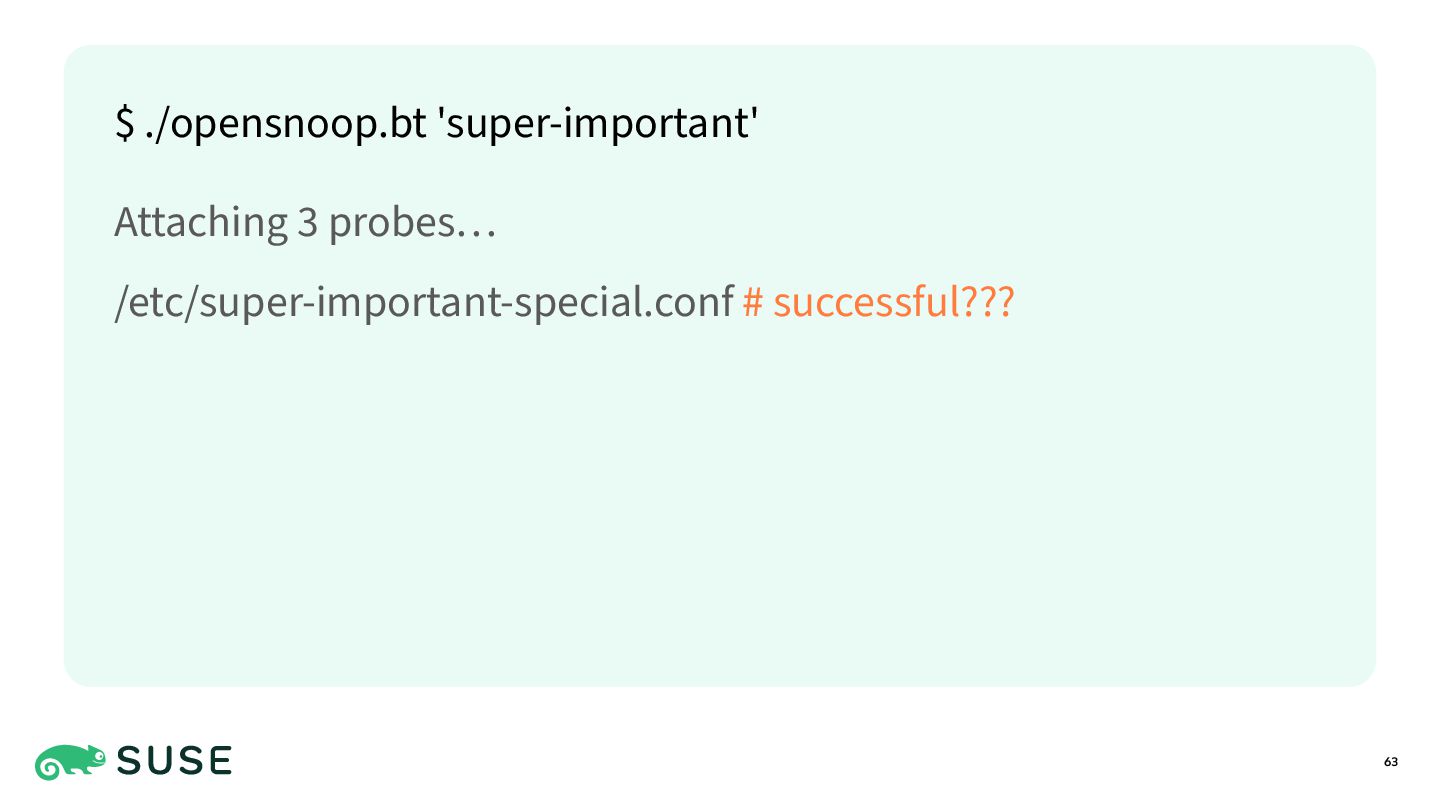
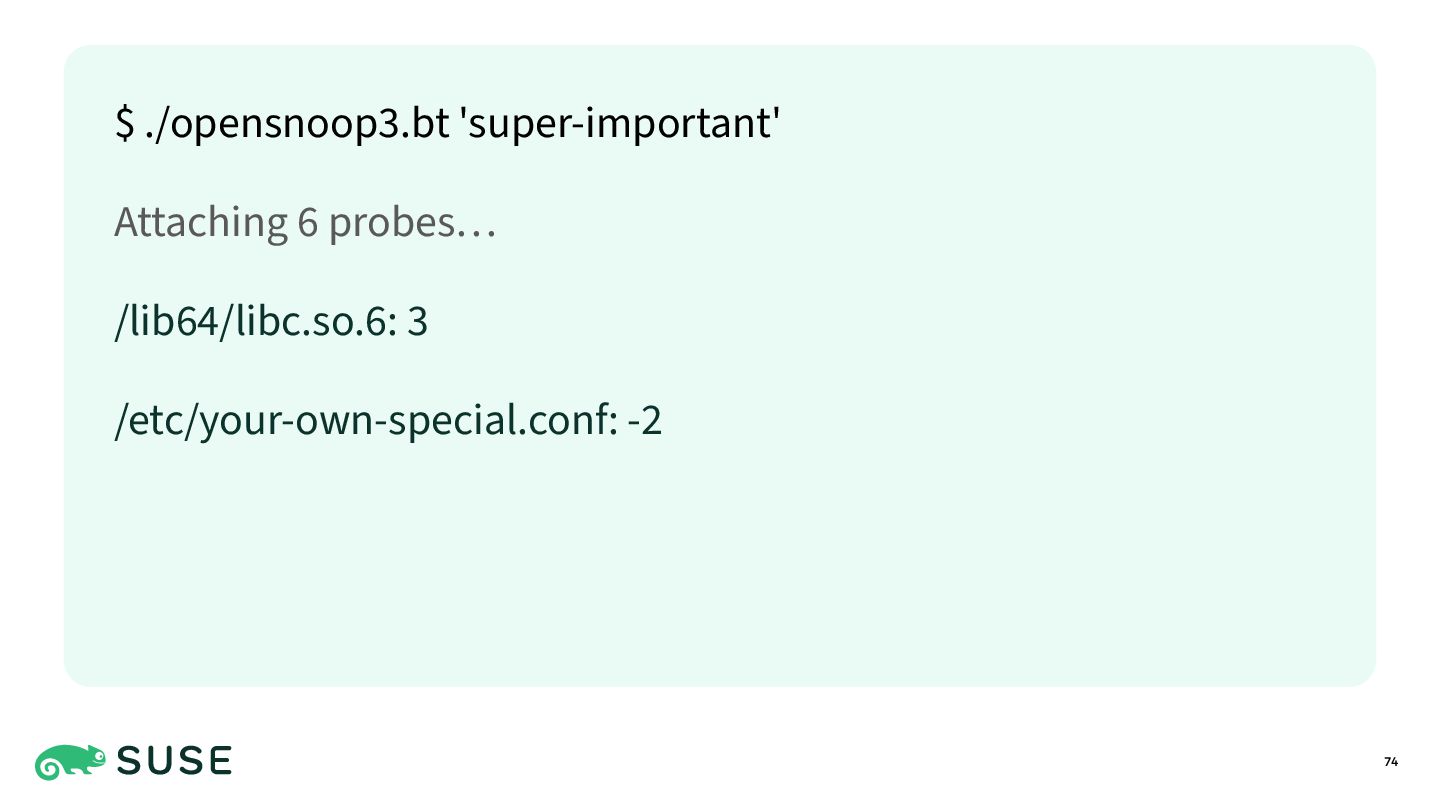
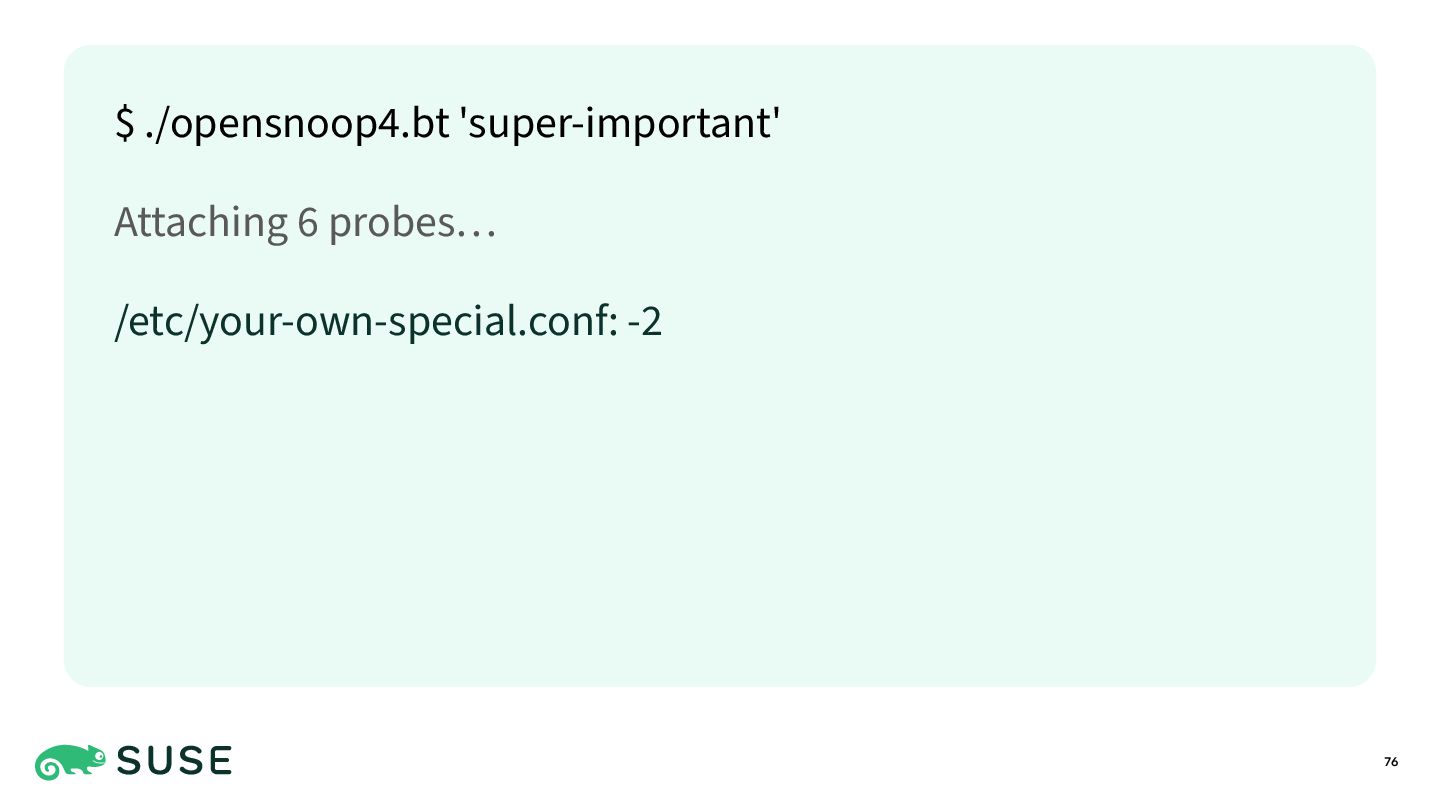
Active: failed (Result: exit-code) since Thu 2025-07-12 00:00:01 UTC Process: 80054 ExecStart=/usr/sbin/super-important (code=exited, status… Jul 12 00:00:01 system systemd[1]: Starting Your Own Service... Jul 12 00:00:01 system super-important[80054]: Configuration file not found! 4
Active: failed (Result: exit-code) since Thu 2025-07-12 00:00:01 UTC Process: 80054 ExecStart=/usr/sbin/super-important (code=exited, status… Jul 12 00:00:01 system systemd[1]: Starting Your Own Service... Jul 12 00:00:01 system super-important[80054]: Configuration file not found! 9
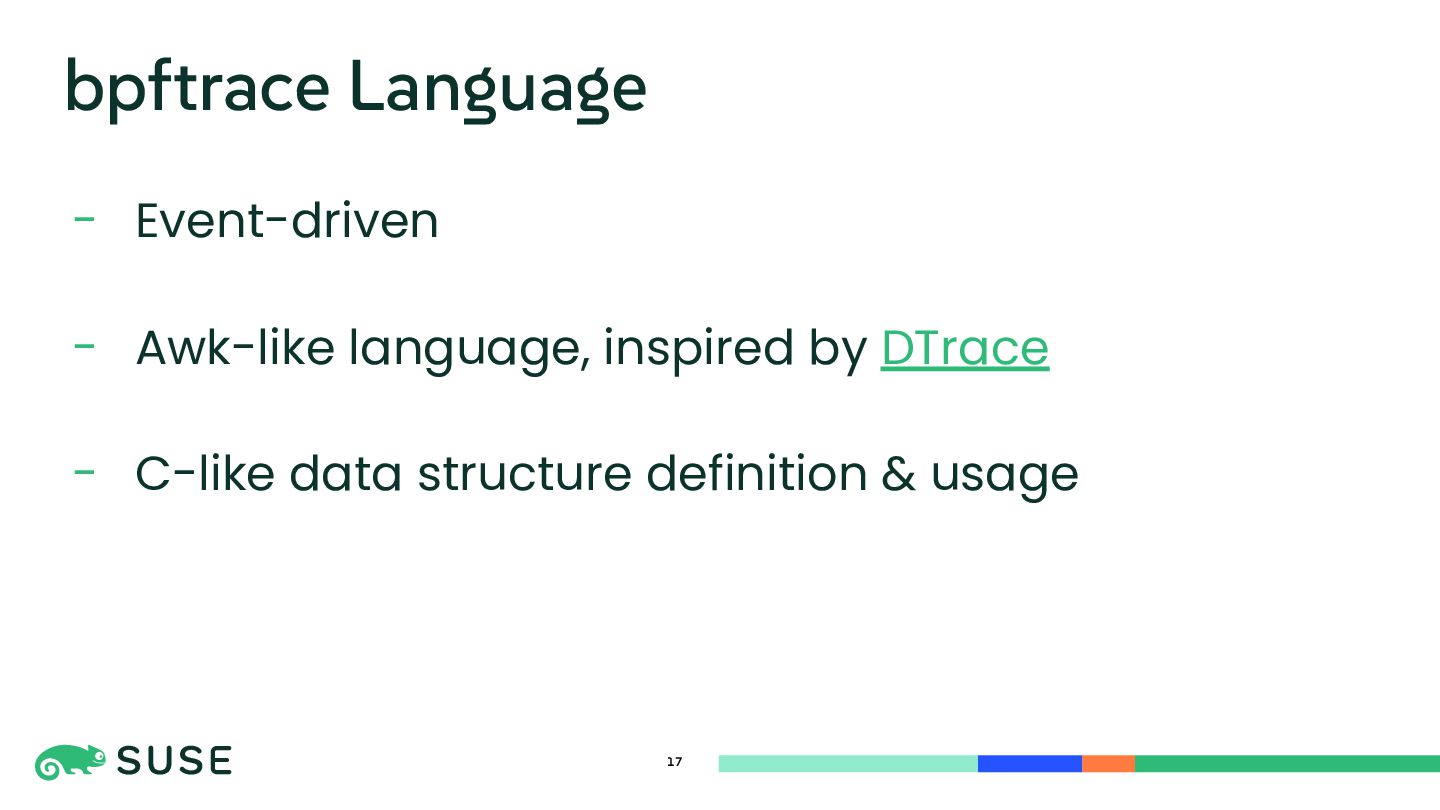
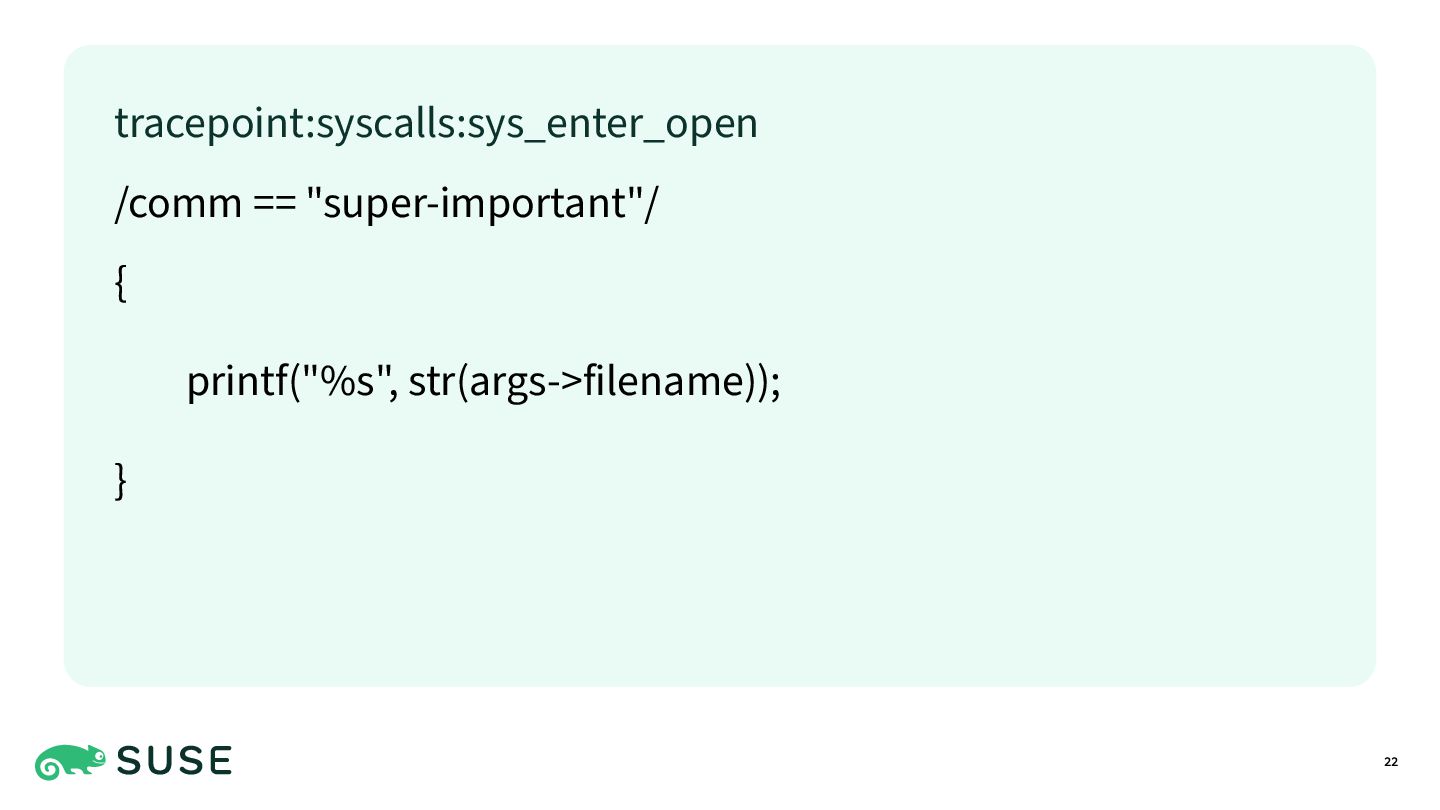
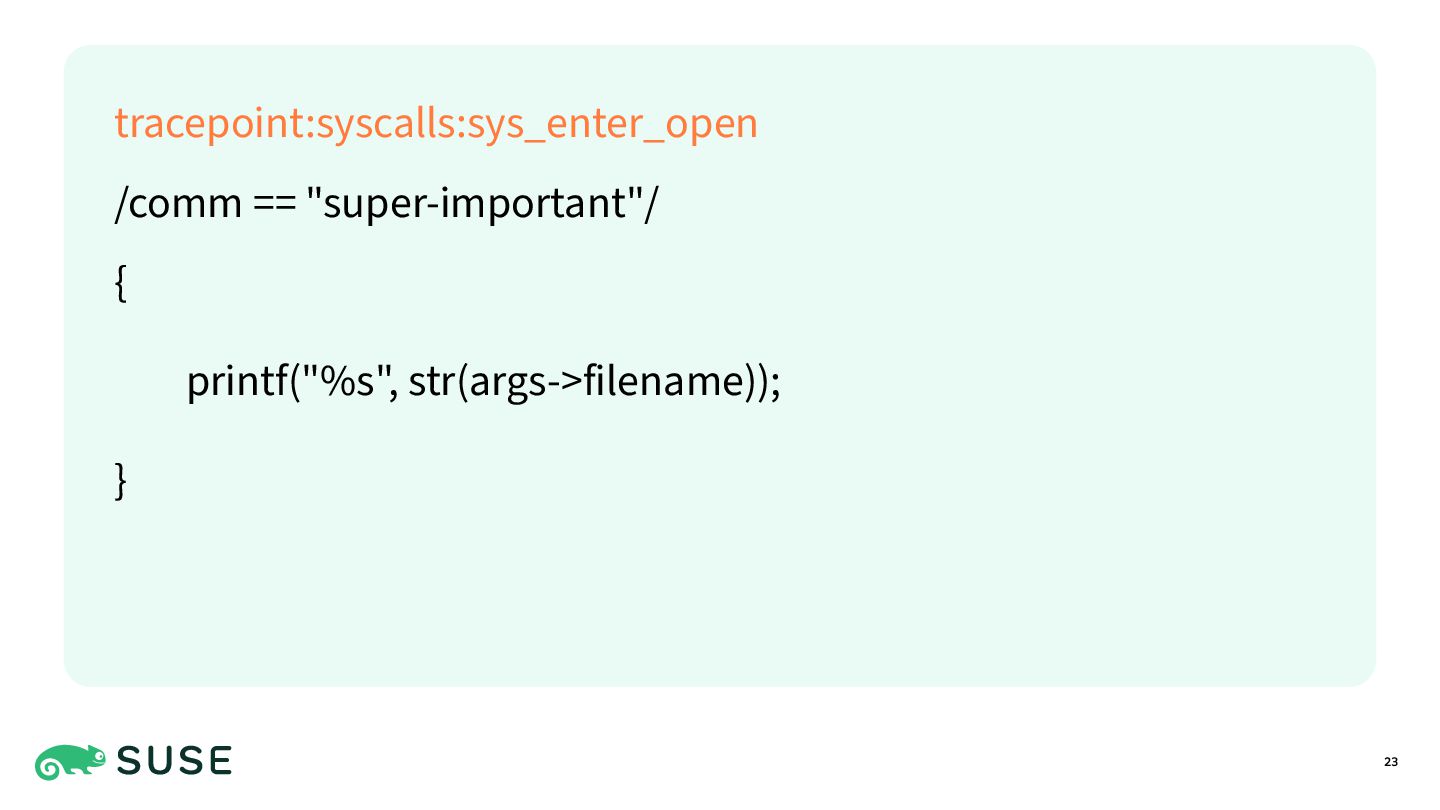
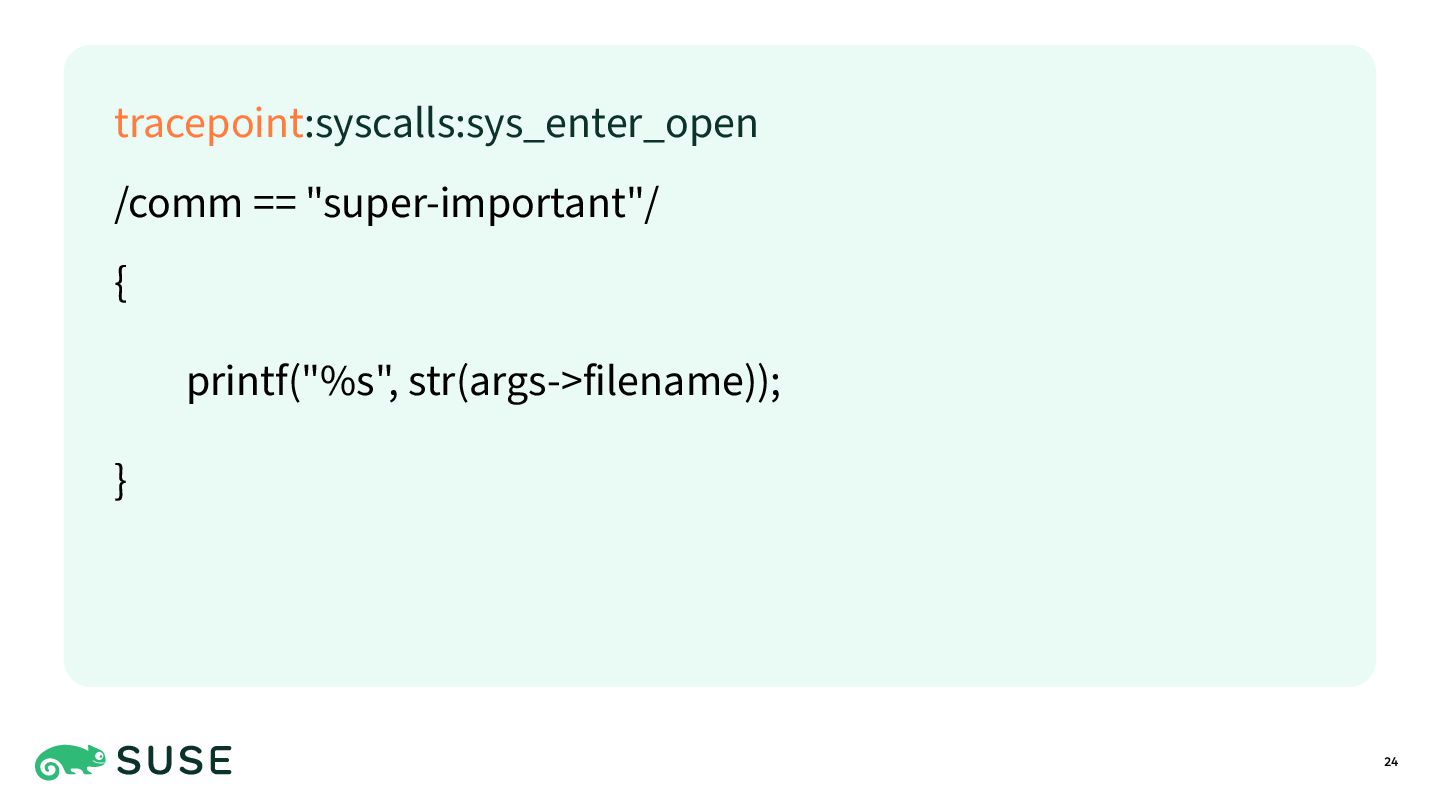
introduction to bpftrace tracing language - bpftrace: a path to the ultimate Linux tracing… Texts - A thorough introduction to bpftrace - bpftrace(8) Manual Page
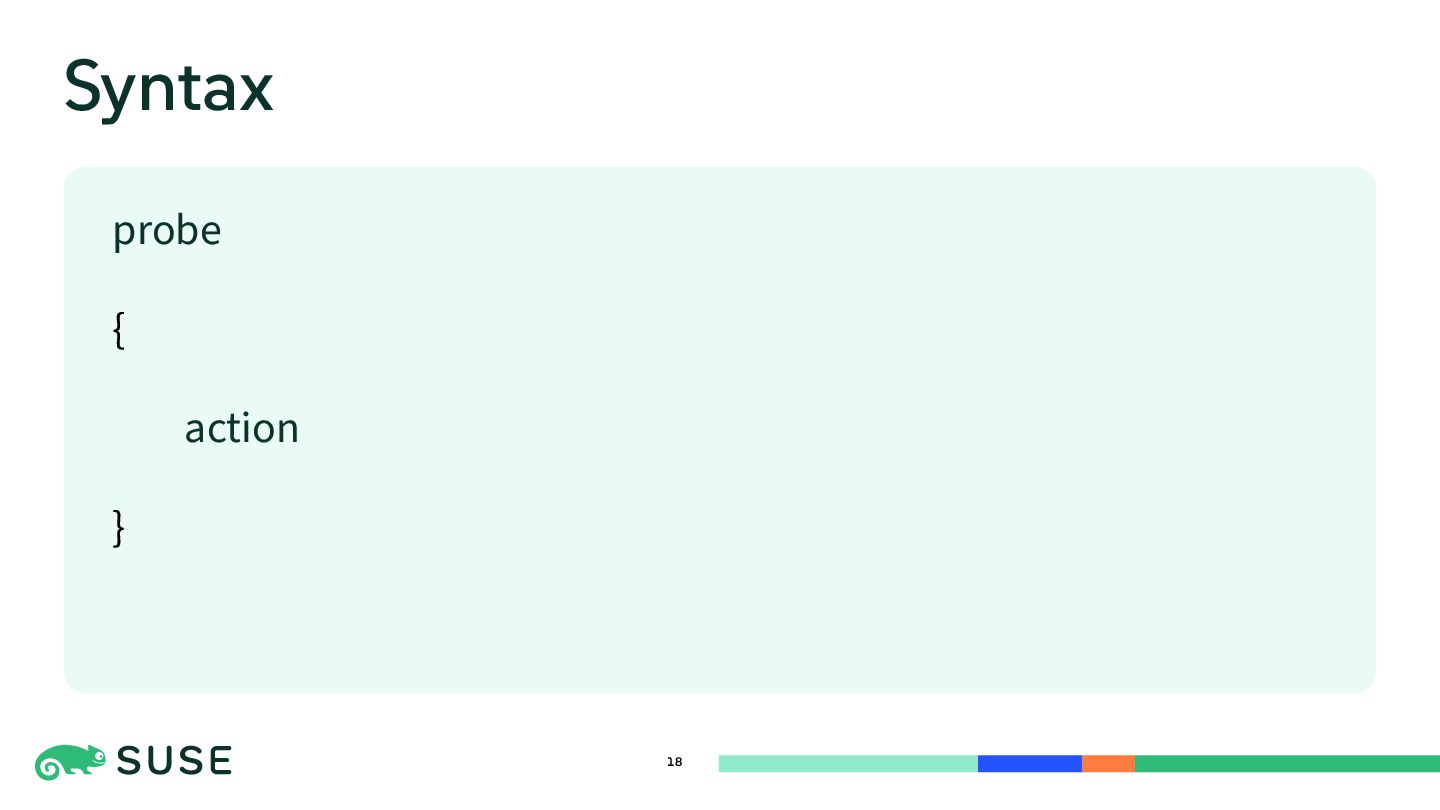
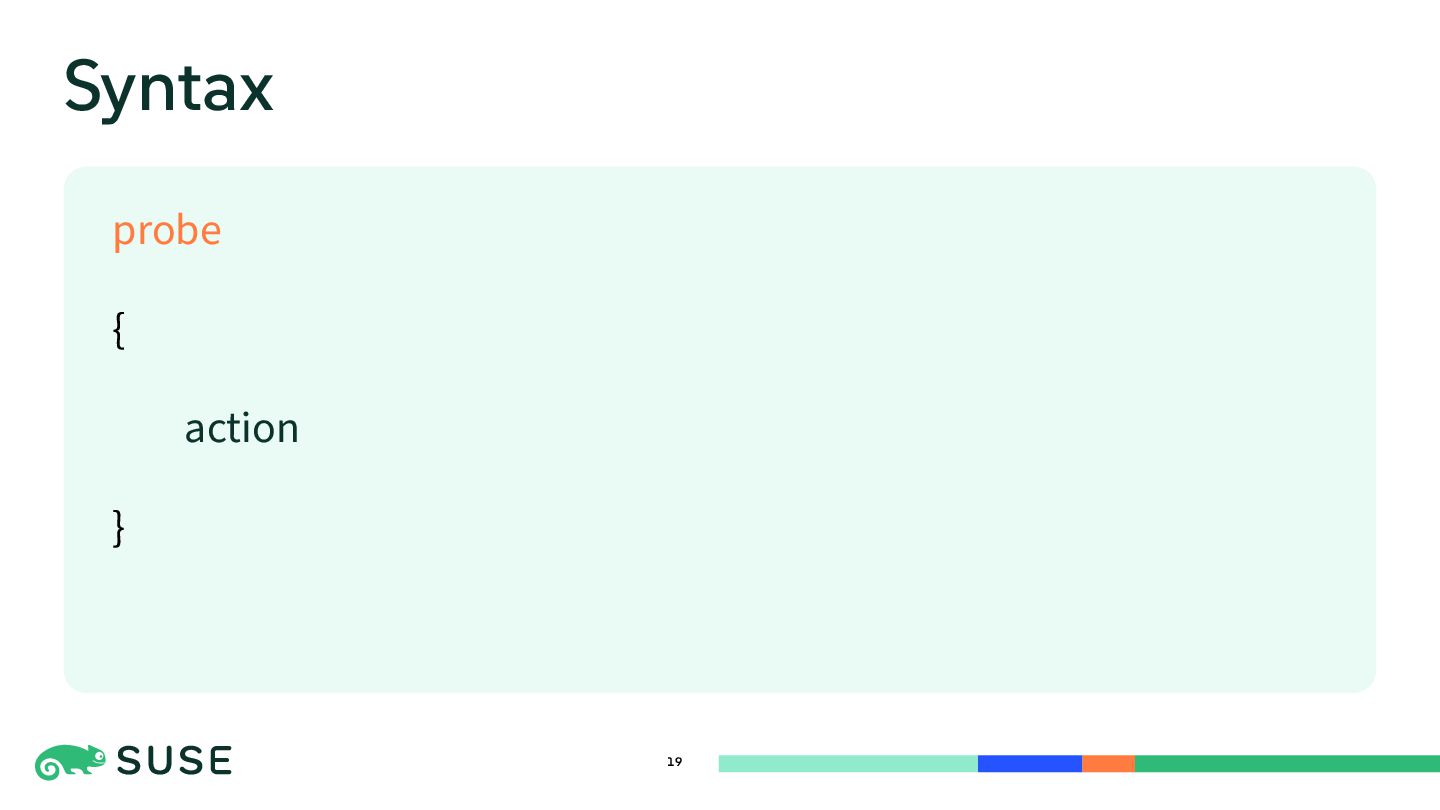
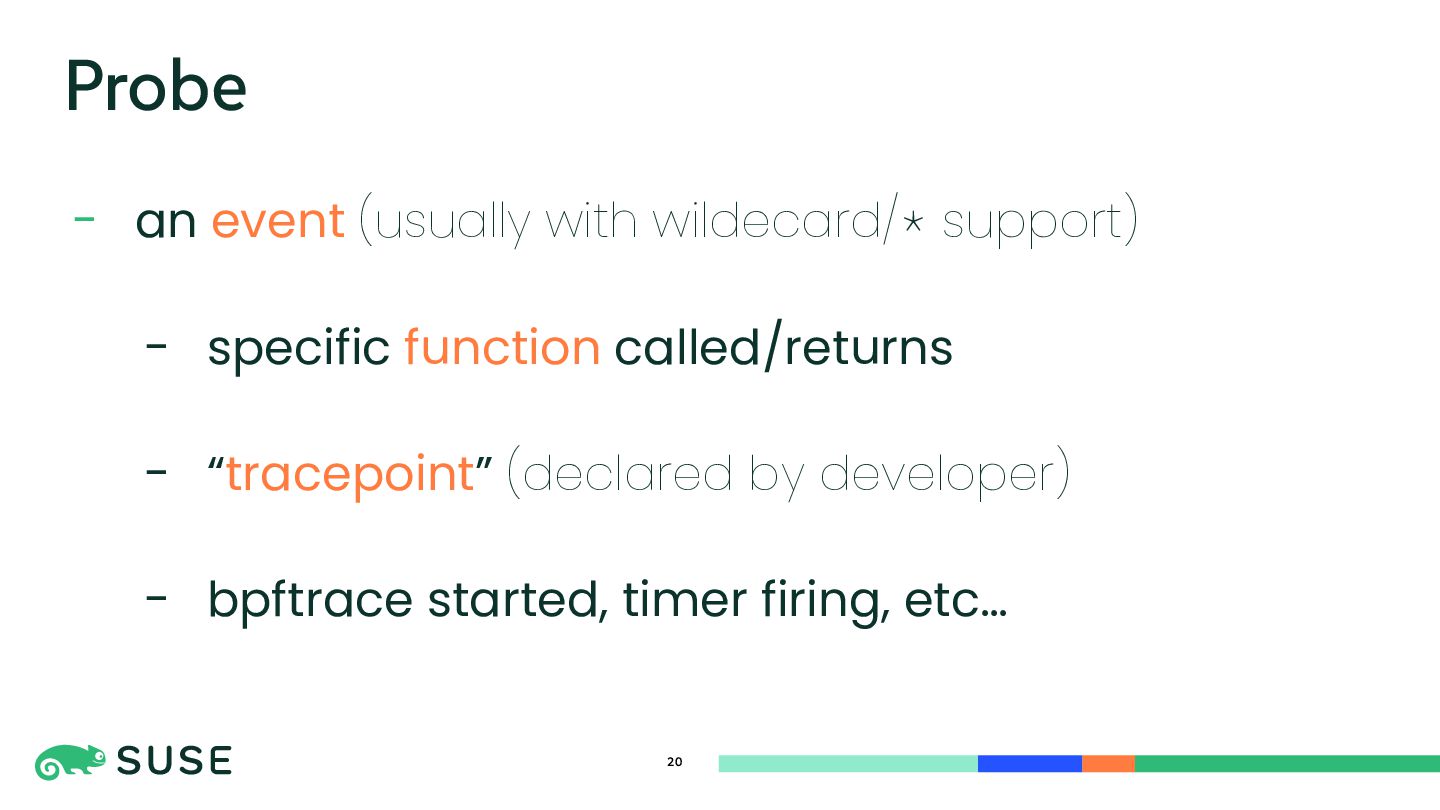
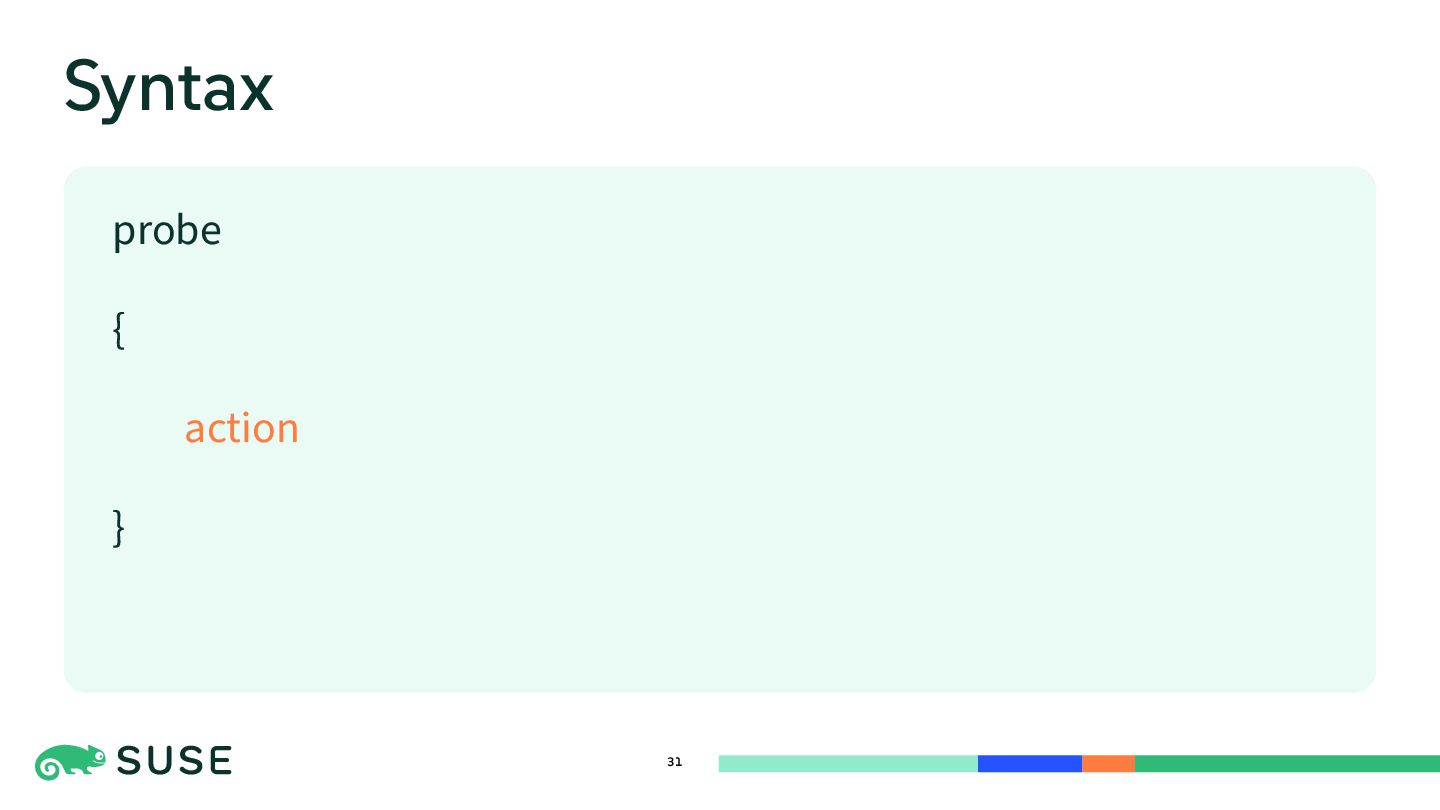
![48 Syntax probe [/predicate/] { action }](https://files.speakerdeck.com/presentations/3079bd28e02340fea23861b73d0be8c1/slide_47.jpg)
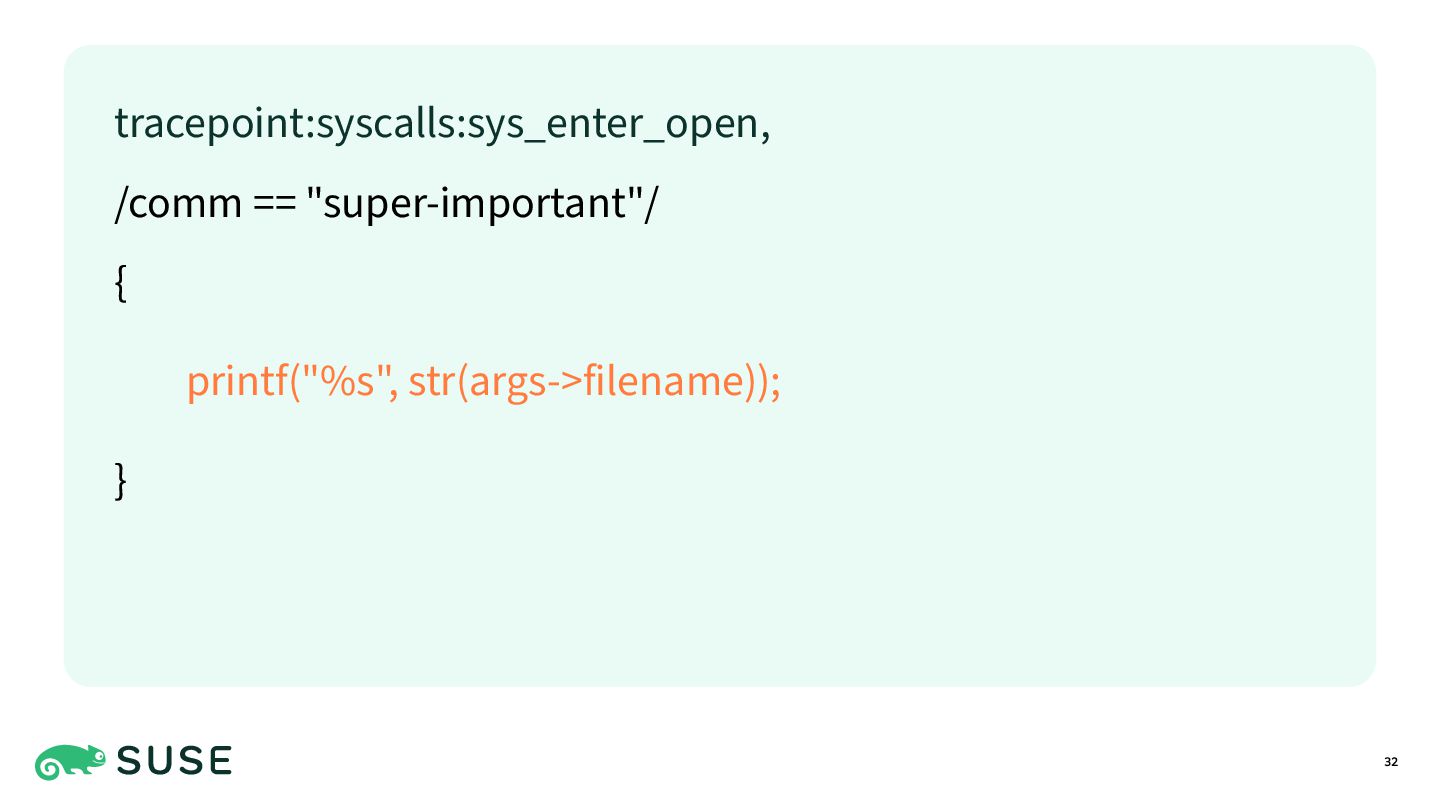
![52 Syntax probe[, probe, …] /predicate/ { action }](https://files.speakerdeck.com/presentations/3079bd28e02340fea23861b73d0be8c1/slide_51.jpg)
![77 tracepoint:syscalls:sys_exit_open, tracepoint:syscalls:sys_exit_openat* /comm == str($1) && !!@files[tid]/ { printf("%s:](https://files.speakerdeck.com/presentations/3079bd28e02340fea23861b73d0be8c1/slide_76.jpg)
![78 tracepoint:syscalls:sys_exit_open, tracepoint:syscalls:sys_exit_openat* /comm == str($1) && !!@files[tid]/ { printf("%s:](https://files.speakerdeck.com/presentations/3079bd28e02340fea23861b73d0be8c1/slide_77.jpg)