Upgrade to Pro — share decks privately, control downloads, hide ads and more …

DR2023 Jessica Crisp - So What? Connecting Research to Value

DR2023 Jessica Crisp - So What? Connecting Research to Value

uxaustralia
PRO

March 15, 2023
Tweet

More Decks by uxaustralia

Other Decks in Design

Transcript

  1. So What?
    Connecting Research to Value
    Jessica Crisp

    View Slide

  2. Design Problems
    - Not sure where to start
    - Risk of spending time on low value
    opportunities
    - Being asked…so what?

    View Slide

  3. Design Problems
    - Lack of (trustworthy) data
    - Disconnect from users
    - Managing risky assumptions
    PO Problems
    - Not sure where to start
    - Risk of spending time on low value
    opportunities
    - Being asked…so what?

    View Slide

  4. Top Down
    Bottom Up
    Breaking down large, known figures
    Building a value case from user feedback/data

    View Slide

  5. So…let’s do some research!

    View Slide

  6. So…let’s do some research!
    “One in five employees either report that their most
    recent onboarding was poor…or that they received
    no onboarding at all”
    Gallup Analytics 2021

    View Slide

  7. Step One Estimate the value ceiling with stakeholders

    View Slide

  8. Value Tree 101
    • Also referred to as a driver tree or KPI tree
    • Way of visualising how metrics connect up to higher level outcomes
    • Helps teams focus on and prioritise impactful work

    View Slide

  9. Building a
    Value Tree

    View Slide

  10. Building a
    Value Tree
    • Desired outcomes that
    are attached to a
    strategic objective
    • For example
    • Financial: Increase revenue
    • Sustainability: Carbon
    footprint
    • Strategic: Reputation
    1. Business Outcomes

    View Slide

  11. Building a
    Value Tree 1. Business Outcomes 2. Value Drivers
    • Desired outcomes that
    are attached to a
    strategic objective
    • For example
    • Financial: Increase revenue
    • Sustainability: Carbon
    footprint
    • Strategic: Reputation
    • How we are going to
    impact the business
    outcomes
    • For example…
    • Financial: Sales of X
    • Sustainability: Carbon
    emissions
    • Strategic: Awareness

    View Slide

  12. Building a
    Value Tree 1. Business Outcomes 2. Value Drivers 3. Key Metrics
    • Desired outcomes that
    are attached to a
    strategic objective
    • For example…
    • Financial: Revenue
    • Sustainability: Carbon
    footprint
    • Strategic: Reputation
    • How we are going to
    impact the business
    outcomes
    • For example…
    • Financial: Sales of X
    • Sustainability: Carbon
    emissions
    • Strategic: Awareness
    • How we are going to
    benchmark and measure
    change
    • Consider leading and
    lagging metrics

    View Slide

  13. Our value tree
    Key Metrics
    Value Drivers
    Business Outcomes
    Strategic Objective Financial
    Increase
    Revenue
    Employee
    Productivity
    Time to complete
    onboarding for
    graduates
    Time to complete
    onboarding for
    experienced hires
    Time to complete
    onboarding for
    contractors
    Decrease
    Costs
    Employee
    Retention
    ESAT
    (Leading)
    Annual Voluntary
    Turnover Rate
    (Lagging)

    View Slide

  14. What next?
    Add benchmarks Prioritise business outcomes

    View Slide

  15. T shirt sizing

    View Slide

  16. T shirt sizing Out of Scope
    CO2

    View Slide

  17. T shirt sizing Out of Scope Small
    Medium
    Large
    CO2

    View Slide

  18. T shirt sizing Out of Scope Small
    Medium
    Large
    10%-
    20%
    20%-
    40%
    40%-
    60%
    CO2

    View Slide

  19. T shirt sizing Out of Scope Small
    Medium
    Large
    10%-
    20%
    20%-
    40%
    40%-
    60%
    CO2
    Time
    (contrac
    tors)
    ESAT
    Time
    (grads)
    Time
    (exp.
    hires)

    View Slide

  20. Help!

    View Slide

  21. Questions &
    Assumptions
    Impact
    Certainty/
    Probability

    View Slide

  22. Questions &
    Assumptions
    Impact
    Certainty/
    Probability
    Onboarding
    is
    suboptimal
    It takes 2
    weeks for
    employees
    to be
    productive
    What is
    slowing
    enablement
    down?

    View Slide

  23. Step Two Verify the value with your users or customers

    View Slide

  24. • Consider what stage you are at and the level of certainty
    required
    Research
    fidelity is an
    important
    consideration.

    View Slide

  25. • Consider what stage you are at and the level of certainty
    required
    • Align with stakeholders on the value drivers and metrics
    to consider
    Research
    fidelity is an
    important
    consideration.

    View Slide

  26. • Consider what stage you are at and the level of certainty
    required
    • Align with stakeholders on the value drivers and metrics
    to consider
    • Find out what data is already available
    Research
    fidelity is an
    important
    consideration.

    View Slide

  27. • Consider what stage you are at and the level of certainty
    required
    • Align with stakeholders on the value drivers and metrics
    to consider
    • Find out what data is already available
    • Do just enough to fill the gaps
    Research
    fidelity is an
    important
    consideration.

    View Slide

  28. High level
    blueprints can
    help focus
    attention on
    high value
    opportunities.
    Offer
    Preparing for
    Work
    Arriving at Office
    Mandatory
    Training
    Work

    View Slide

  29. High level
    blueprints can
    help focus
    attention on
    high value
    opportunities.
    Offer
    Preparing for
    Work
    Arriving at Office
    Mandatory
    Training
    Work

    View Slide

  30. High level
    blueprints can
    help focus
    attention on
    high value
    opportunities.
    Offer
    Preparing for
    Work
    Arriving at Office
    Mandatory
    Training
    Work

    View Slide

  31. High level
    blueprints can
    help focus
    attention on
    high value
    opportunities.
    Offer
    Preparing for
    Work
    Arriving at Office
    Mandatory
    Training
    Work

    View Slide

  32. High level
    blueprints can
    help focus
    attention on
    high value
    opportunities.
    Offer
    Preparing for
    Work
    Arriving at Office
    Mandatory
    Training
    Work

    View Slide

  33. High level
    blueprints can
    help focus
    attention on
    high value
    opportunities.
    Offer
    Preparing for
    Work
    Arriving at Office
    Mandatory
    Training
    Work

    View Slide

  34. Inferring
    Impact

    View Slide

  35. Inferring
    Impact
    Previous performance

    View Slide

  36. Inferring
    Impact
    Competitor benchmarking
    Previous performance

    View Slide

  37. Inferring
    Impact
    Competitor benchmarking
    Previous performance
    Driver analysis

    View Slide

  38. Let’s Triangulate!

    View Slide

  39. Let’s Triangulate!

    View Slide

  40. Pulling the plug
    • Create a culture that celebrates this!
    • Consider the possibility of Type I errors

    View Slide

  41. Step Three Explore the addressable value

    View Slide

  42. What is addressable value?
    Value Ceiling
    Addressable Value
    Value Captured

    View Slide

  43. Focusing ideation with research
    How might we… ensure that new starters have the role specific information that they need
    So that… they are empowered to do their best work on day 1.

    View Slide

  44. Focusing ideation with research
    How might we… ensure that new starters have the role specific information that they need
    So that… they are empowered to do their best work on day 1.
    Highlight the user and their needs

    View Slide

  45. Focusing ideation with research
    How might we… ensure that new starters have the role specific information that they need
    So that… they are empowered to do their best work on day 1.
    Highlight the user and their needs
    Clearly state the
    objective

    View Slide

  46. Focusing ideation with research
    How might we… ensure that new starters have the role specific information that they need
    So that… they are empowered to do their best work on day 1.
    Avoid mentioning solutions
    Highlight the user and their needs
    Clearly state the
    objective

    View Slide

  47. Connecting ideas to value
    We believe that (solution), (for these people) will achieve (benefit).
    We will know that we are successful when (key metric outcome).

    View Slide

  48. Connecting ideas to value
    We believe that (solution), (for these people) will achieve (benefit).
    We will know that we are successful when (key metric outcome).
    Buddy
    system
    Welcome
    pack
    Trello
    board

    View Slide

  49. Connecting ideas to value
    We believe that (solution), (for these people) will achieve (benefit).
    We will know that we are successful when (key metric outcome).
    Buddy
    system
    Welcome
    pack
    Trello
    board
    Buddy
    system

    View Slide

  50. Connecting ideas to value
    We believe that (solution), (for these people) will achieve (benefit).
    We will know that we are successful when (key metric outcome).
    Buddy
    system
    Welcome
    pack
    Trello
    board
    Buddy
    system
    Graduates

    View Slide

  51. Connecting ideas to value
    We believe that (solution), (for these people) will achieve (benefit).
    We will know that we are successful when (key metric outcome).
    Buddy
    system
    Welcome
    pack
    Trello
    board
    Buddy
    system
    Graduates
    Ongoing,
    tailored
    support

    View Slide

  52. Connecting ideas to value
    We believe that (solution), (for these people) will achieve (benefit).
    We will know that we are successful when (key metric outcome).
    Buddy
    system
    Welcome
    pack
    Trello
    board
    Buddy
    system
    Graduates
    ESAT
    Ongoing,
    tailored
    support

    View Slide

  53. Pulling it all together

    View Slide

  54. Questions & Assumptions
    Collating Our Information

    View Slide

  55. Questions & Assumptions
    Top Down Estimate
    Collating Our Information

    View Slide

  56. Questions & Assumptions
    Top Down Estimate
    Pain Points
    Collating Our Information

    View Slide

  57. Questions & Assumptions
    Top Down Estimate
    Pain Points
    Bottom Up Estimate
    Collating Our Information

    View Slide

  58. Questions & Assumptions
    Top Down Estimate
    Pain Points
    Bottom Up Estimate Ideas!
    Collating Our Information

    View Slide

  59. Questions & Assumptions
    Top Down Estimate
    Pain Points
    Bottom Up Estimate Ideas!
    Solution Hypotheses
    Collating Our Information

    View Slide

  60. Questions & Assumptions
    Top Down Estimate
    Pain Points
    Bottom Up Estimate Ideas!
    Solution Hypotheses
    Initiative Overlap
    Collating Our Information

    View Slide

  61. Taking a considered approach to the way we
    store insights can unlock the ability to
    rapidly value opportunities.

    View Slide

  62. What can
    this look
    like?

    View Slide

  63. 1. Capture the process and connect it to the value drivers and baselines.
    What can
    this look
    like?

    View Slide

  64. 1. Capture the process and connect it to the value drivers and baselines.
    What can
    this look
    like?
    2. Input assumptions to calculate the addressable value (removing overlaps)
    and opportunity size (the impact of potential solutions).

    View Slide

  65. Bringing numbers to life

    View Slide

  66. Bringing numbers to life
    What is our data telling us?
    - ESAT for onboarding is low
    - Onboarding activities can run for
    over 2 weeks

    View Slide

  67. Bringing numbers to life
    What is our data telling us?
    What are people telling us?
    - ESAT for onboarding is low
    - Onboarding activities can run for
    over 2 weeks - The approach to onboarding is not
    fit for purpose
    - Add your story here

    View Slide

  68. Bringing numbers to life
    What is our data telling us?
    What are people telling us?
    What impact is this having/
    projected to have on the business?
    - ESAT for onboarding is low
    - Onboarding activities can run for
    over 2 weeks - The approach to onboarding is not
    fit for purpose
    - Add your story here
    - Last year over 500 hours has been spent on
    onboarding
    - Projected to increase this year with new
    graduates starting

    View Slide

  69. Bringing numbers to life
    What is our data telling us?
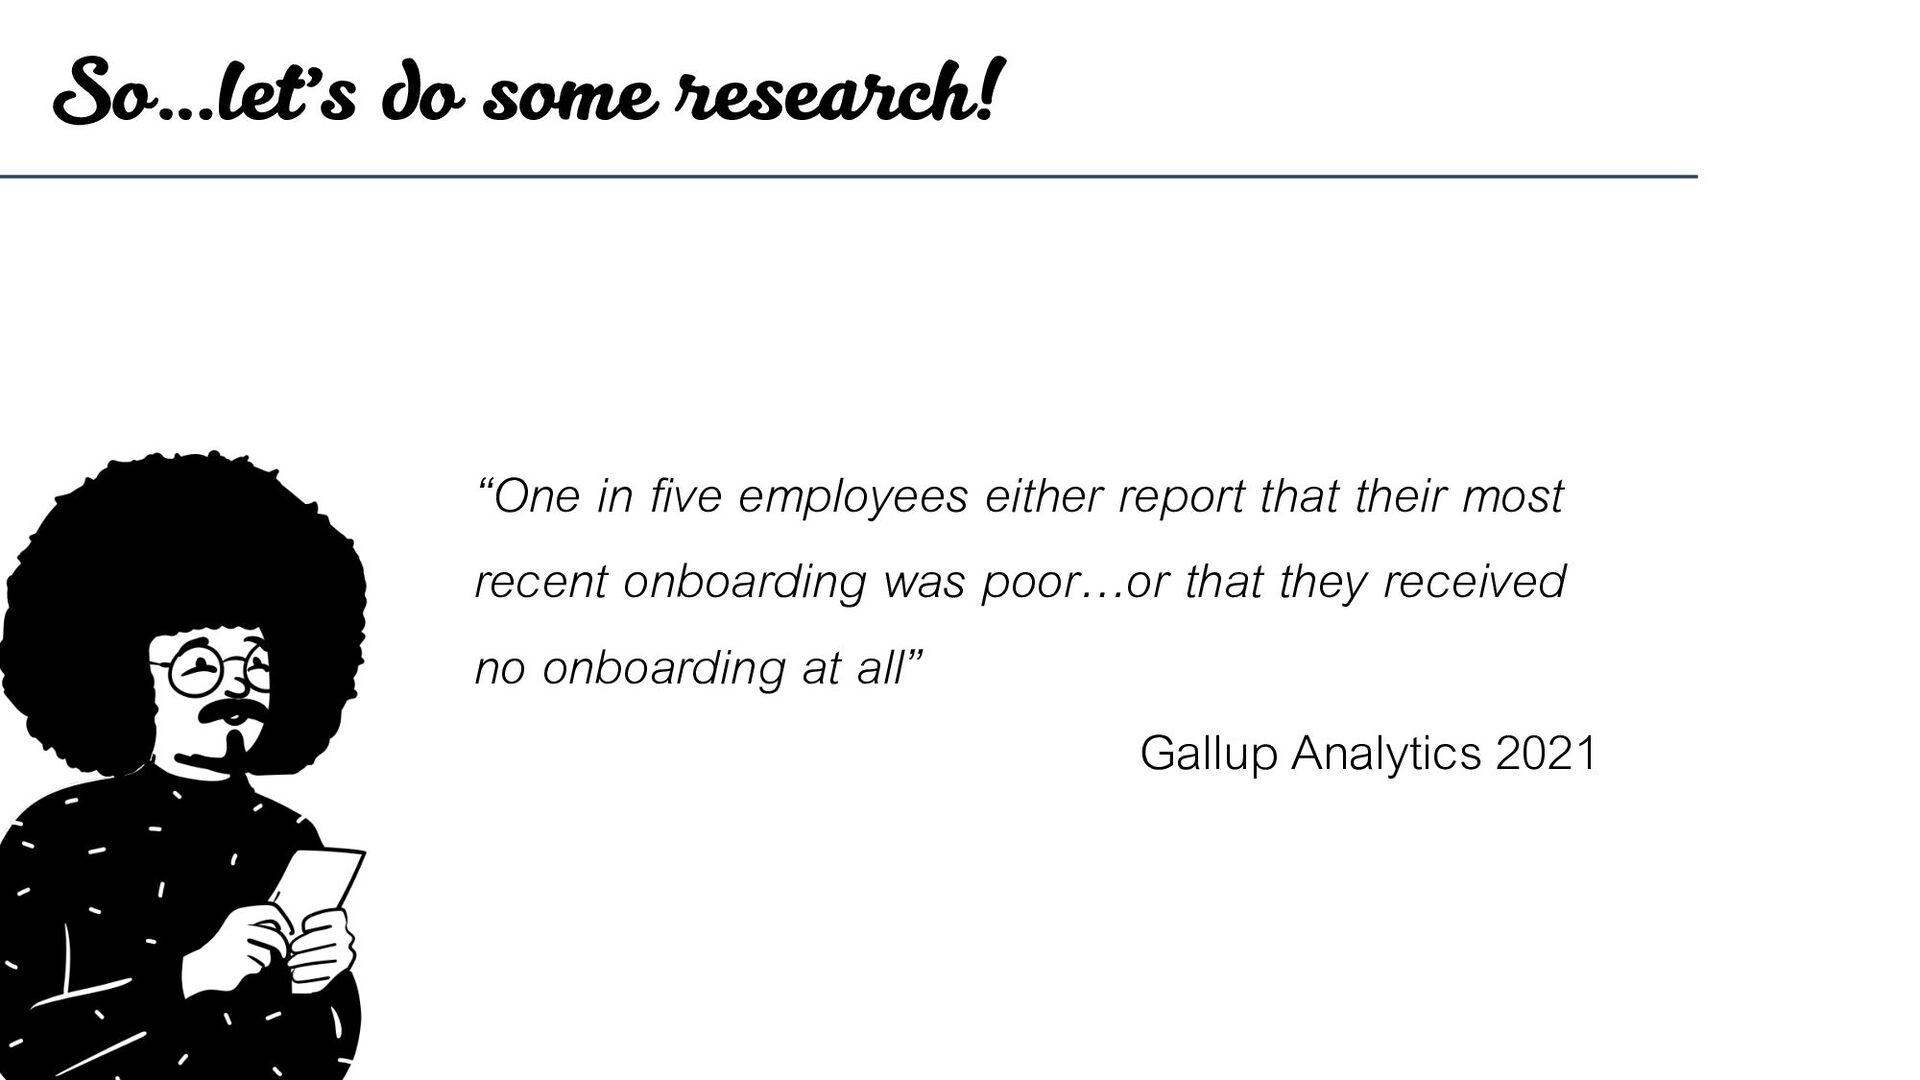
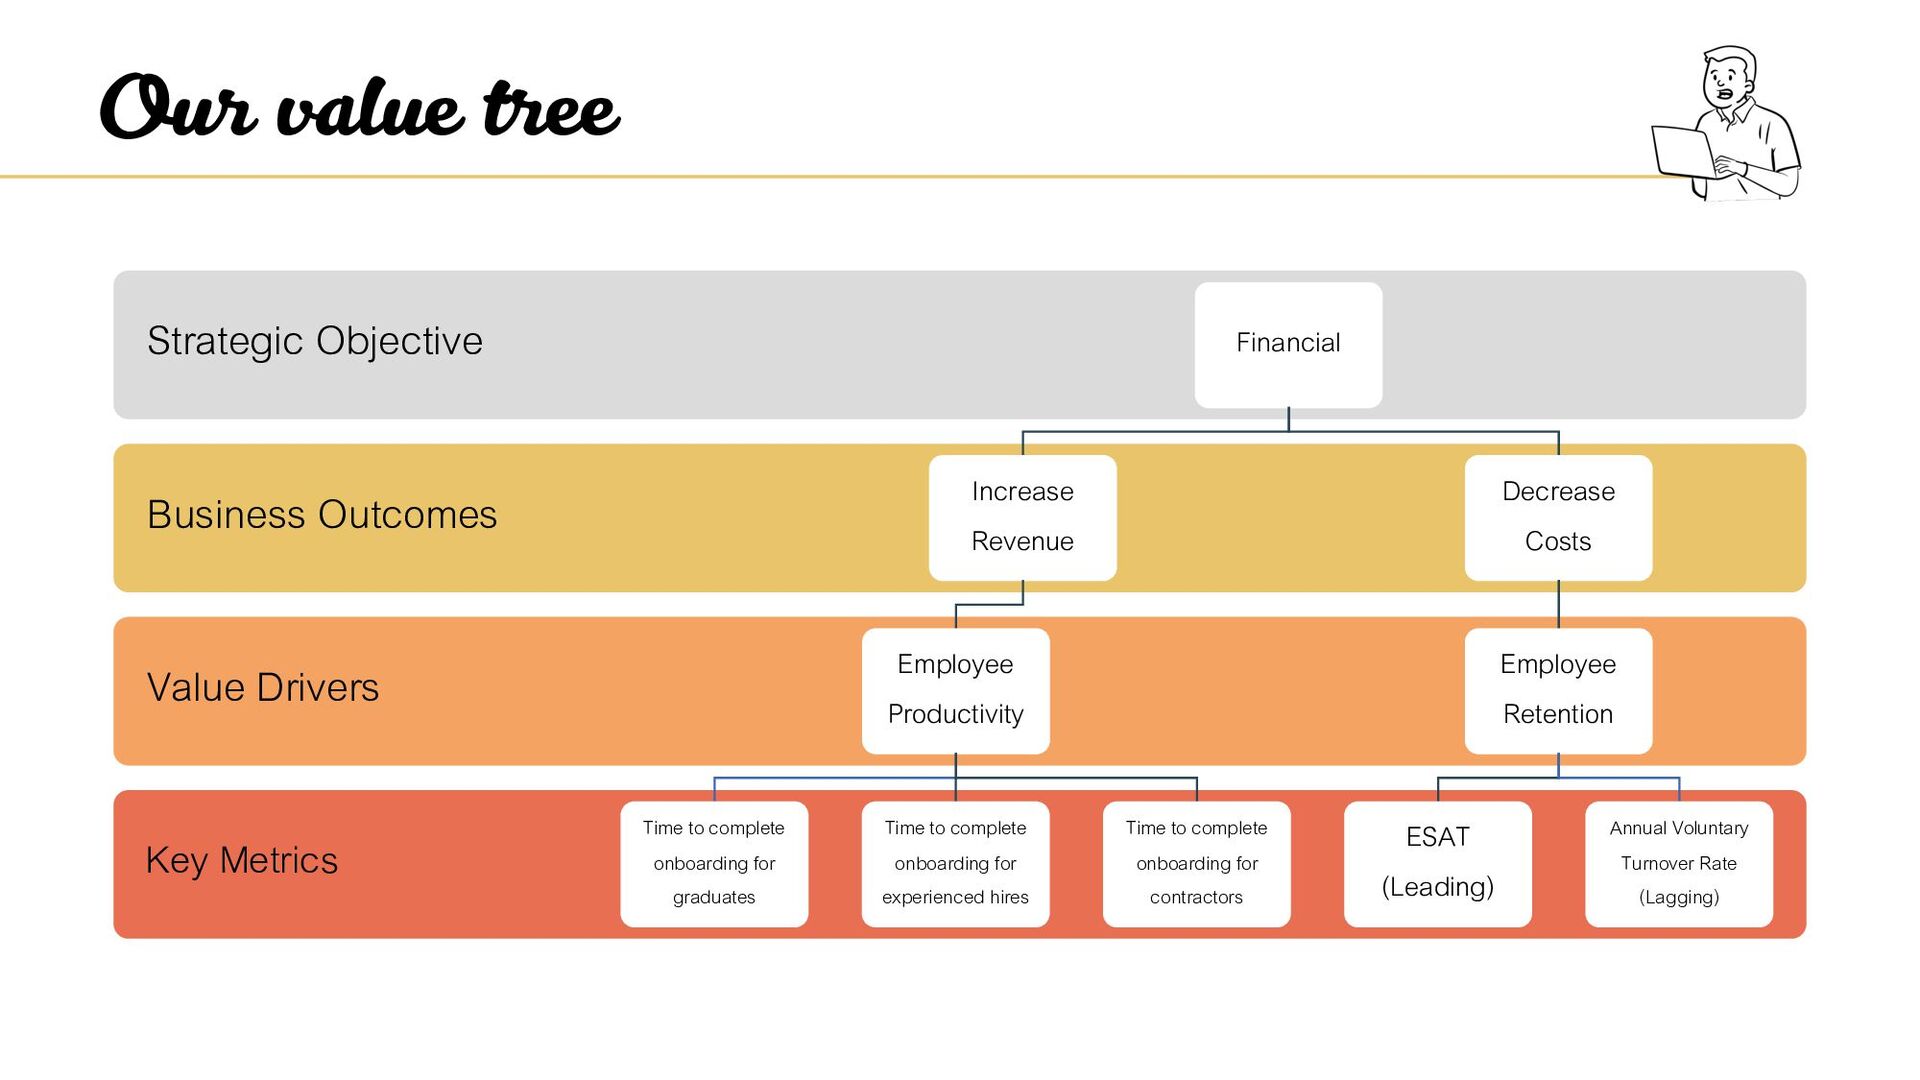
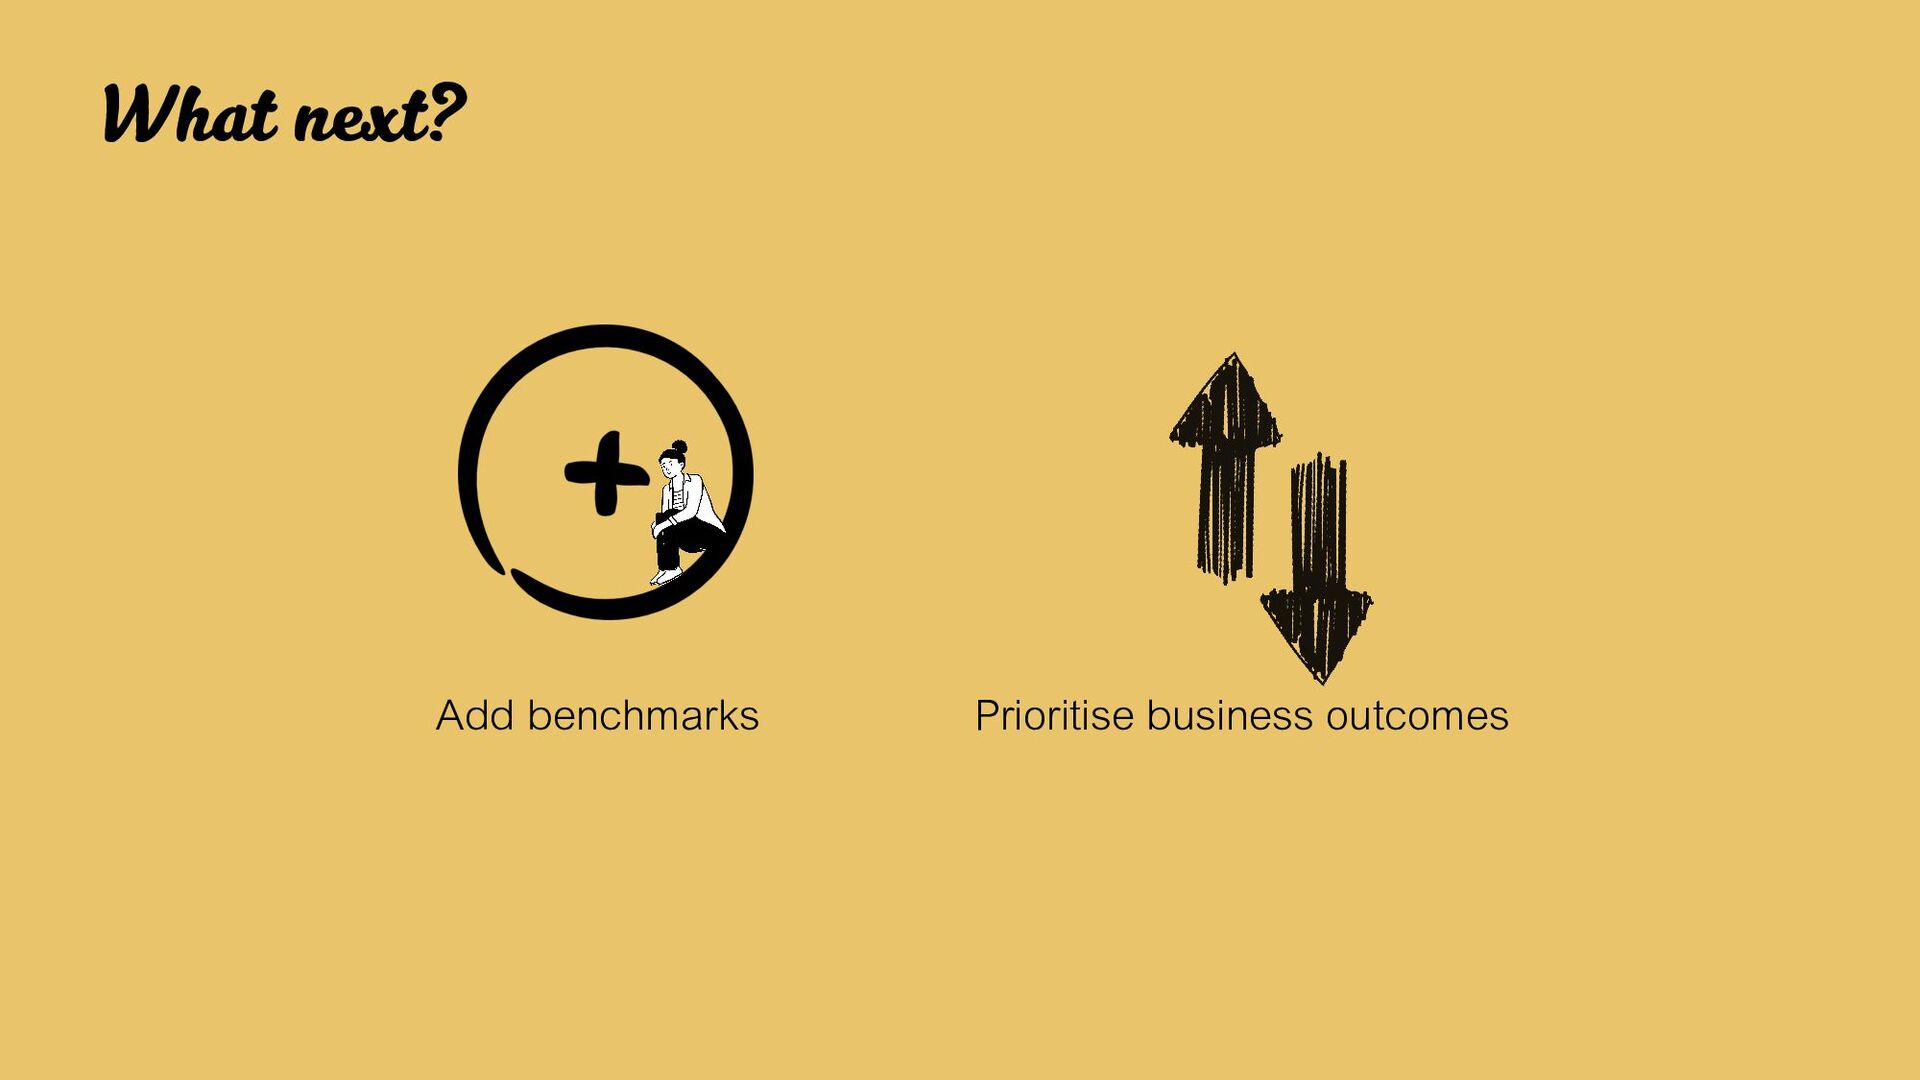
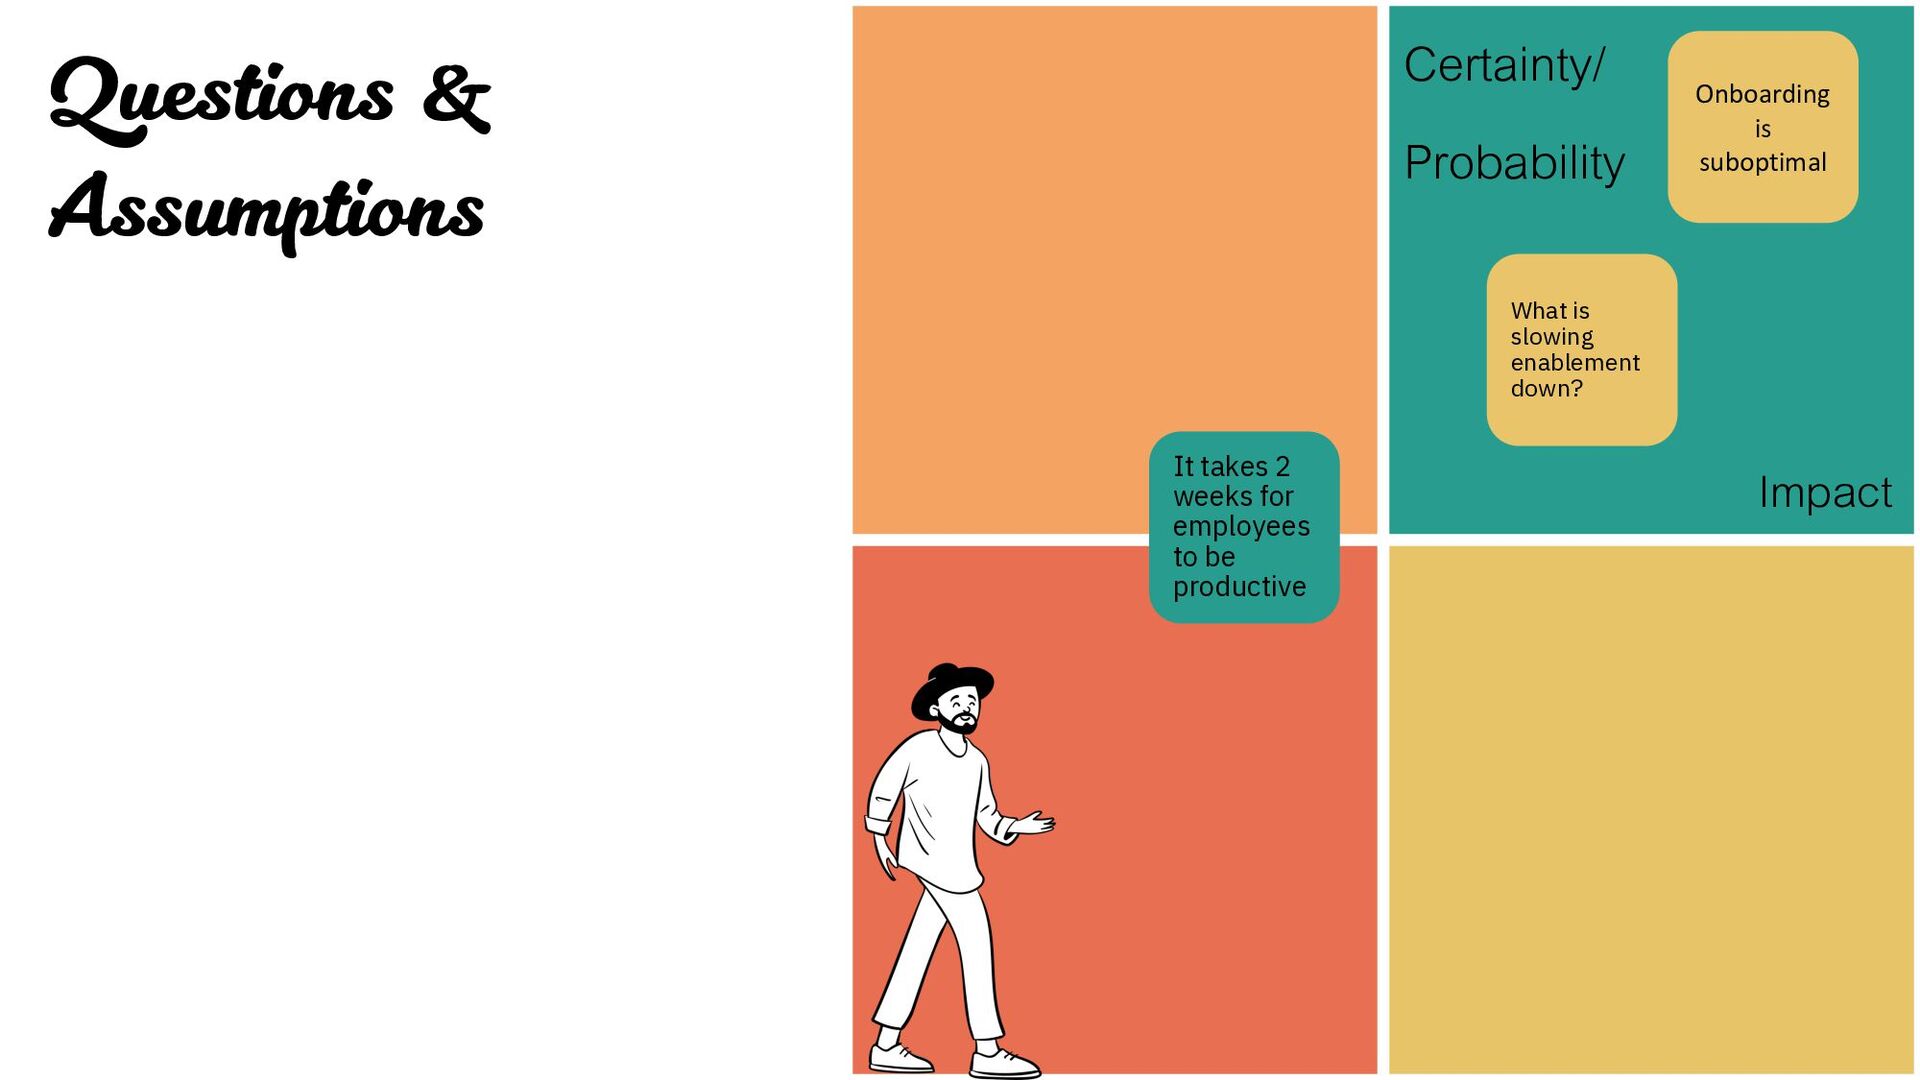
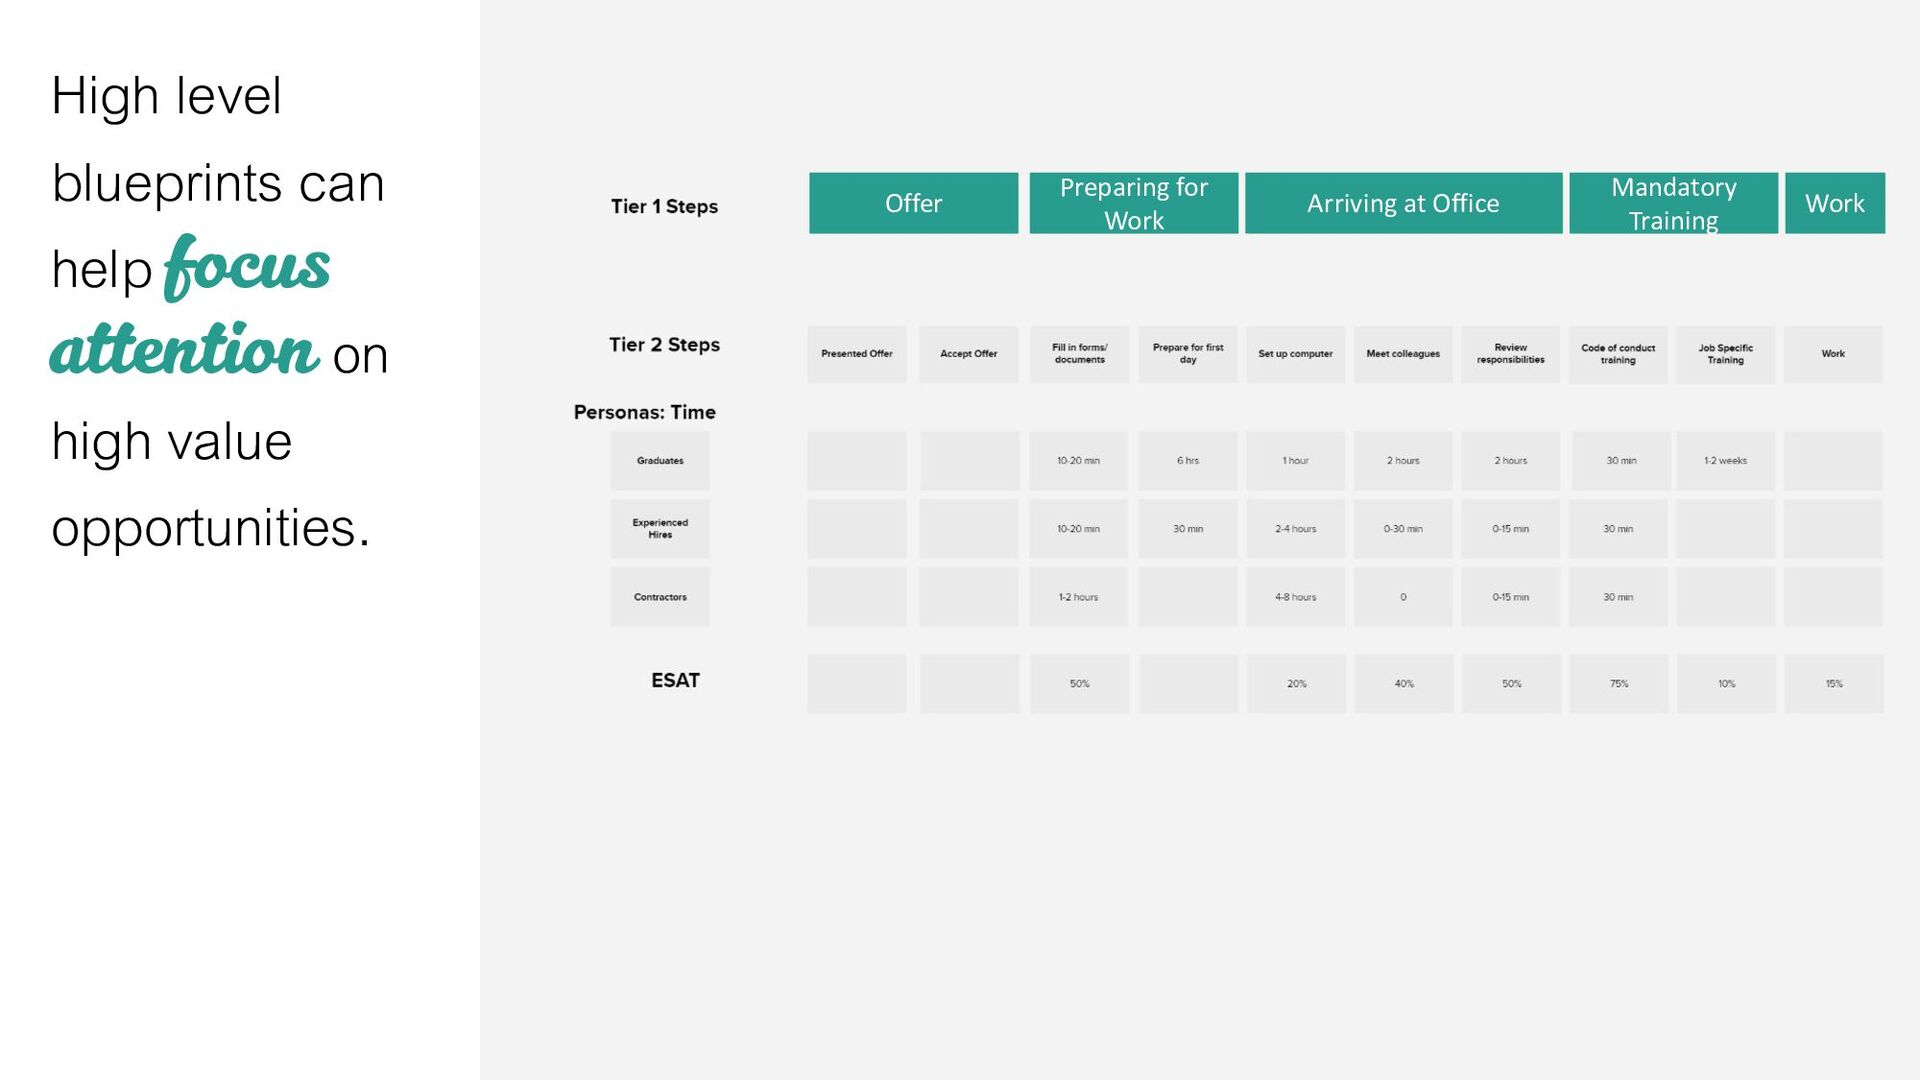
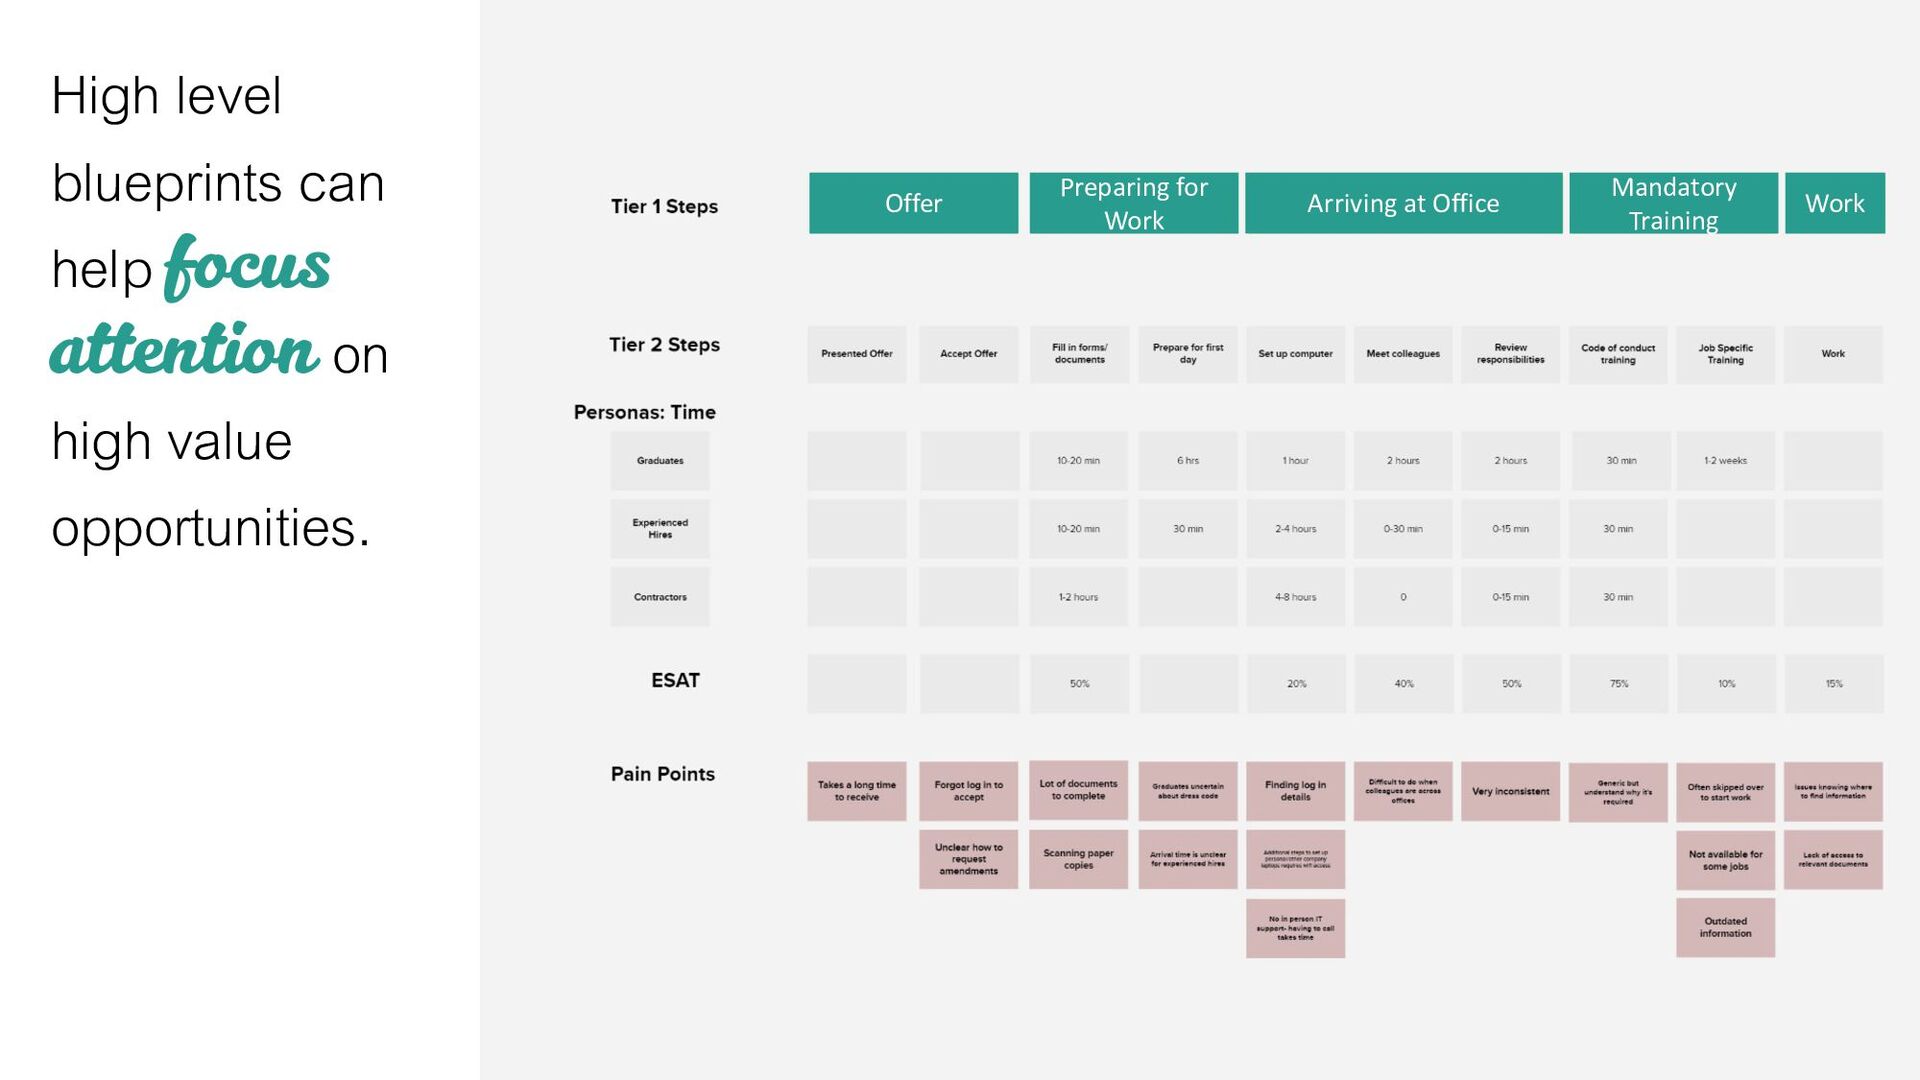
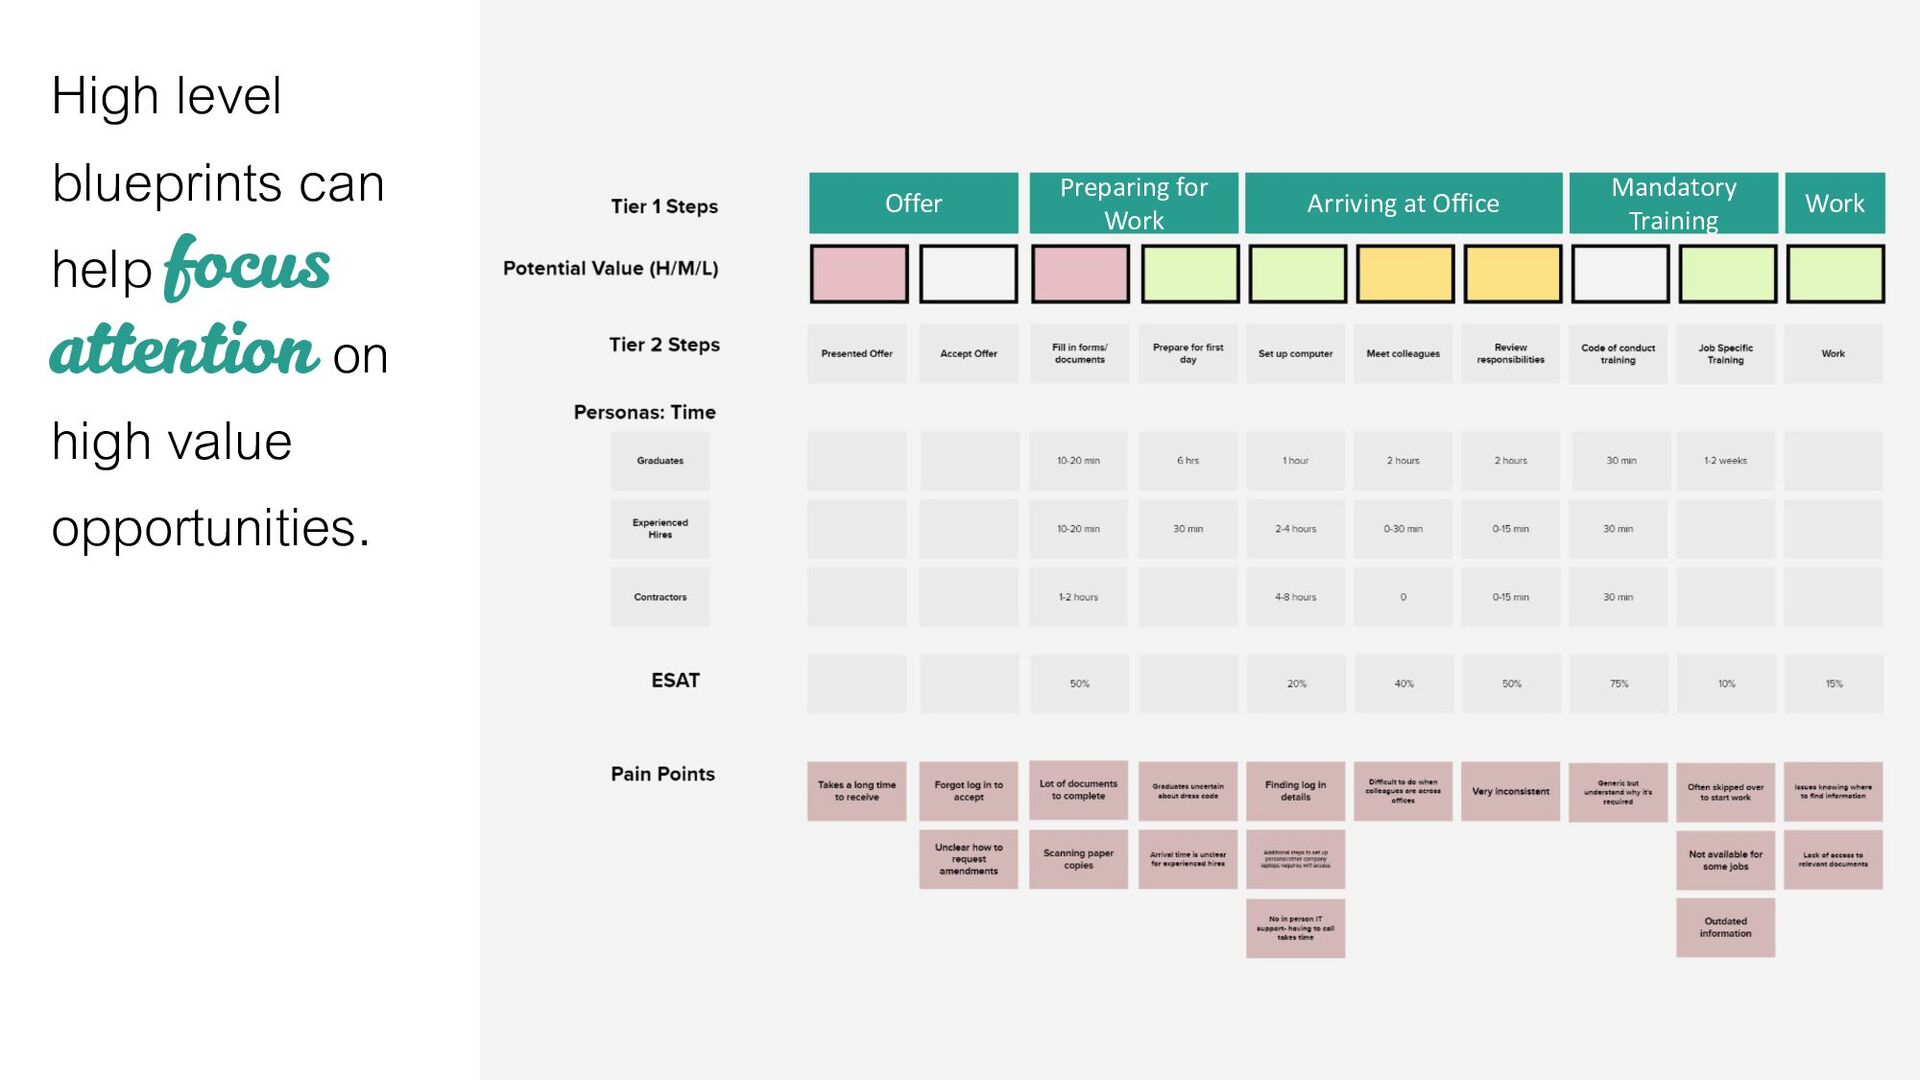
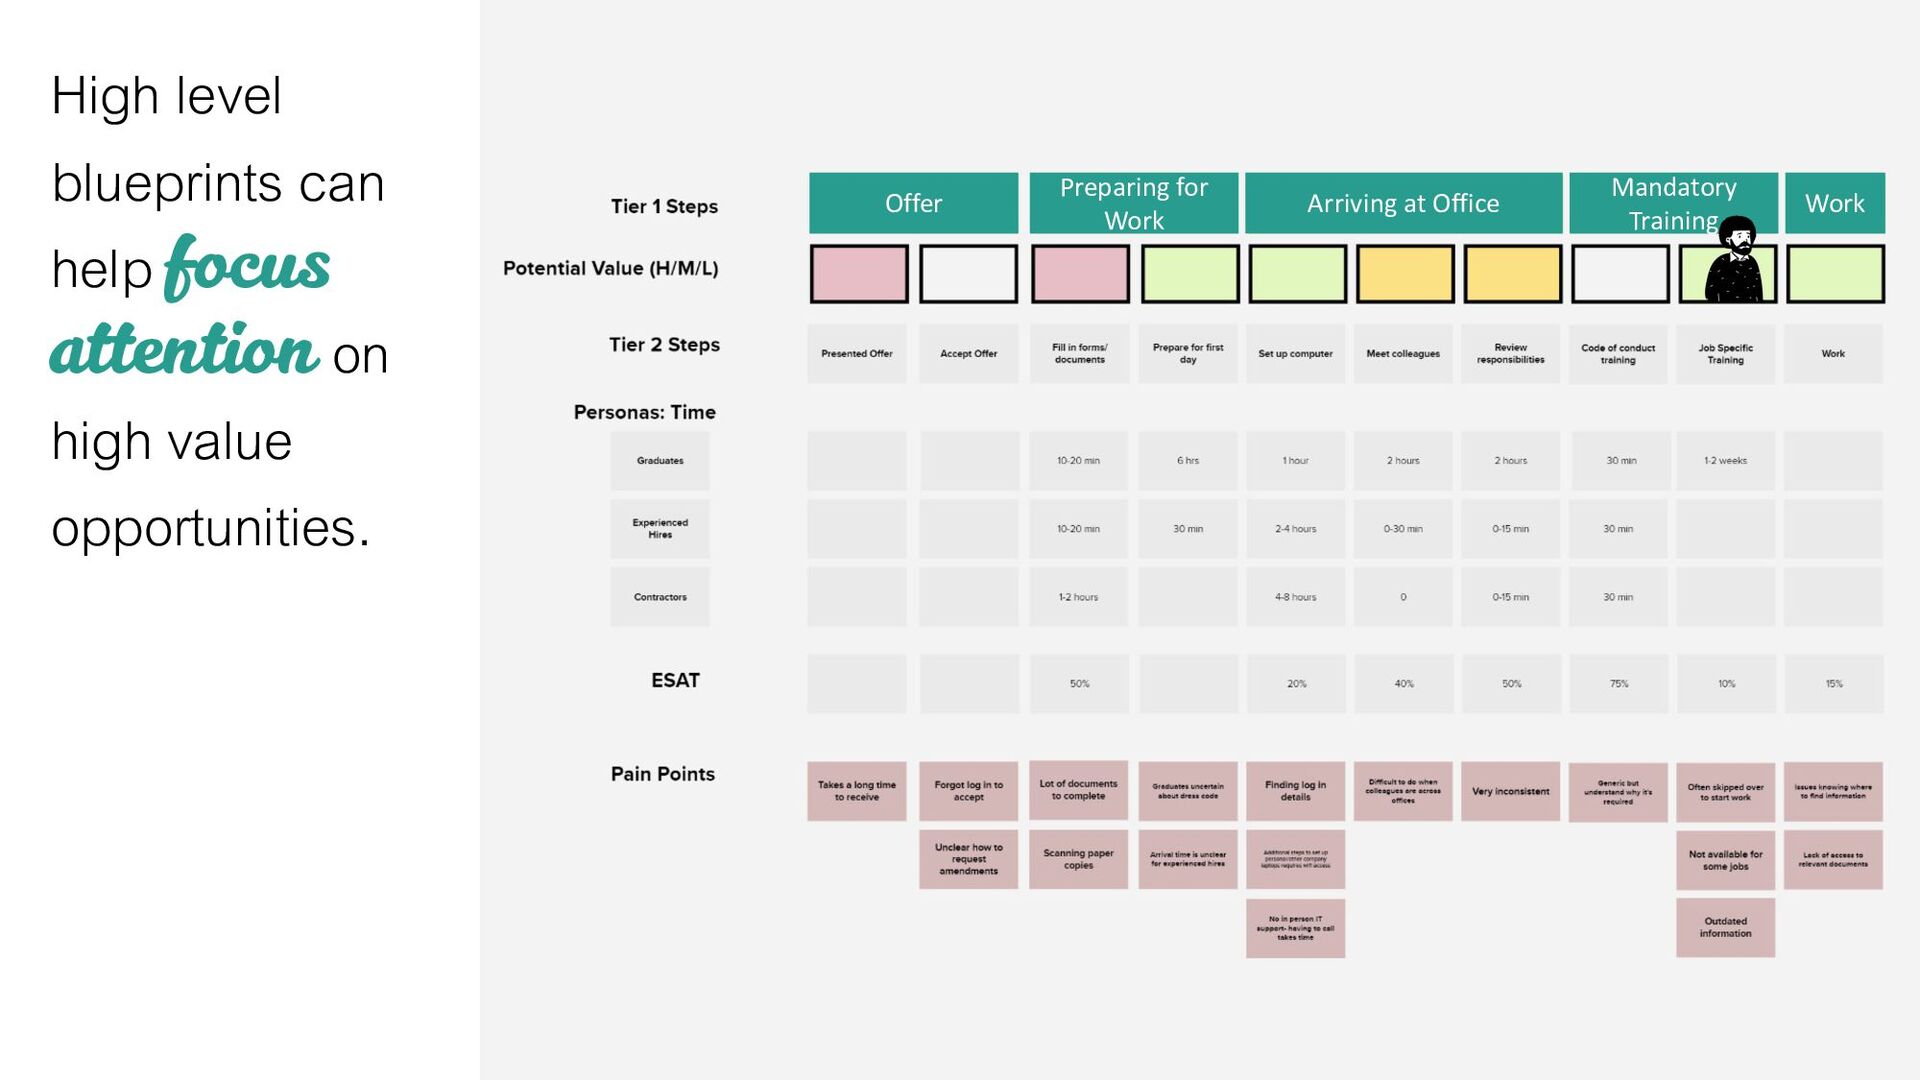
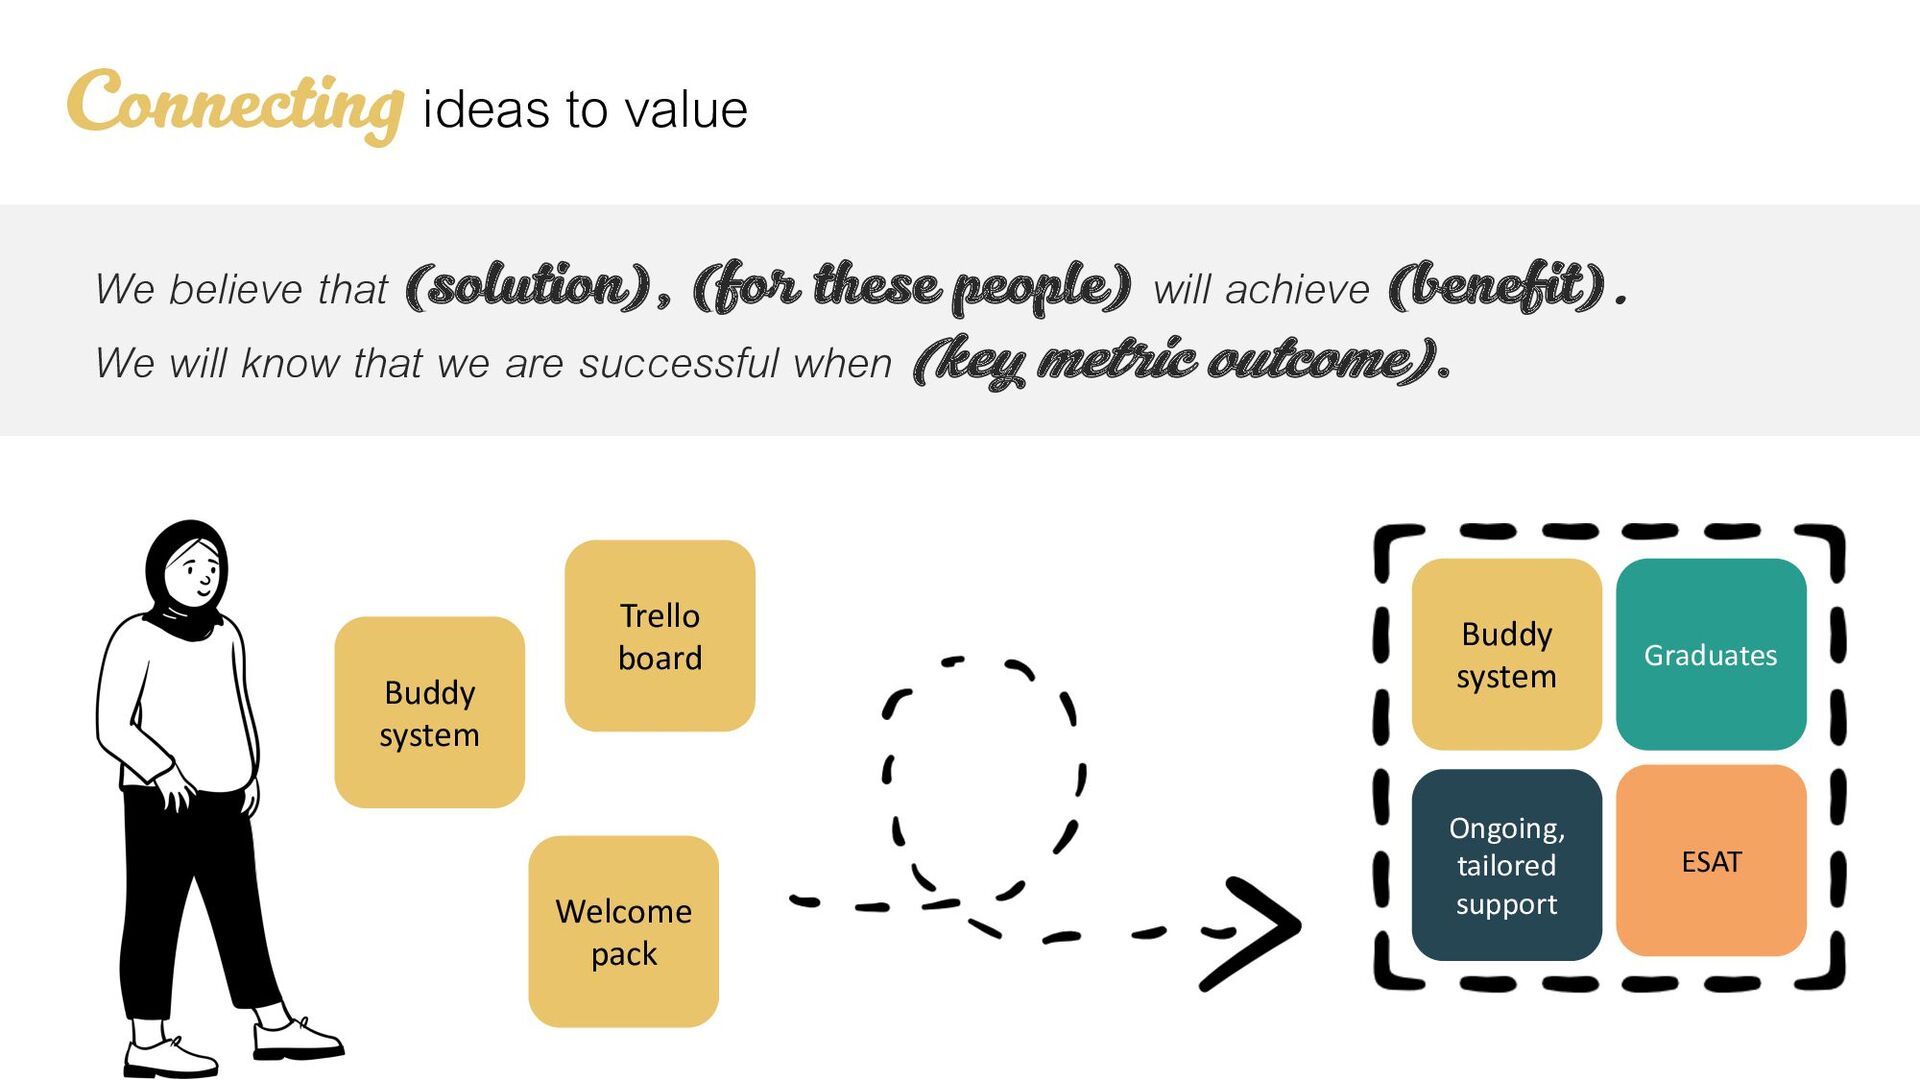
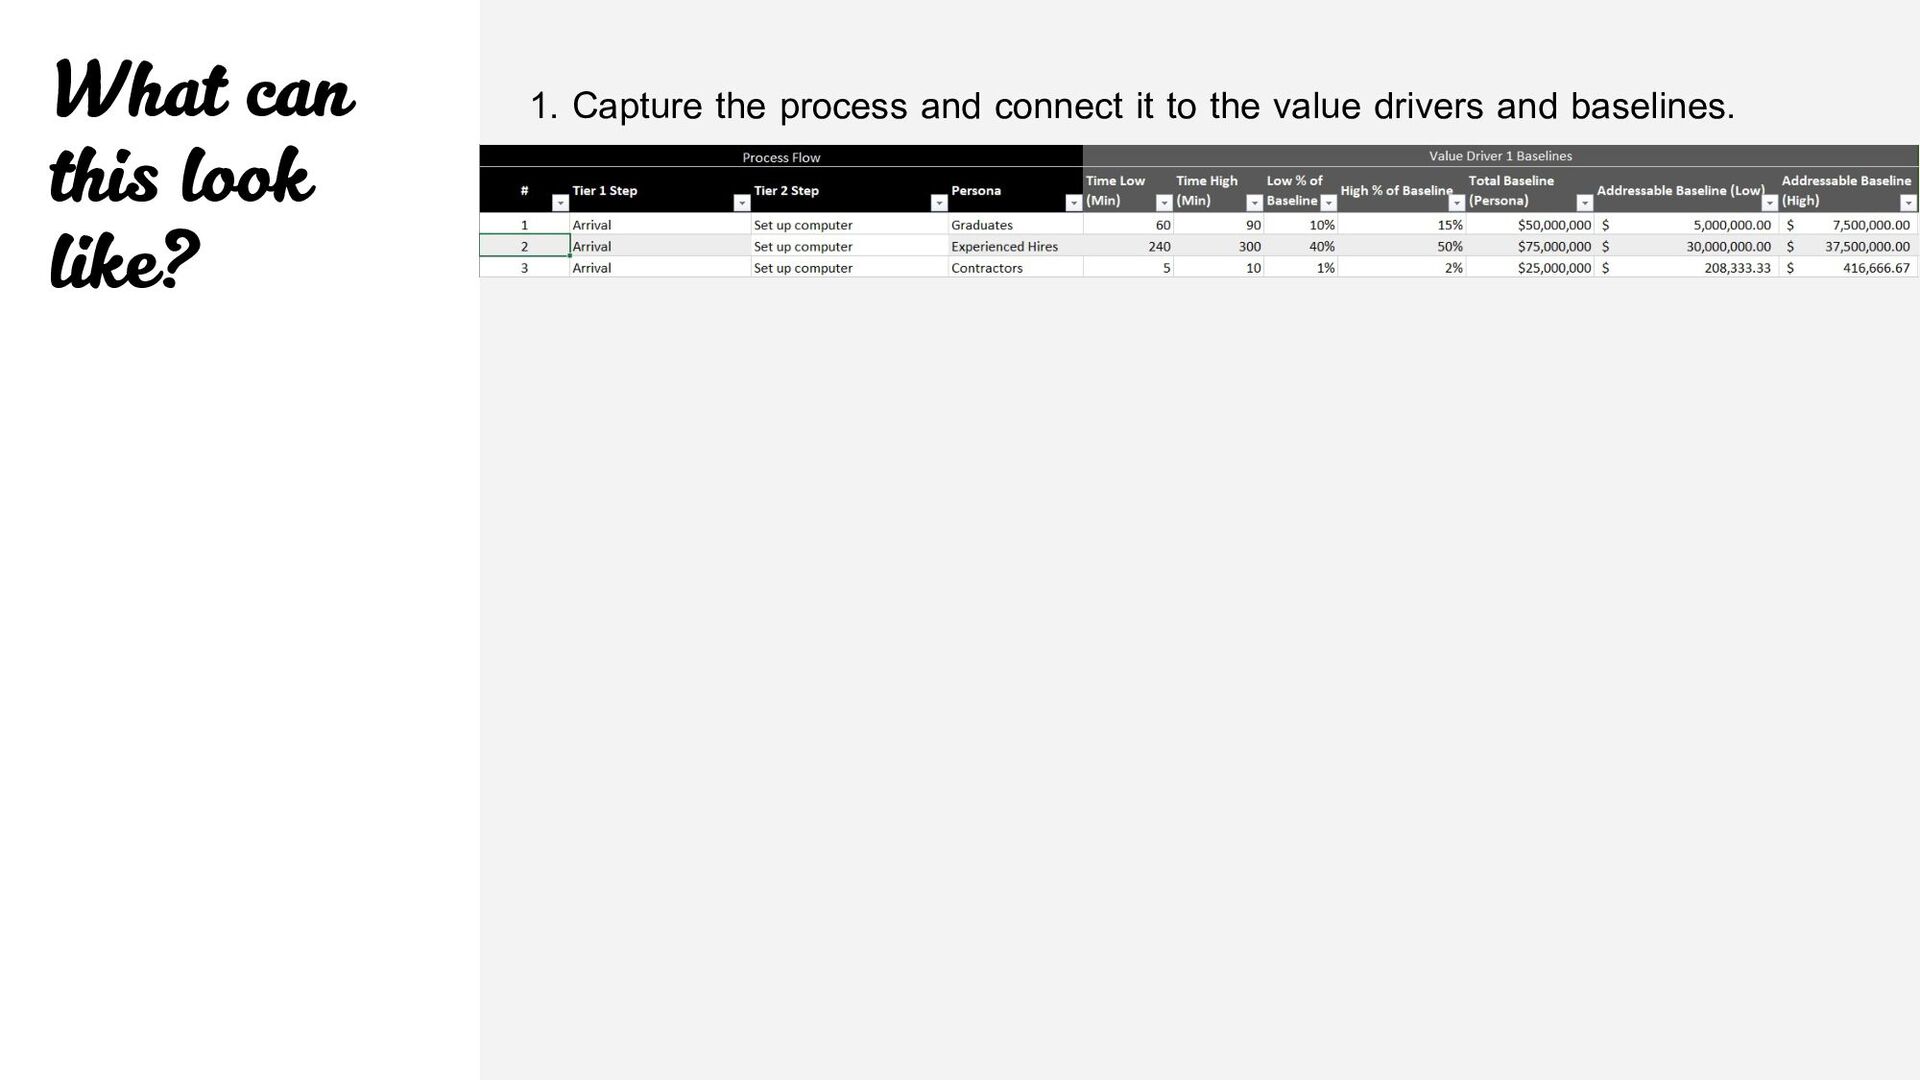
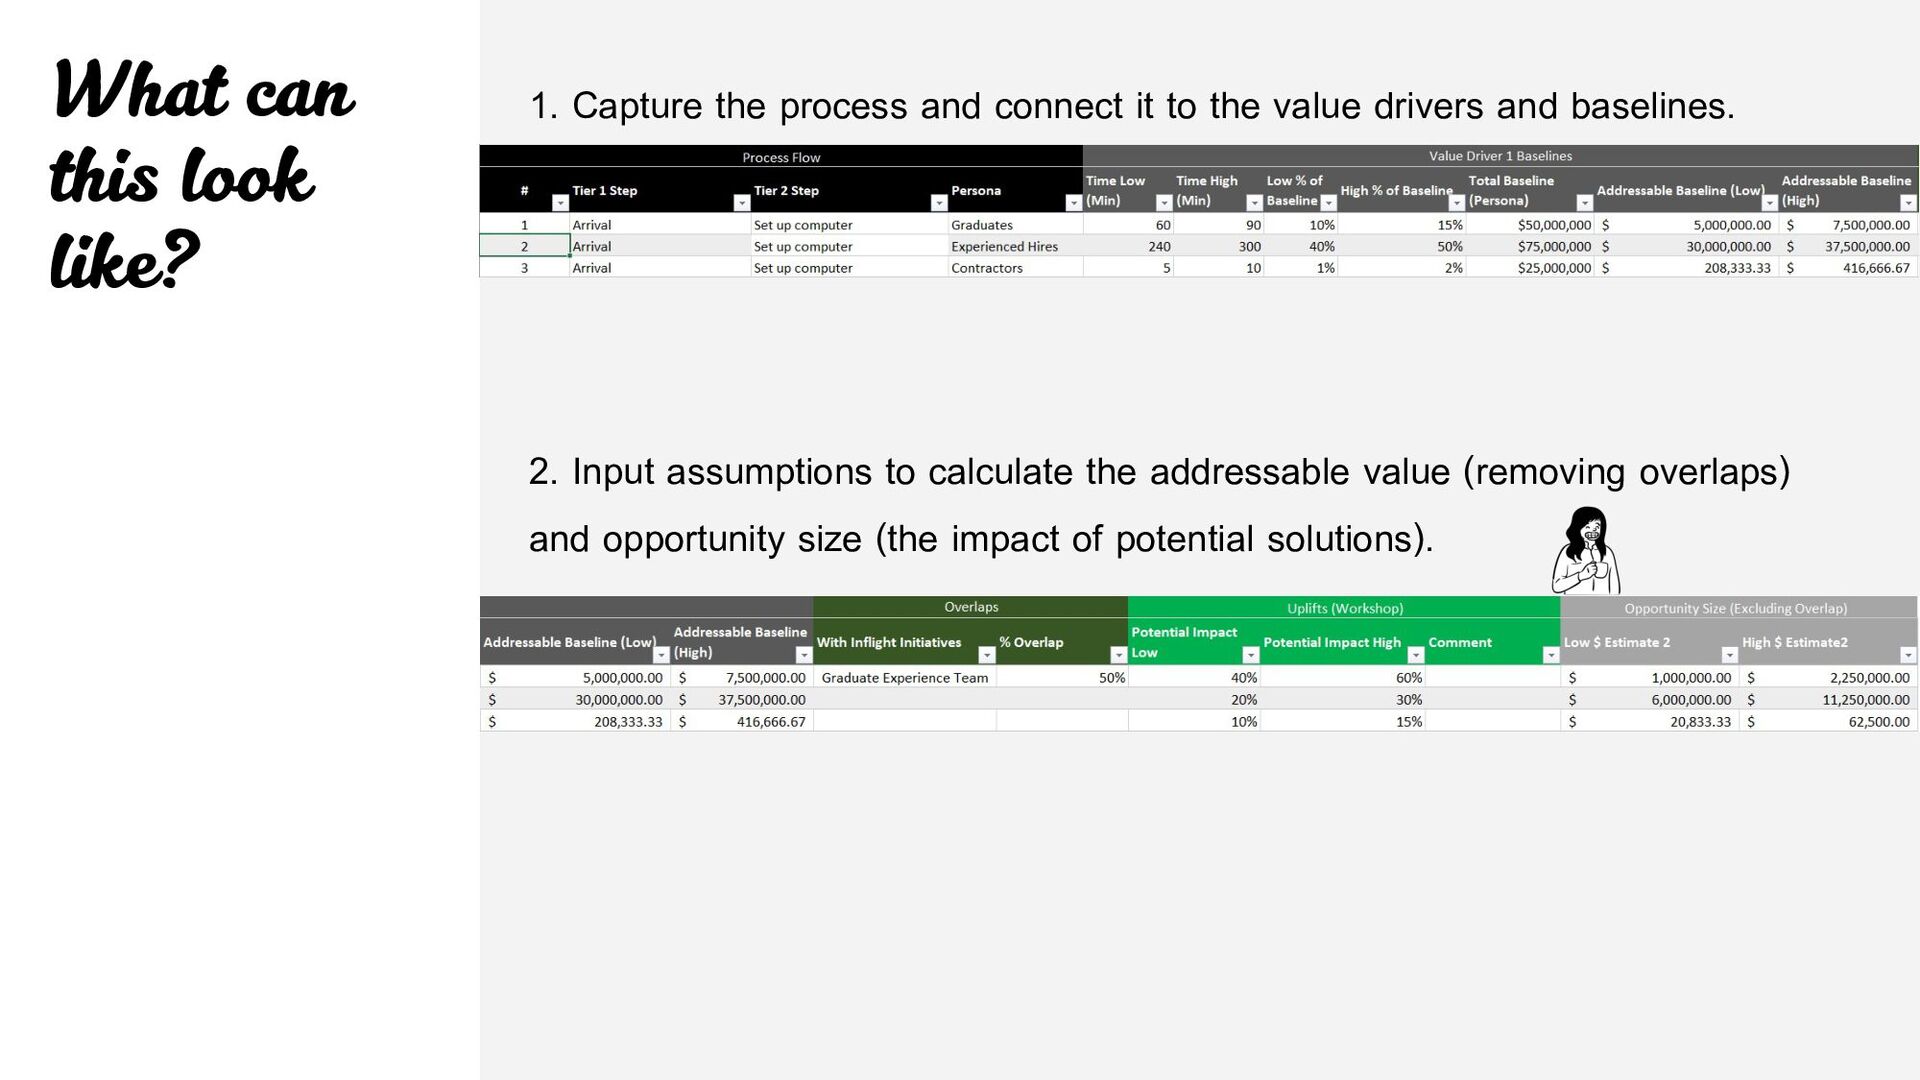
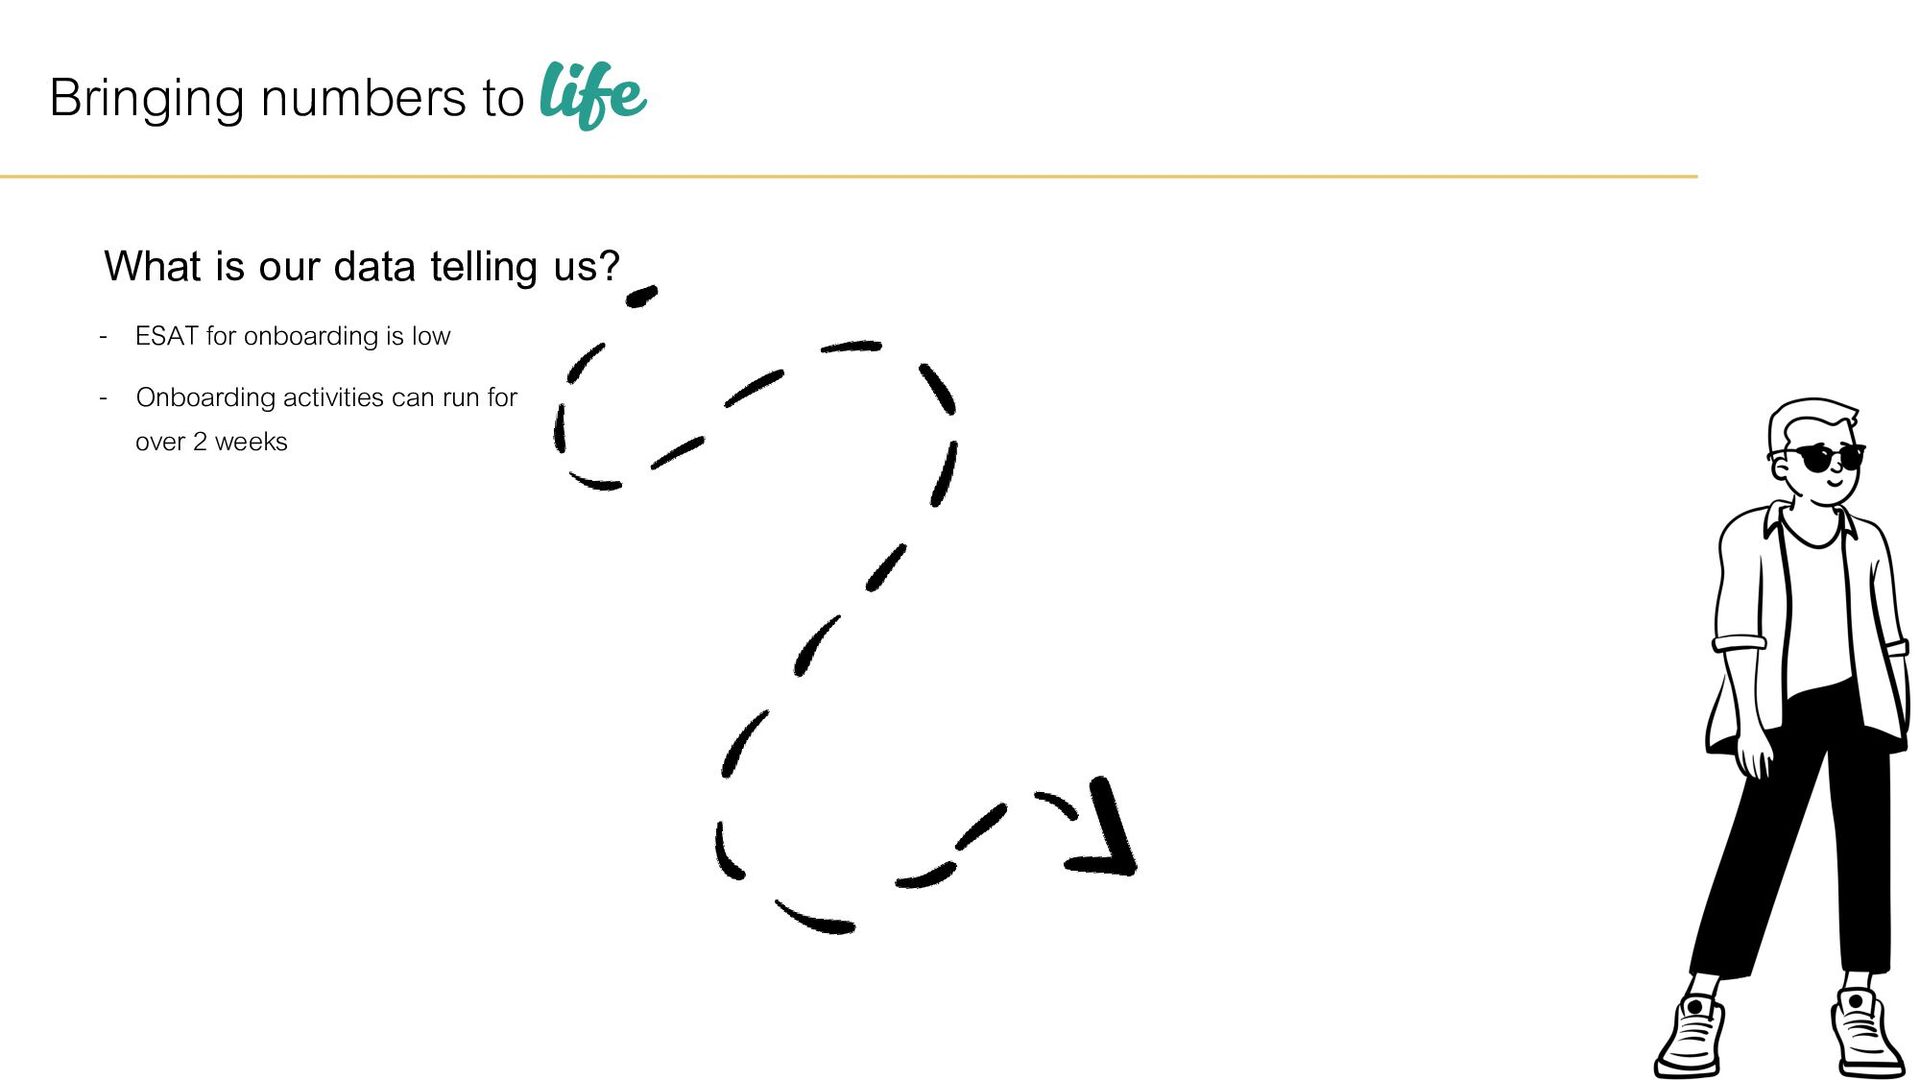
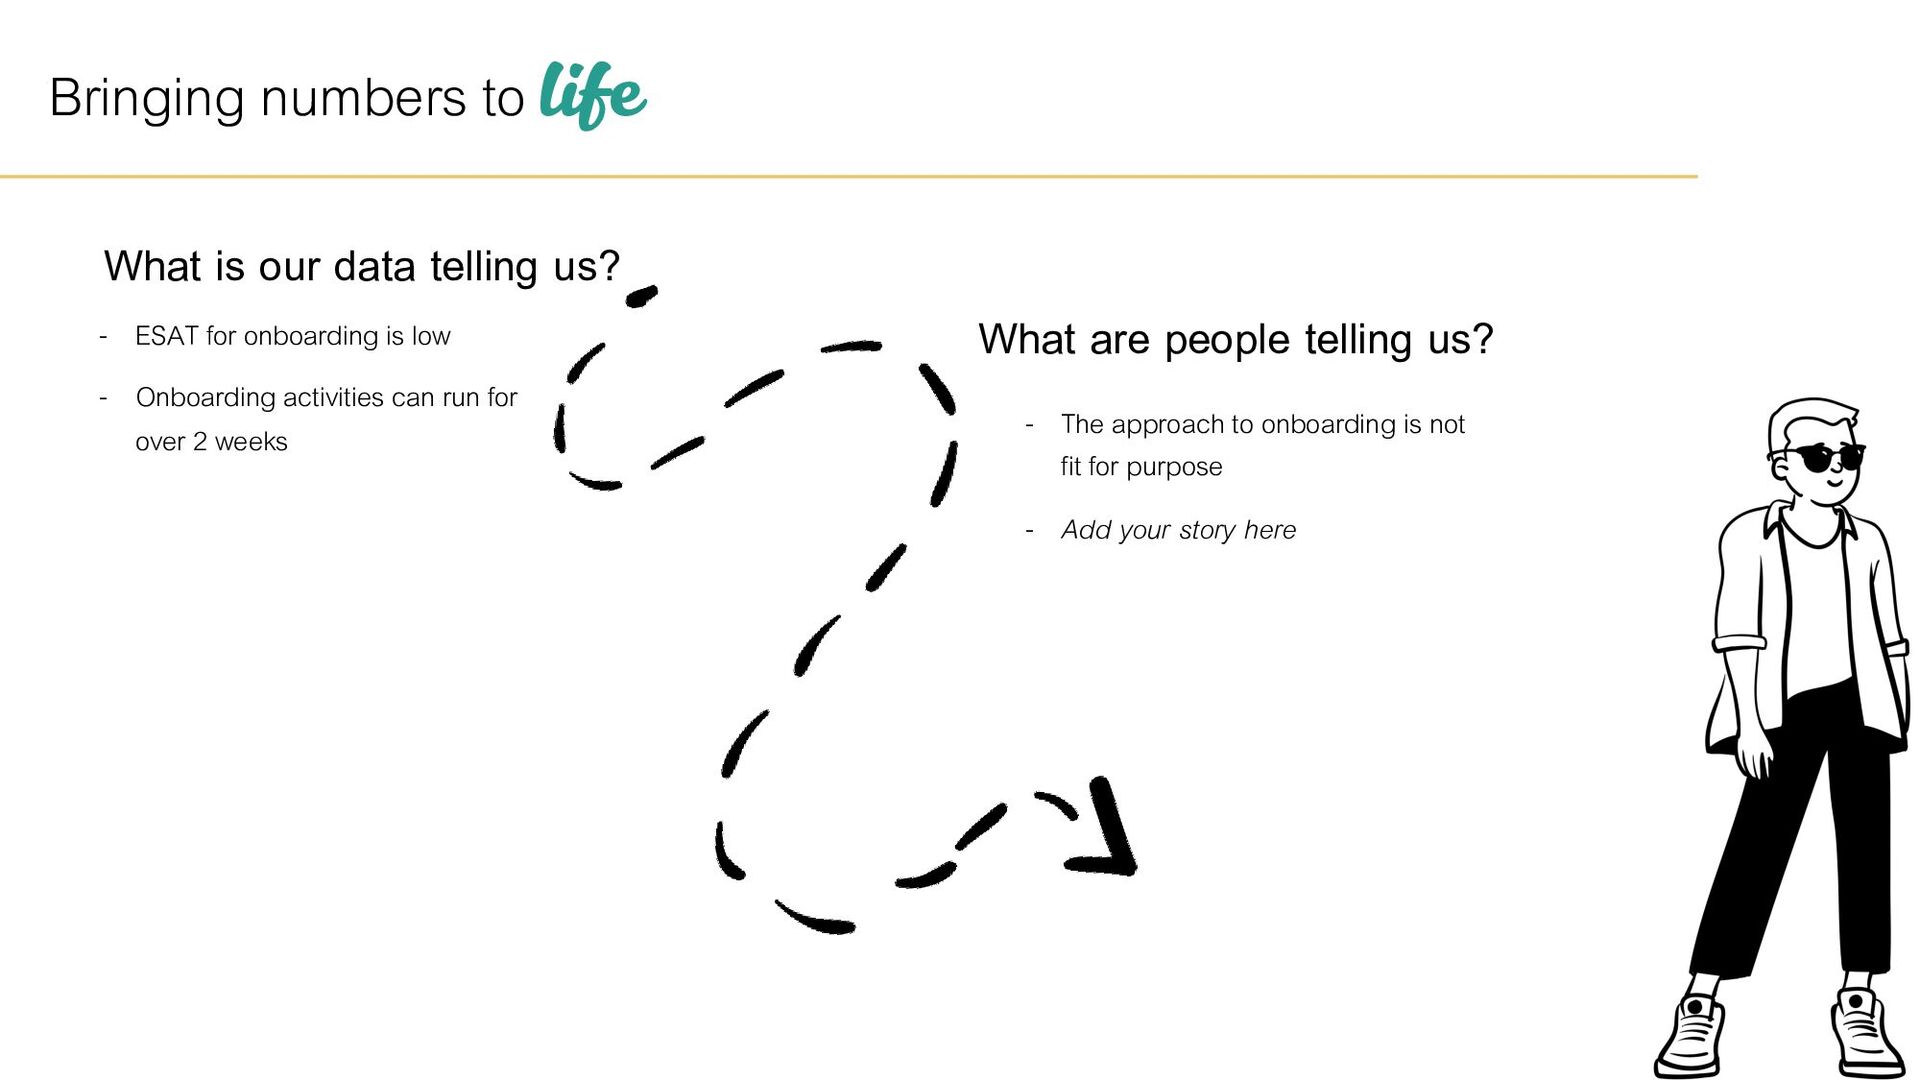
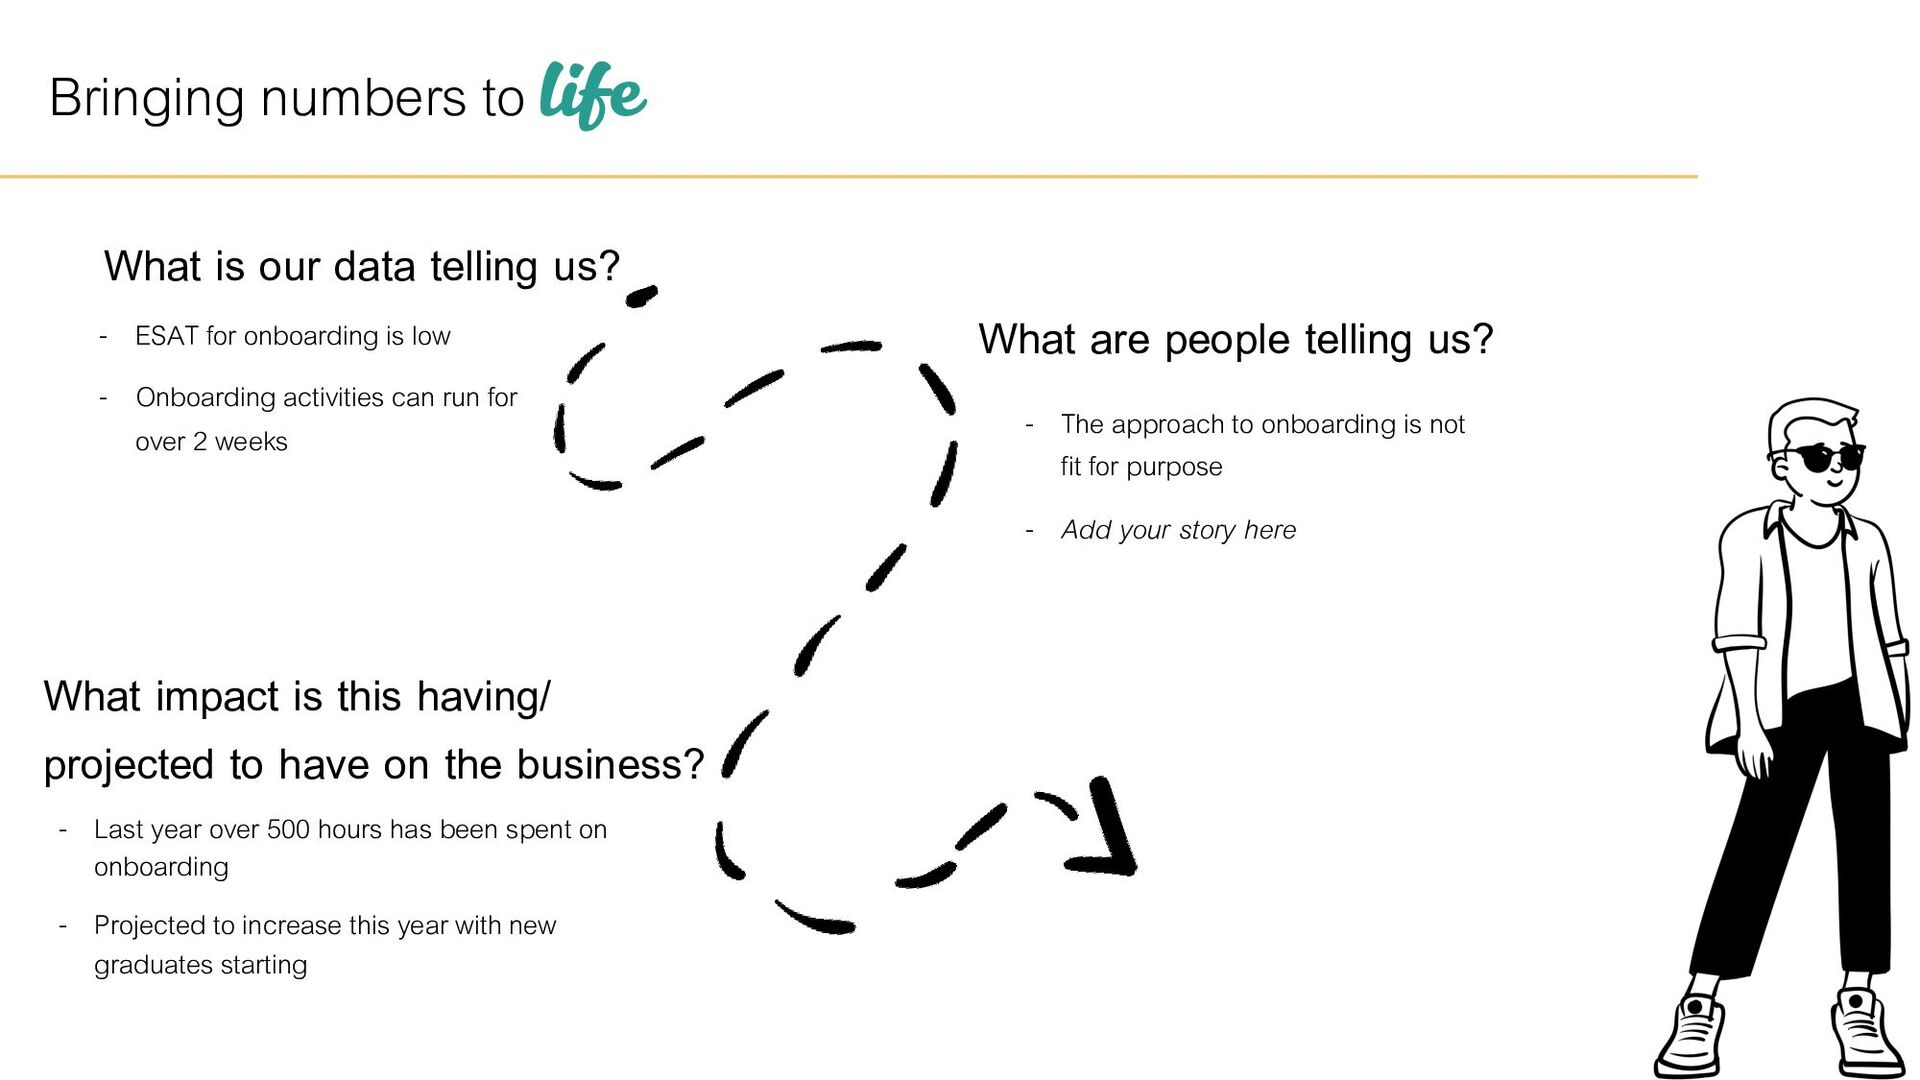
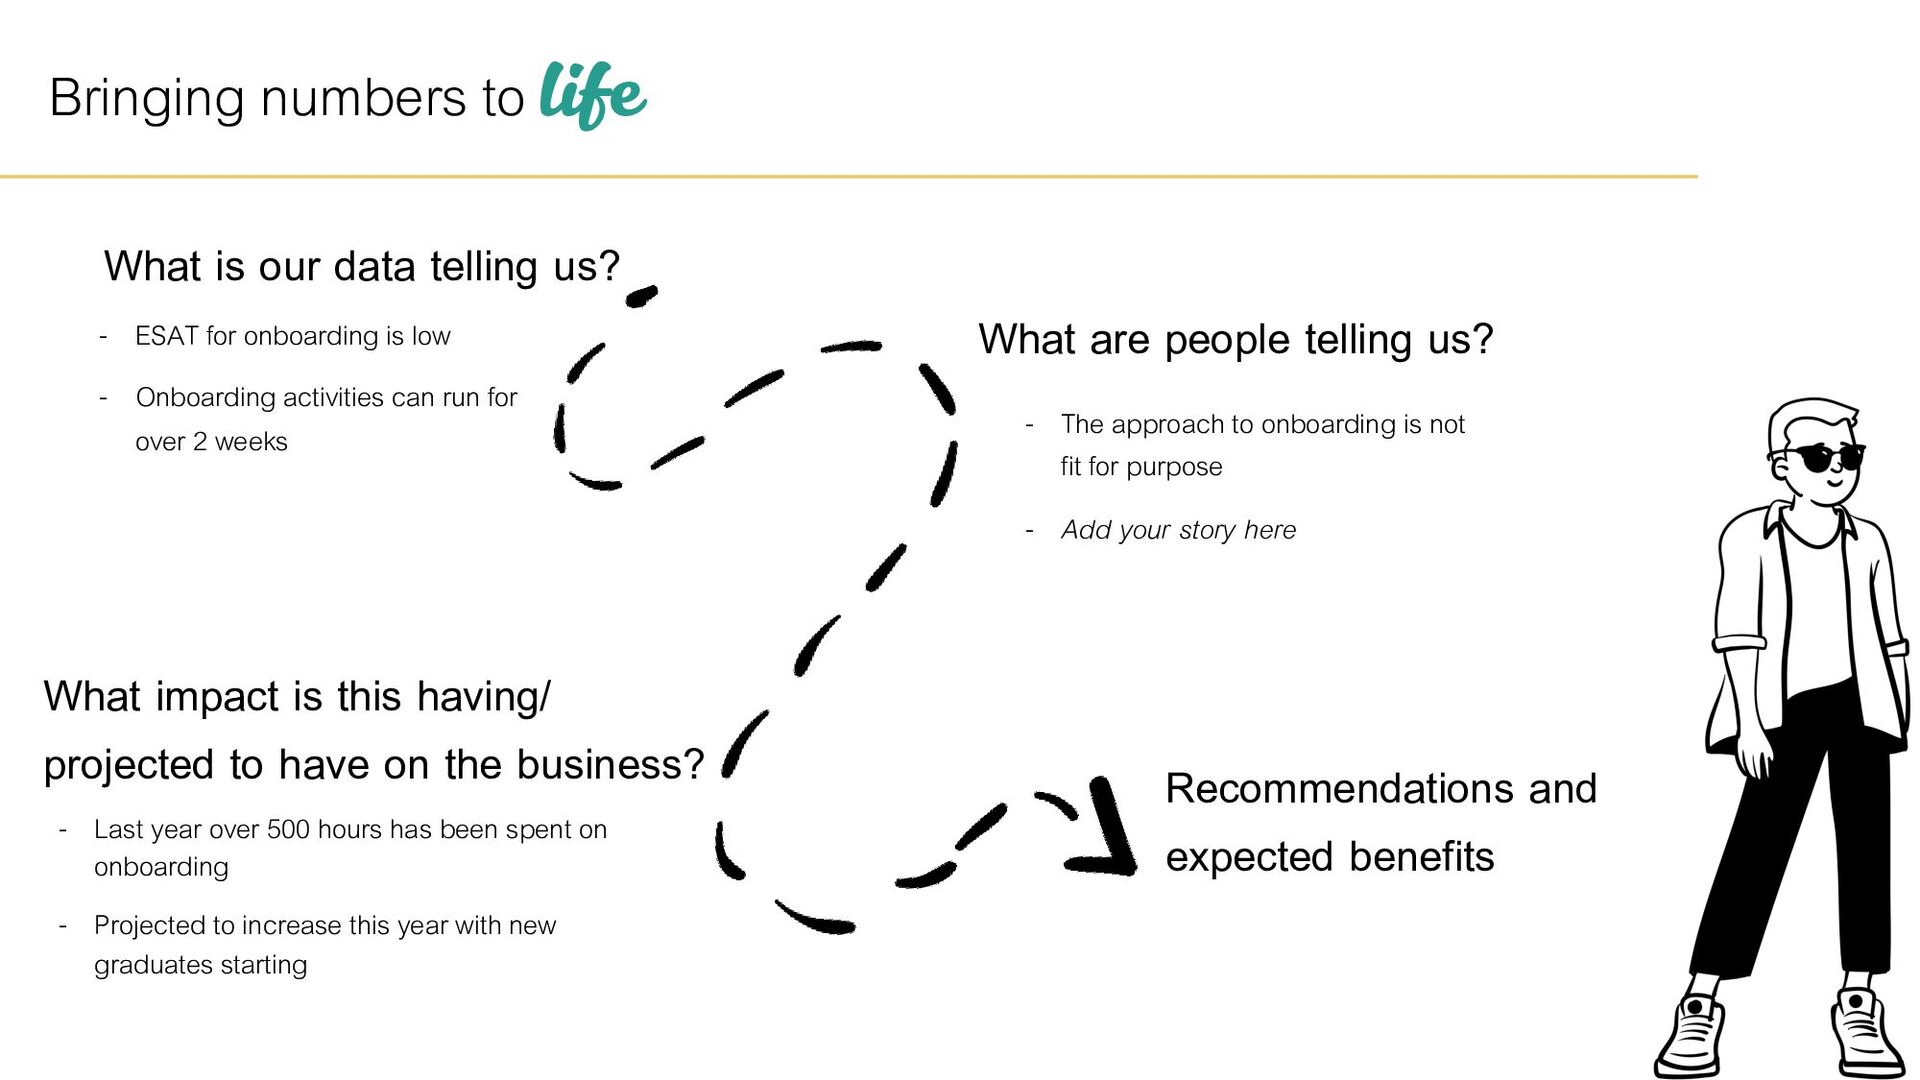
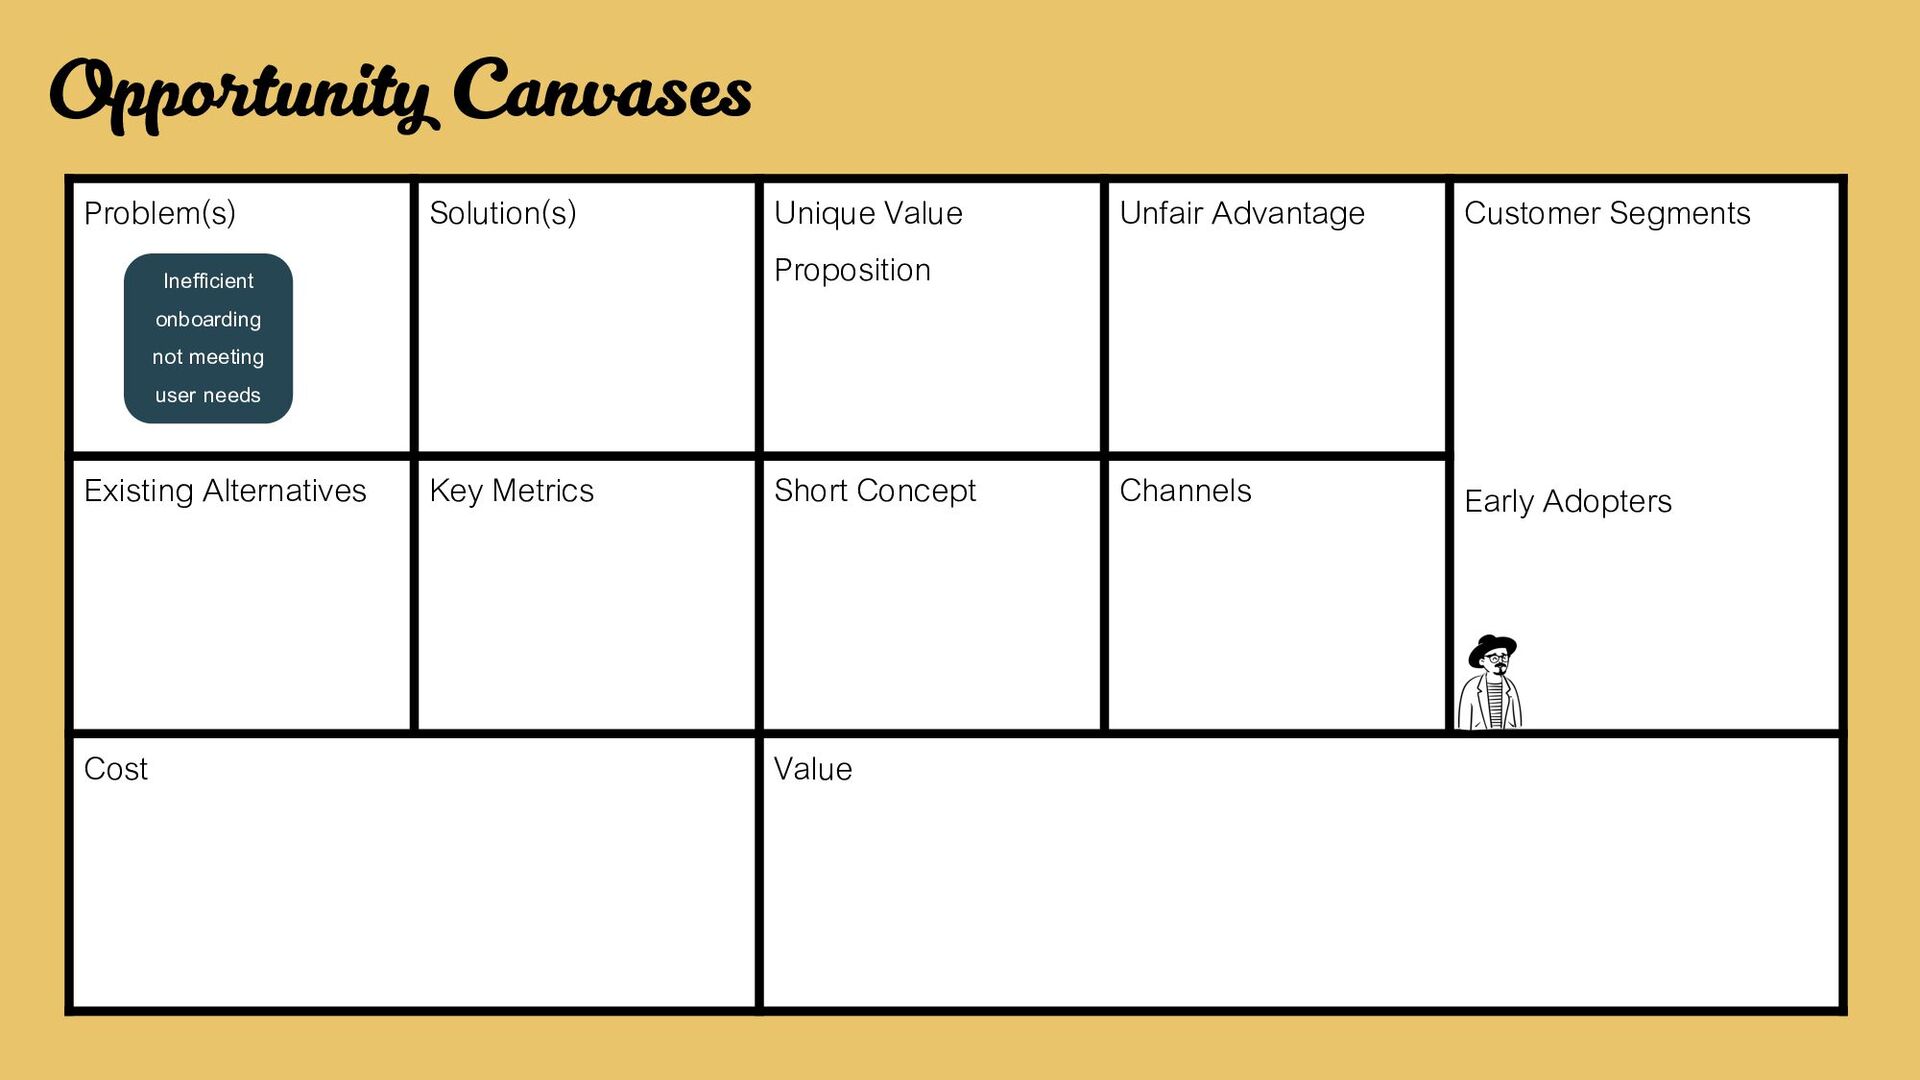
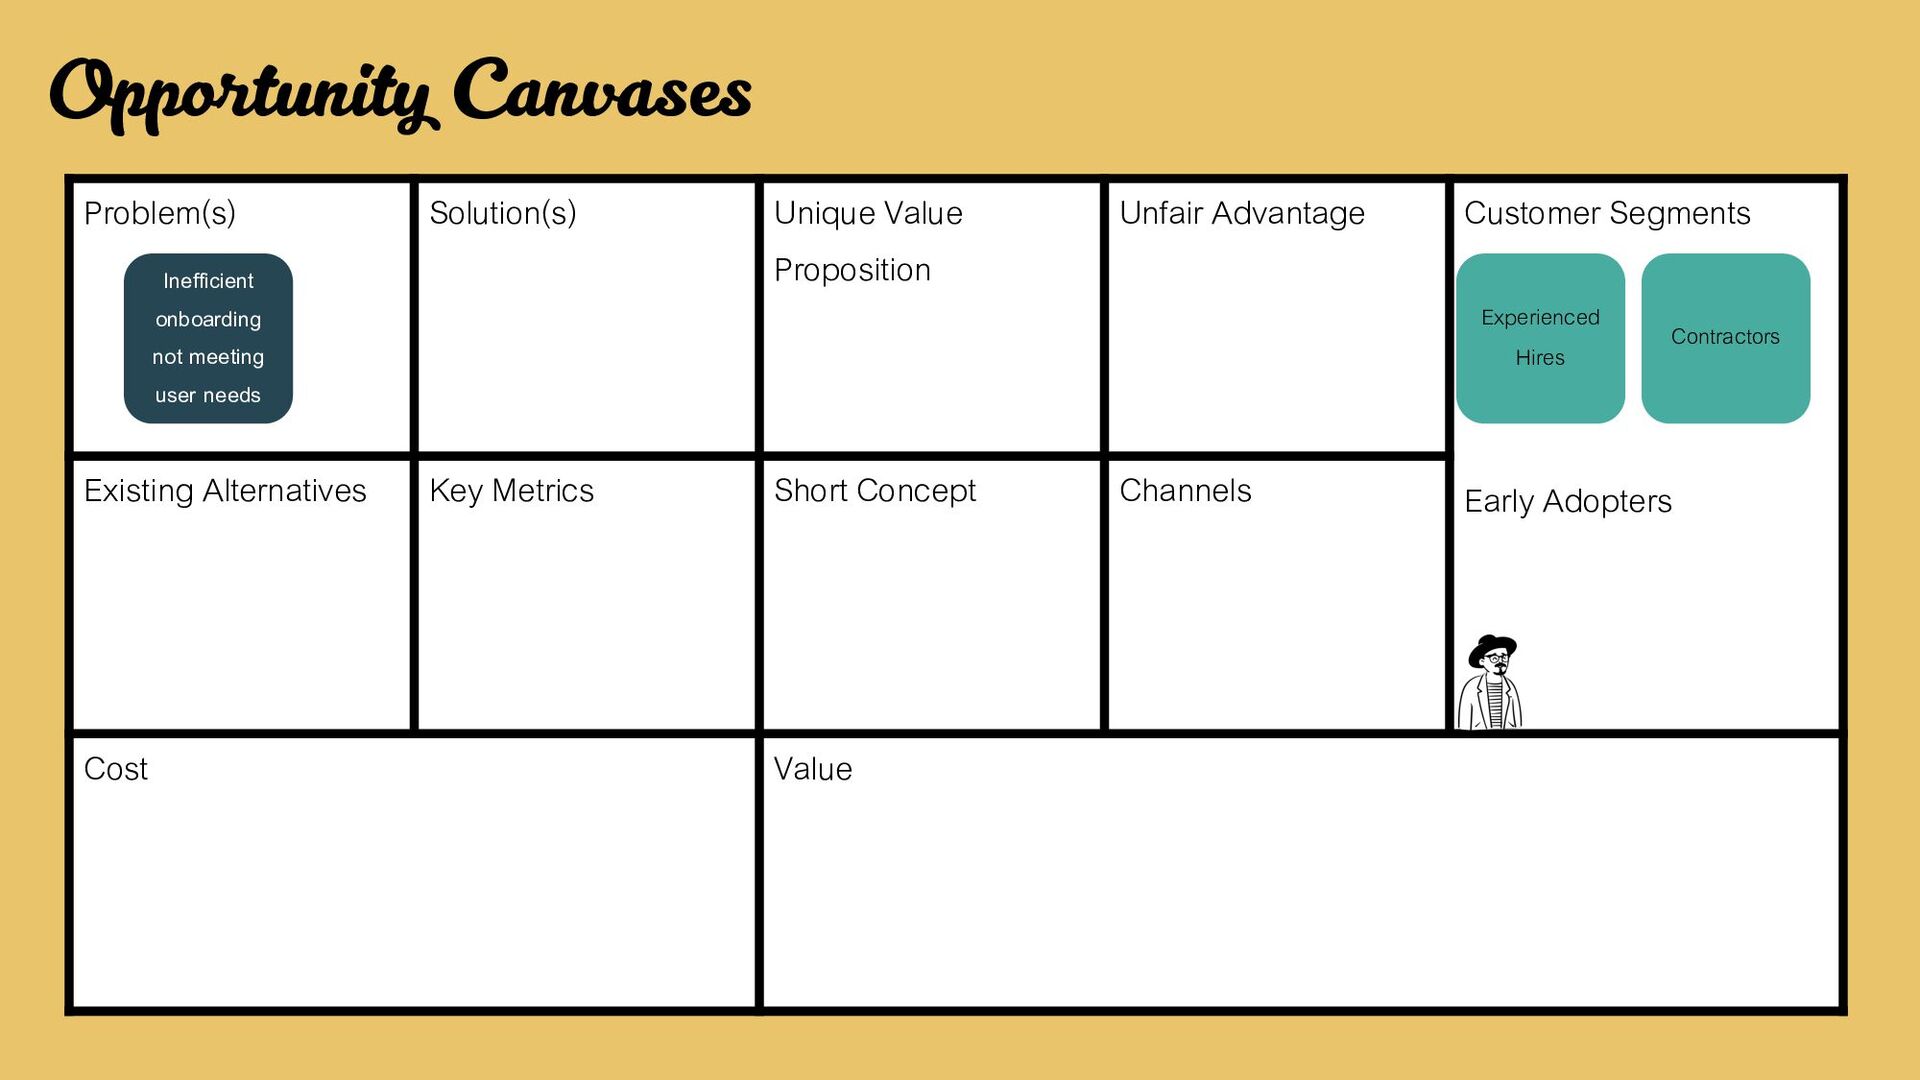
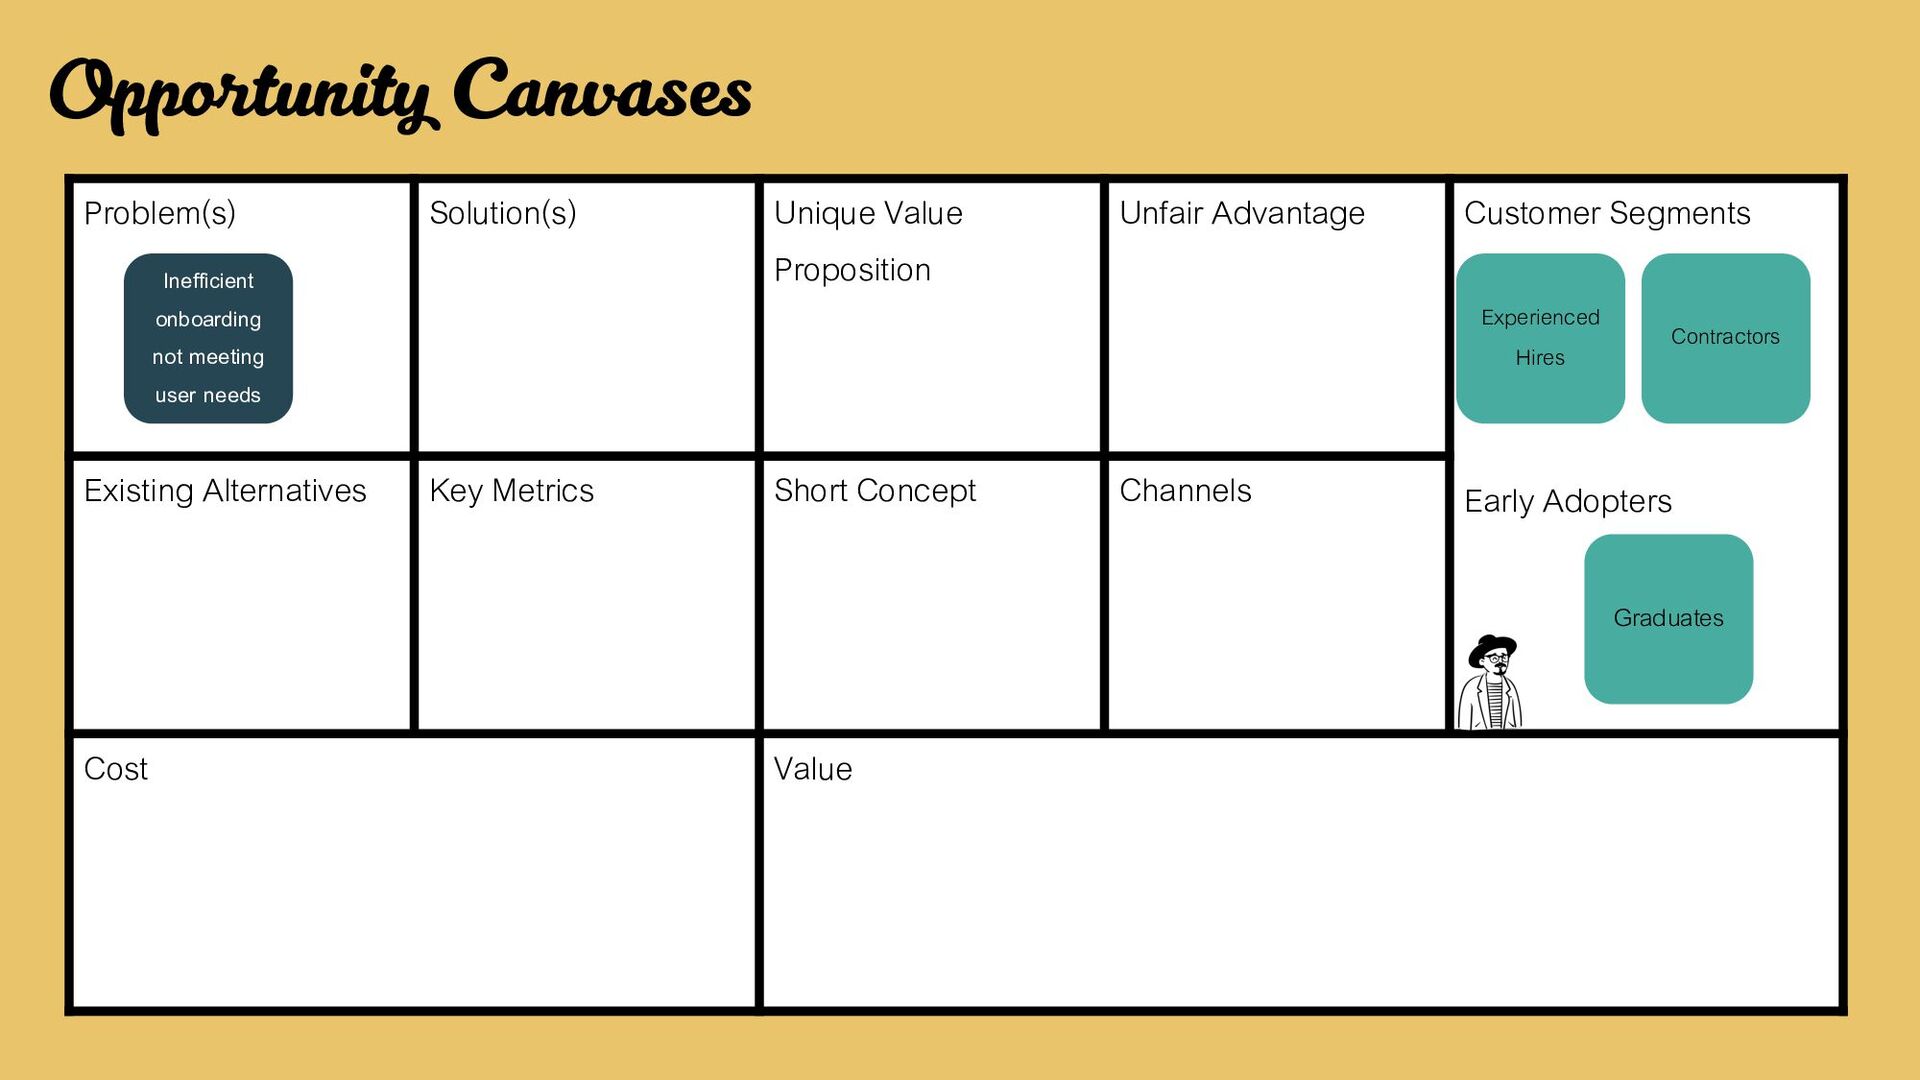
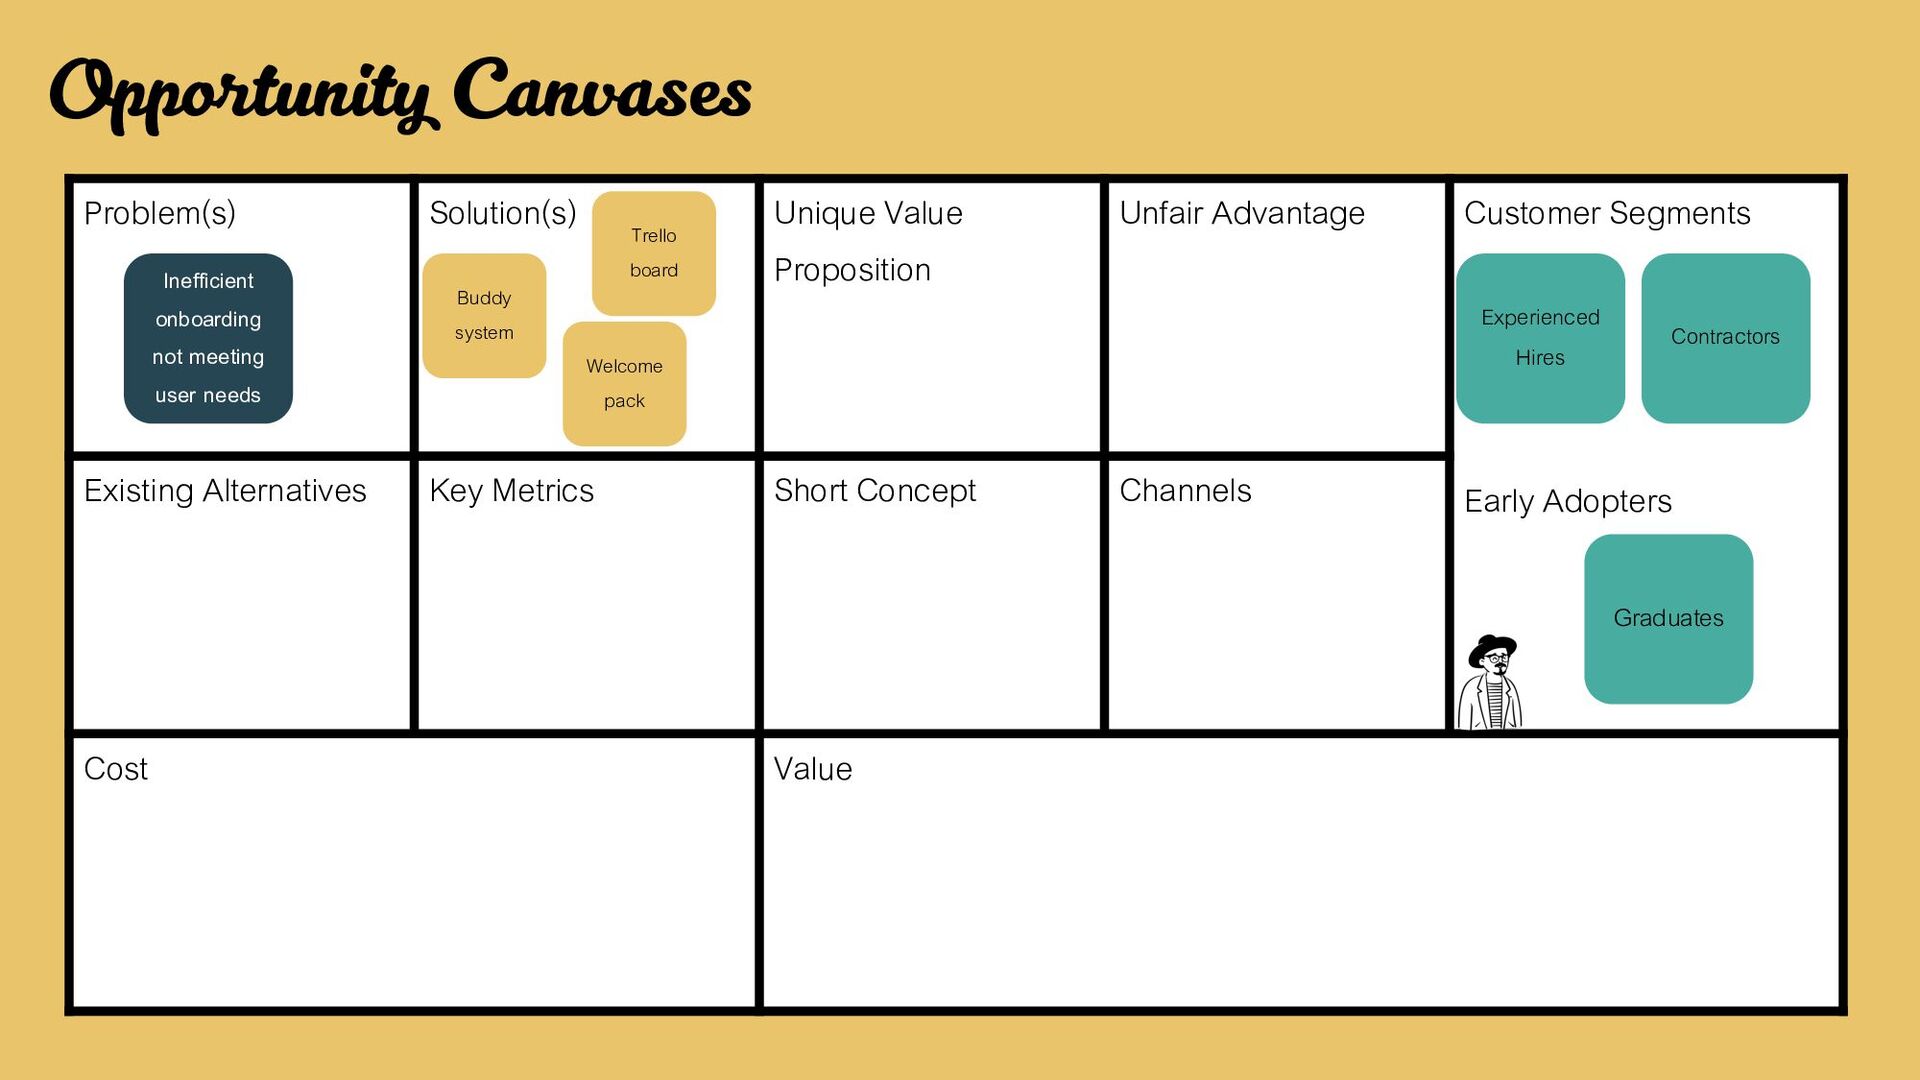
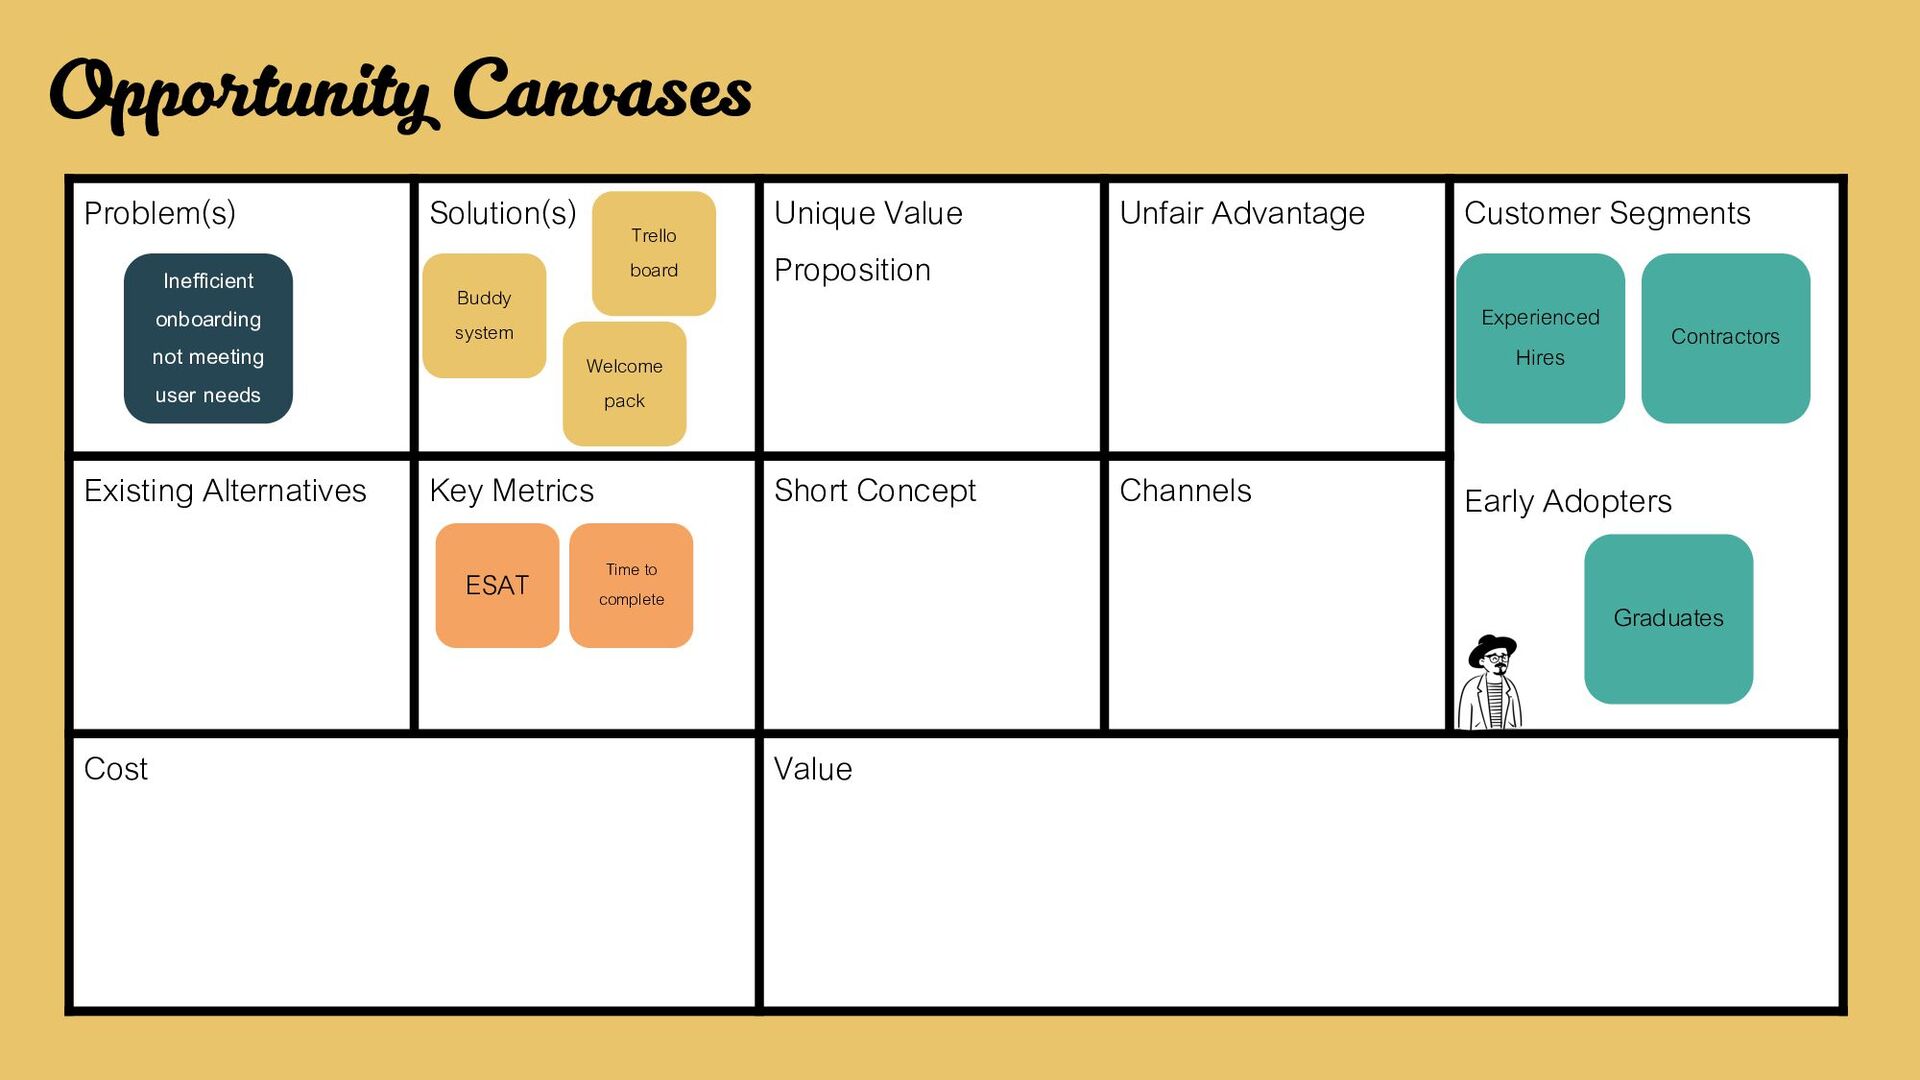
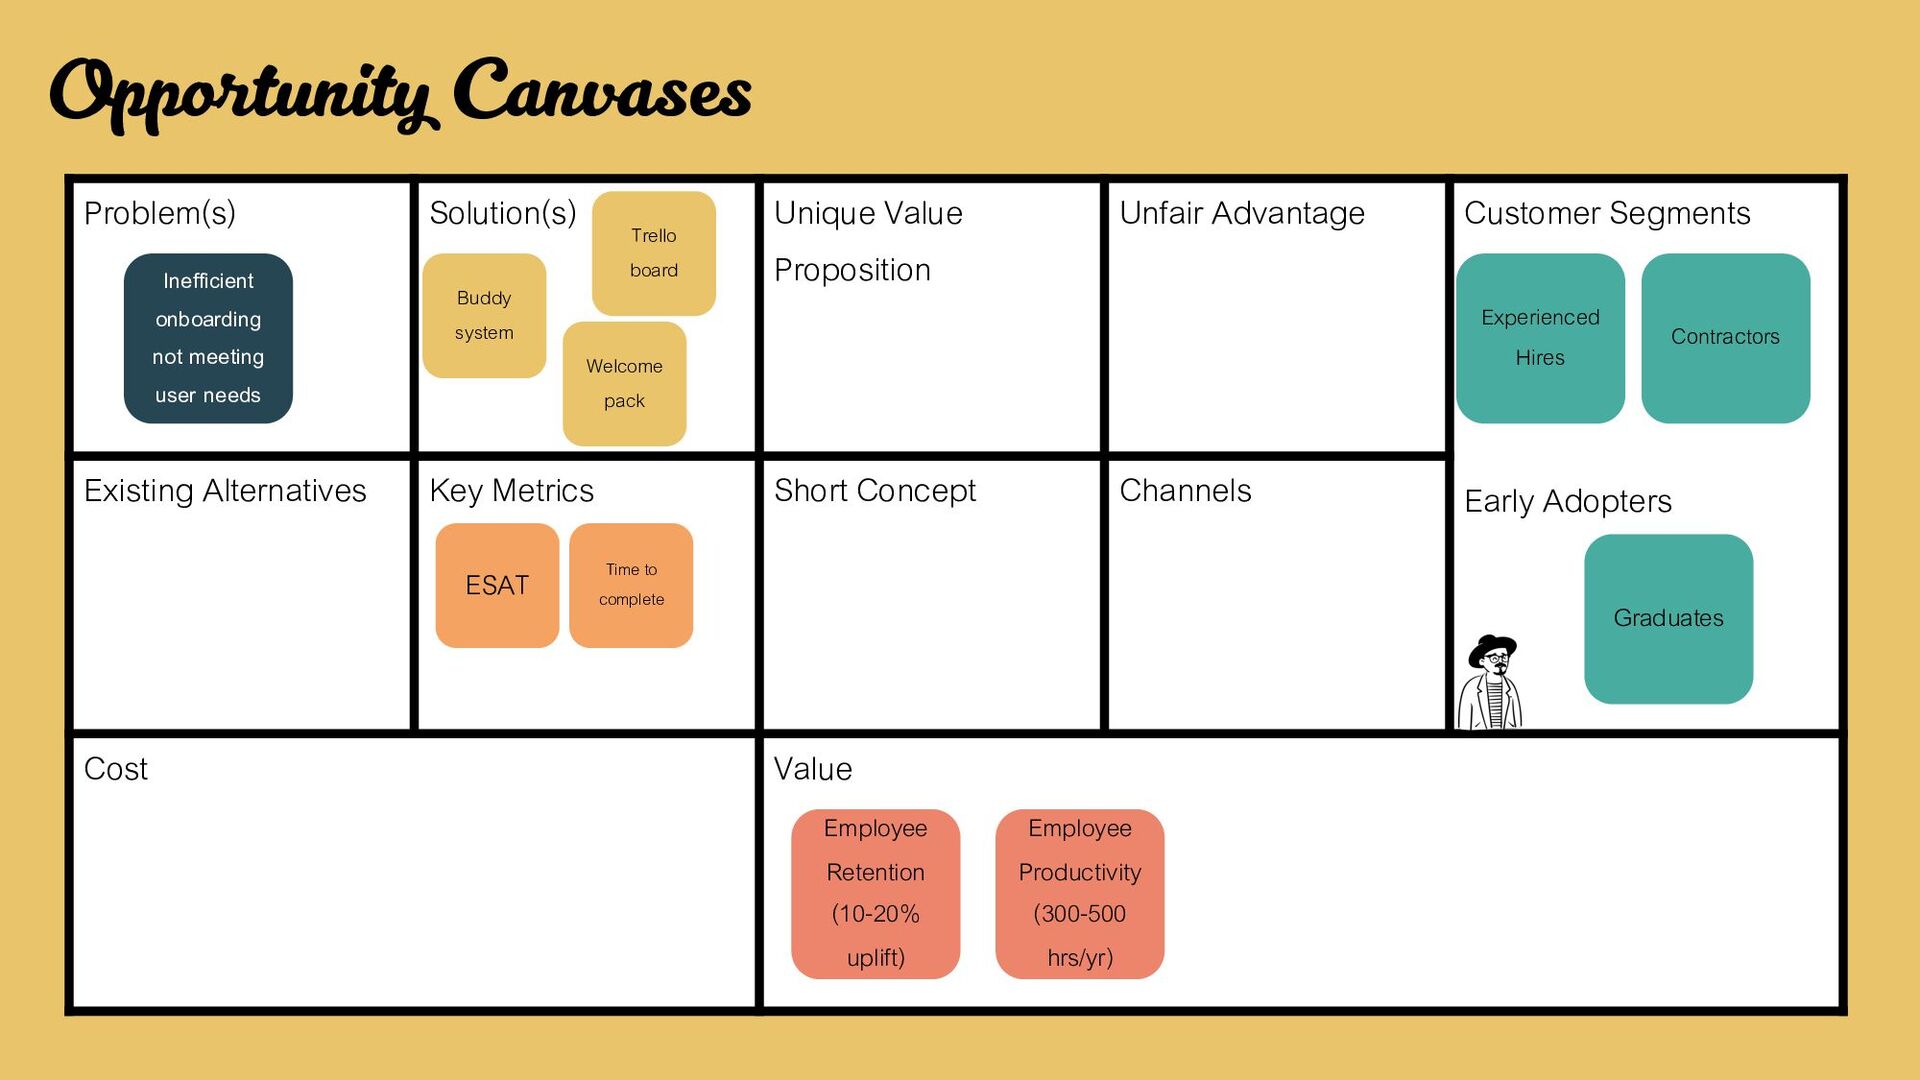
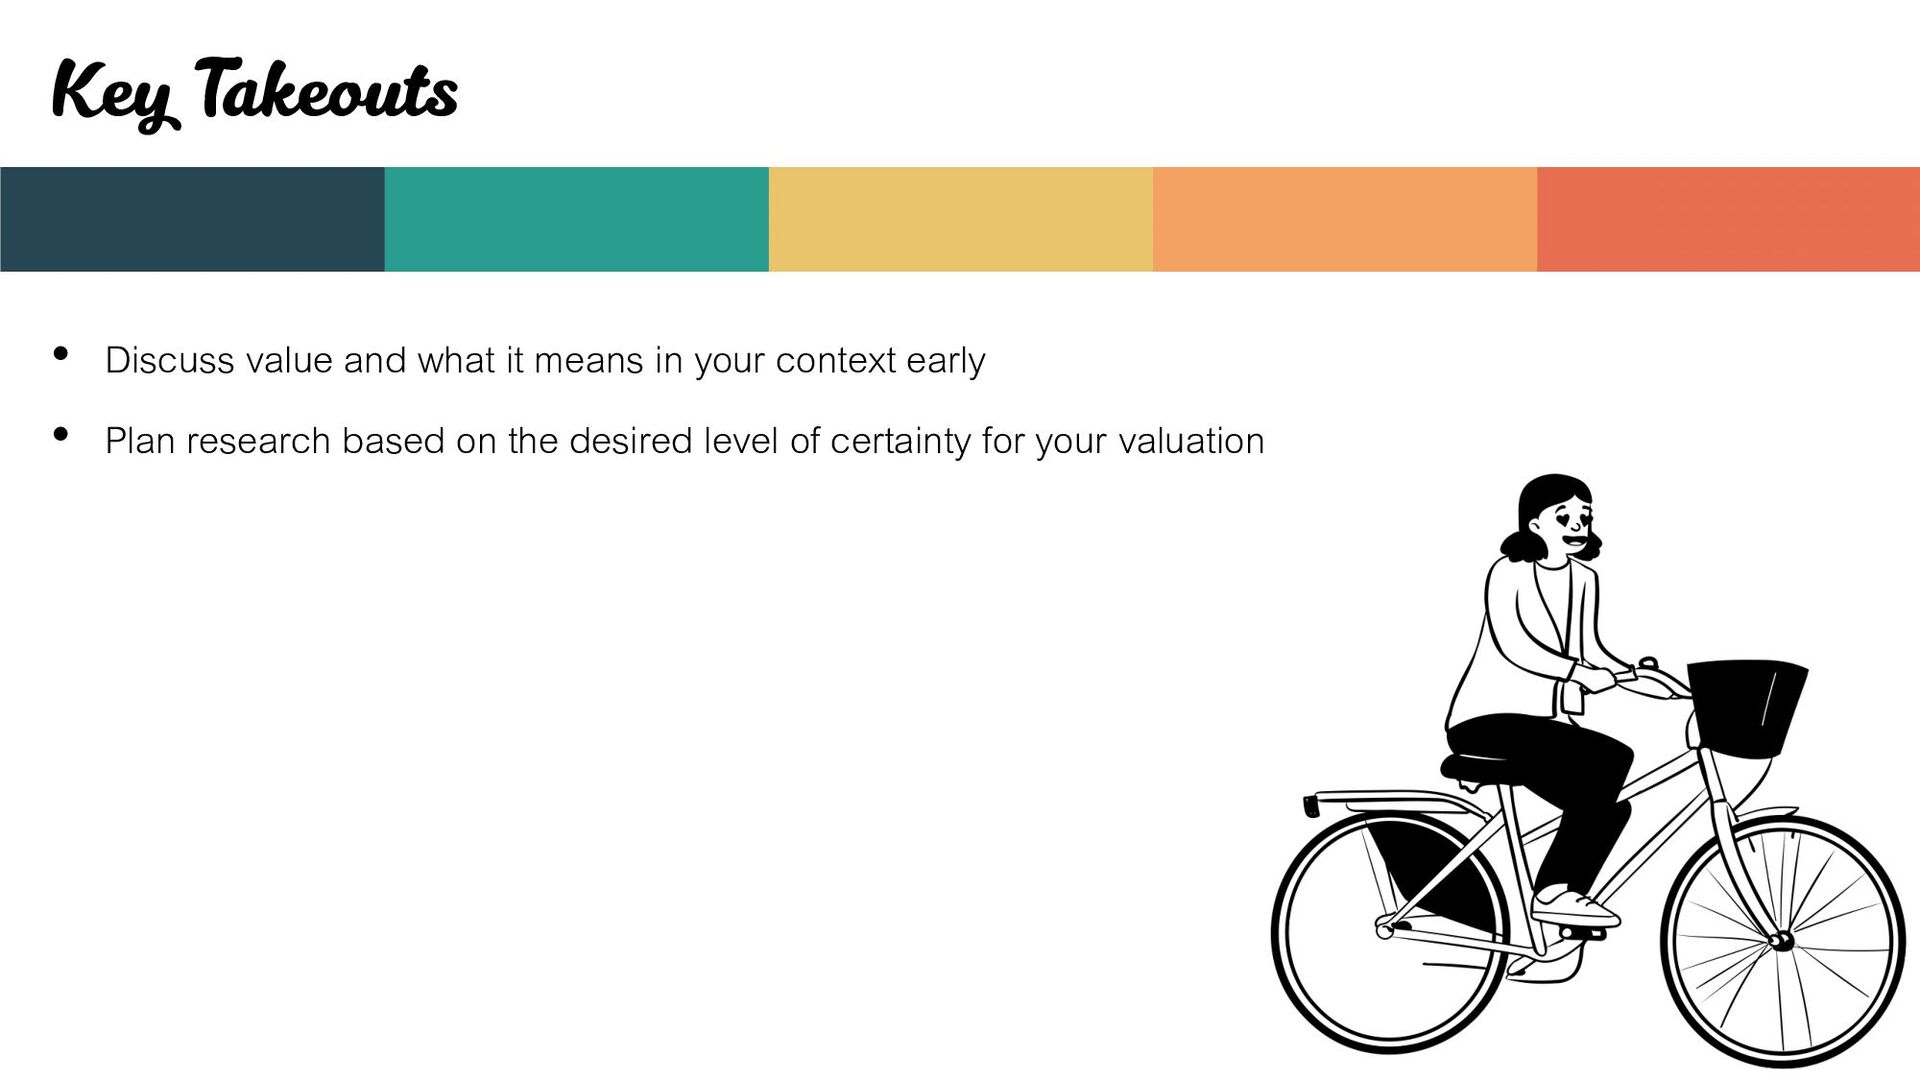
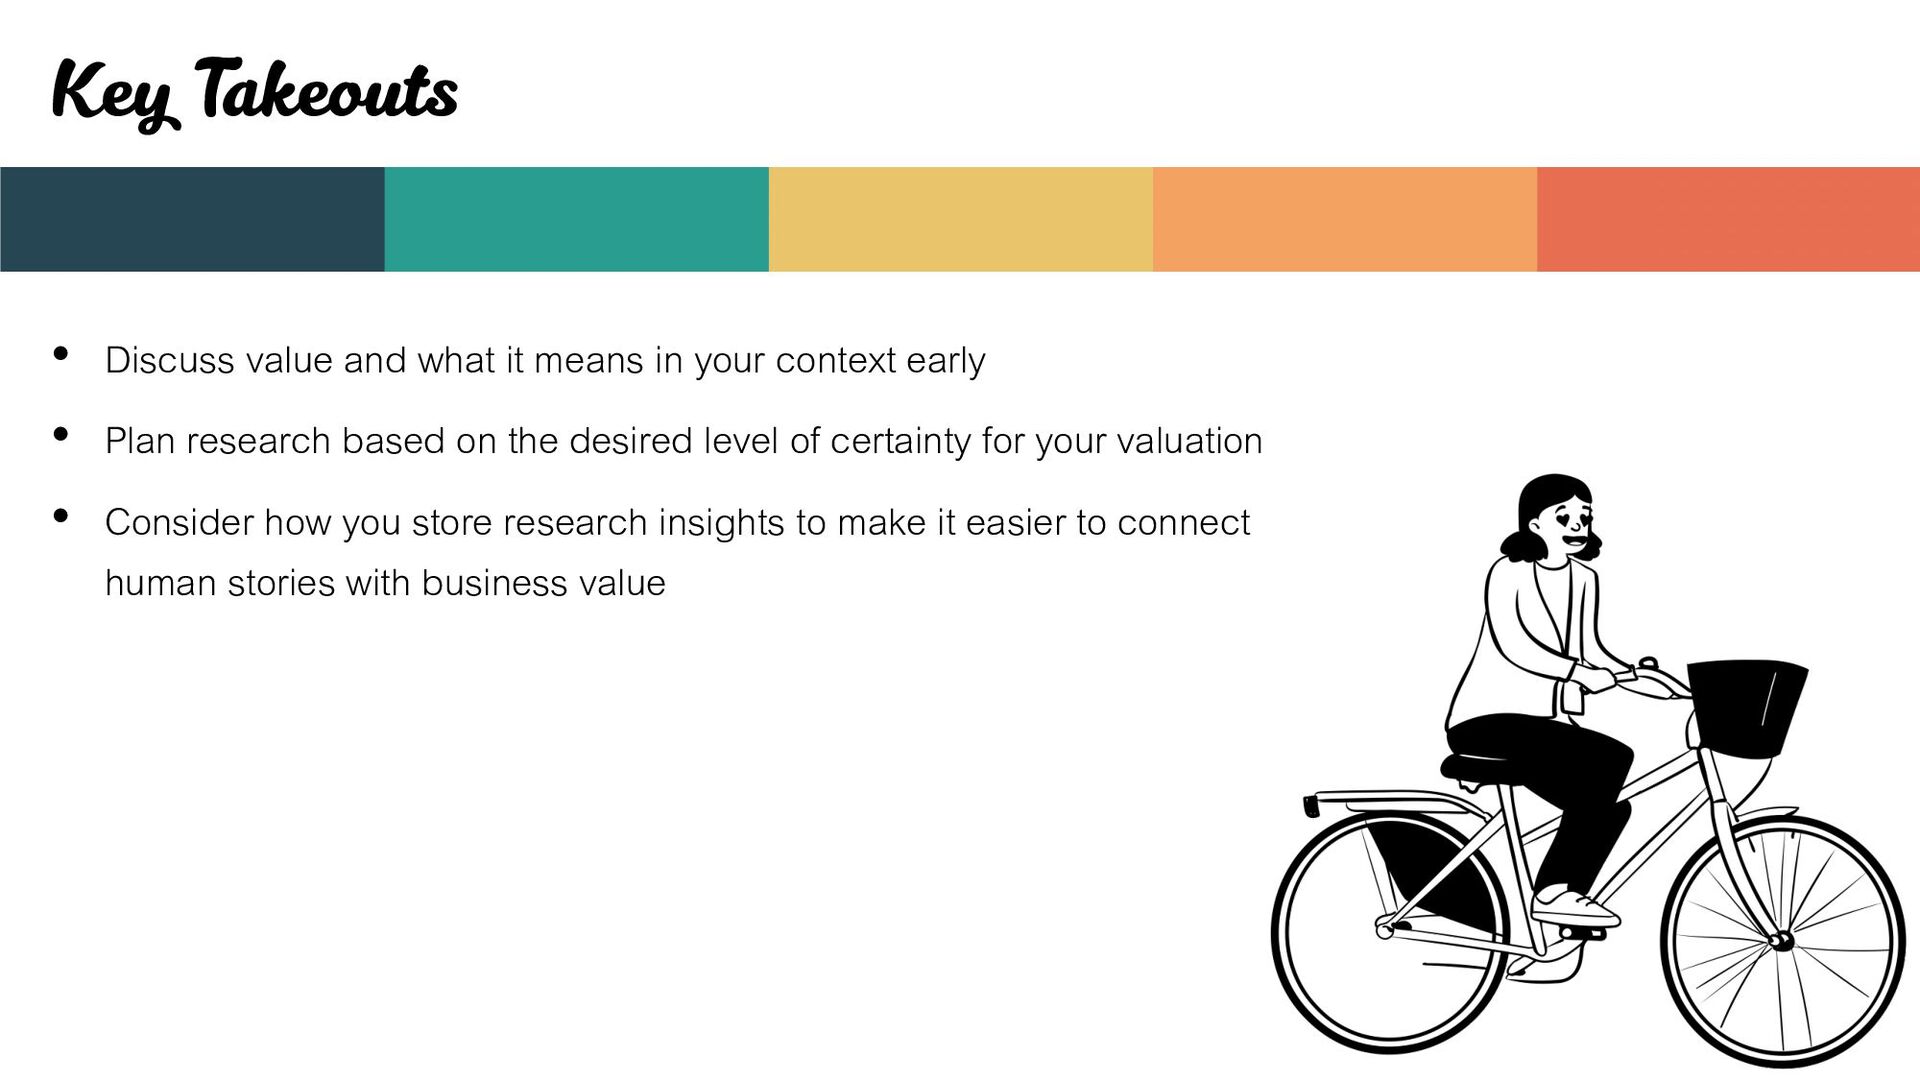
    What are people telling us?
    What impact is this having/
    projected to have on the business? Recommendations and
    expected benefits
    - ESAT for onboarding is low
    - Onboarding activities can run for
    over 2 weeks - The approach to onboarding is not
    fit for purpose
    - Add your story here
    - Last year over 500 hours has been spent on
    onboarding
    - Projected to increase this year with new
    graduates starting

    View Slide

  70. Opportunity Canvases
    Problem(s) Solution(s) Unique Value
    Proposition
    Unfair Advantage Customer Segments
    Early Adopters
    Existing Alternatives Key Metrics Short Concept Channels
    Cost Value

    View Slide

  71. Opportunity Canvases
    Problem(s) Solution(s) Unique Value
    Proposition
    Unfair Advantage Customer Segments
    Early Adopters
    Existing Alternatives Key Metrics Short Concept Channels
    Cost Value

    View Slide

  72. Opportunity Canvases
    Problem(s) Solution(s) Unique Value
    Proposition
    Unfair Advantage Customer Segments
    Early Adopters
    Existing Alternatives Key Metrics Short Concept Channels
    Cost Value
    Inefficient
    onboarding
    not meeting
    user needs

    View Slide

  73. Opportunity Canvases
    Problem(s) Solution(s) Unique Value
    Proposition
    Unfair Advantage Customer Segments
    Early Adopters
    Existing Alternatives Key Metrics Short Concept Channels
    Cost Value
    Inefficient
    onboarding
    not meeting
    user needs
    Experienced
    Hires
    Contractors

    View Slide

  74. Opportunity Canvases
    Problem(s) Solution(s) Unique Value
    Proposition
    Unfair Advantage Customer Segments
    Early Adopters
    Existing Alternatives Key Metrics Short Concept Channels
    Cost Value
    Inefficient
    onboarding
    not meeting
    user needs
    Graduates
    Experienced
    Hires
    Contractors

    View Slide

  75. Opportunity Canvases
    Problem(s) Solution(s) Unique Value
    Proposition
    Unfair Advantage Customer Segments
    Early Adopters
    Existing Alternatives Key Metrics Short Concept Channels
    Cost Value
    Buddy
    system
    Welcome
    pack
    Trello
    board
    Inefficient
    onboarding
    not meeting
    user needs
    Graduates
    Experienced
    Hires
    Contractors

    View Slide

  76. Opportunity Canvases
    Problem(s) Solution(s) Unique Value
    Proposition
    Unfair Advantage Customer Segments
    Early Adopters
    Existing Alternatives Key Metrics Short Concept Channels
    Cost Value
    Buddy
    system
    Welcome
    pack
    Trello
    board
    ESAT Time to
    complete
    Inefficient
    onboarding
    not meeting
    user needs
    Graduates
    Experienced
    Hires
    Contractors

    View Slide

  77. Opportunity Canvases
    Problem(s) Solution(s) Unique Value
    Proposition
    Unfair Advantage Customer Segments
    Early Adopters
    Existing Alternatives Key Metrics Short Concept Channels
    Cost Value
    Buddy
    system
    Welcome
    pack
    Trello
    board
    ESAT Time to
    complete
    Employee
    Retention
    (10-20%
    uplift)
    Employee
    Productivity
    (300-500
    hrs/yr)
    Inefficient
    onboarding
    not meeting
    user needs
    Graduates
    Experienced
    Hires
    Contractors

    View Slide

  78. Key Takeouts

    View Slide

  79. Key Takeouts
    • Discuss value and what it means in your context early

    View Slide

  80. Key Takeouts
    • Discuss value and what it means in your context early
    • Plan research based on the desired level of certainty for your valuation

    View Slide

  81. Key Takeouts
    • Discuss value and what it means in your context early
    • Plan research based on the desired level of certainty for your valuation
    • Consider how you store research insights to make it easier to connect
    human stories with business value

    View Slide

  82. Questions?

    View Slide