Upgrade to Pro
— share decks privately, control downloads, hide ads and more …
Speaker Deck
Features
Speaker Deck
PRO
Sign in
Sign up for free
Search
Search
Session 409 - Learning Instruments
Search
wwdcman
August 27, 2012
150
1
Share
Embed
Copy iframe code
Copy JS code
Copy link
Start on current slide
Session 409 - Learning Instruments
wwdcman
August 27, 2012
More Decks by wwdcman
See All by wwdcman
Session 412 - Debugging with Xcode
wwdcman
0
140
Session 404 - Building from the Command Line with Xcode
wwdcman
0
170
Session 306 - Integrating With Facebook, Twitter and Sina Weibo
wwdcman
0
220
Session 230 - Advanced Attributed Strings for iOS
wwdcman
0
110
Session 228 - Best Practices for Mastering Auto Layout
wwdcman
0
1.6k
Session 227 - Using iCloud with Core Data
wwdcman
0
310
Session 226 - Core Text and Fonts
wwdcman
0
130
Session 225 - Up and Running: Making a Great Impression with Every Launch
wwdcman
0
140
Session 224 - Using iCloud with NSDocument
wwdcman
0
350
Featured
See All Featured
Paper Plane (Part 1)
katiecoart
PRO
0
9.5k
Scaling GitHub
holman
464
140k
SEO in 2025: How to Prepare for the Future of Search
ipullrank
3
3.6k
Context Engineering - Making Every Token Count
addyosmani
9
1k
How Fast Is Fast Enough? [PerfNow 2025]
tammyeverts
3
650
Future Trends and Review - Lecture 12 - Web Technologies (1019888BNR)
signer
PRO
0
3.6k
Code Review Best Practice
trishagee
74
20k
The Hidden Cost of Media on the Web [PixelPalooza 2025]
tammyeverts
2
340
Navigating Weather and Climate Data
rabernat
0
280
A Soul's Torment
seathinner
6
3k
The State of eCommerce SEO: How to Win in Today's Products SERPs - #SEOweek
aleyda
2
11k
The Spectacular Lies of Maps
axbom
PRO
1
850
Transcript
These are confidential sessions—please refrain from streaming, blogging, or taking
pictures Profiling your App Session 409 Learning Instruments David M. O’Rourke Performance Tools Engineering Manager
What You’ll Learn Today
What You’ll Learn Today •Elements of performance
What You’ll Learn Today •Elements of performance •Methodology to improve
performance
What You’ll Learn Today •Elements of performance •Methodology to improve
performance •Instruments tour
What You’ll Learn Today •Elements of performance •Methodology to improve
performance •Instruments tour •iOS App optimization demonstrations
What Is Performance?
None
None
None
None
None
None
"Crashes all the time" "Crashes all the time"
None
None
None
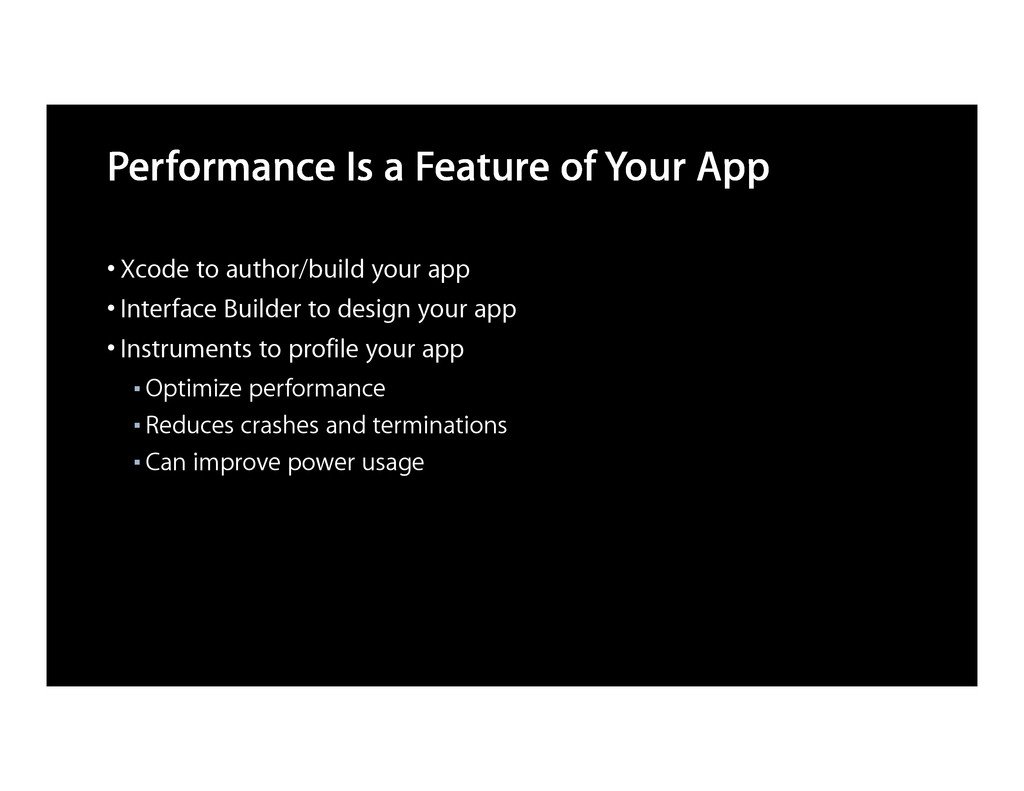
Performance Is a Feature of Your App
Performance Is a Feature of Your App •Xcode to author/build
your app
Performance Is a Feature of Your App •Xcode to author/build
your app •Interface Builder to design your app
Performance Is a Feature of Your App •Xcode to author/build
your app •Interface Builder to design your app •Instruments to profile your app ▪ Optimize performance ▪ Reduces crashes and terminations ▪ Can improve power usage
Performance Profile Process
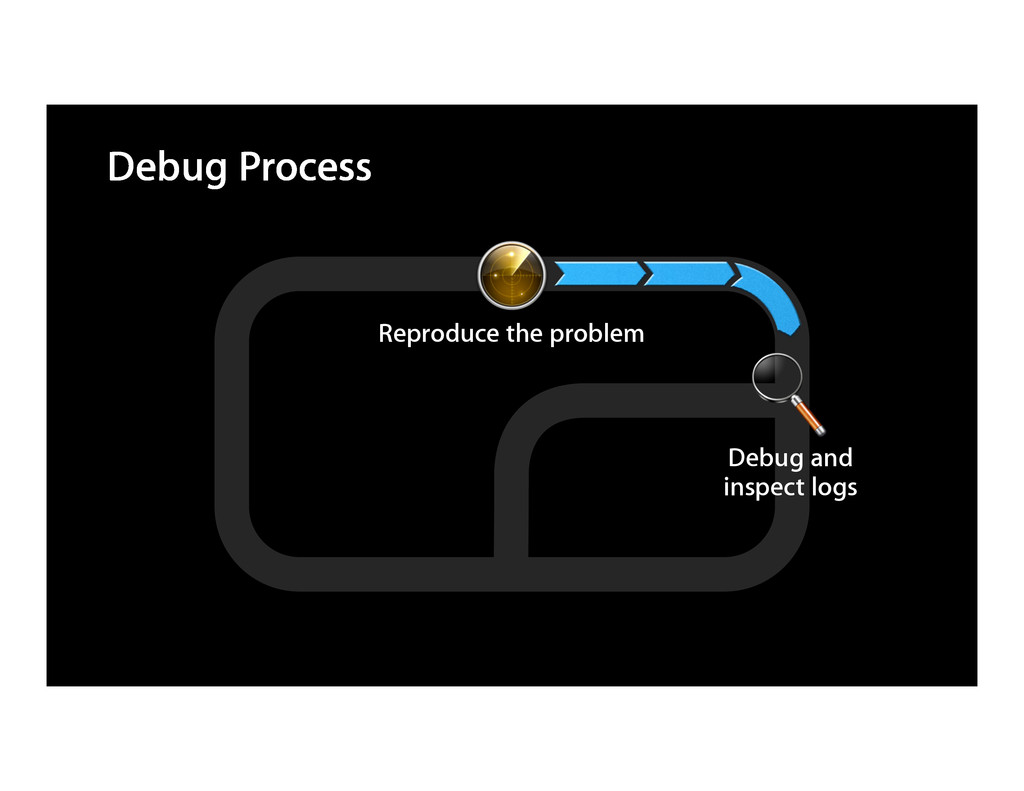
Debug Process
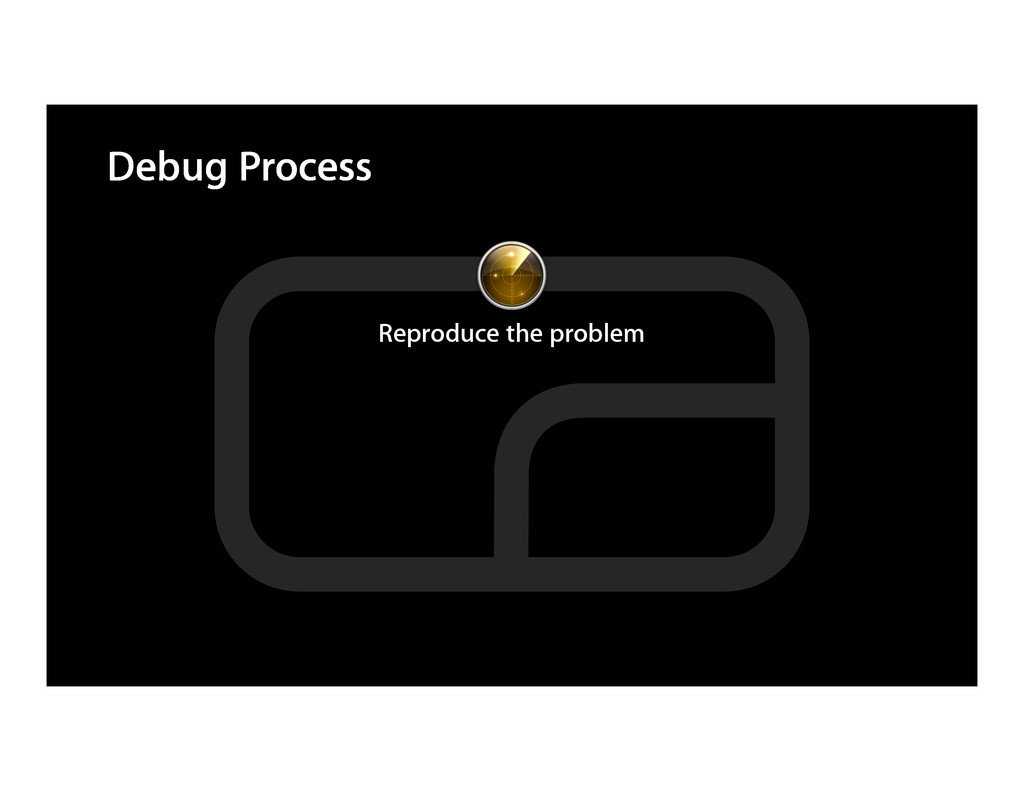
Debug Process Reproduce the problem
Debug Process Reproduce the problem Debug and inspect logs
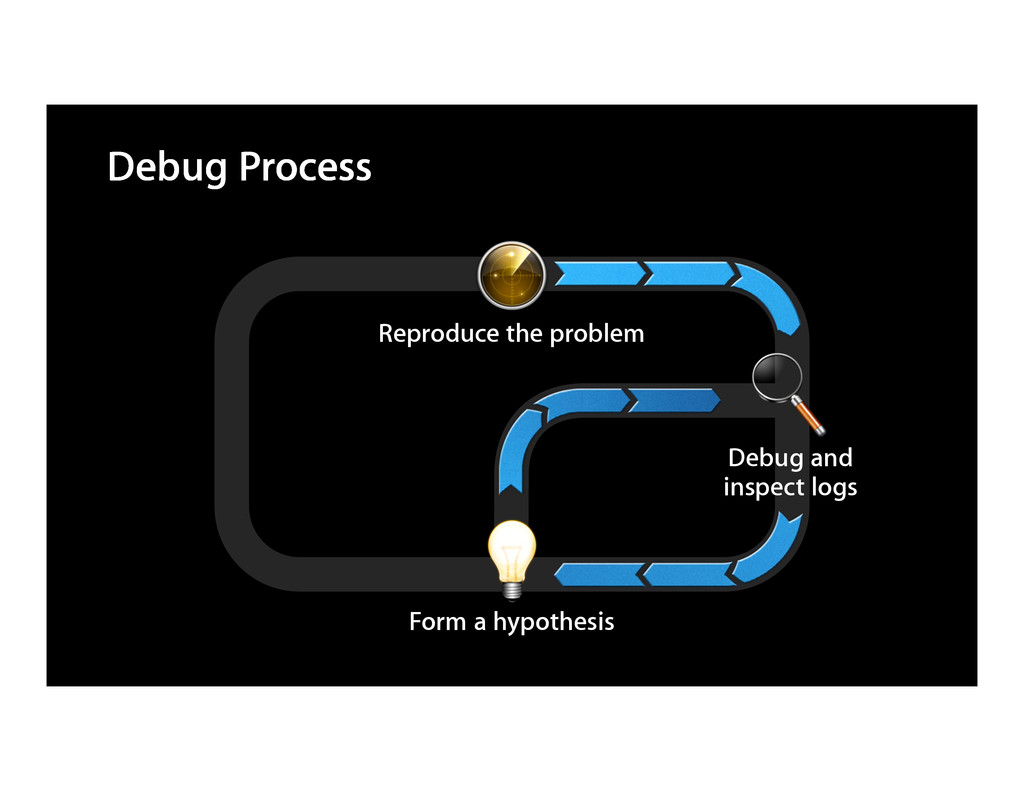
Debug Process Reproduce the problem Form a hypothesis Debug and
inspect logs
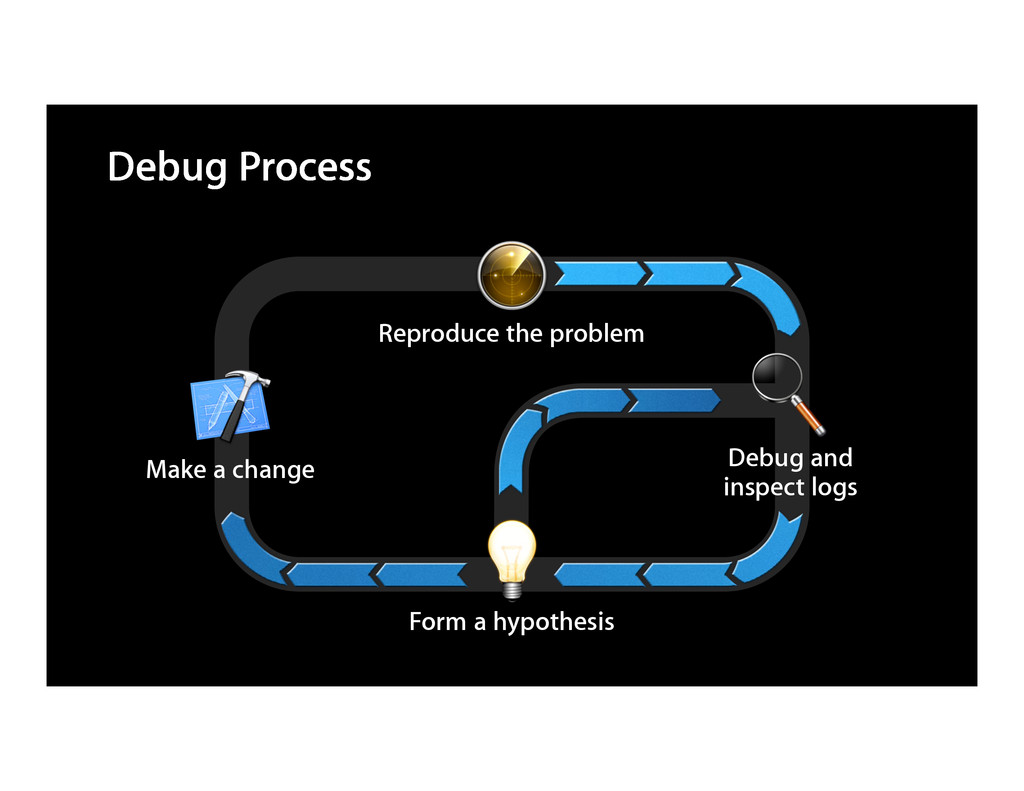
Debug Process Reproduce the problem Form a hypothesis Make a
change Debug and inspect logs
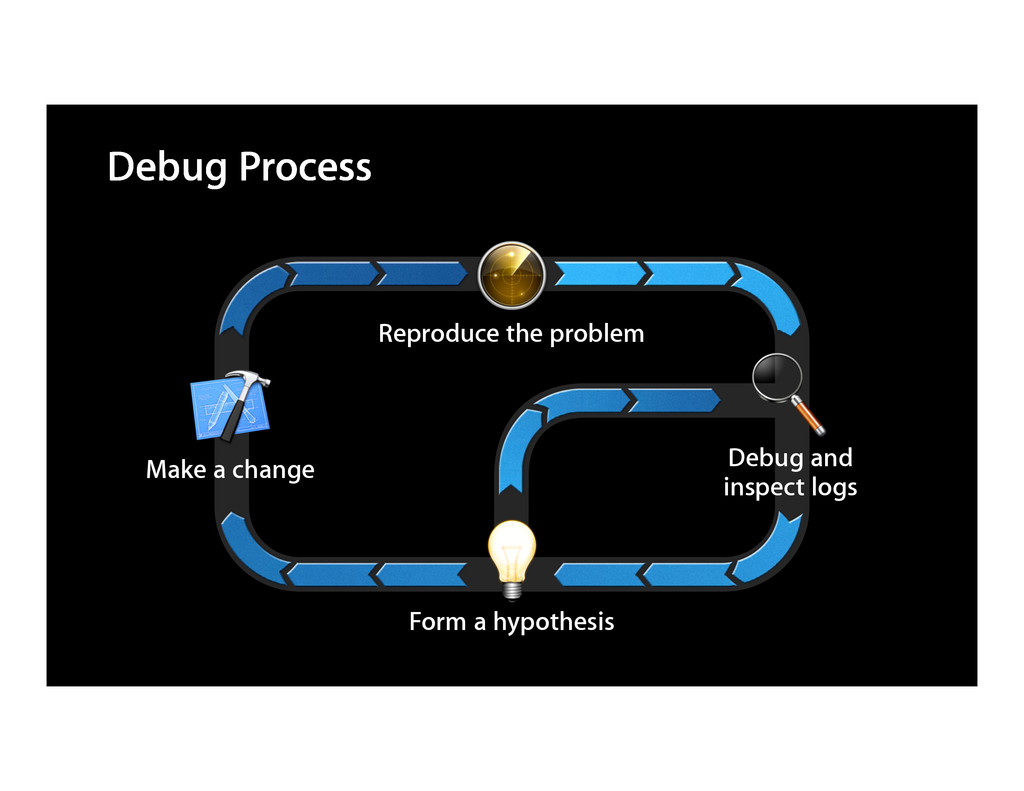
Debug Process Reproduce the problem Form a hypothesis Make a
change Debug and inspect logs
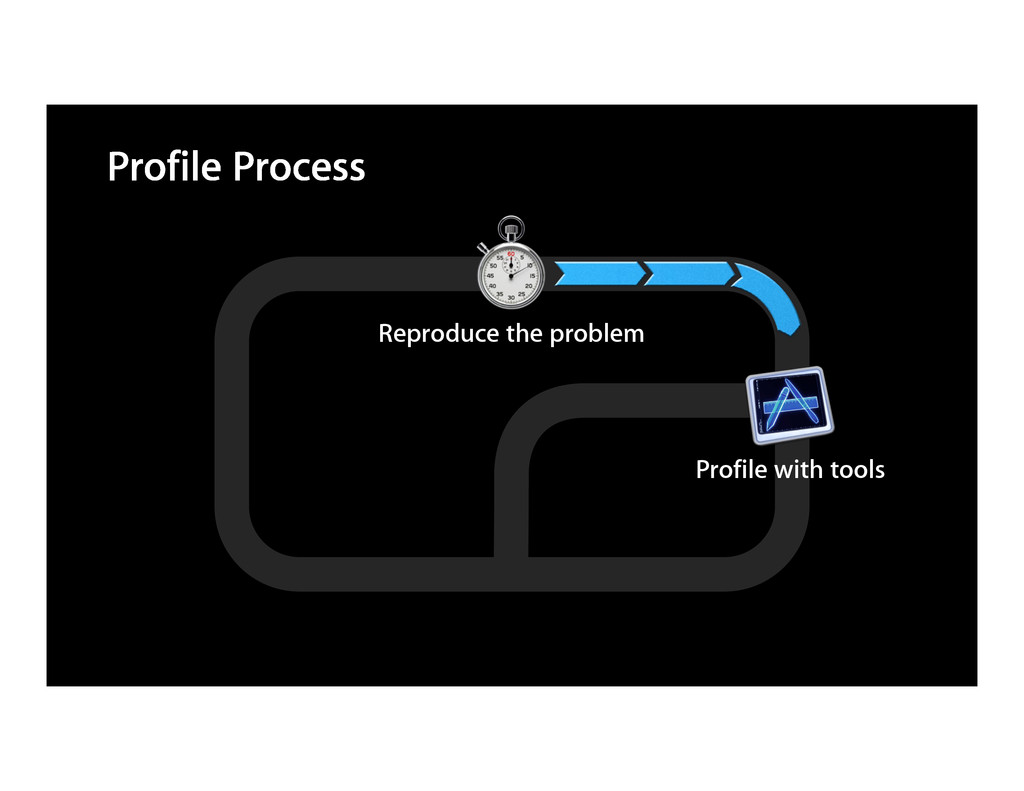
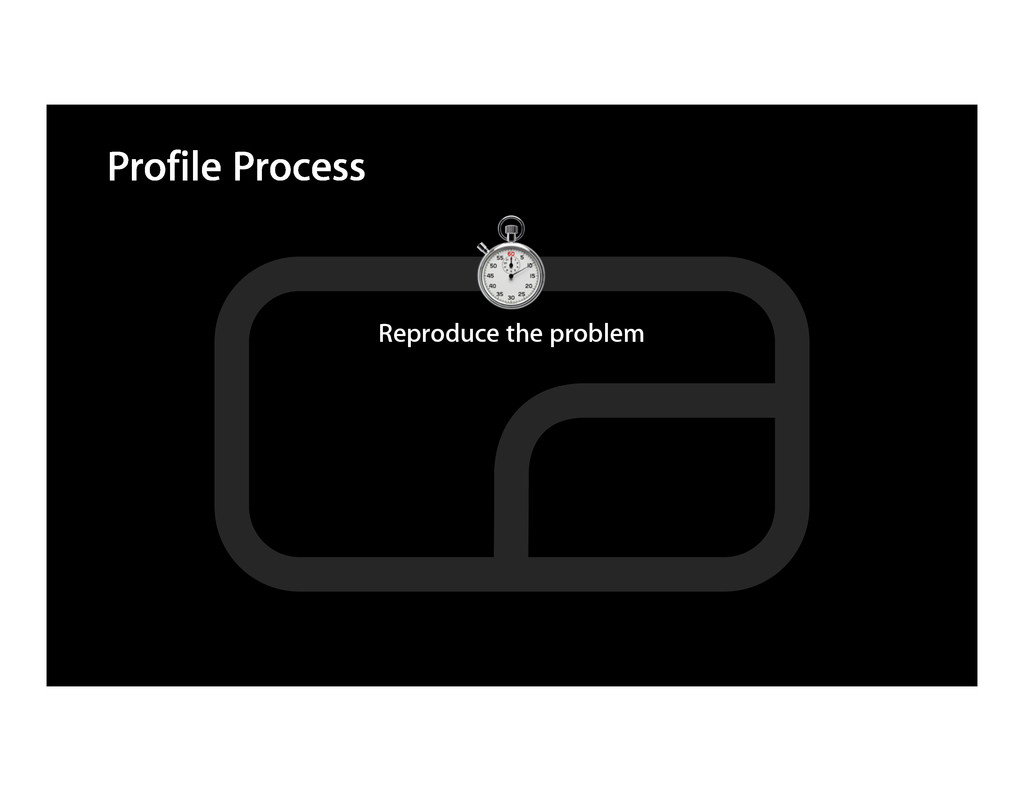
Profile Process
Profile Process Reproduce the problem
Profile Process Reproduce the problem Profile with tools
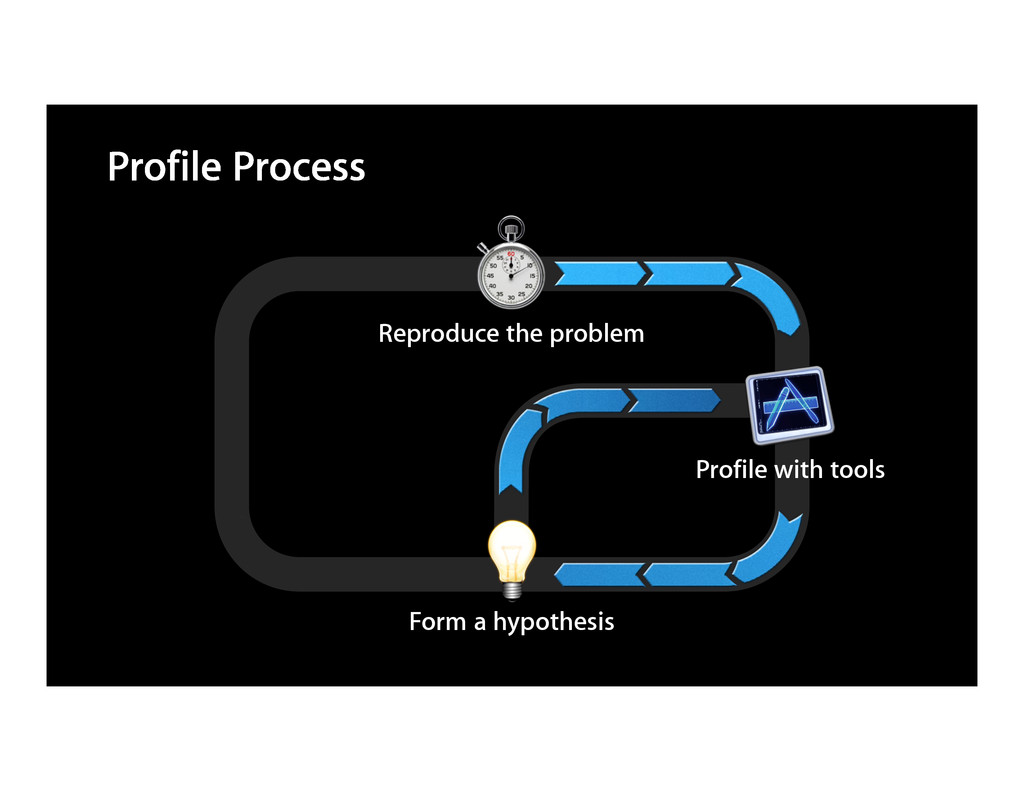
Profile Process Form a hypothesis Reproduce the problem Profile with
tools
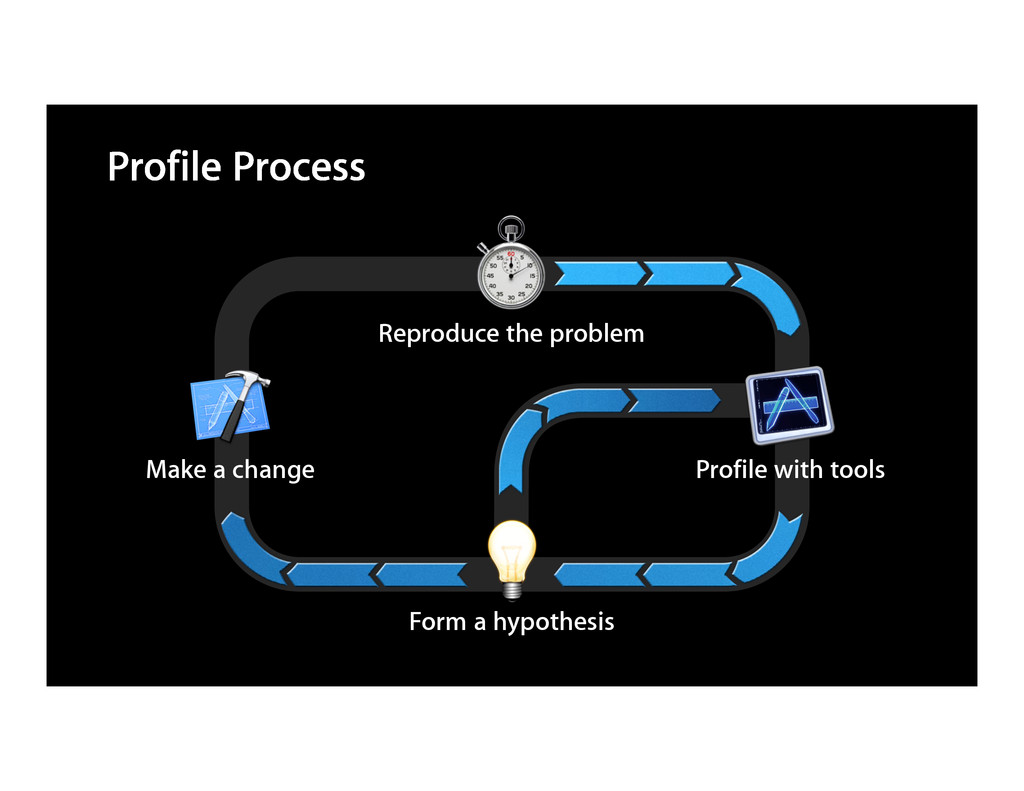
Profile Process Form a hypothesis Make a change Reproduce the
problem Profile with tools
Profile Process Form a hypothesis Make a change Reproduce the
problem Profile with tools
Where Can I Find Instruments?
Where Can I Find Instruments?
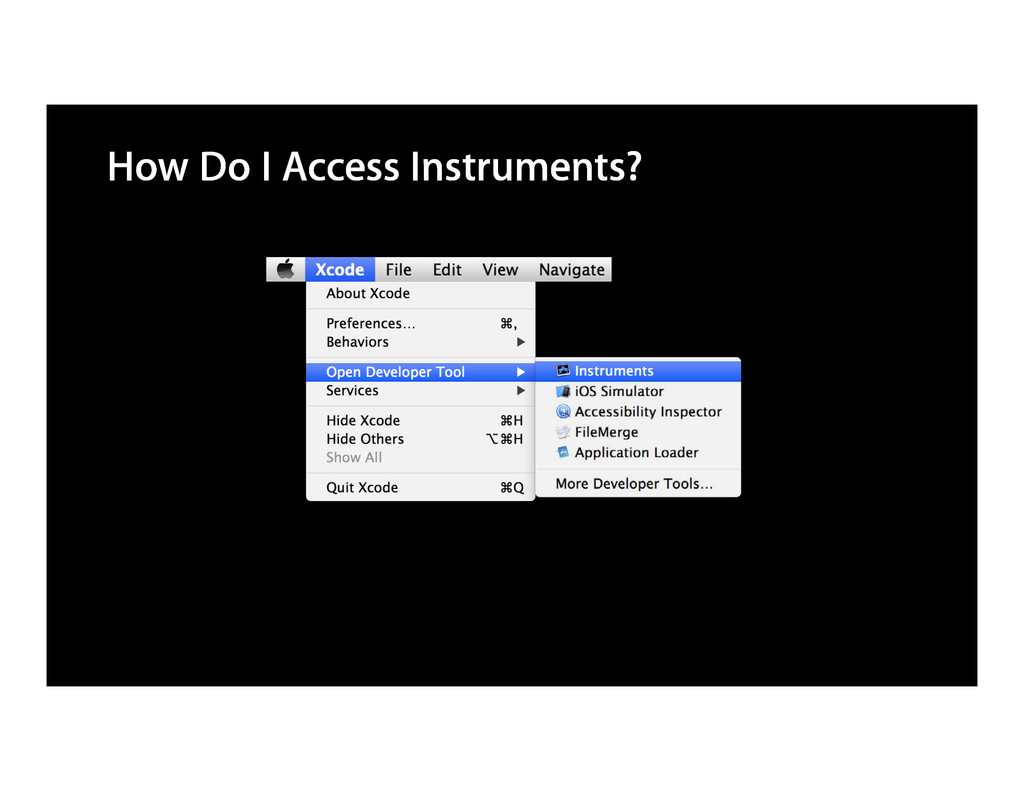
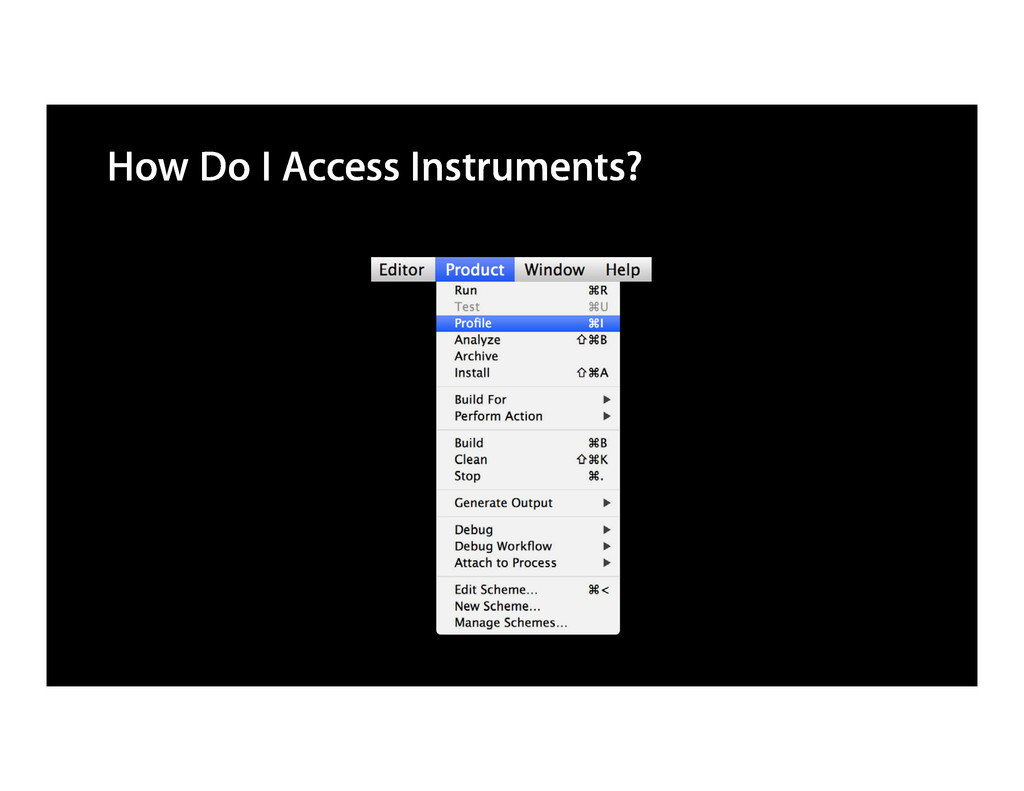
How Do I Access Instruments?
How Do I Access Instruments?
How Do I Access Instruments?
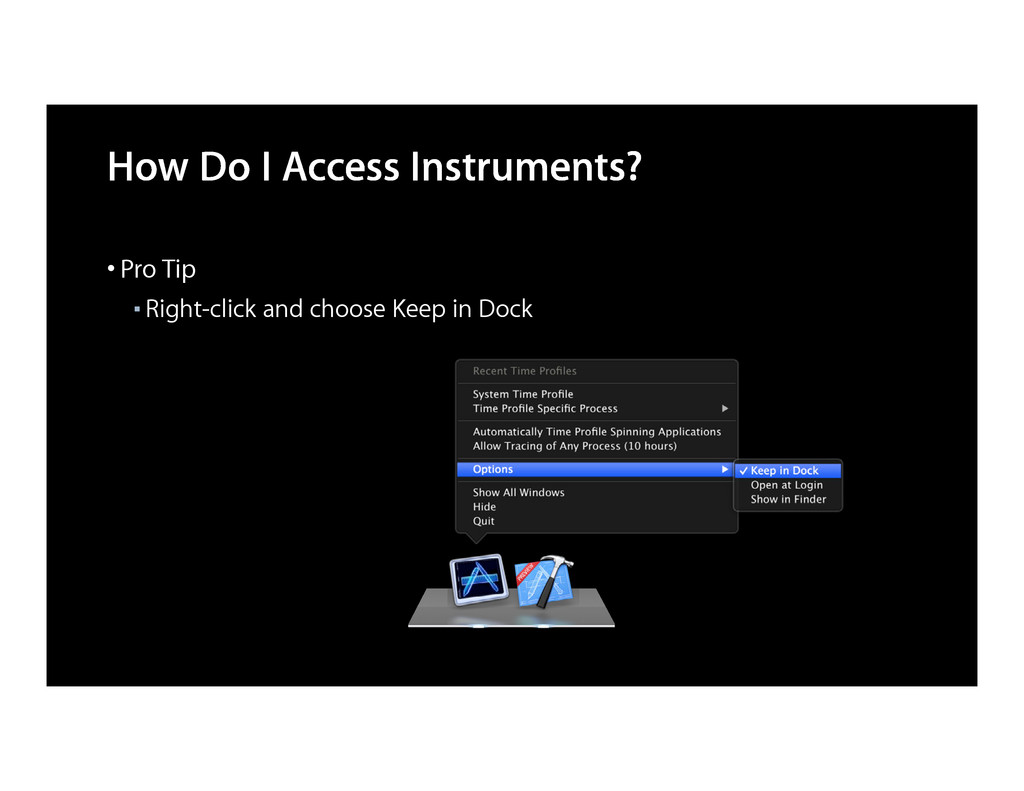
How Do I Access Instruments? •Pro Tip ▪ Right-click and
choose Keep in Dock
Instruments Tour
Document Model and Templates
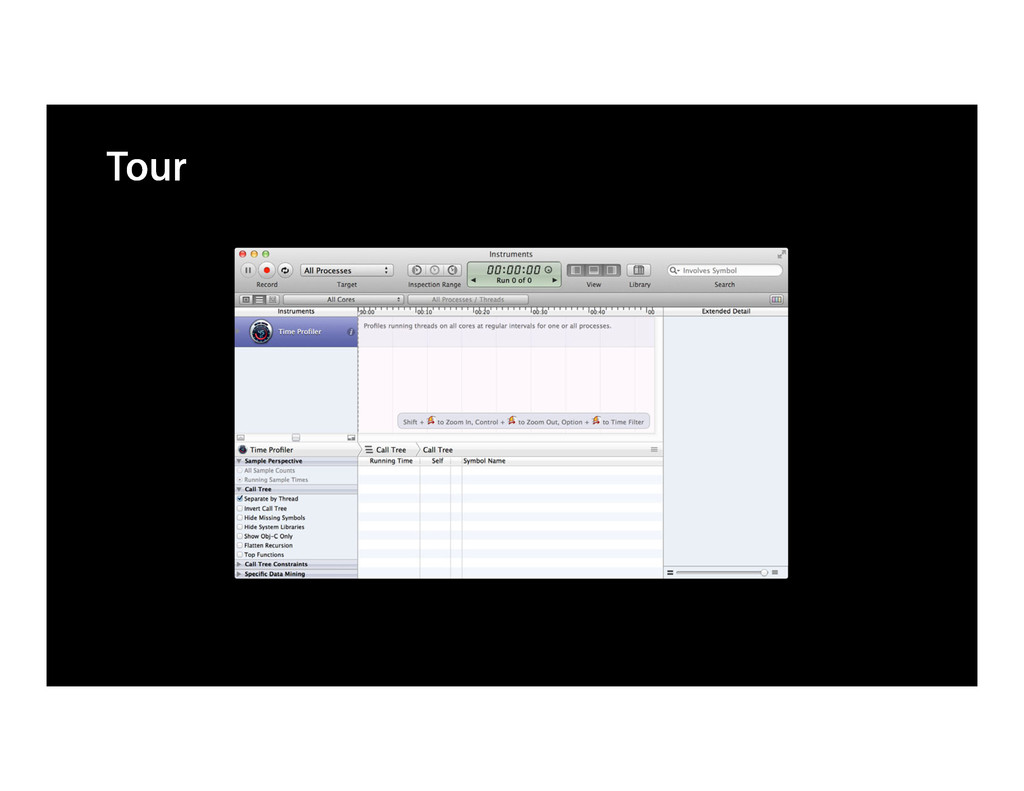
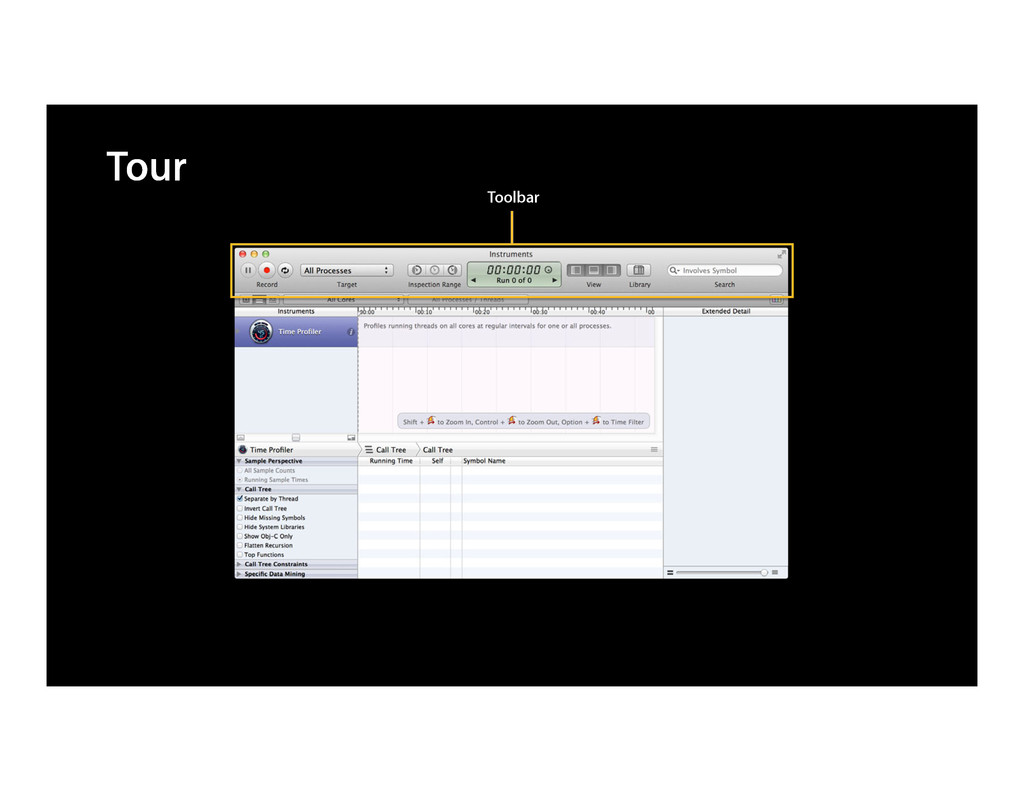
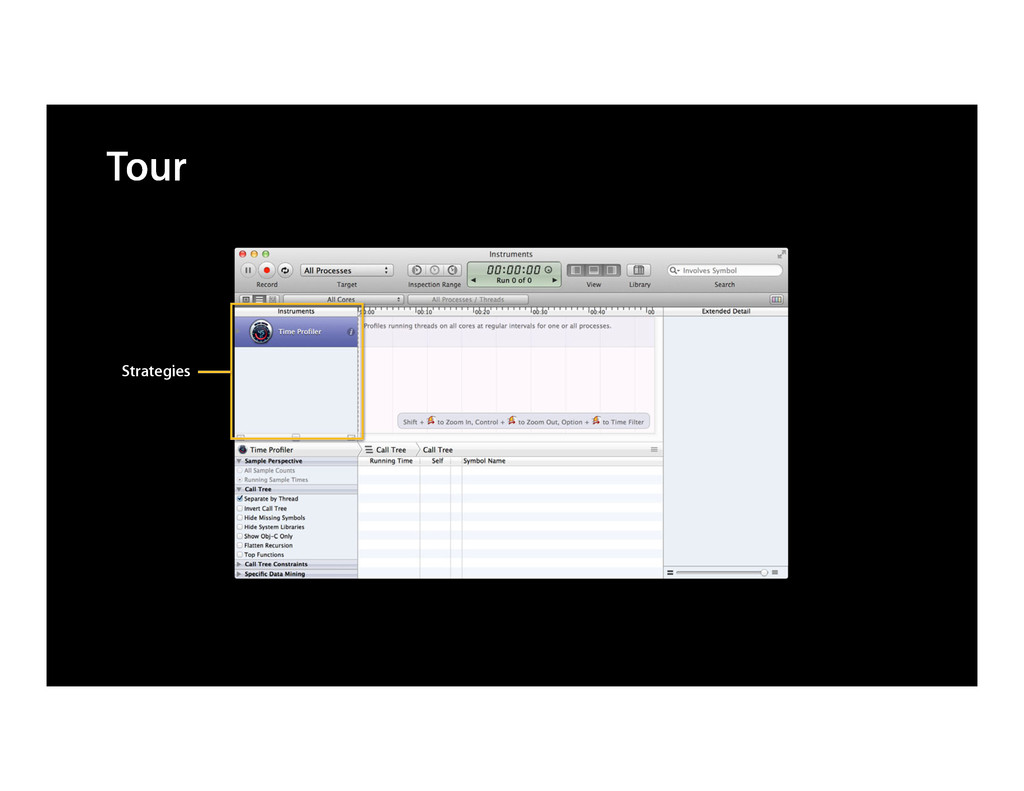
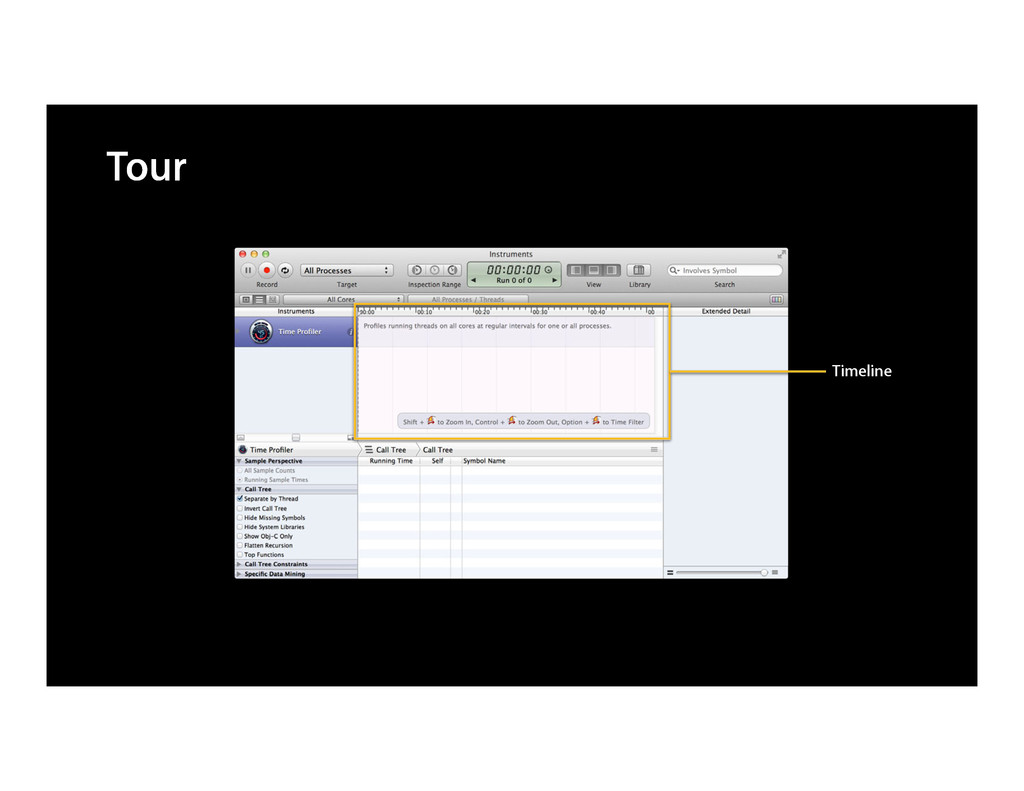
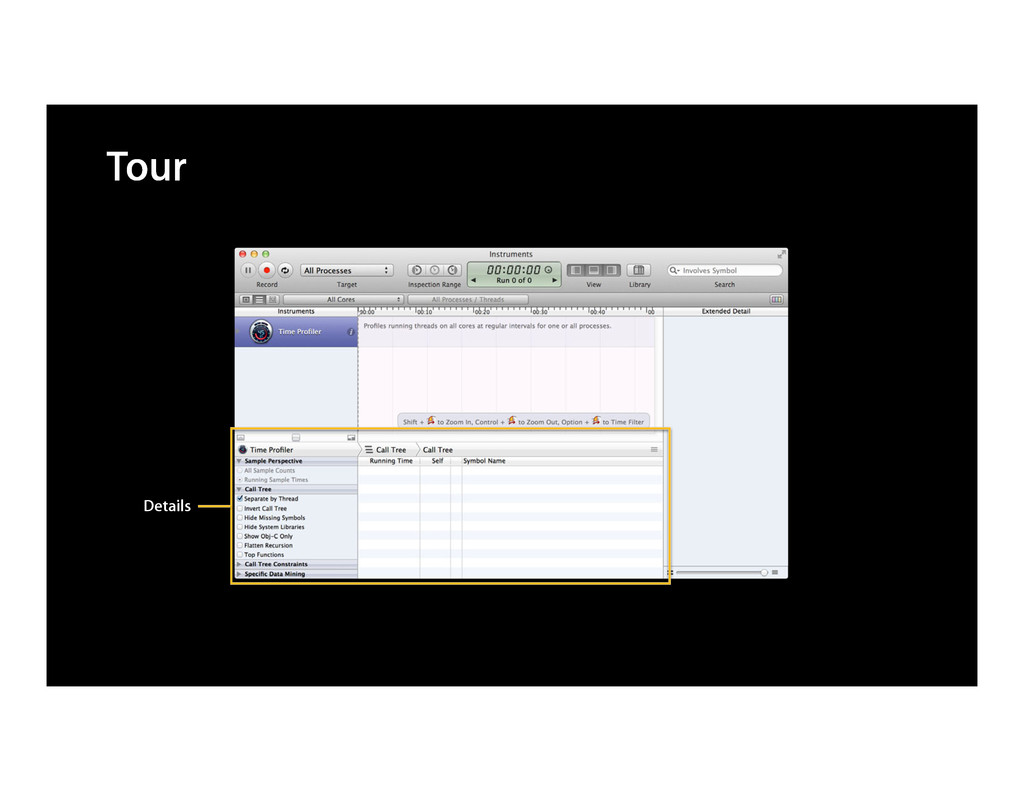
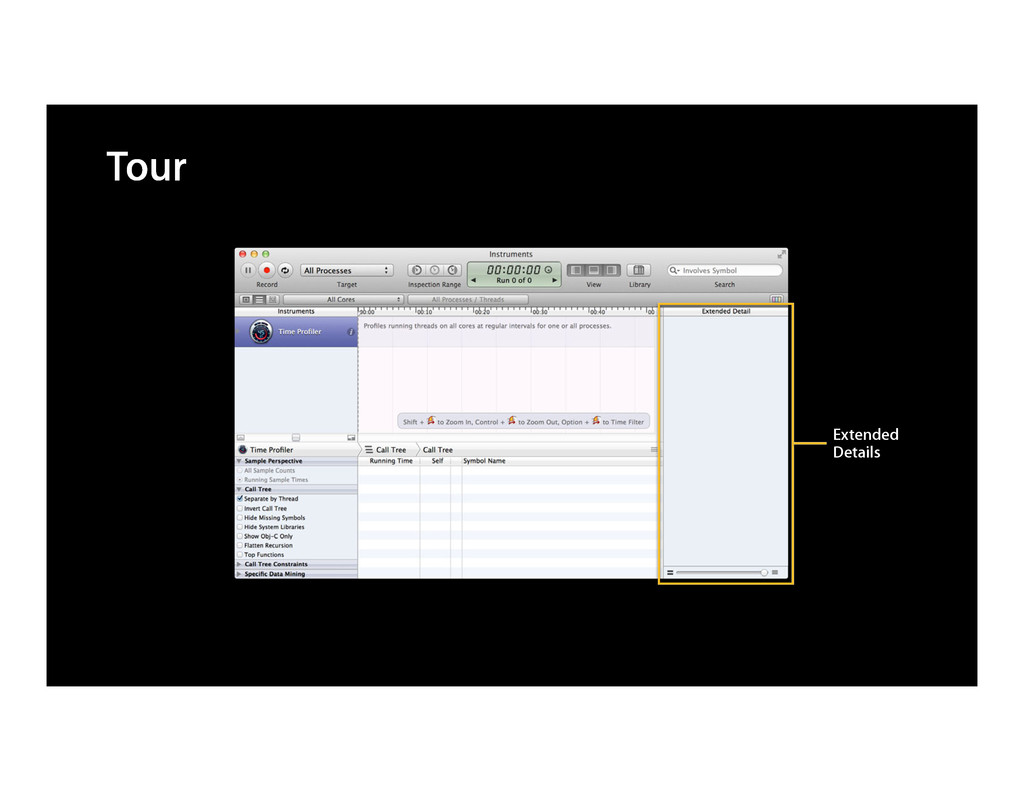
Tour
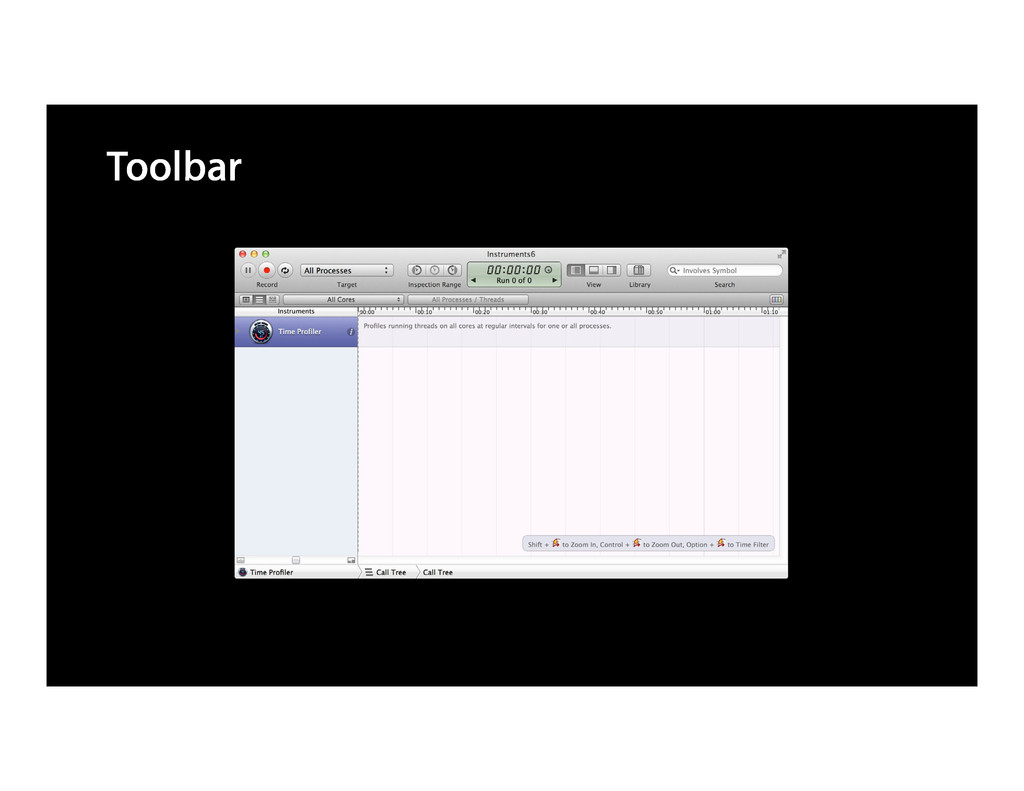
Tour Toolbar
Tour Strategies
Tour Timeline
Tour Details
Tour Extended Details
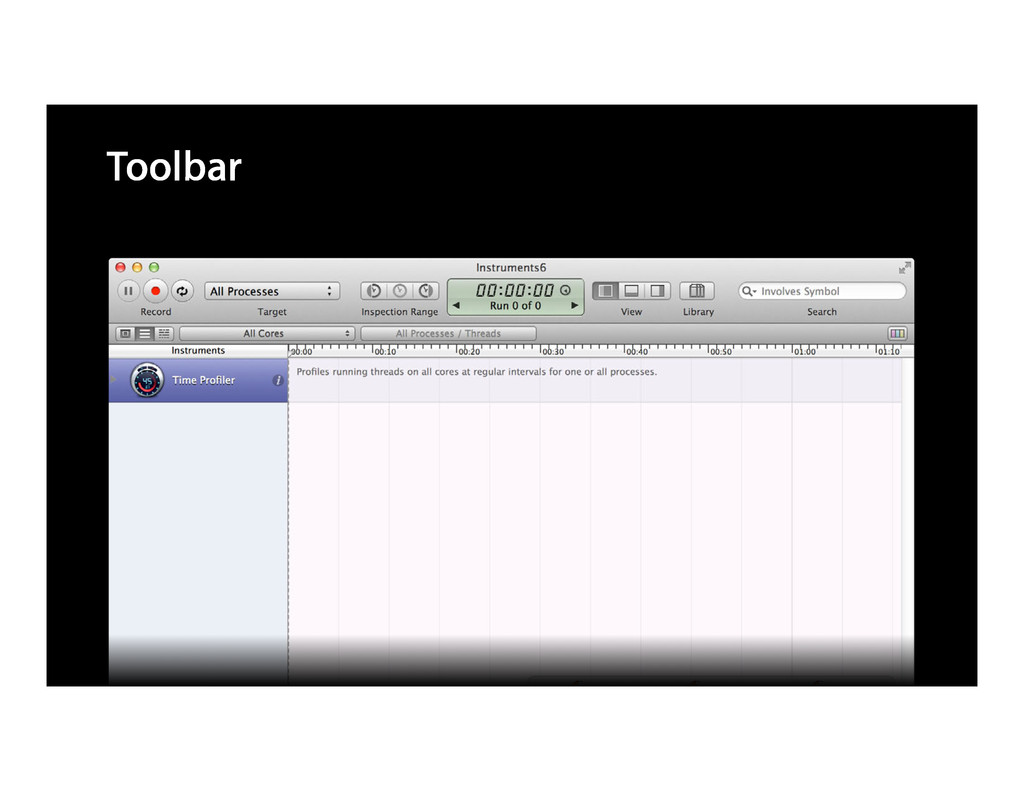
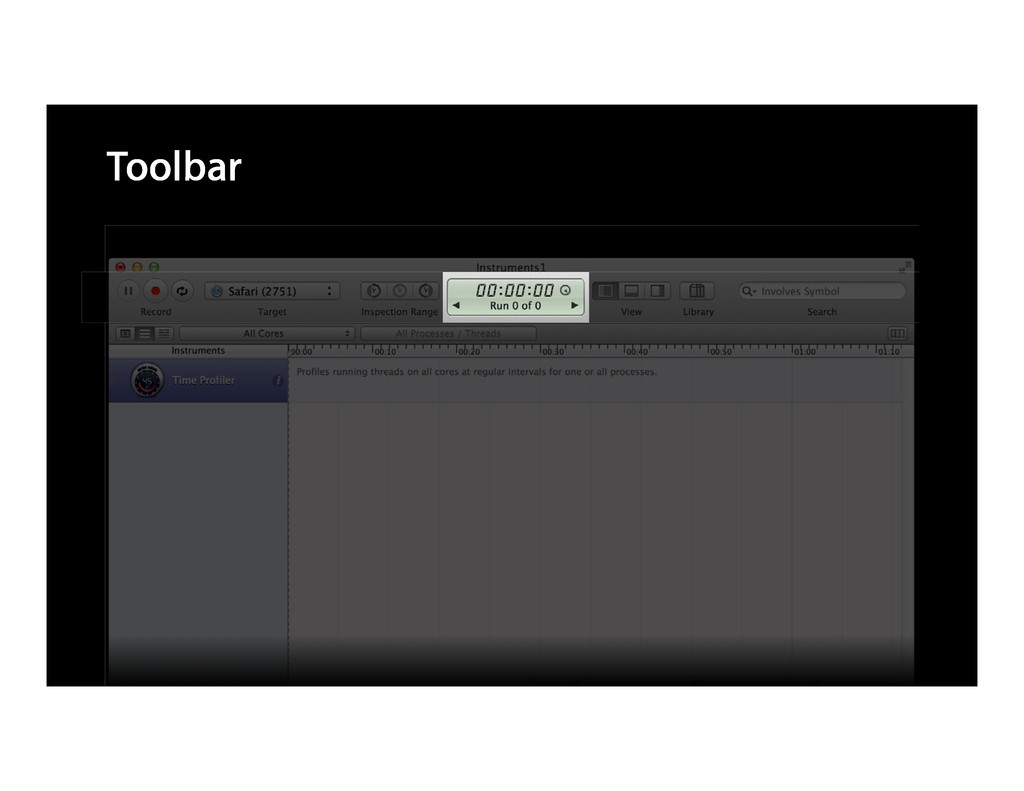
Toolbar
Toolbar
Toolbar
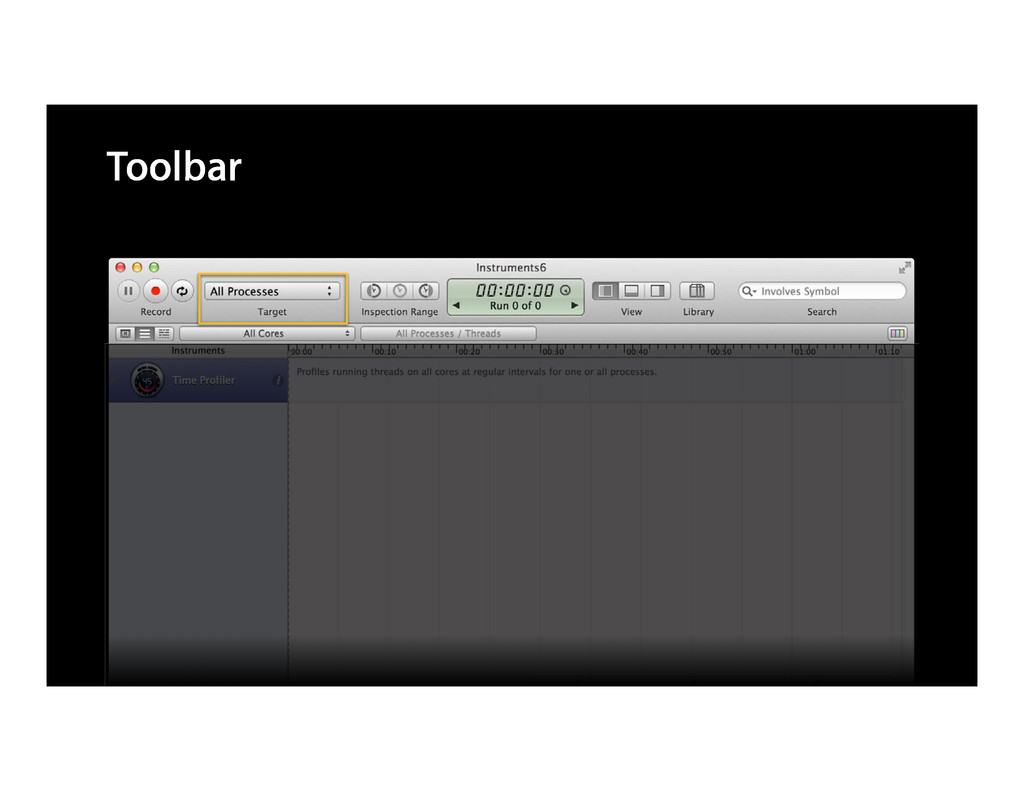
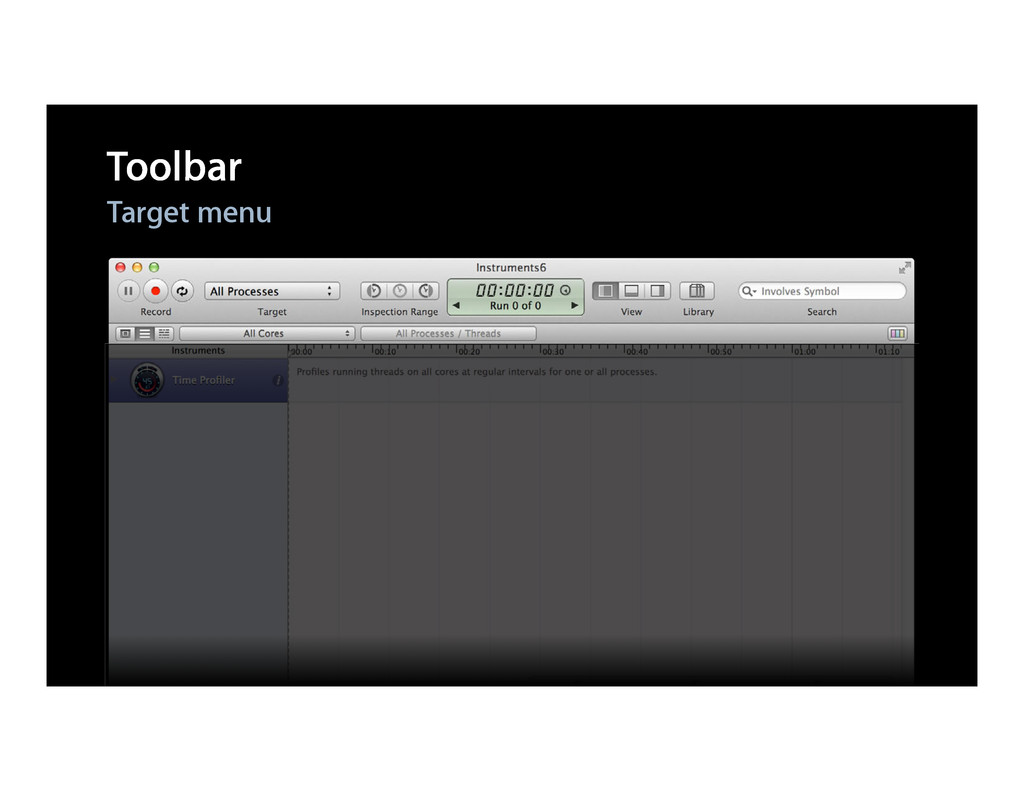
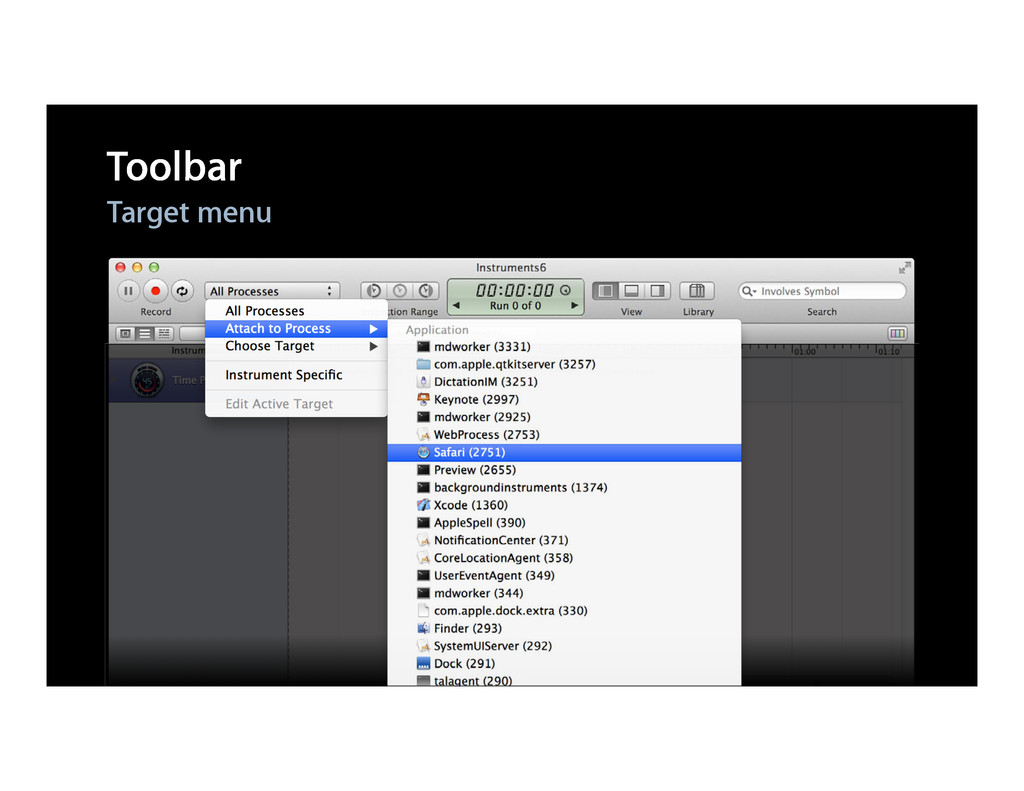
Toolbar Target menu
Toolbar Target menu
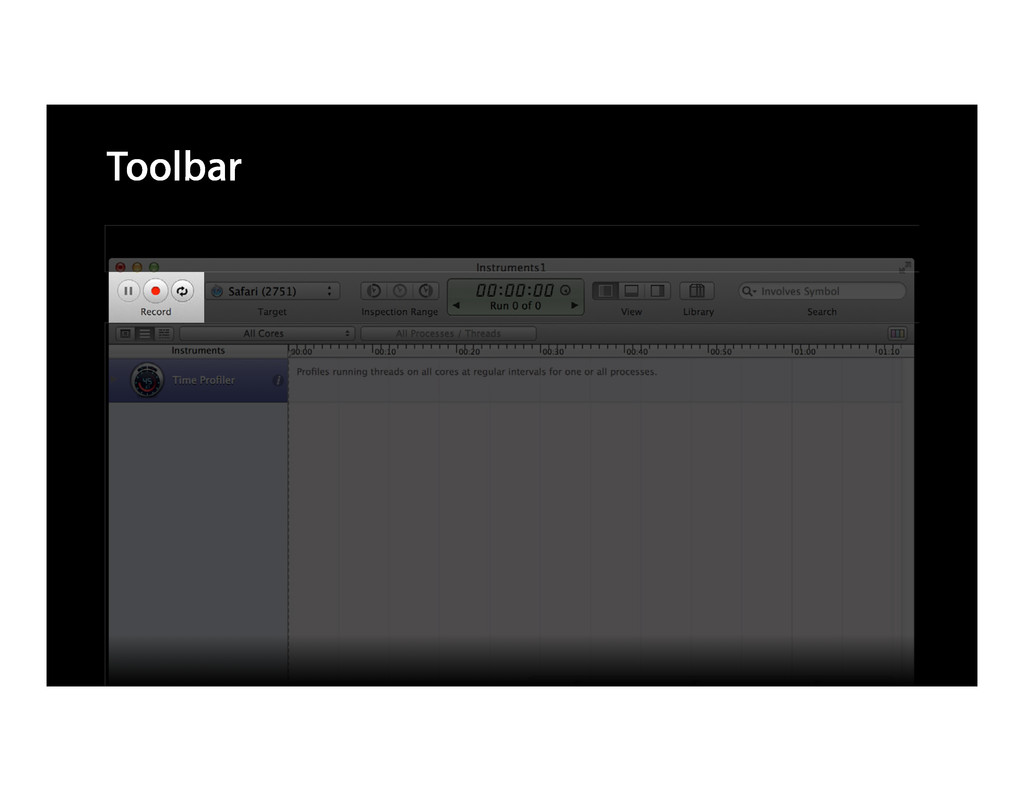
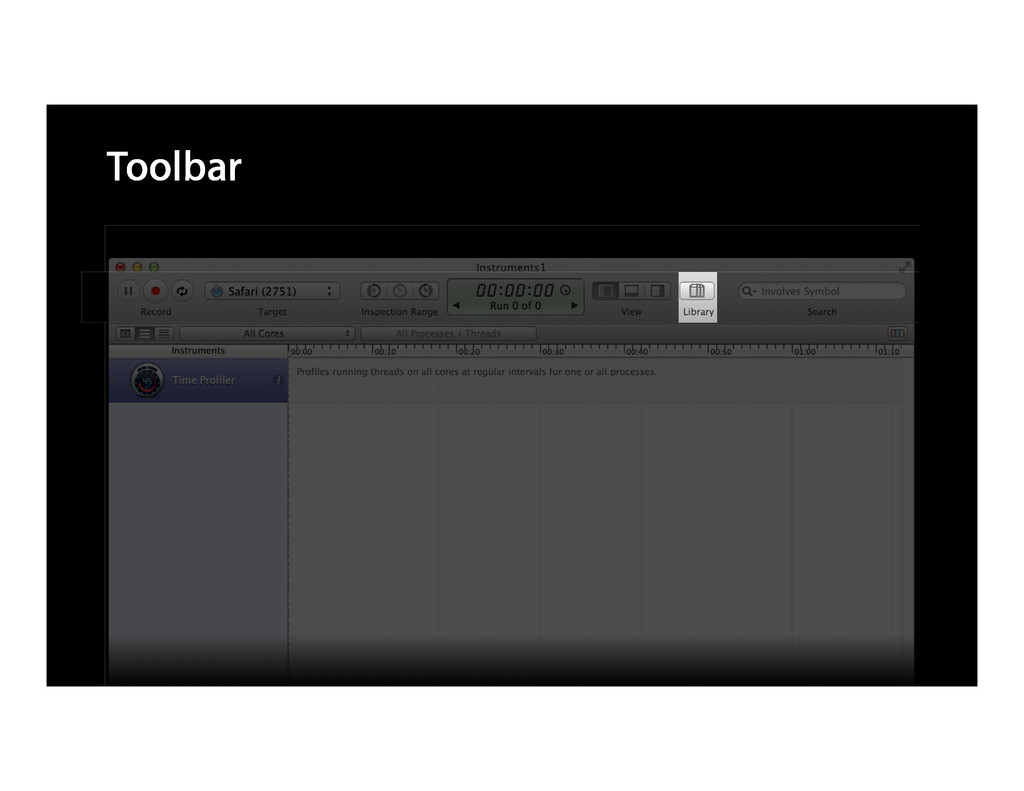
Toolbar
Toolbar
Toolbar
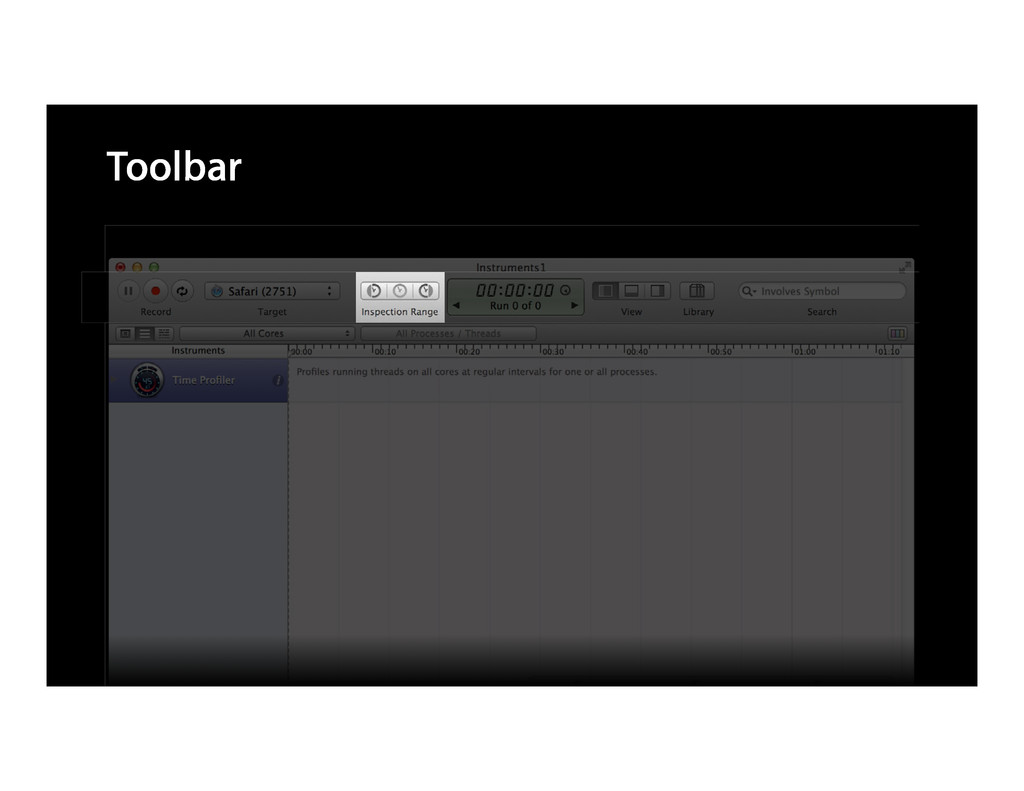
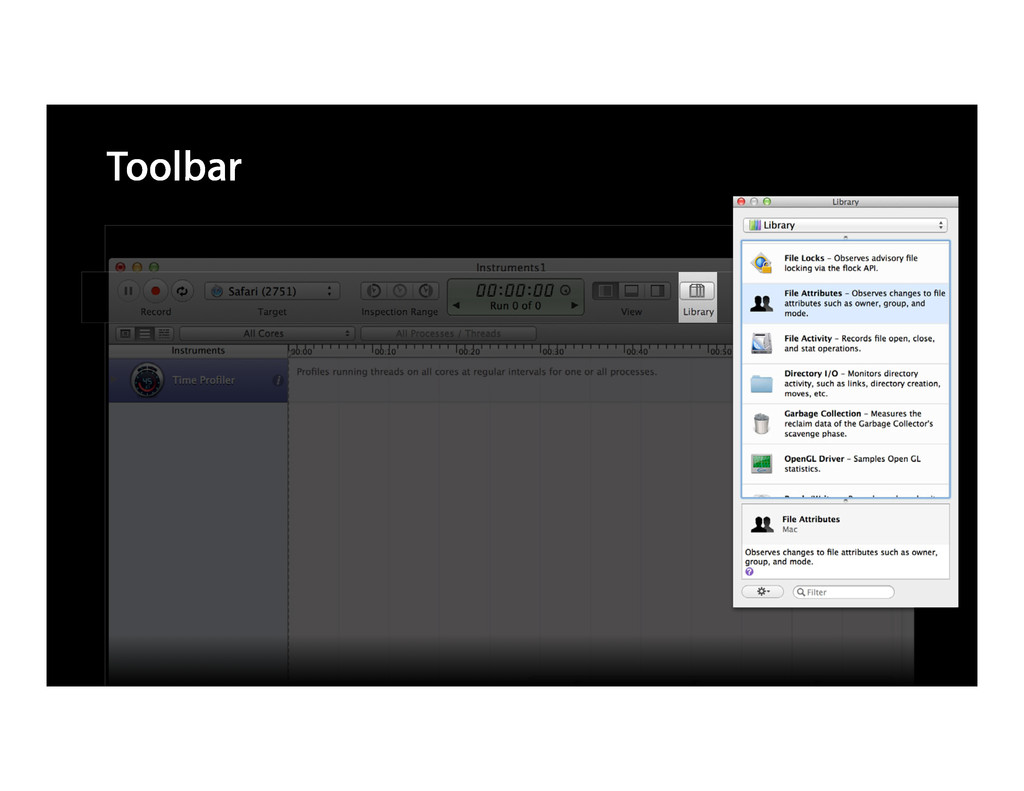
Toolbar
Toolbar
Toolbar
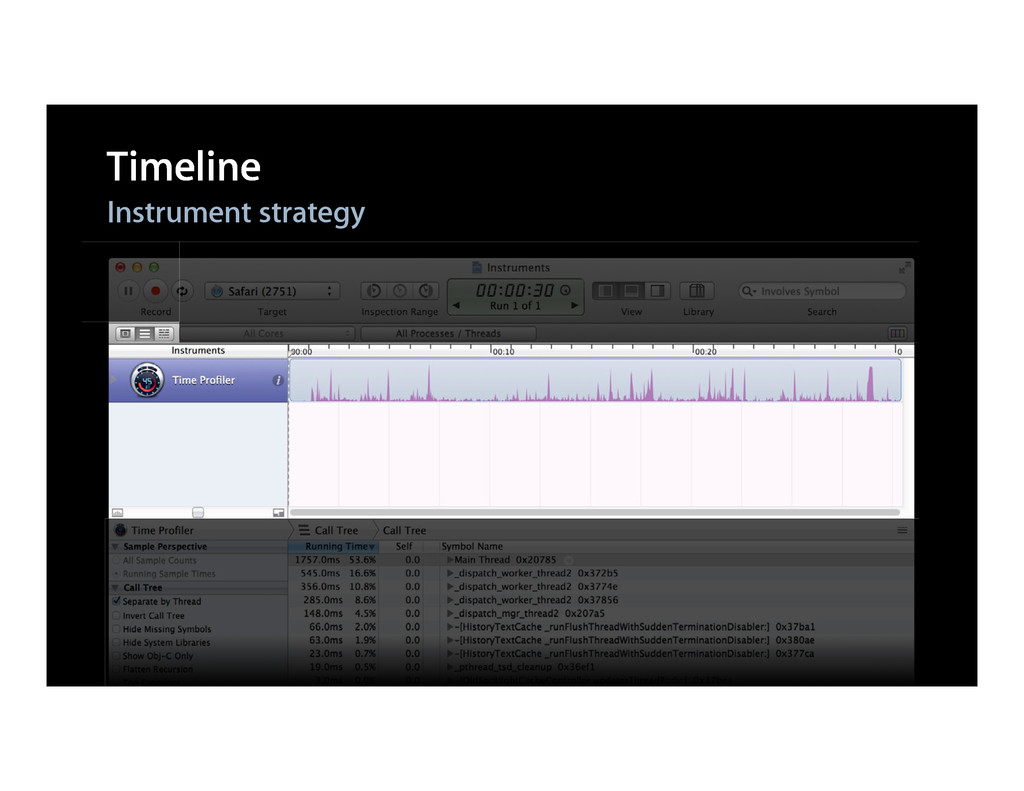
Timeline Instrument strategy
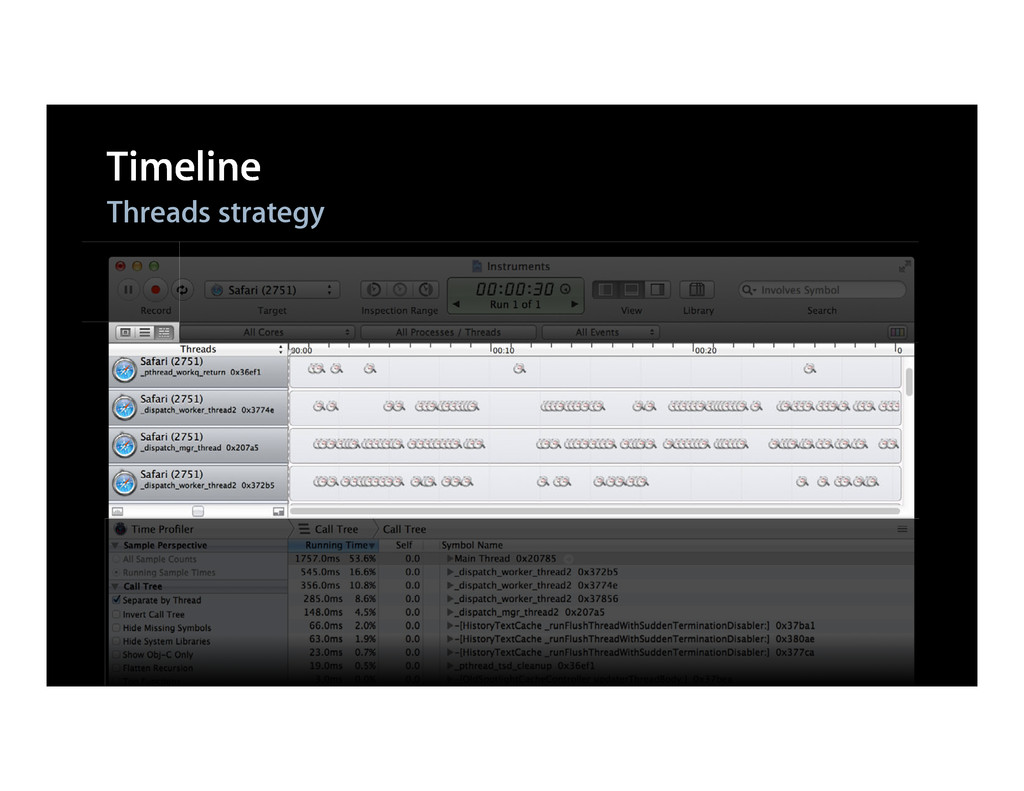
Timeline Threads strategy
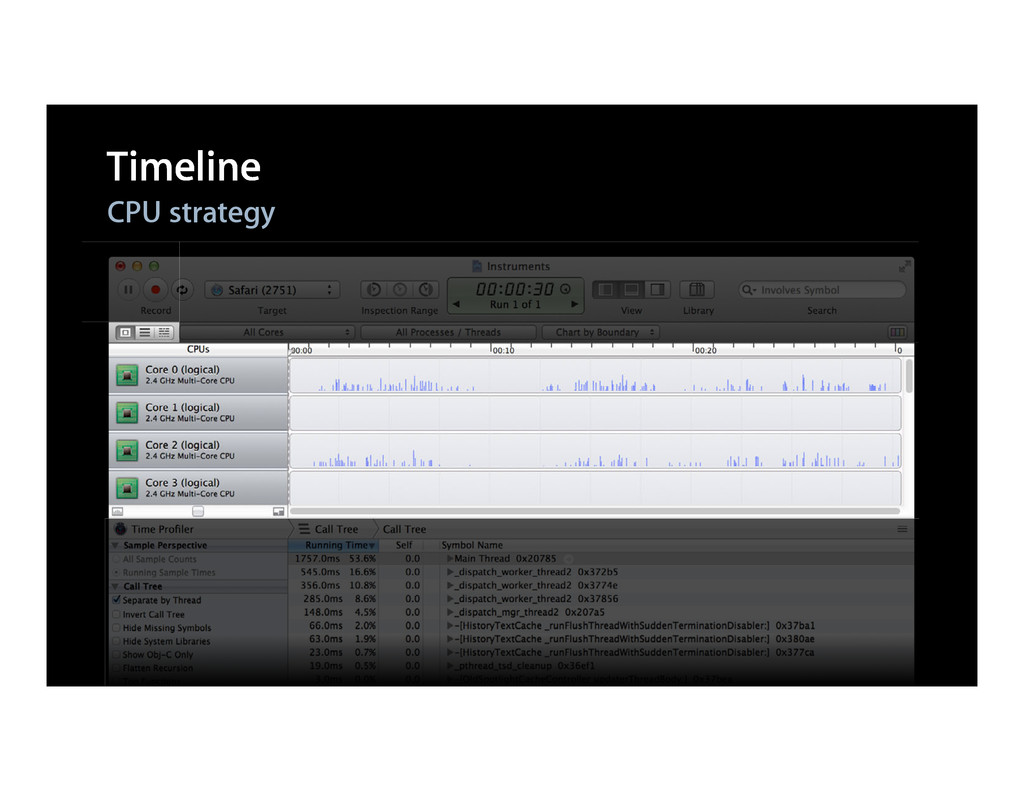
Timeline CPU strategy
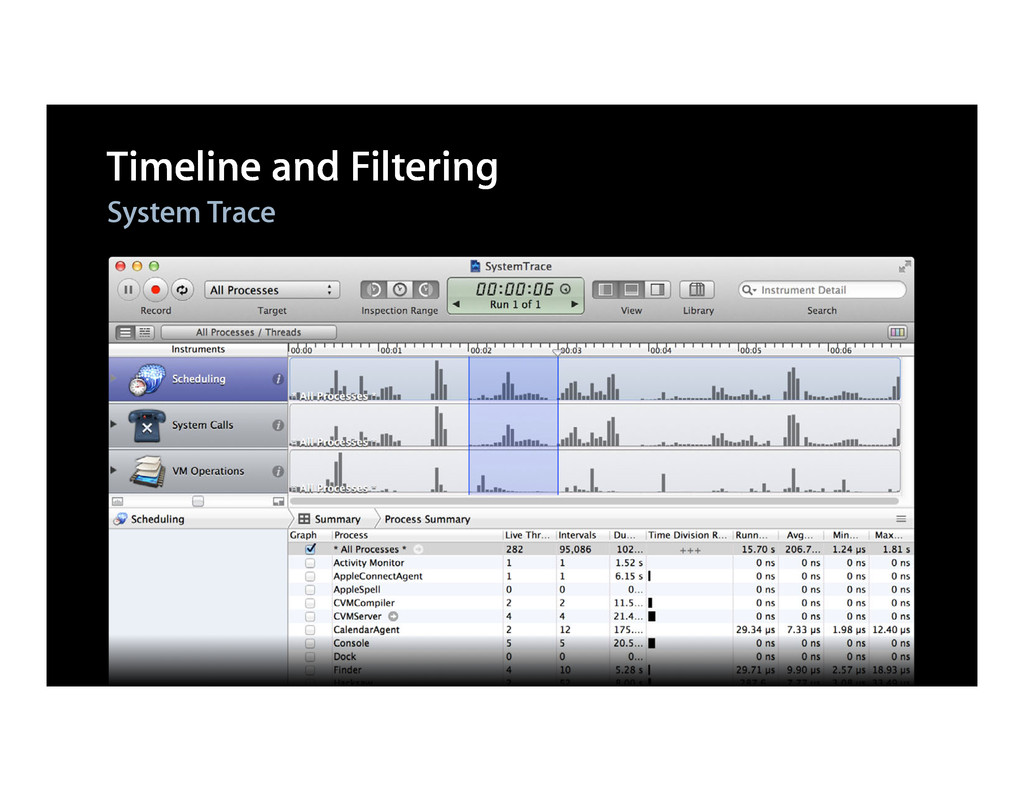
Timeline and Filtering System Trace
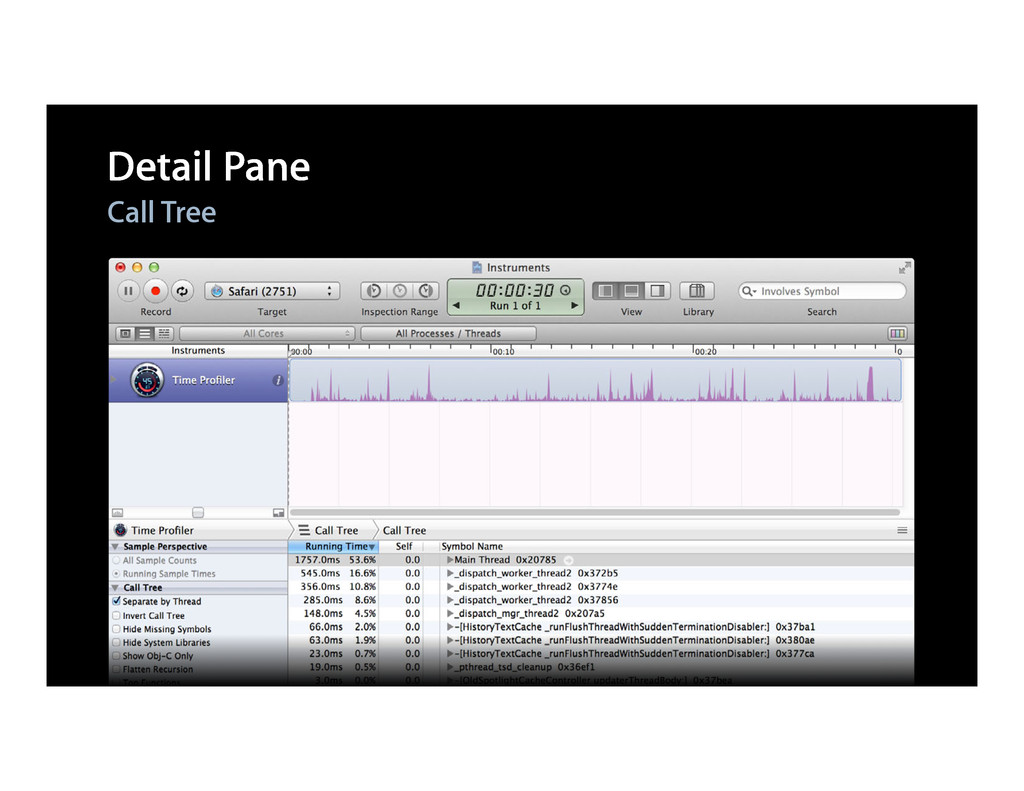
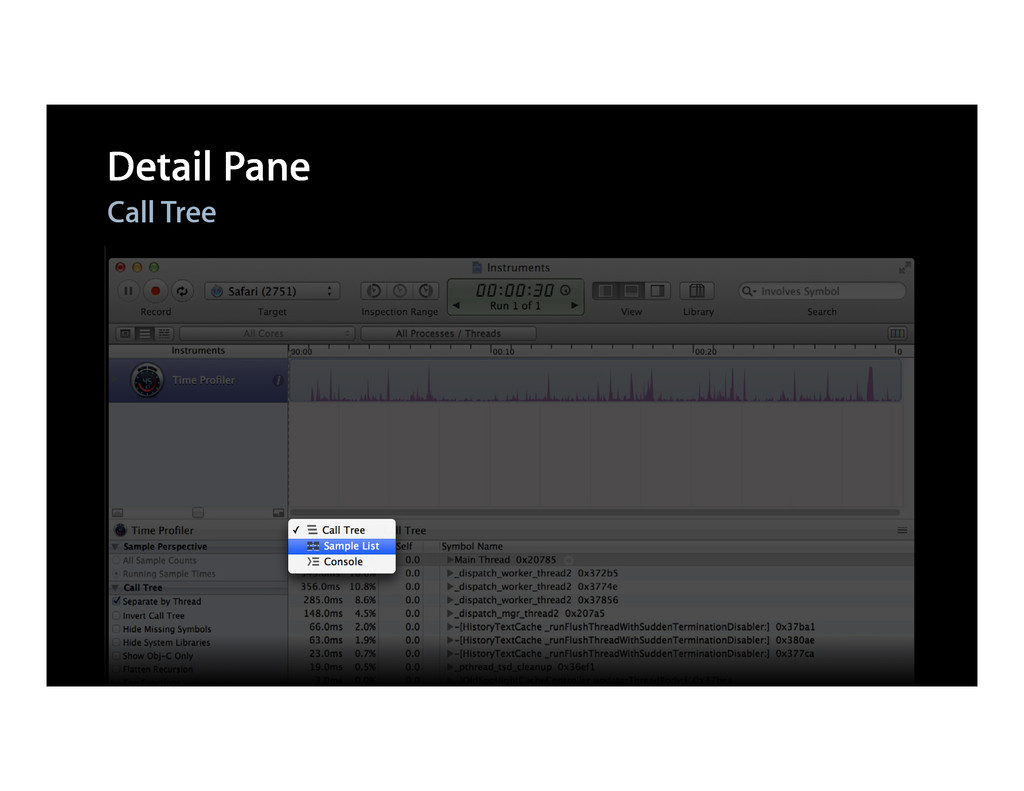
Detail Pane Call Tree
Detail Pane Call Tree
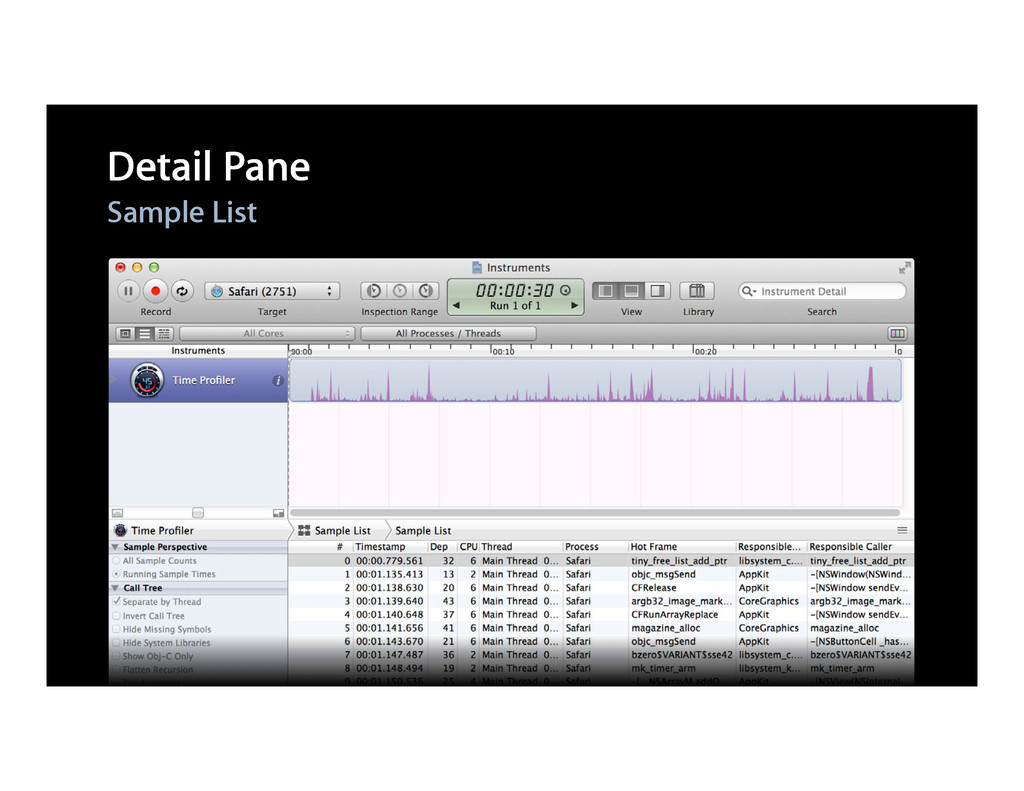
Detail Pane Sample List
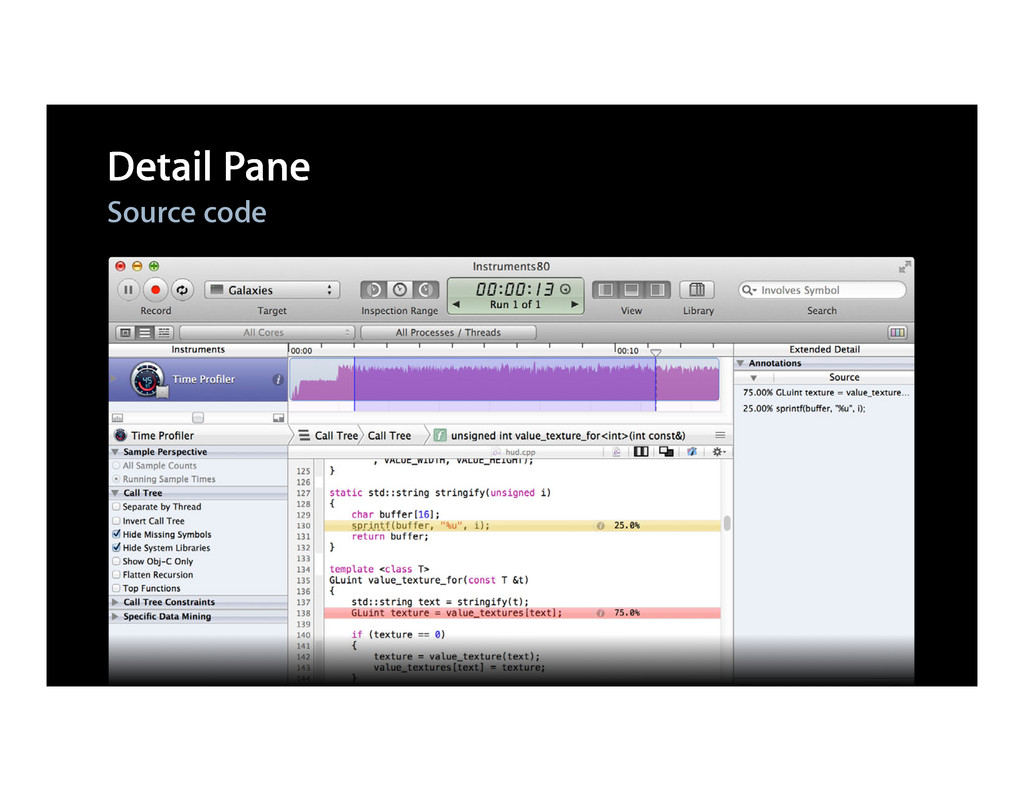
Detail Pane Source code
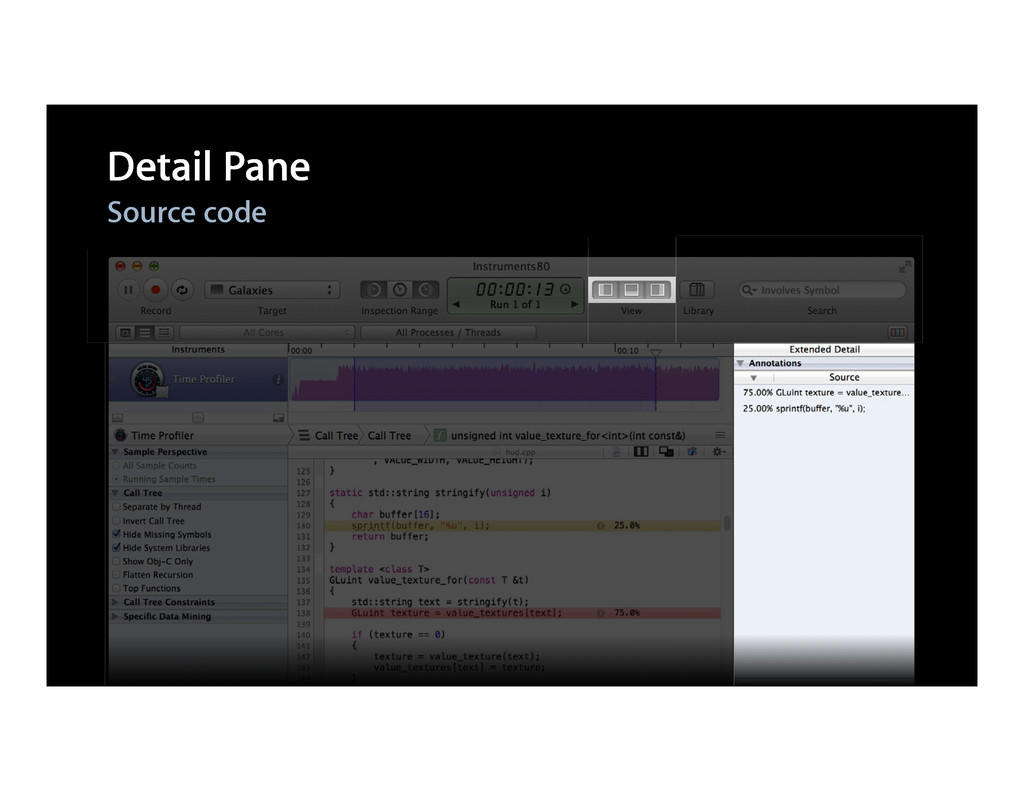
Detail Pane Source code
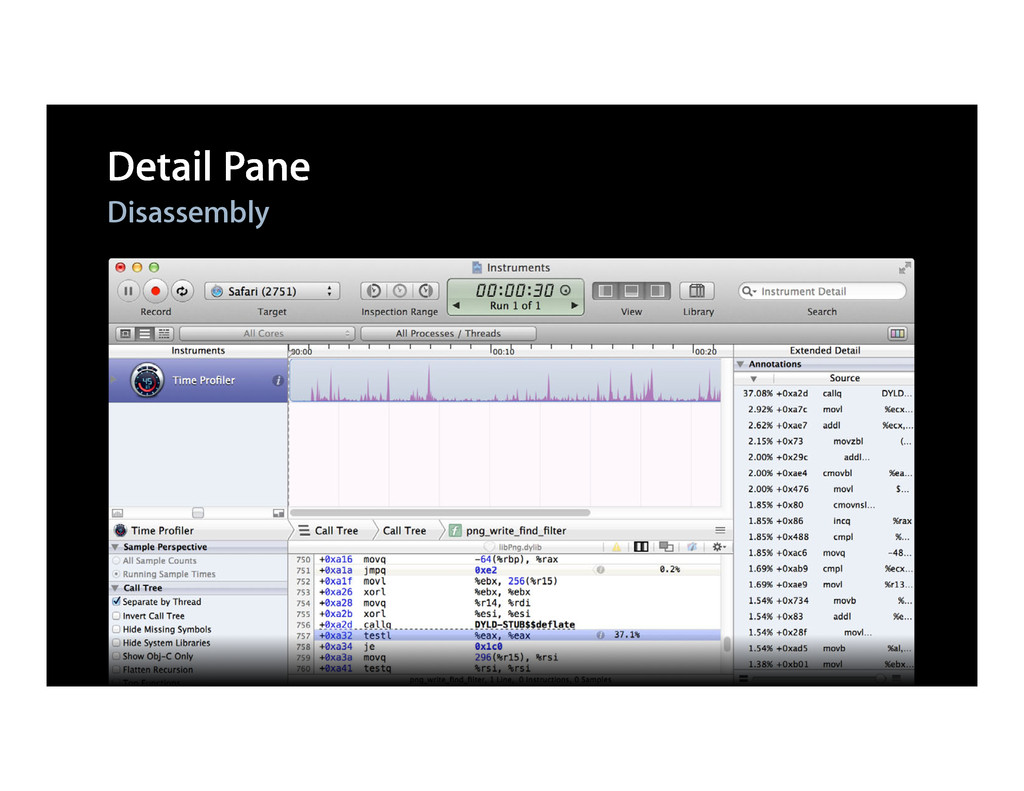
Detail Pane Disassembly
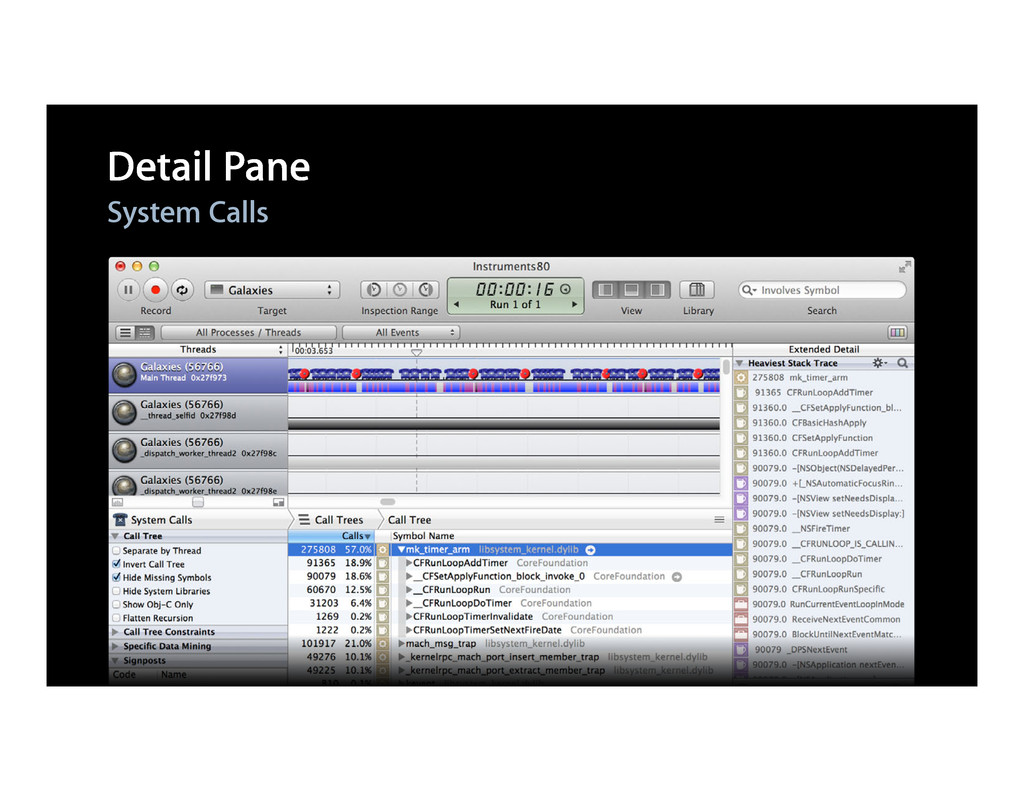
Detail Pane System Calls
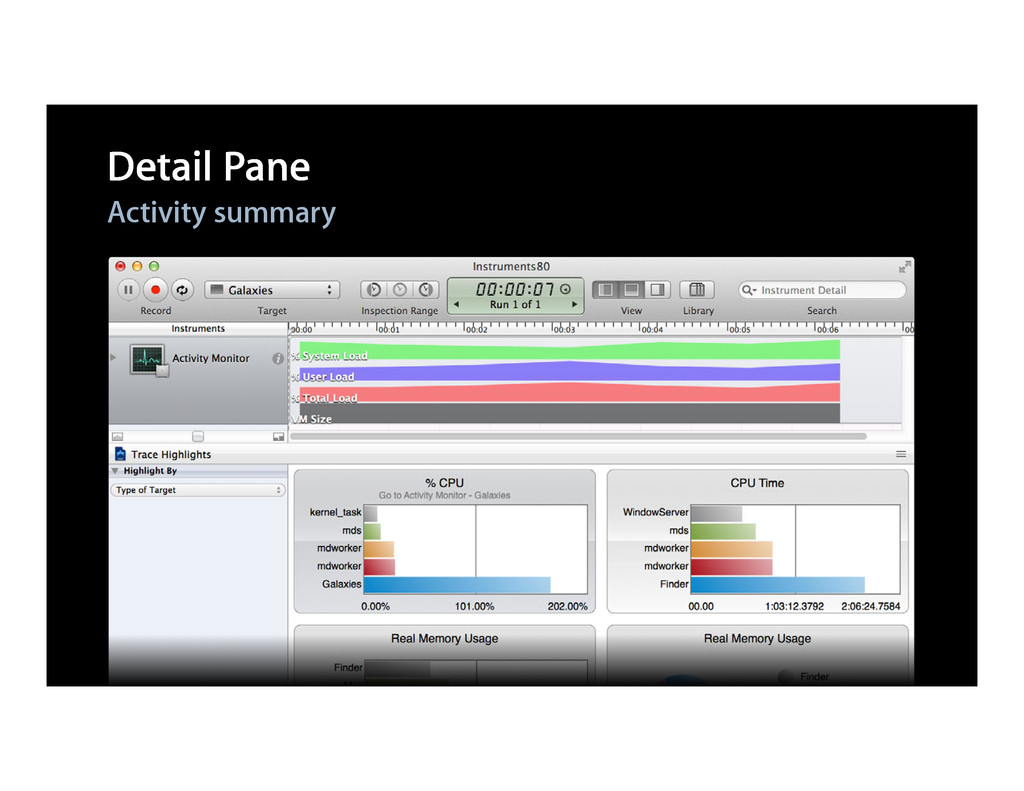
Detail Pane Activity summary
Instruments
Demo Time Profiler example Joe Grzywacz Performance Tools Engineering
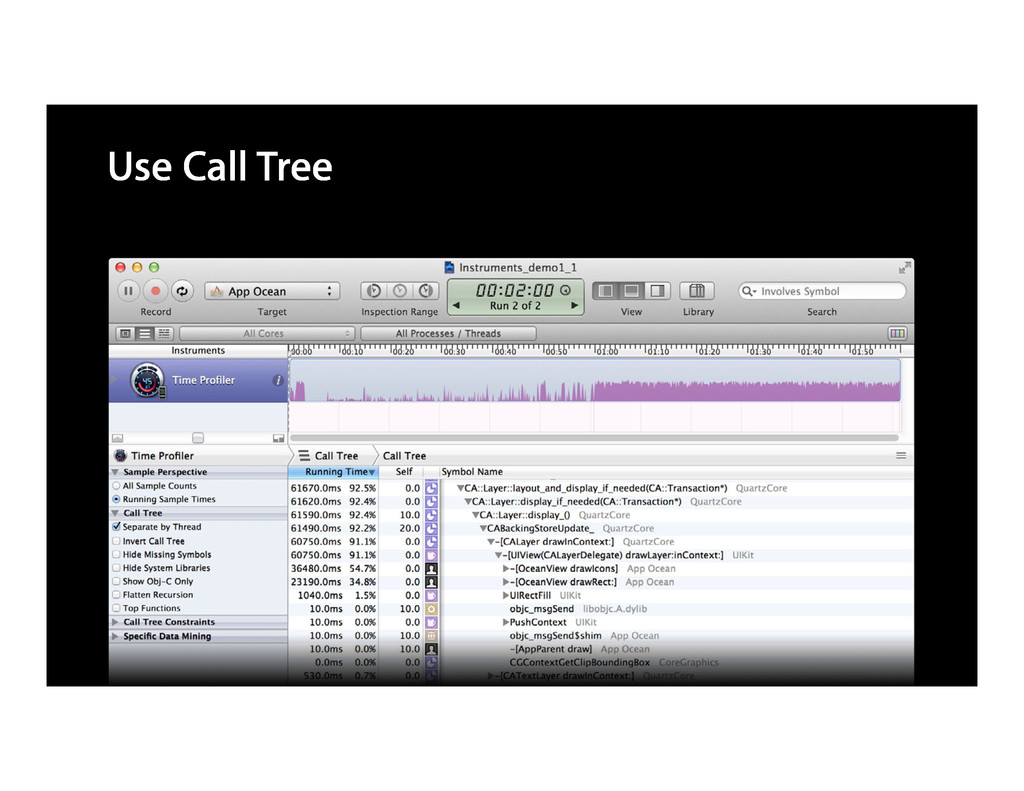
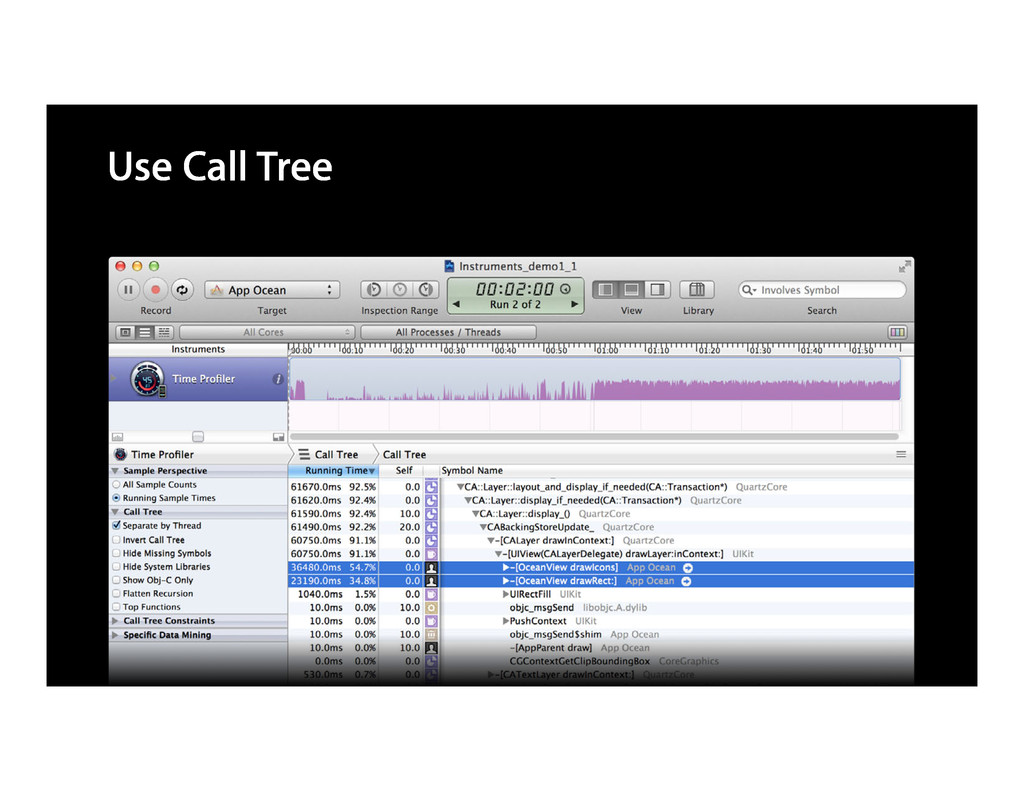
Use Call Tree
Use Call Tree
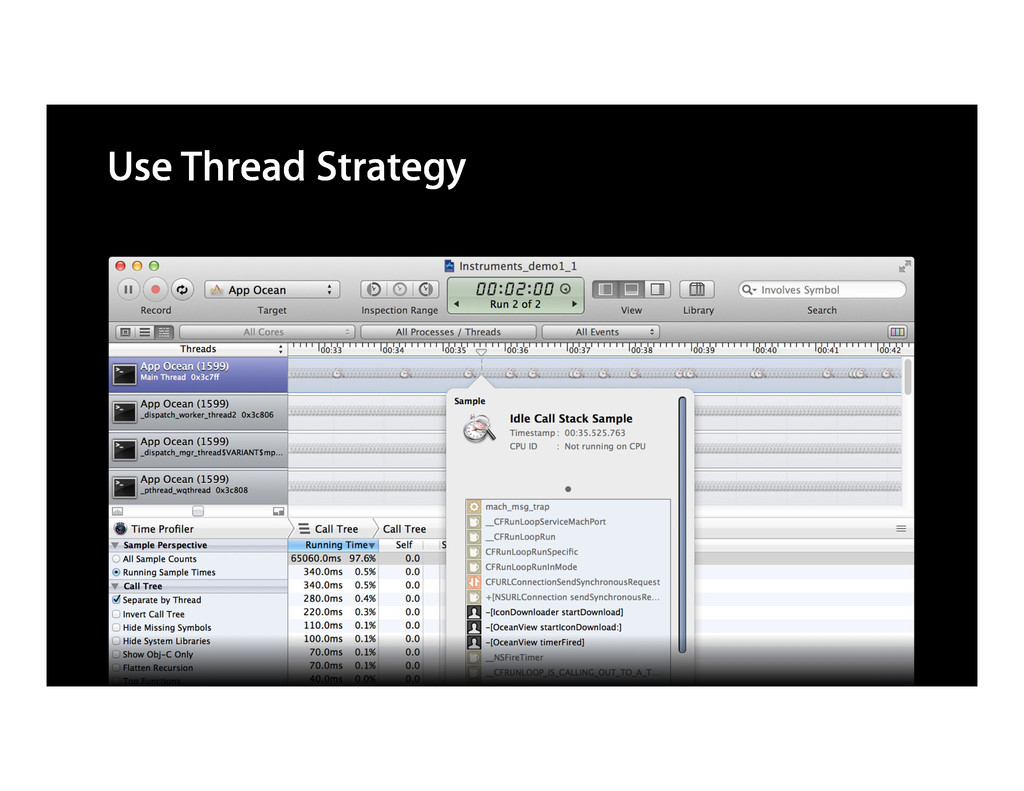
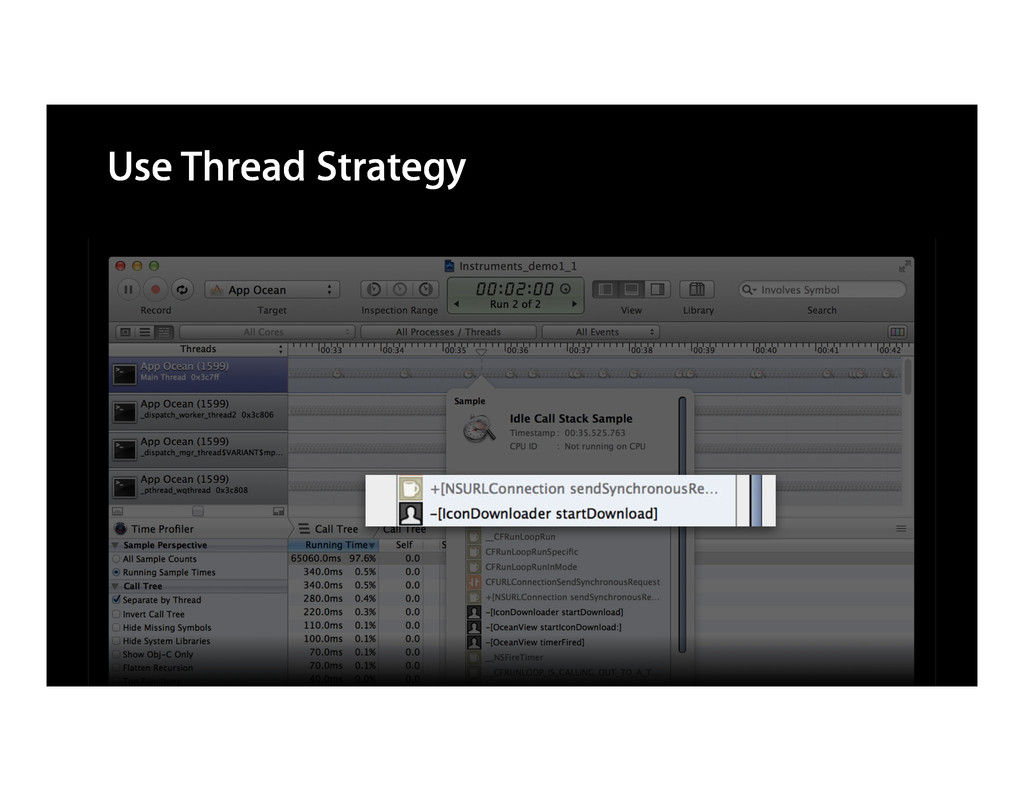
Use Thread Strategy
Use Thread Strategy
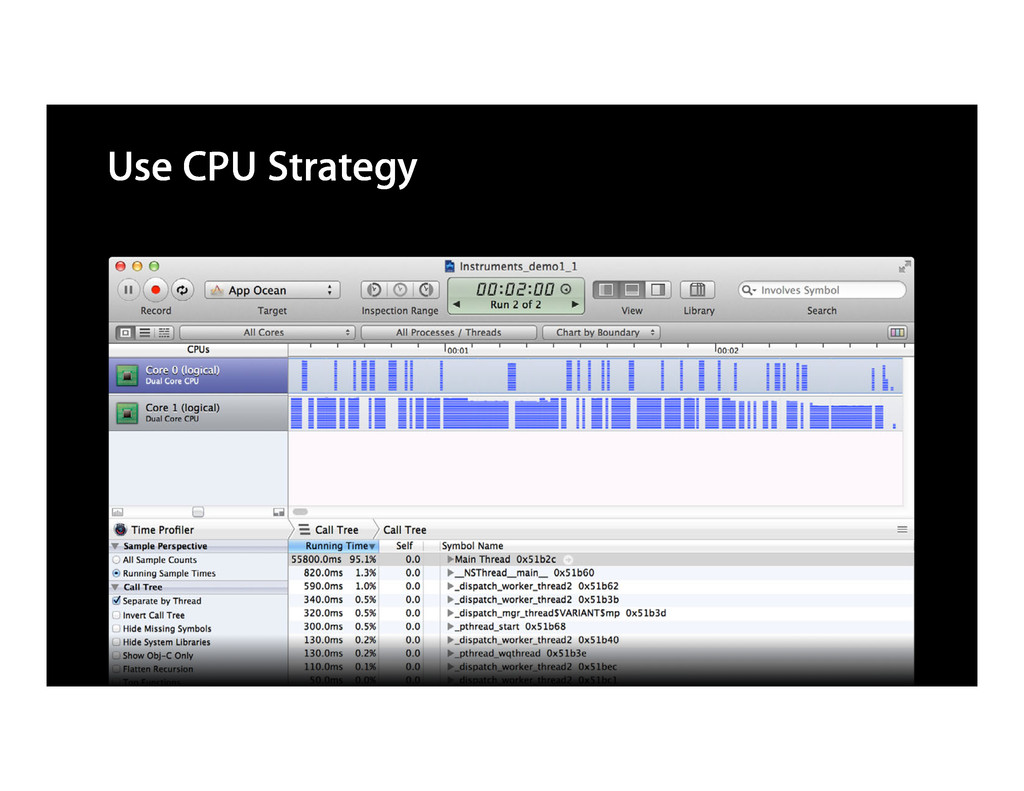
Use CPU Strategy
Demo Memory profiling example Victor Hernandez Performance Tools Engineering
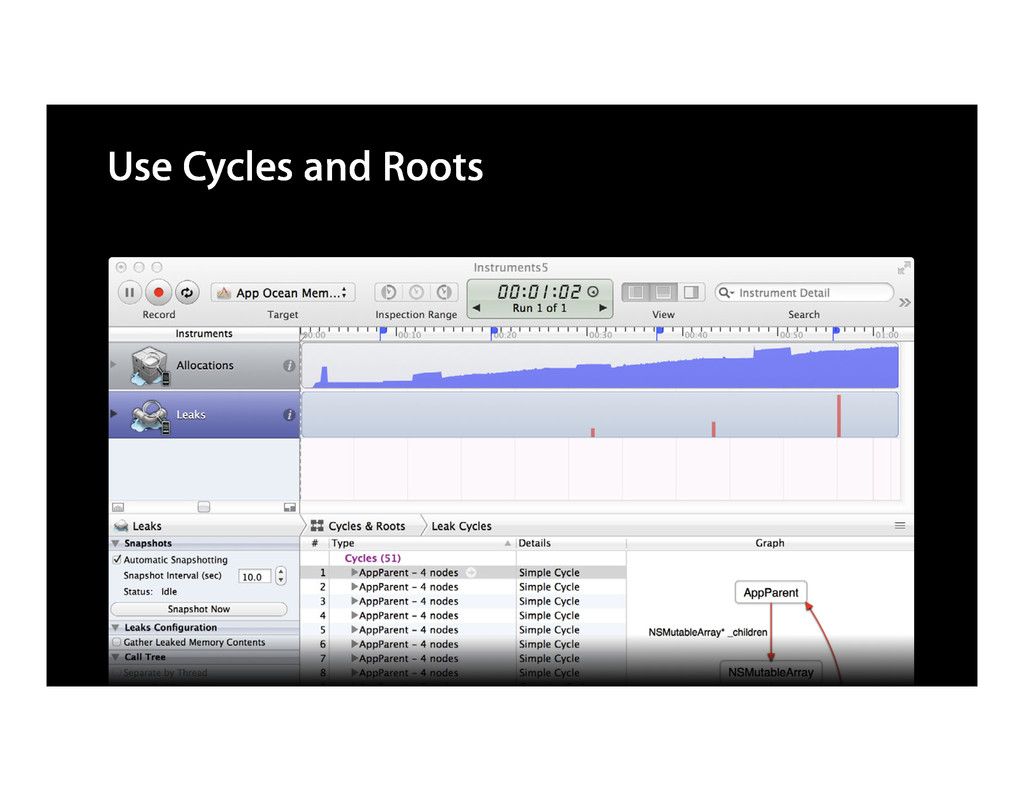
Use Cycles and Roots
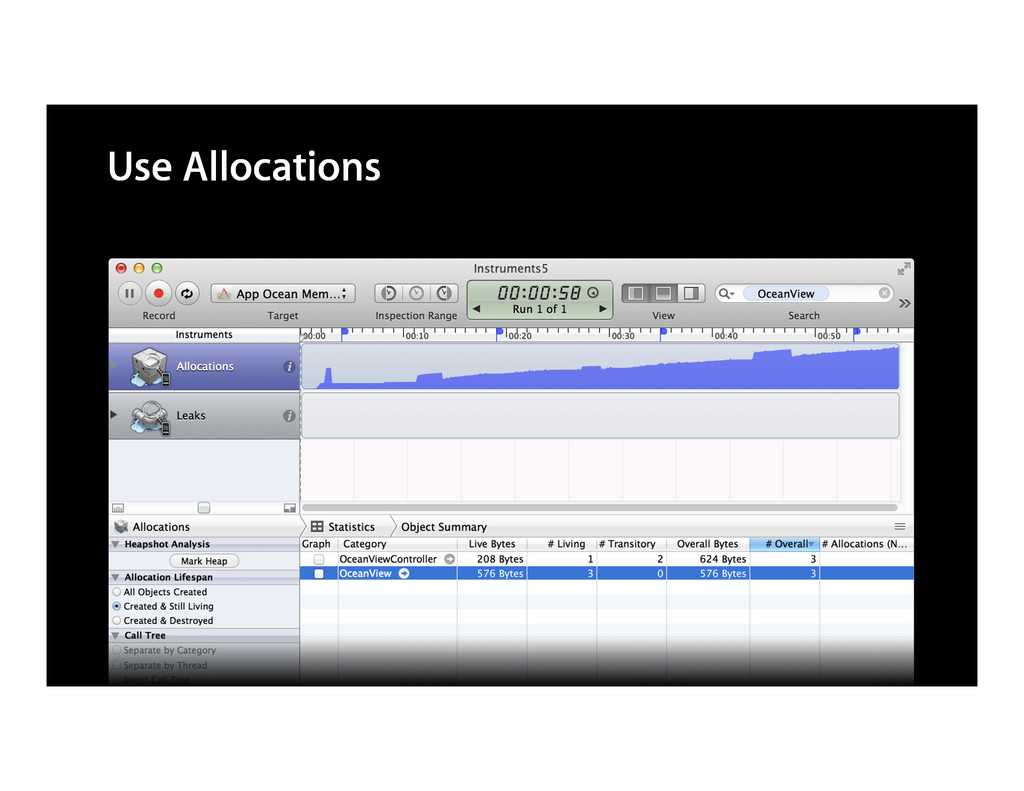
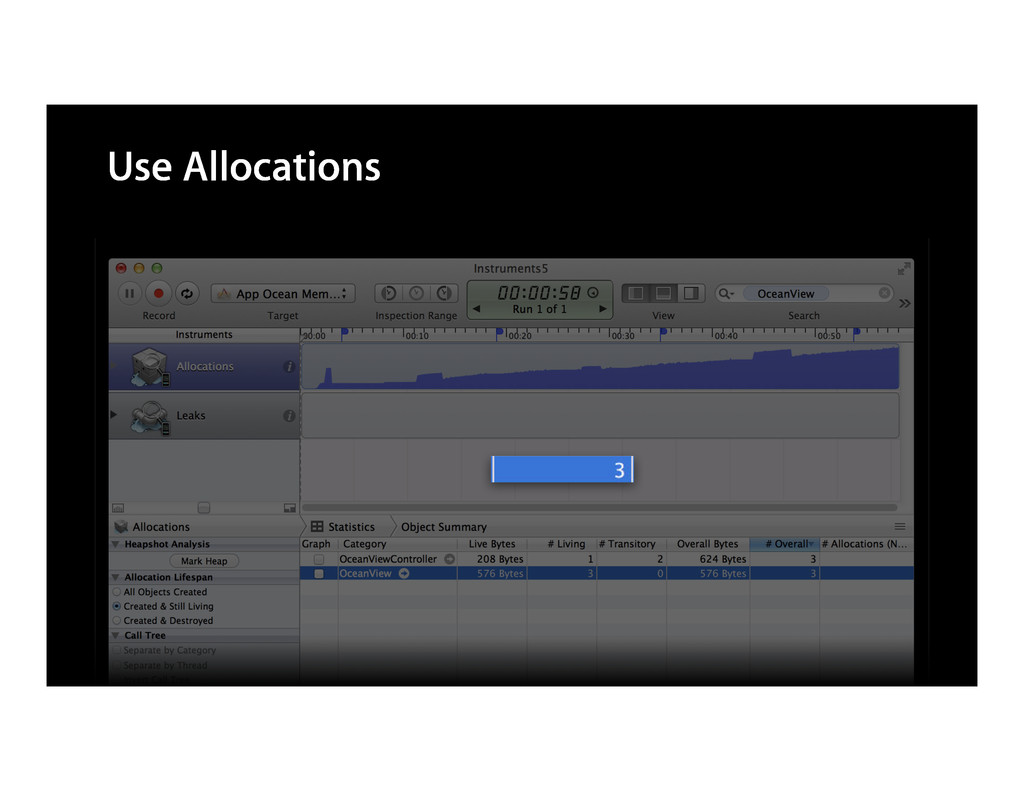
Use Allocations
Use Allocations
Closing Thoughts…
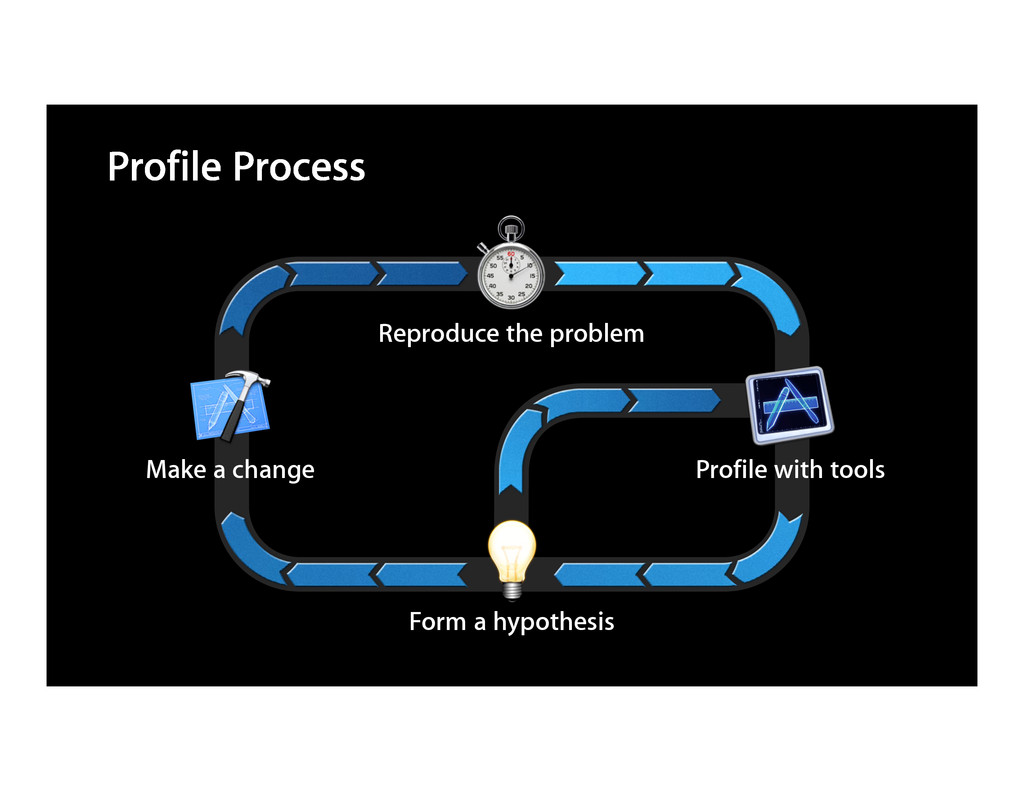
Profile Process
Profile Process Reproduce the problem
Profile Process Reproduce the problem Profile with tools
Profile Process Form a hypothesis Reproduce the problem Profile with
tools
Profile Process Form a hypothesis Make a change Reproduce the
problem Profile with tools
Profile Process Form a hypothesis Make a change Reproduce the
problem Profile with tools
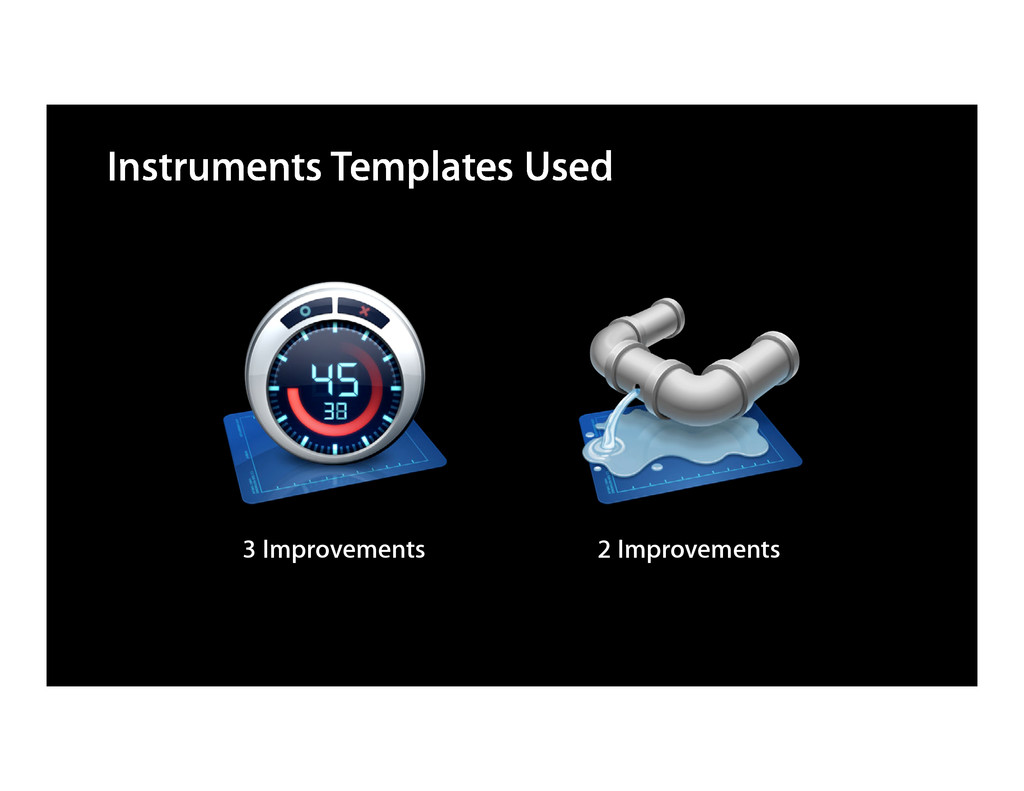
Instruments Templates Used
Instruments Templates Used 3 Improvements 2 Improvements
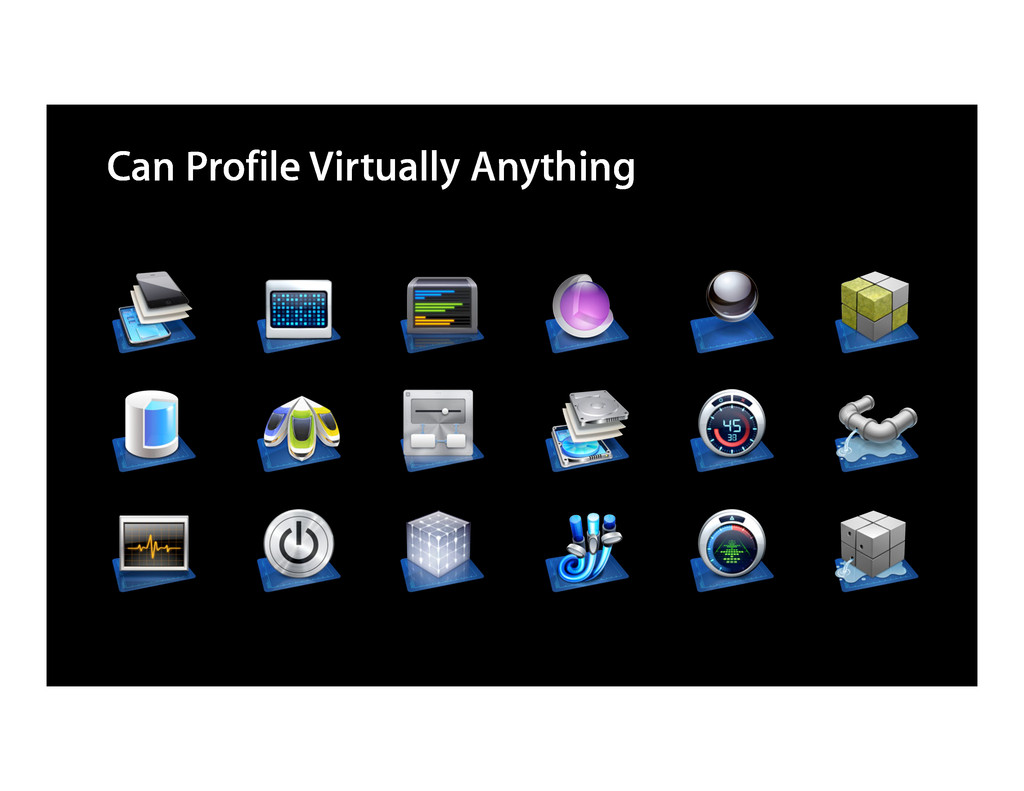
Can Profile Virtually Anything
Can Profile Virtually Anything
"Fantastic and Fast" "Fantastic and Fast"
"Must buy this app" "Must buy this app"
None
None
None
More Information Michael Jurewitz Developer Tools Evangelist
[email protected]
Instruments Documentation
Instruments User Guide (Xcode Documentation) Instruments New Features User Guide Apple Developer Forums http://devforums.apple.com
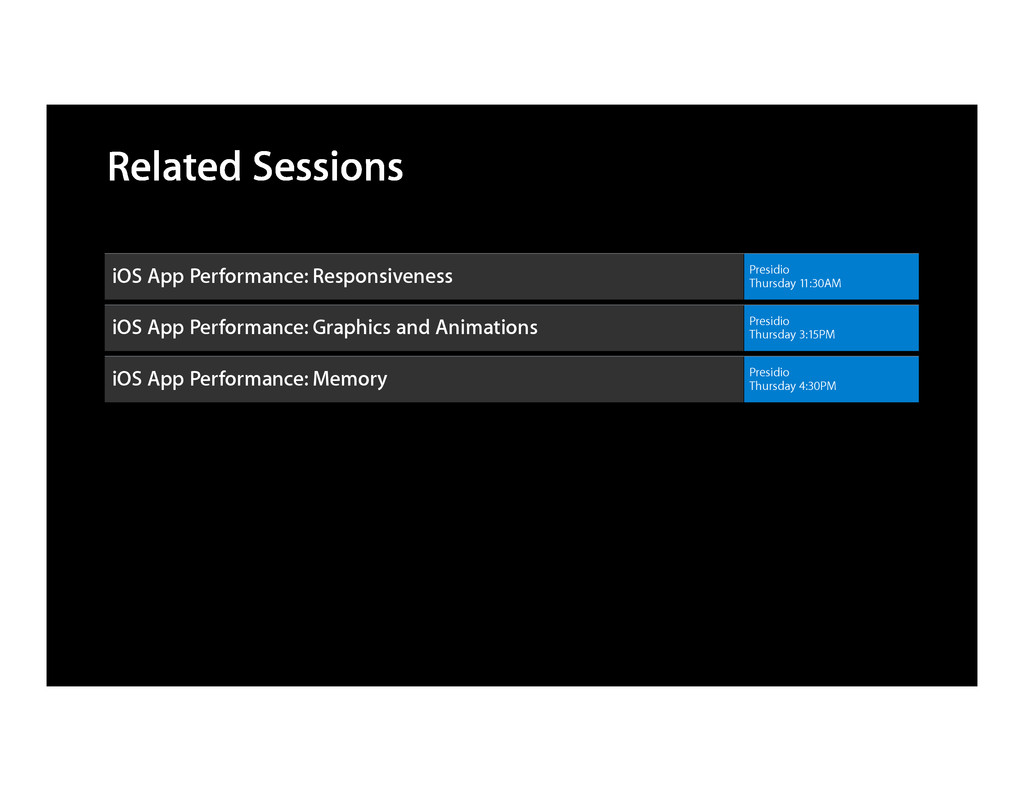
Related Sessions iOS App Performance: Responsiveness Presidio Thursday 11:30AM iOS
App Performance: Graphics and Animations Presidio Thursday 3:15PM iOS App Performance: Memory Presidio Thursday 4:30PM
Labs Xcode Lab Developer Tools Lab B Ongoing
None
None
None
None
![More Information Michael Jurewitz Developer Tools Evangelist [email protected] Instruments Documentation](https://files.speakerdeck.com/presentations/503ae2c891361a0002025fca/slide_98.jpg)