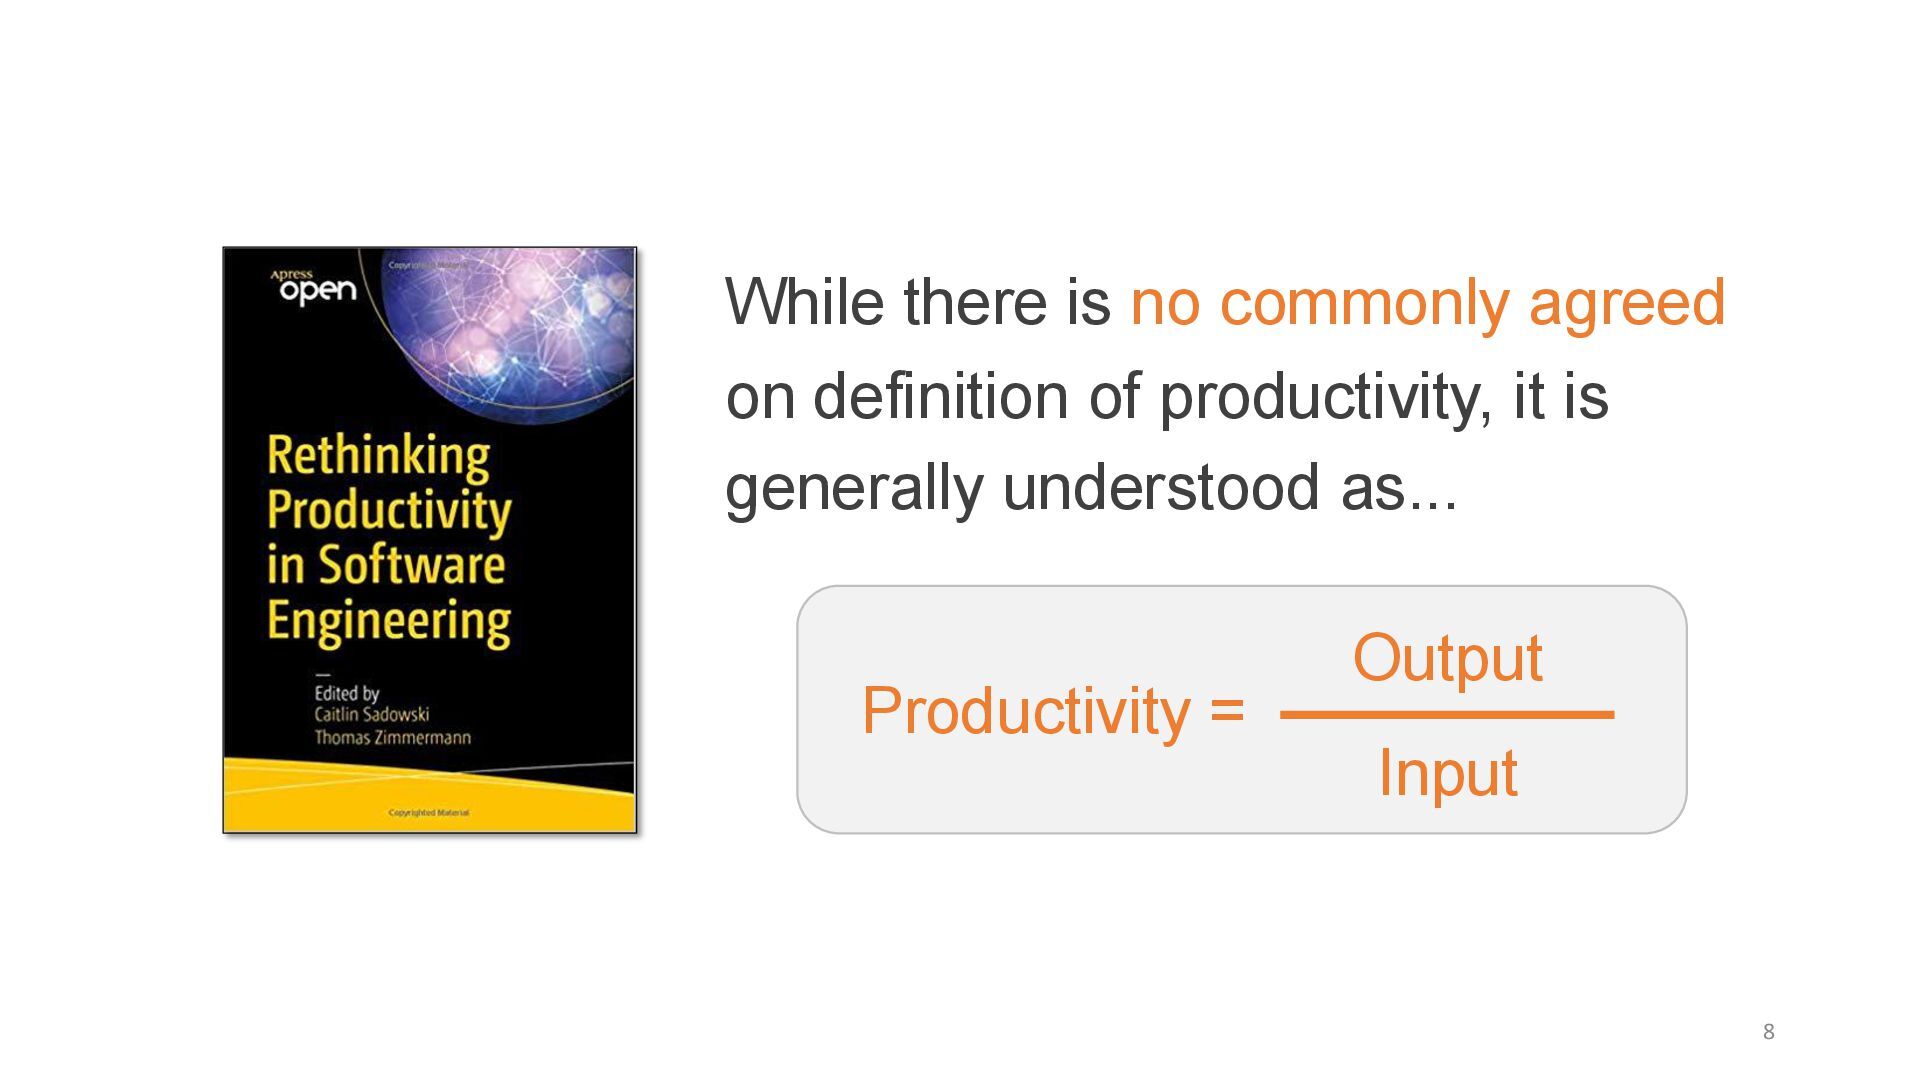
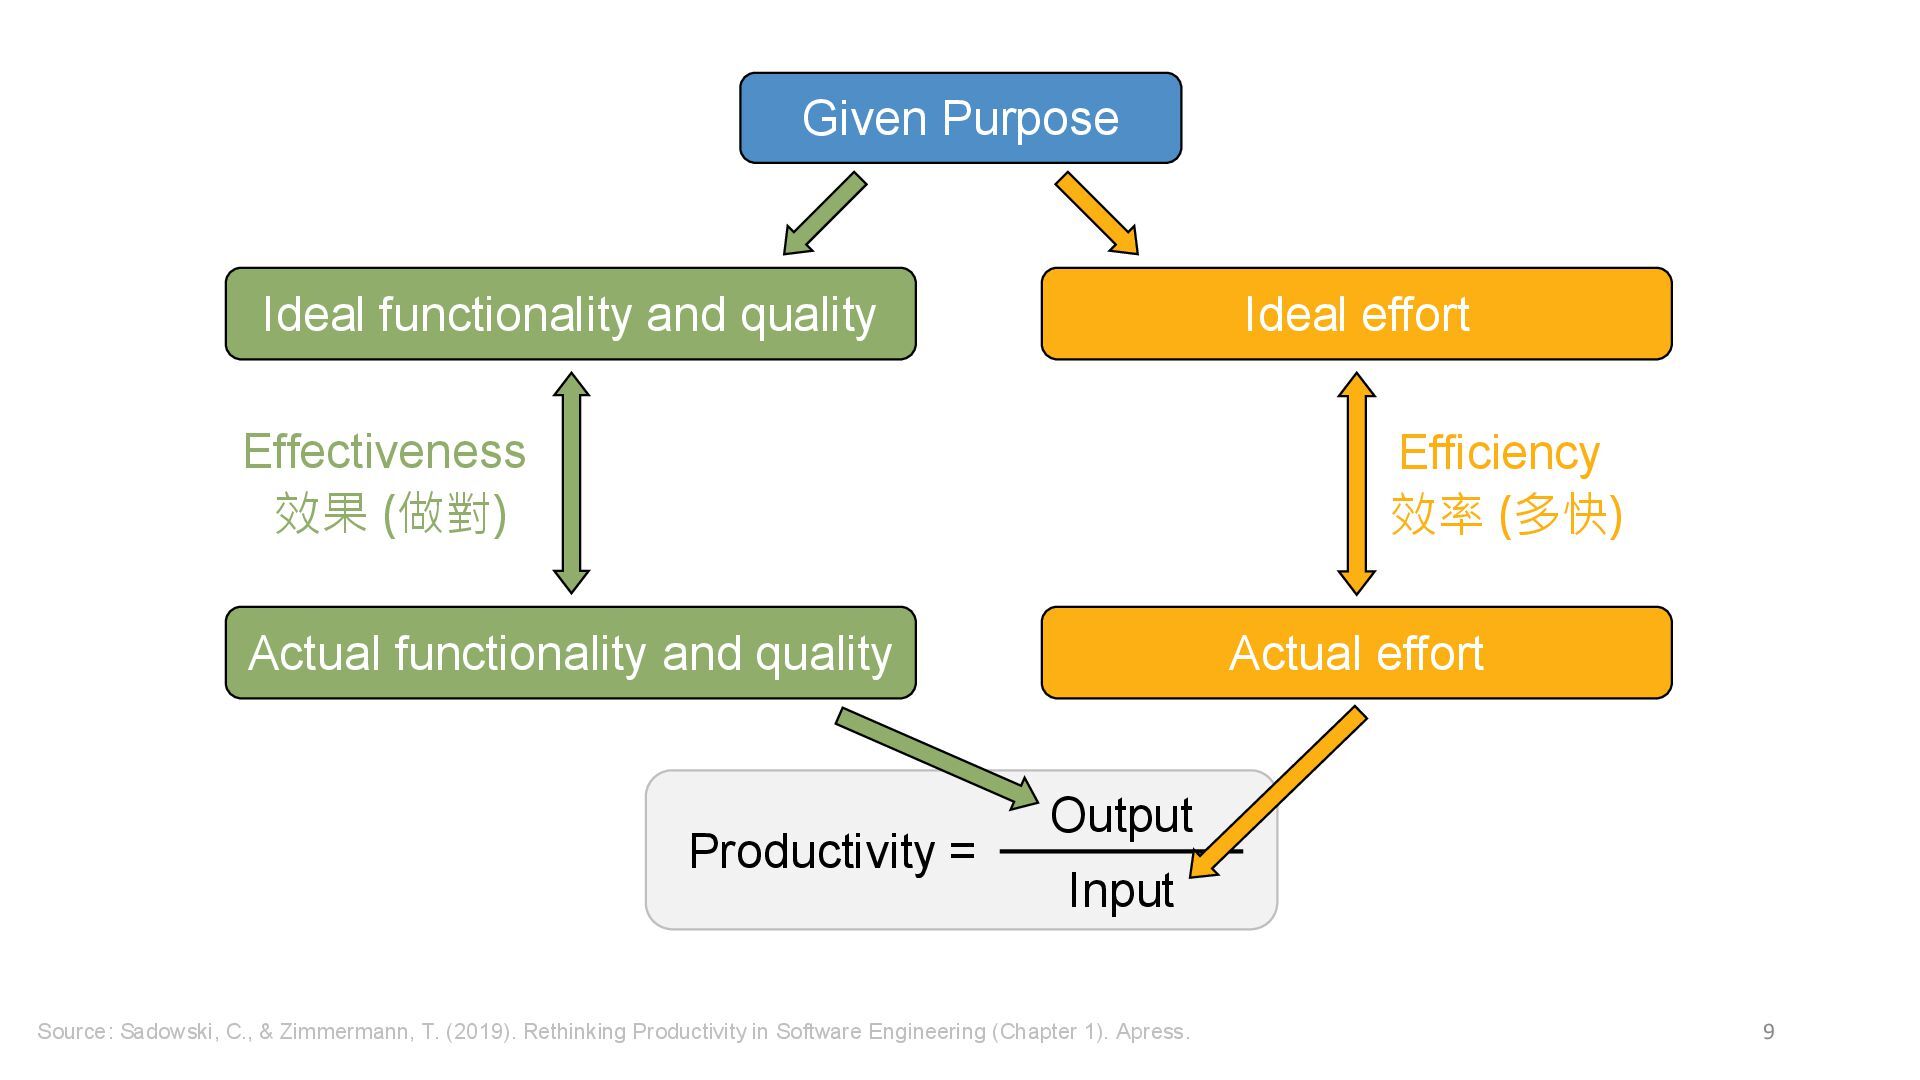
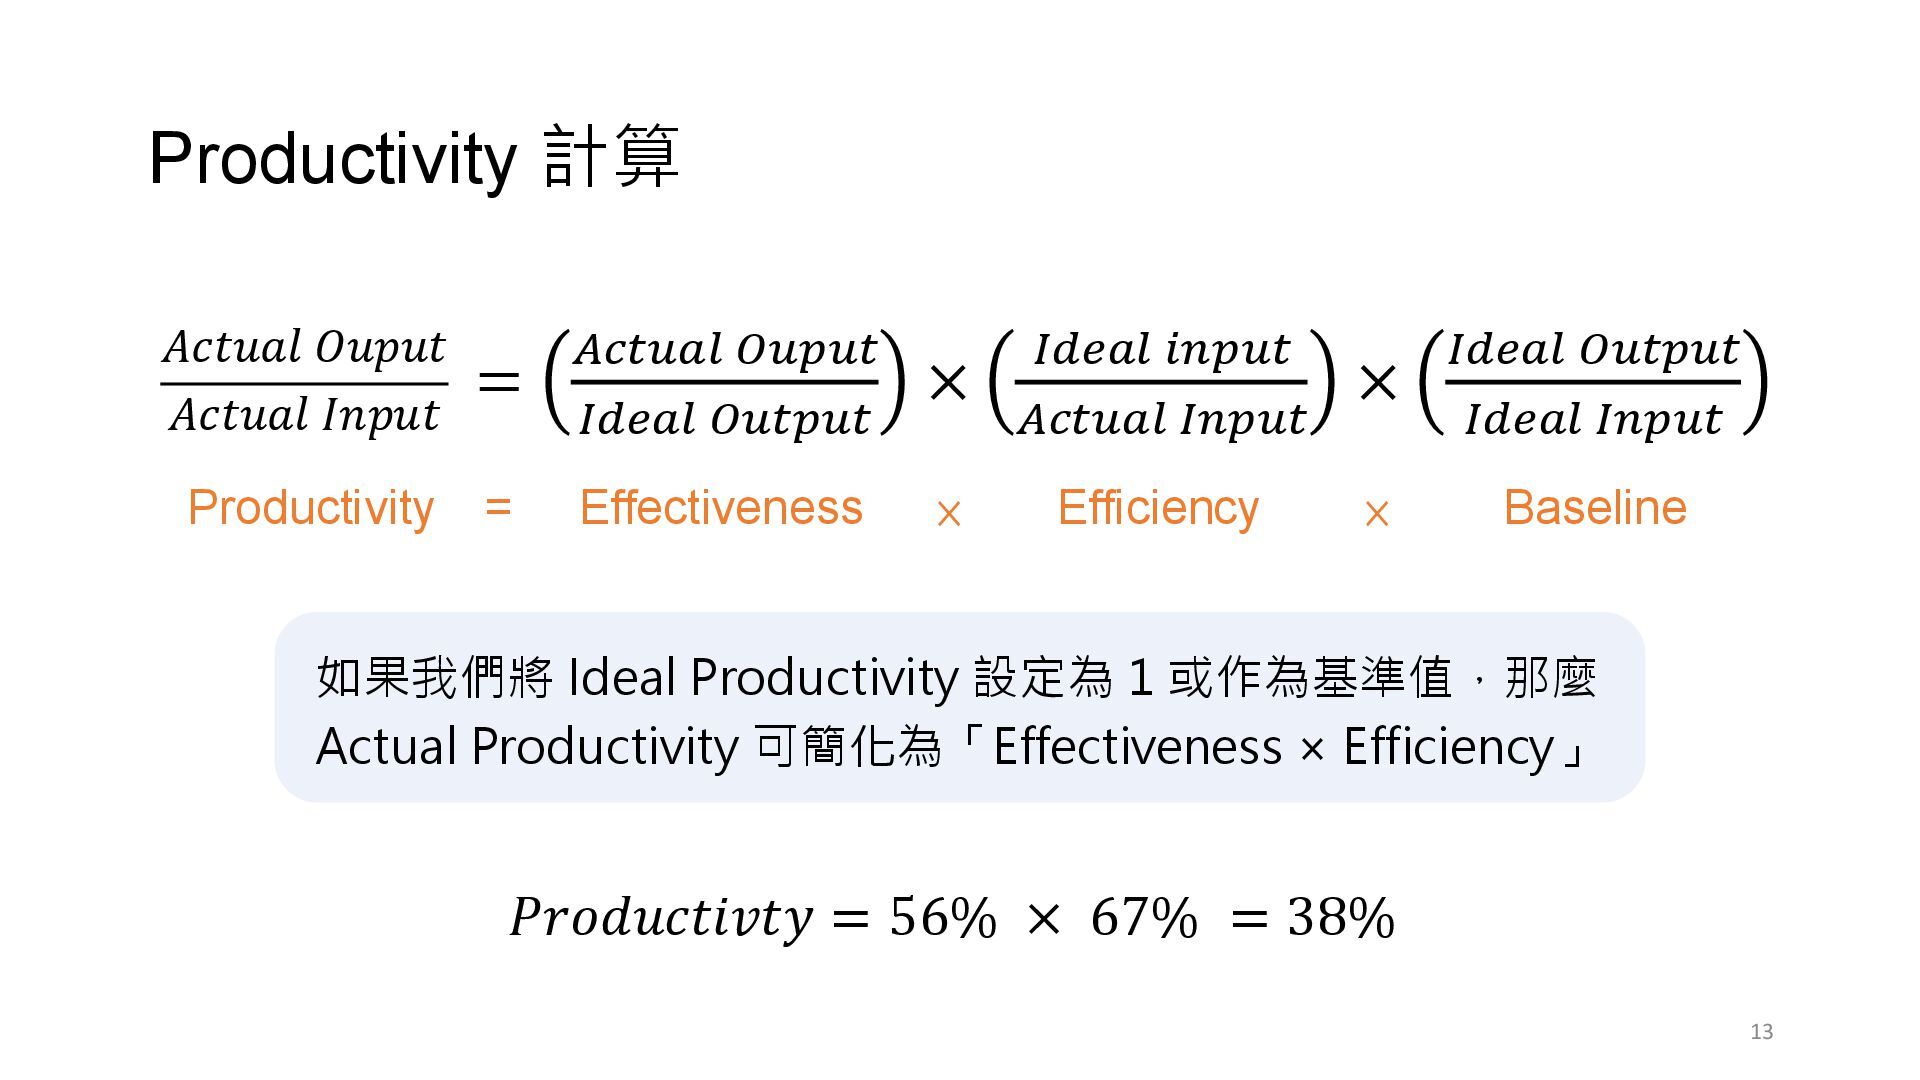
in Software Engineering (Chapter 1). Apress. Given Purpose Productivity = Input Output Ideal functionality and quality Ideal effort Actual effort Actual functionality and quality Effectiveness 效果 (做對) Efficiency 效率 (多快)
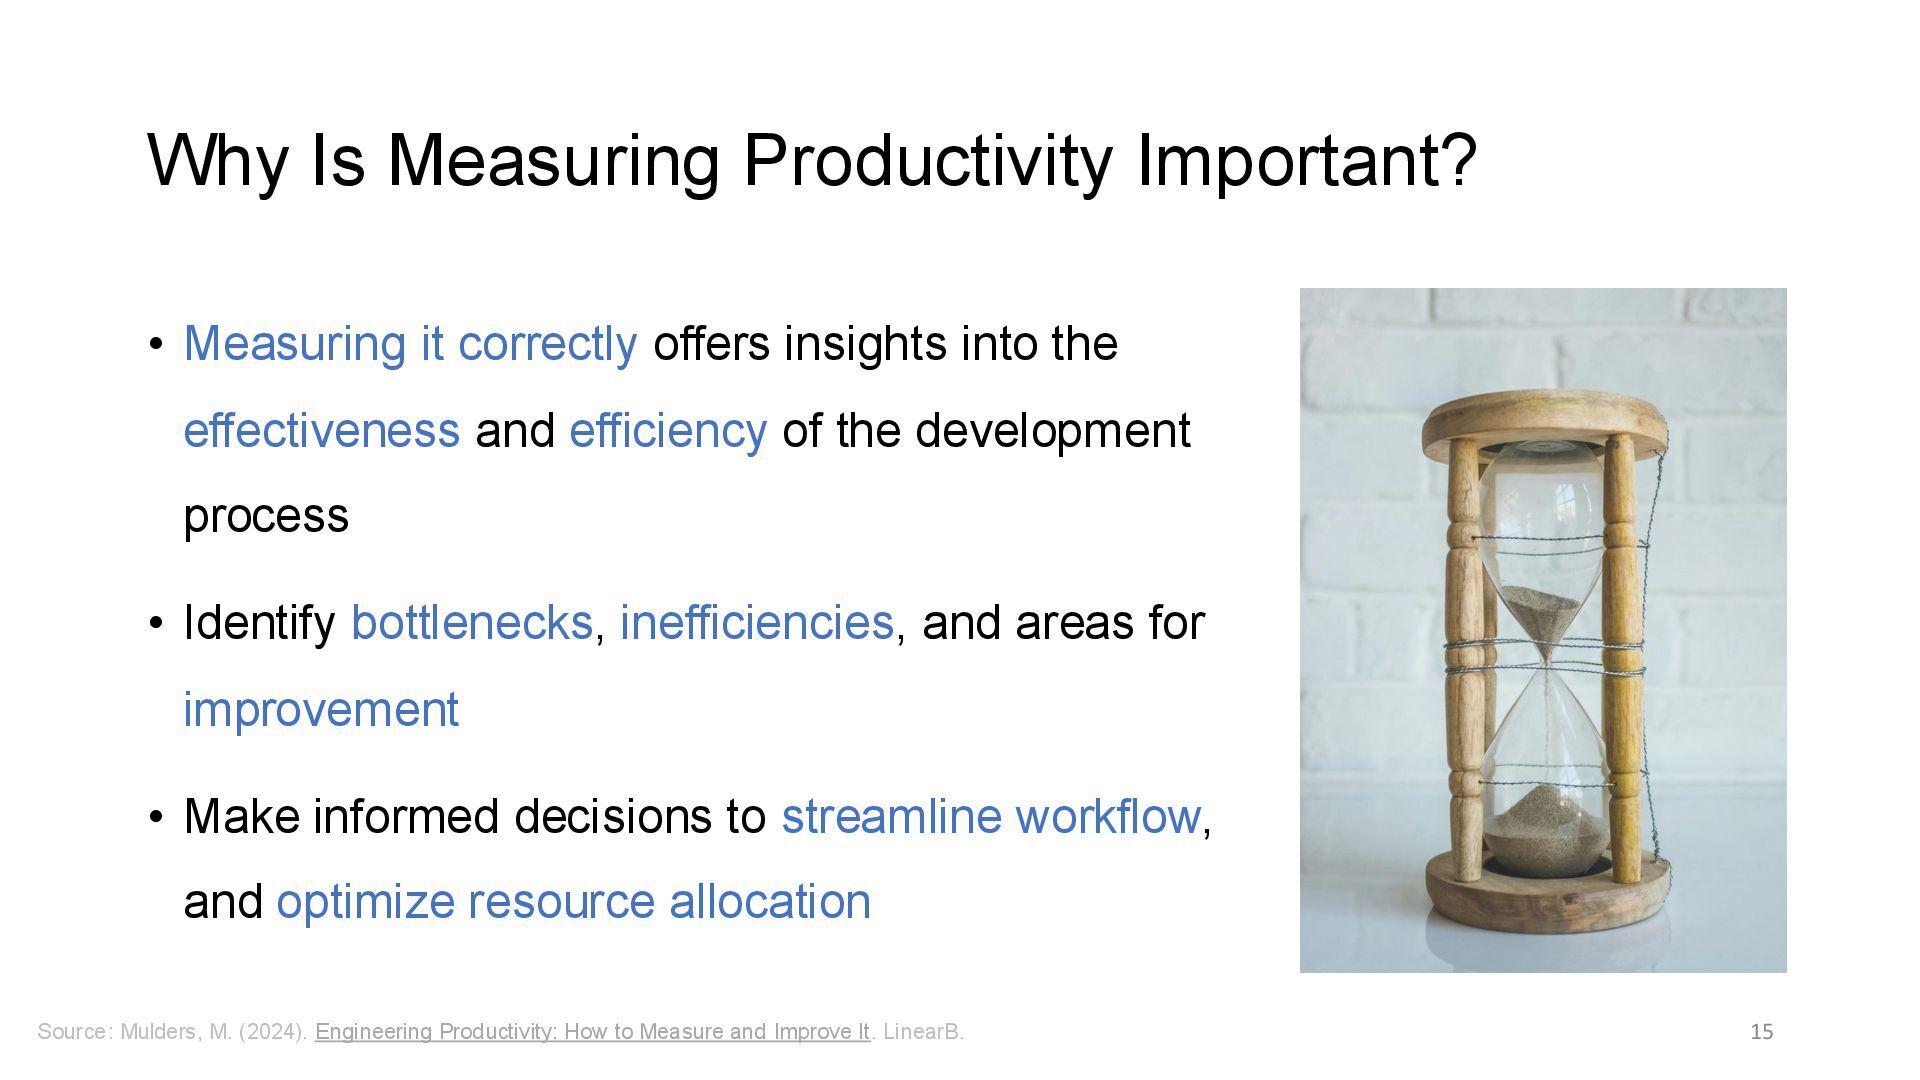
insights into the effectiveness and efficiency of the development process • Identify bottlenecks, inefficiencies, and areas for improvement • Make informed decisions to streamline workflow, and optimize resource allocation 15 Source: Mulders, M. (2024). Engineering Productivity: How to Measure and Improve It. LinearB.
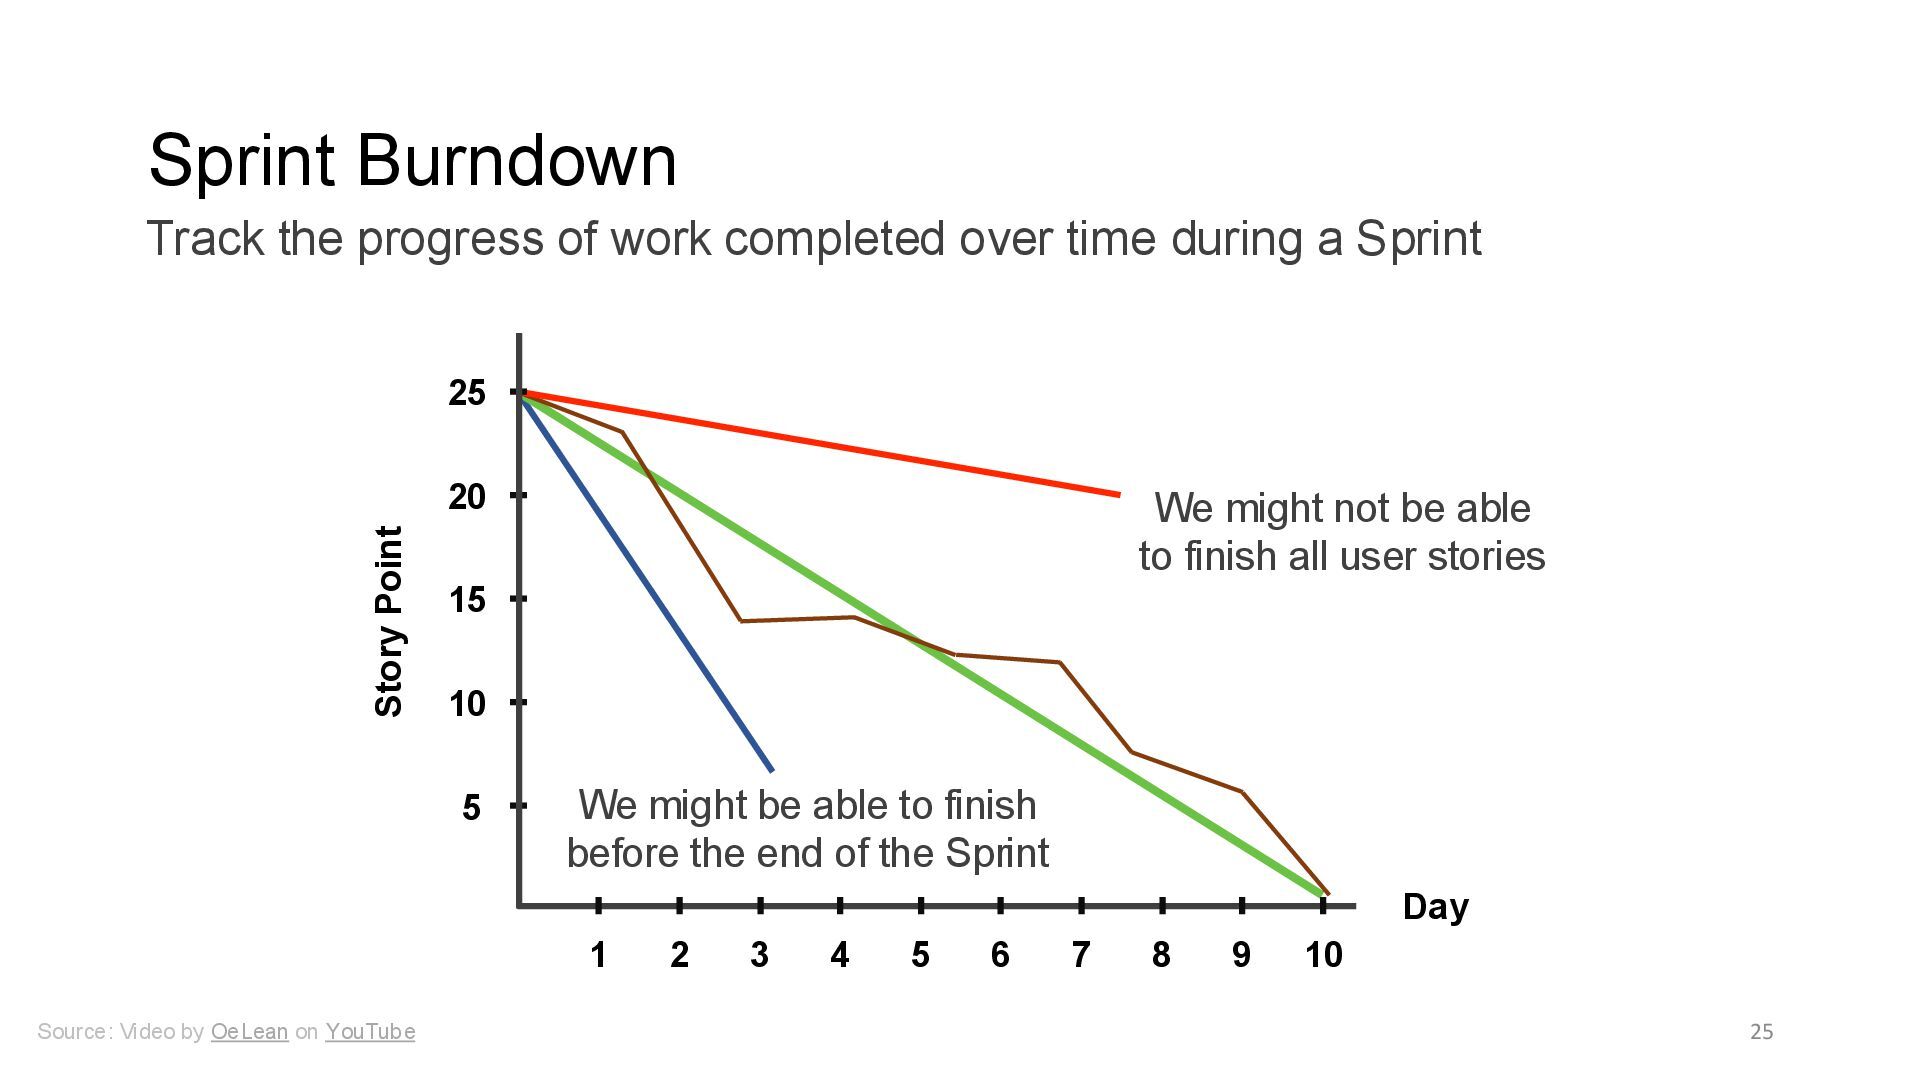
the progress of work completed over time during a Sprint We might not be able to finish all user stories We might be able to finish before the end of the Sprint Day 1 2 3 4 5 6 7 8 9 10 Story Point 5 10 15 20 25
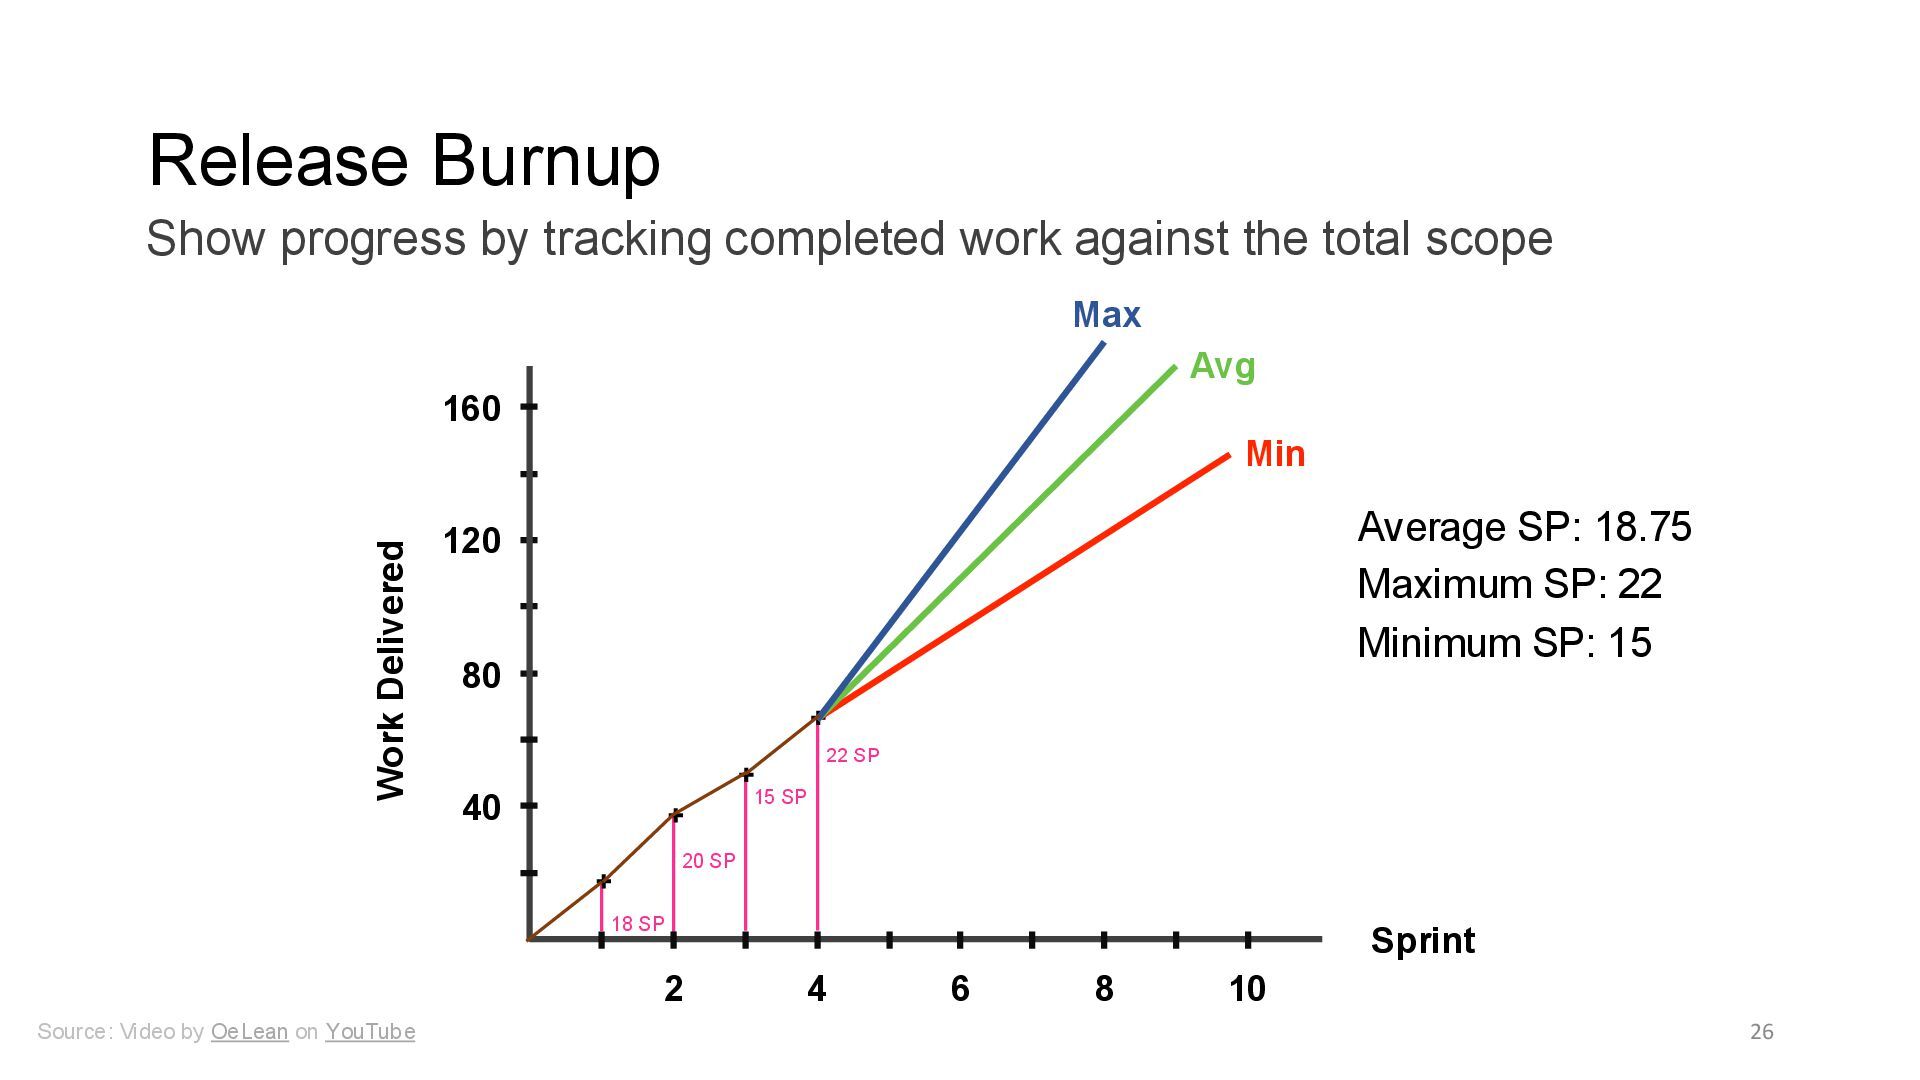
progress by tracking completed work against the total scope 18 SP 20 SP 15 SP 22 SP Average SP: 18.75 Maximum SP: 22 Minimum SP: 15 Min Avg Max Sprint 2 4 6 10 8 40 80 120 160 Work Delivered
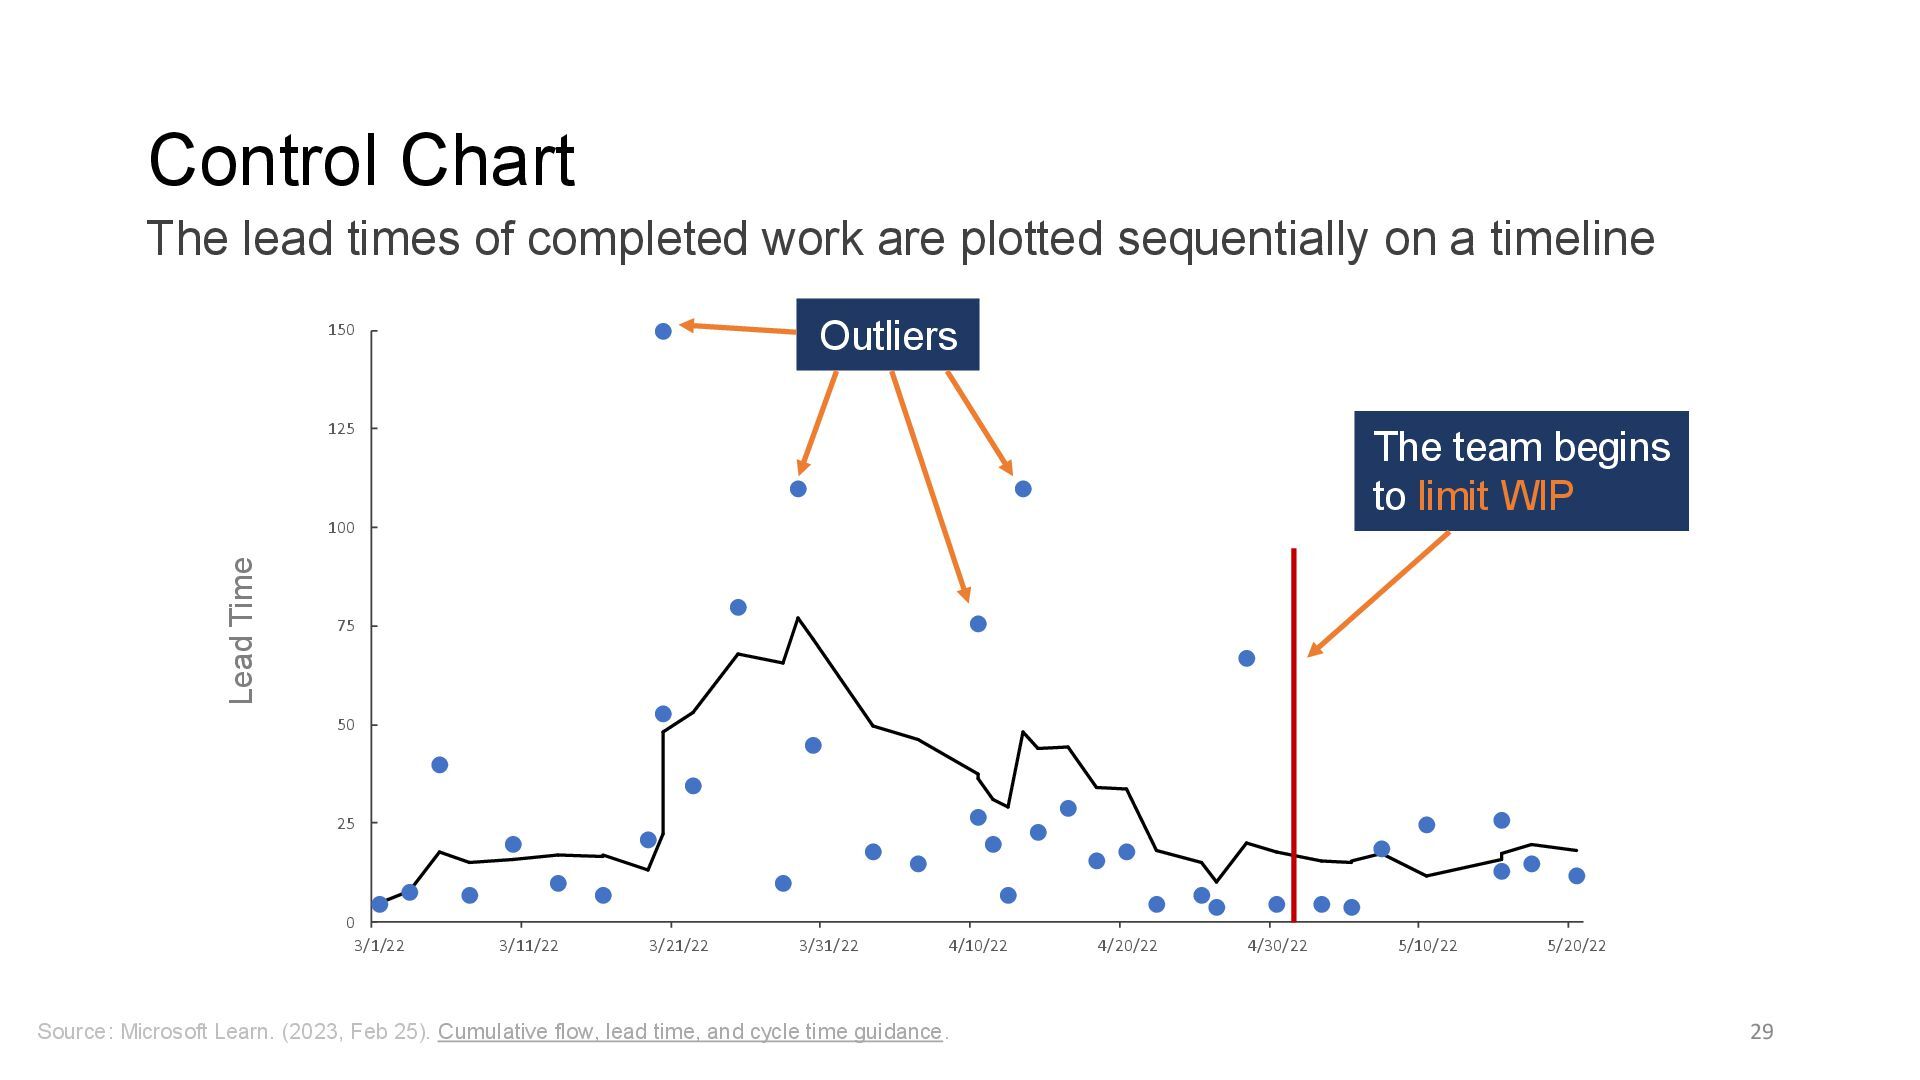
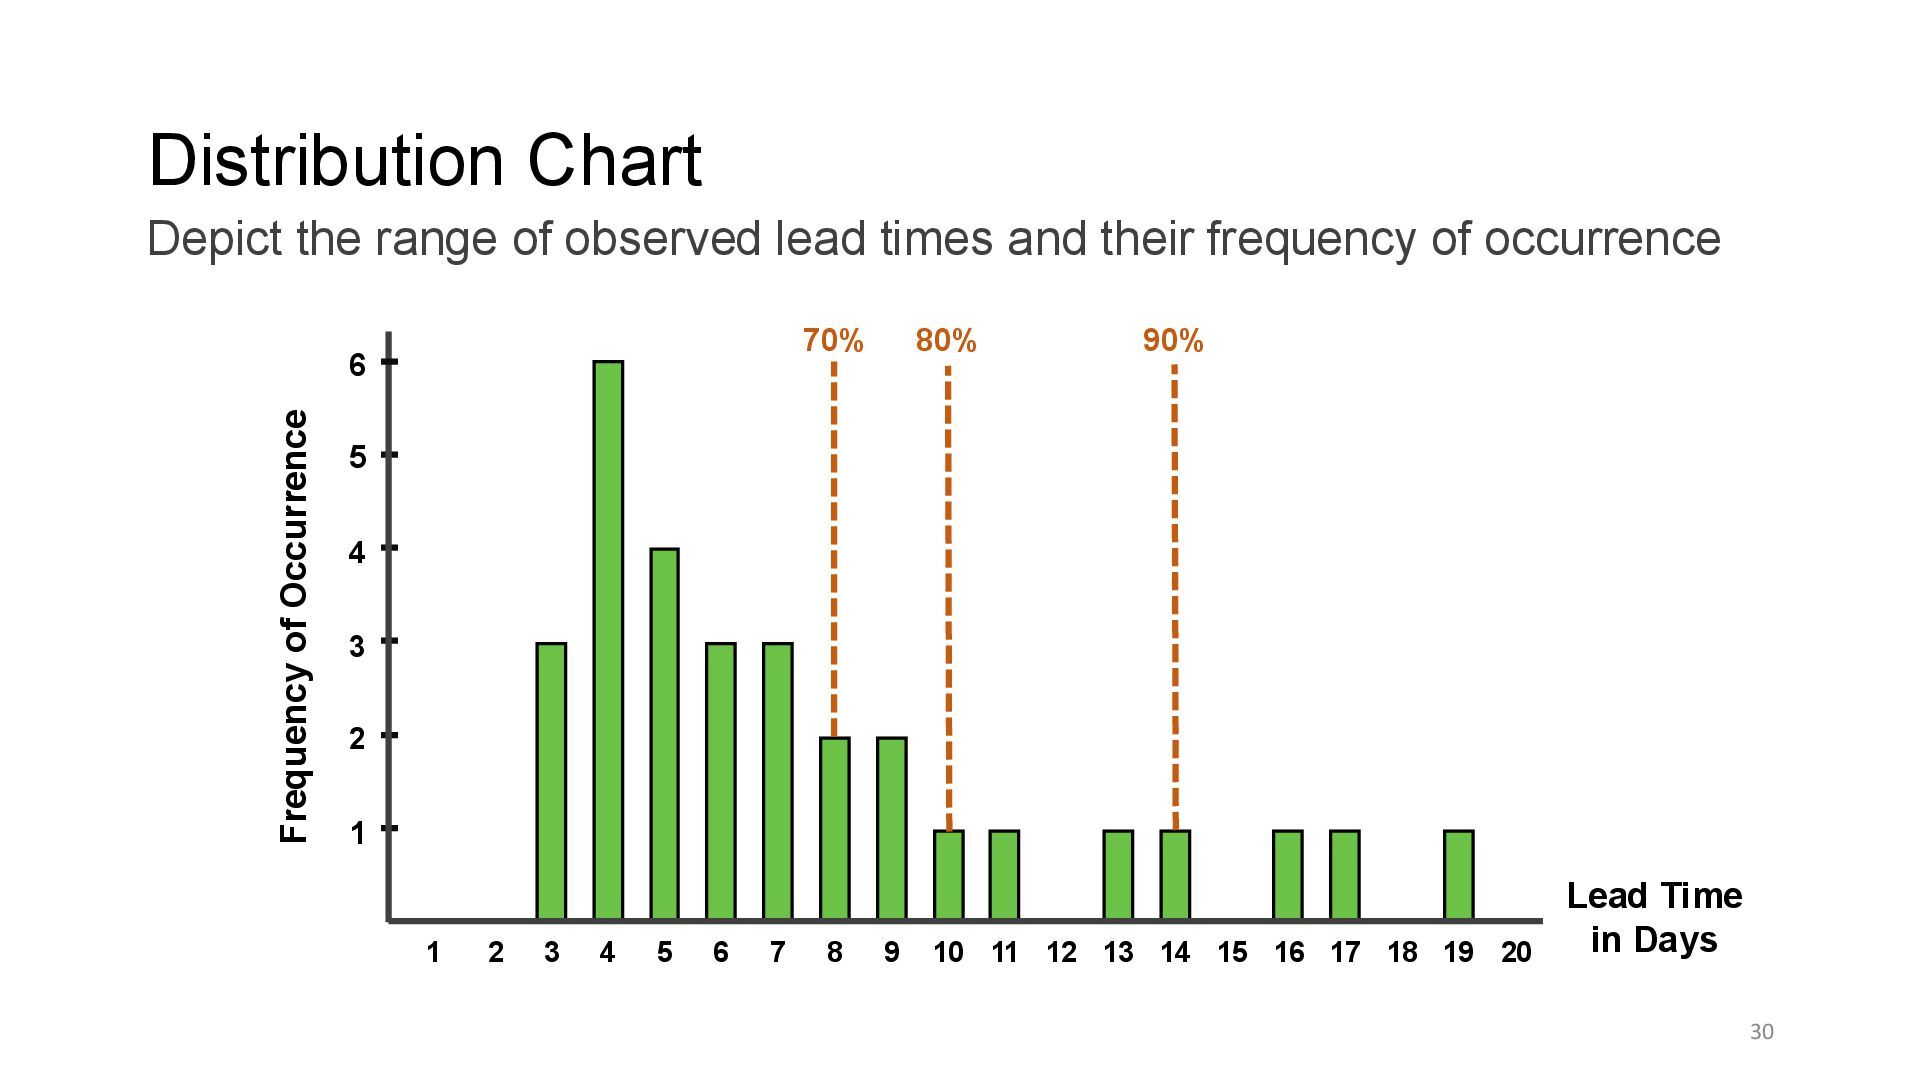
flow, lead time, and cycle time guidance. The lead times of completed work are plotted sequentially on a timeline 0 25 50 75 100 125 150 3/1/22 3/11/22 3/21/22 3/31/22 4/10/22 4/20/22 4/30/22 5/10/22 5/20/22 Lead Time Outliers The team begins to limit WIP
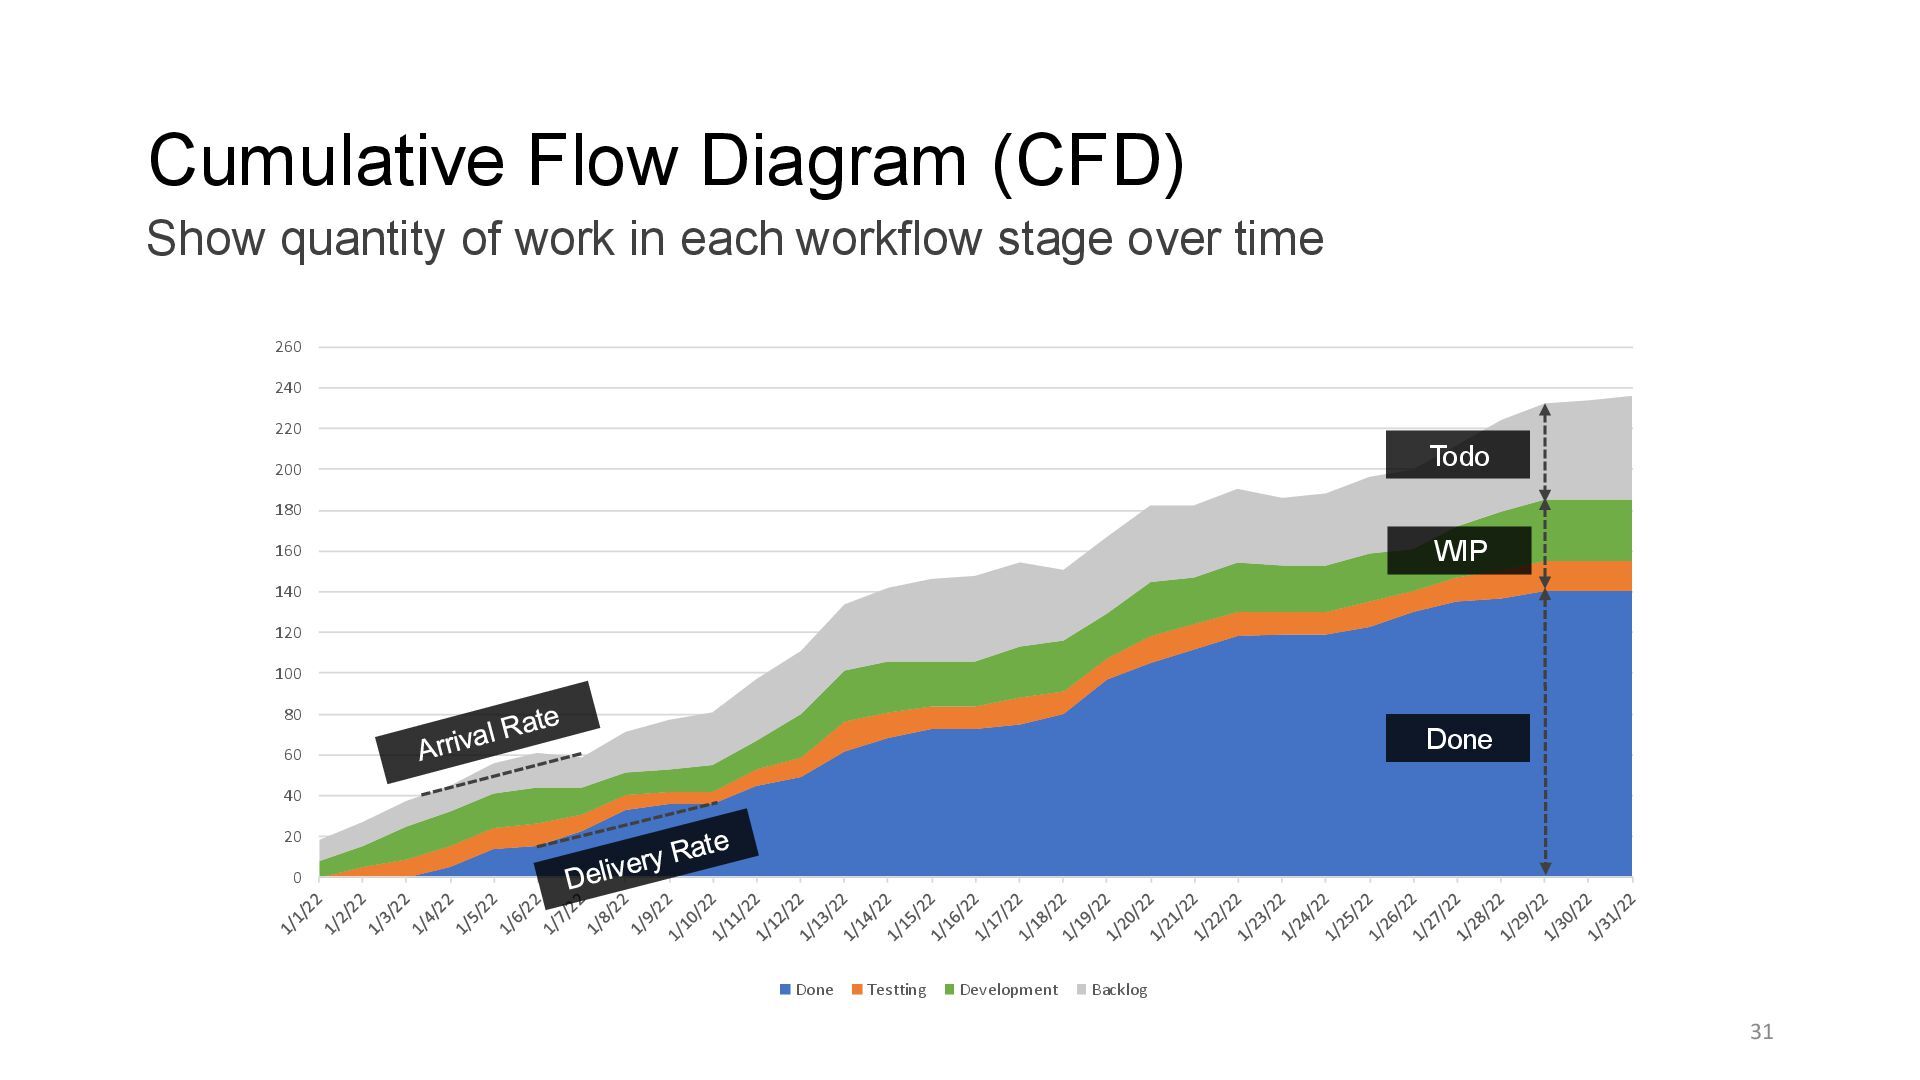
200 220 240 260 Done Testting Development Backlog Cumulative Flow Diagram (CFD) 31 Show quantity of work in each workflow stage over time Todo Done WIP
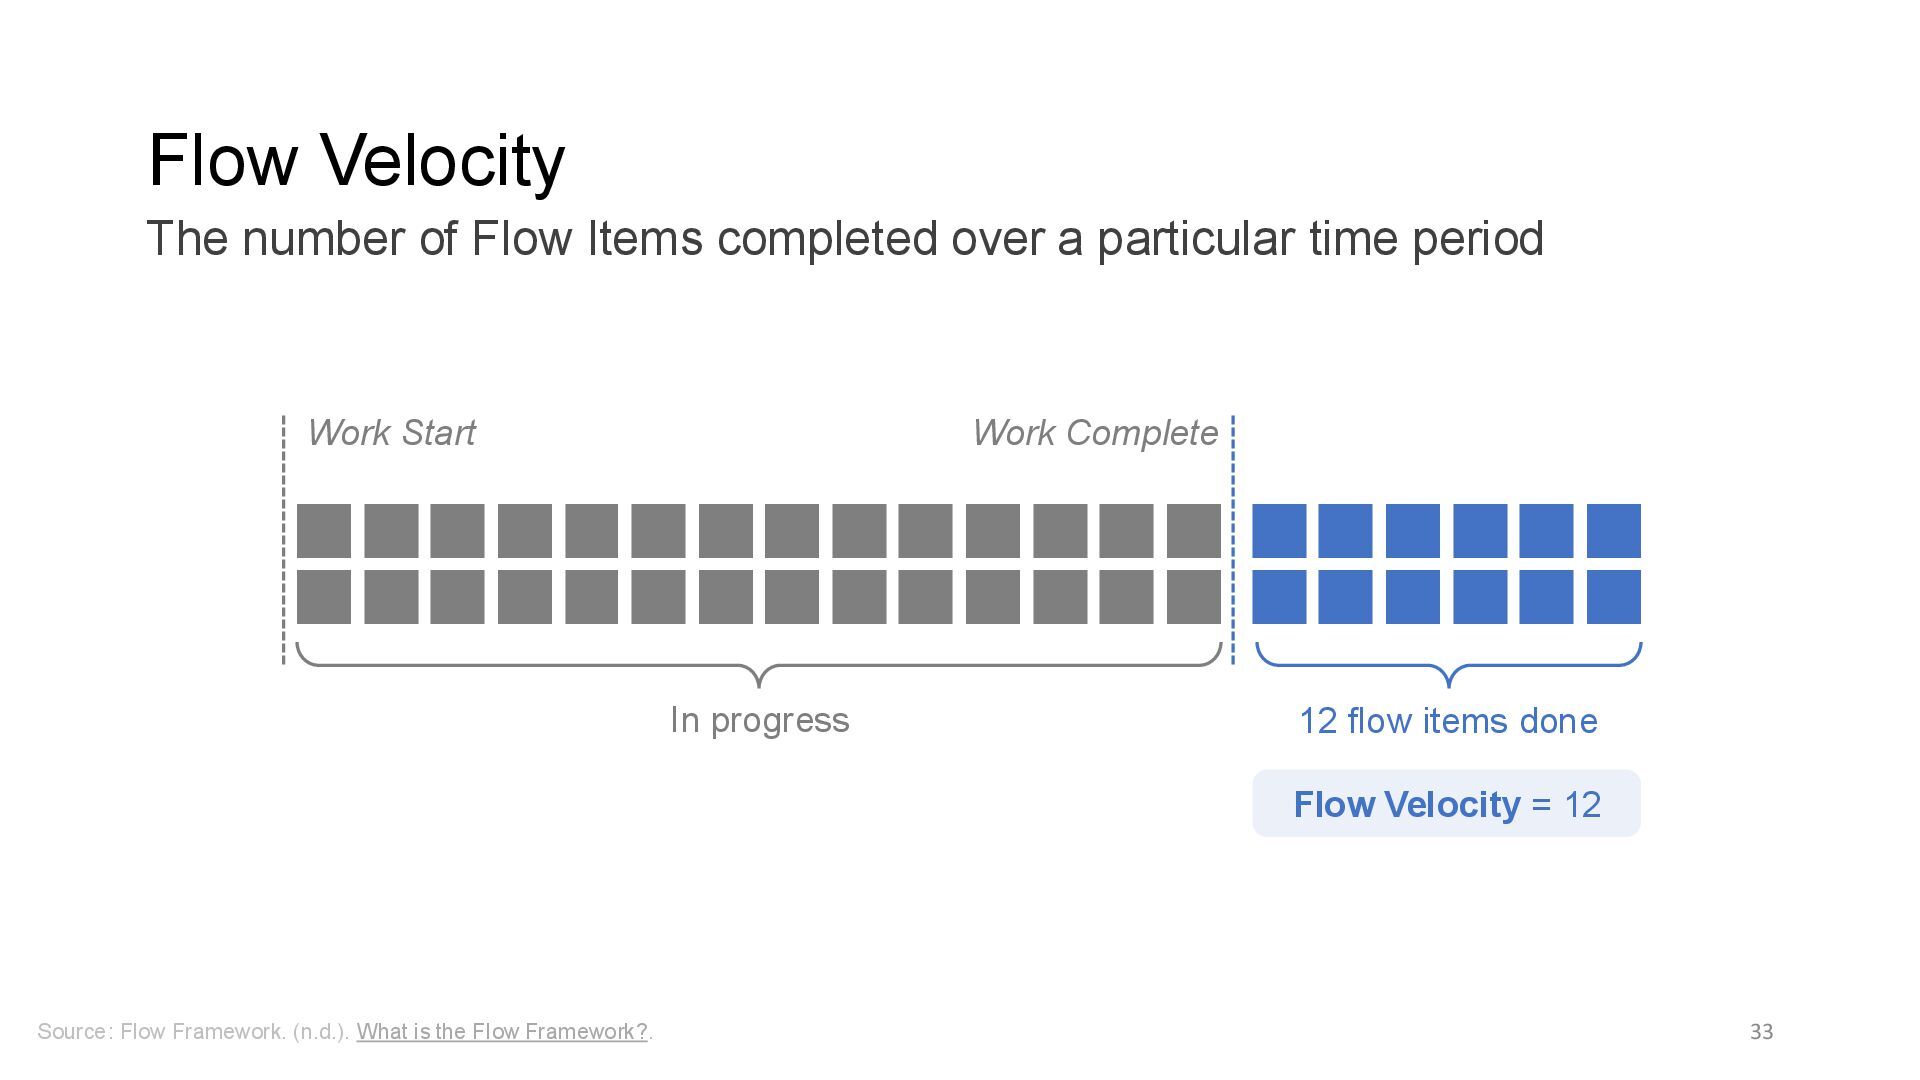
Flow Framework?. The number of Flow Items completed over a particular time period In progress 12 flow items done Flow Velocity = 12 Work Start Work Complete
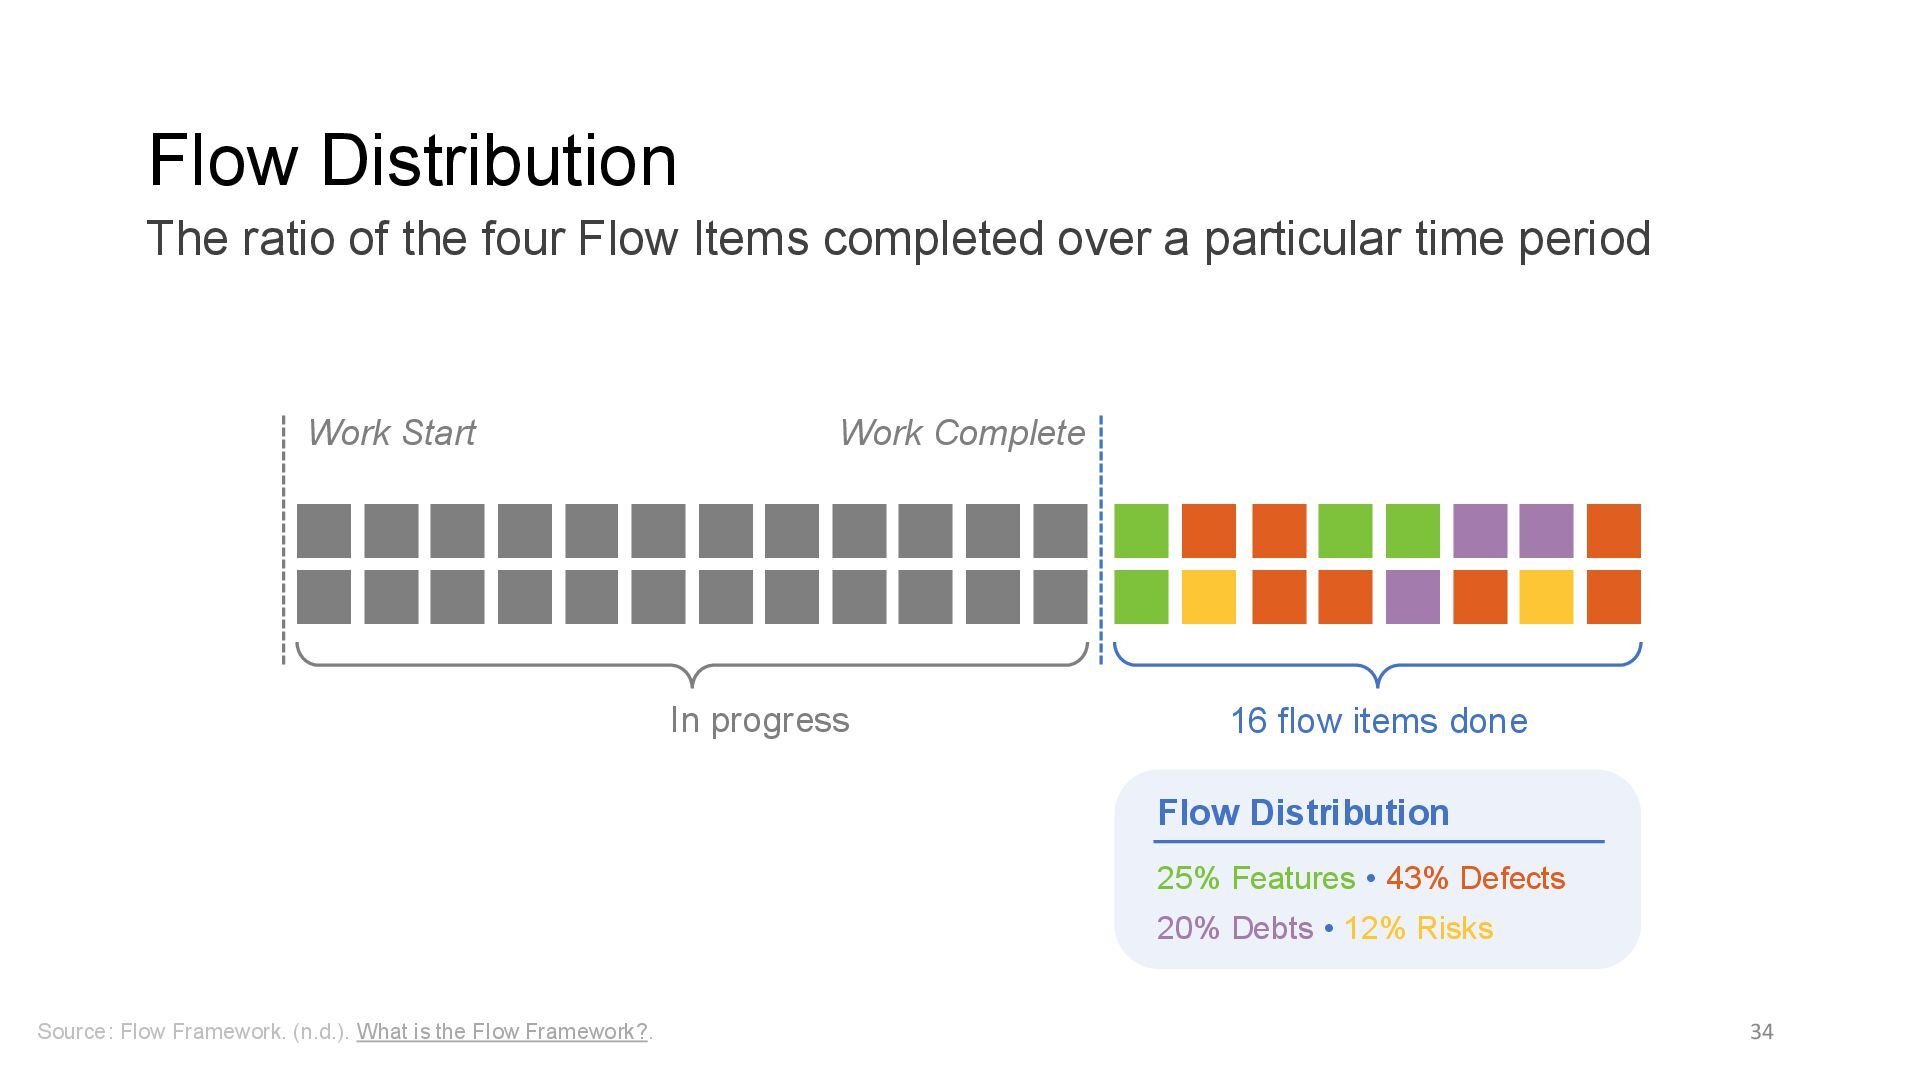
Flow Framework?. The ratio of the four Flow Items completed over a particular time period 16 flow items done In progress Work Start Work Complete Flow Distribution 25% Features • 43% Defects 20% Debts • 12% Risks
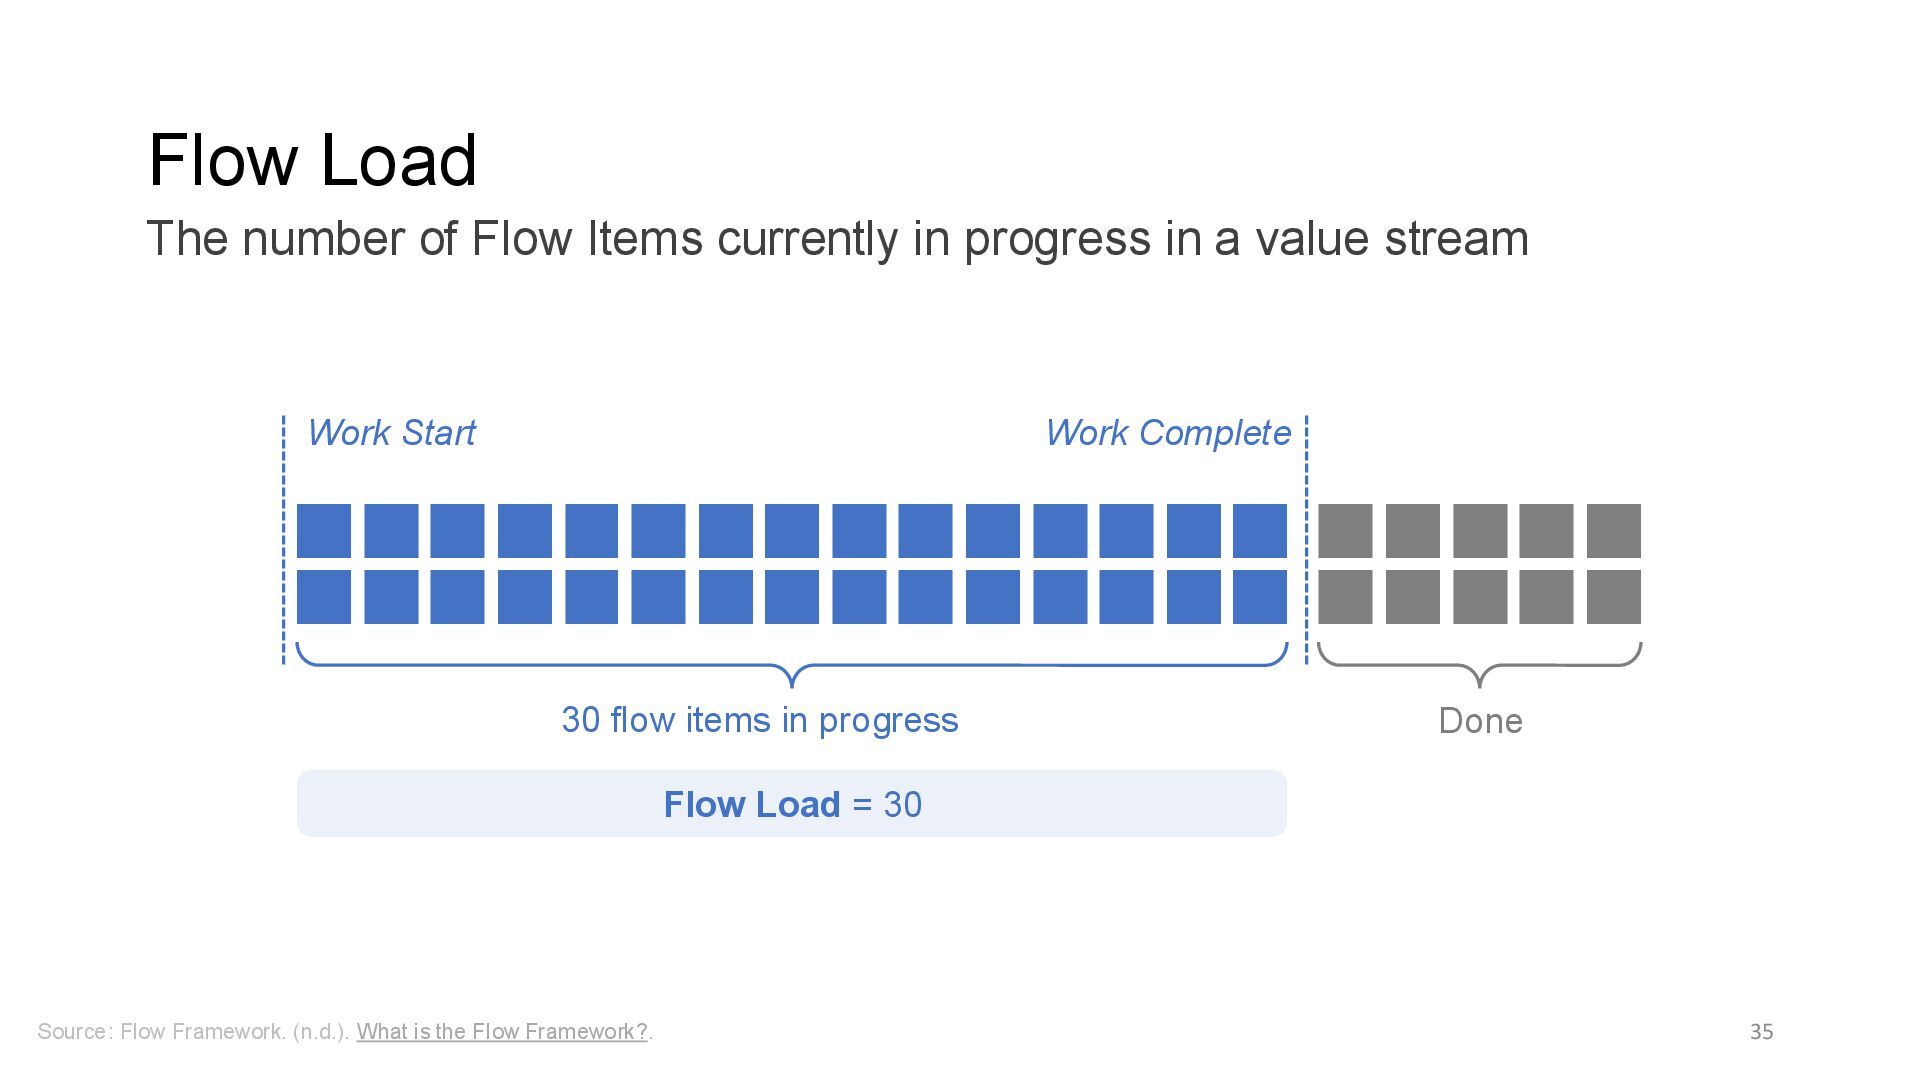
Flow Framework?. The number of Flow Items currently in progress in a value stream Done Flow Load = 30 30 flow items in progress Work Start Work Complete
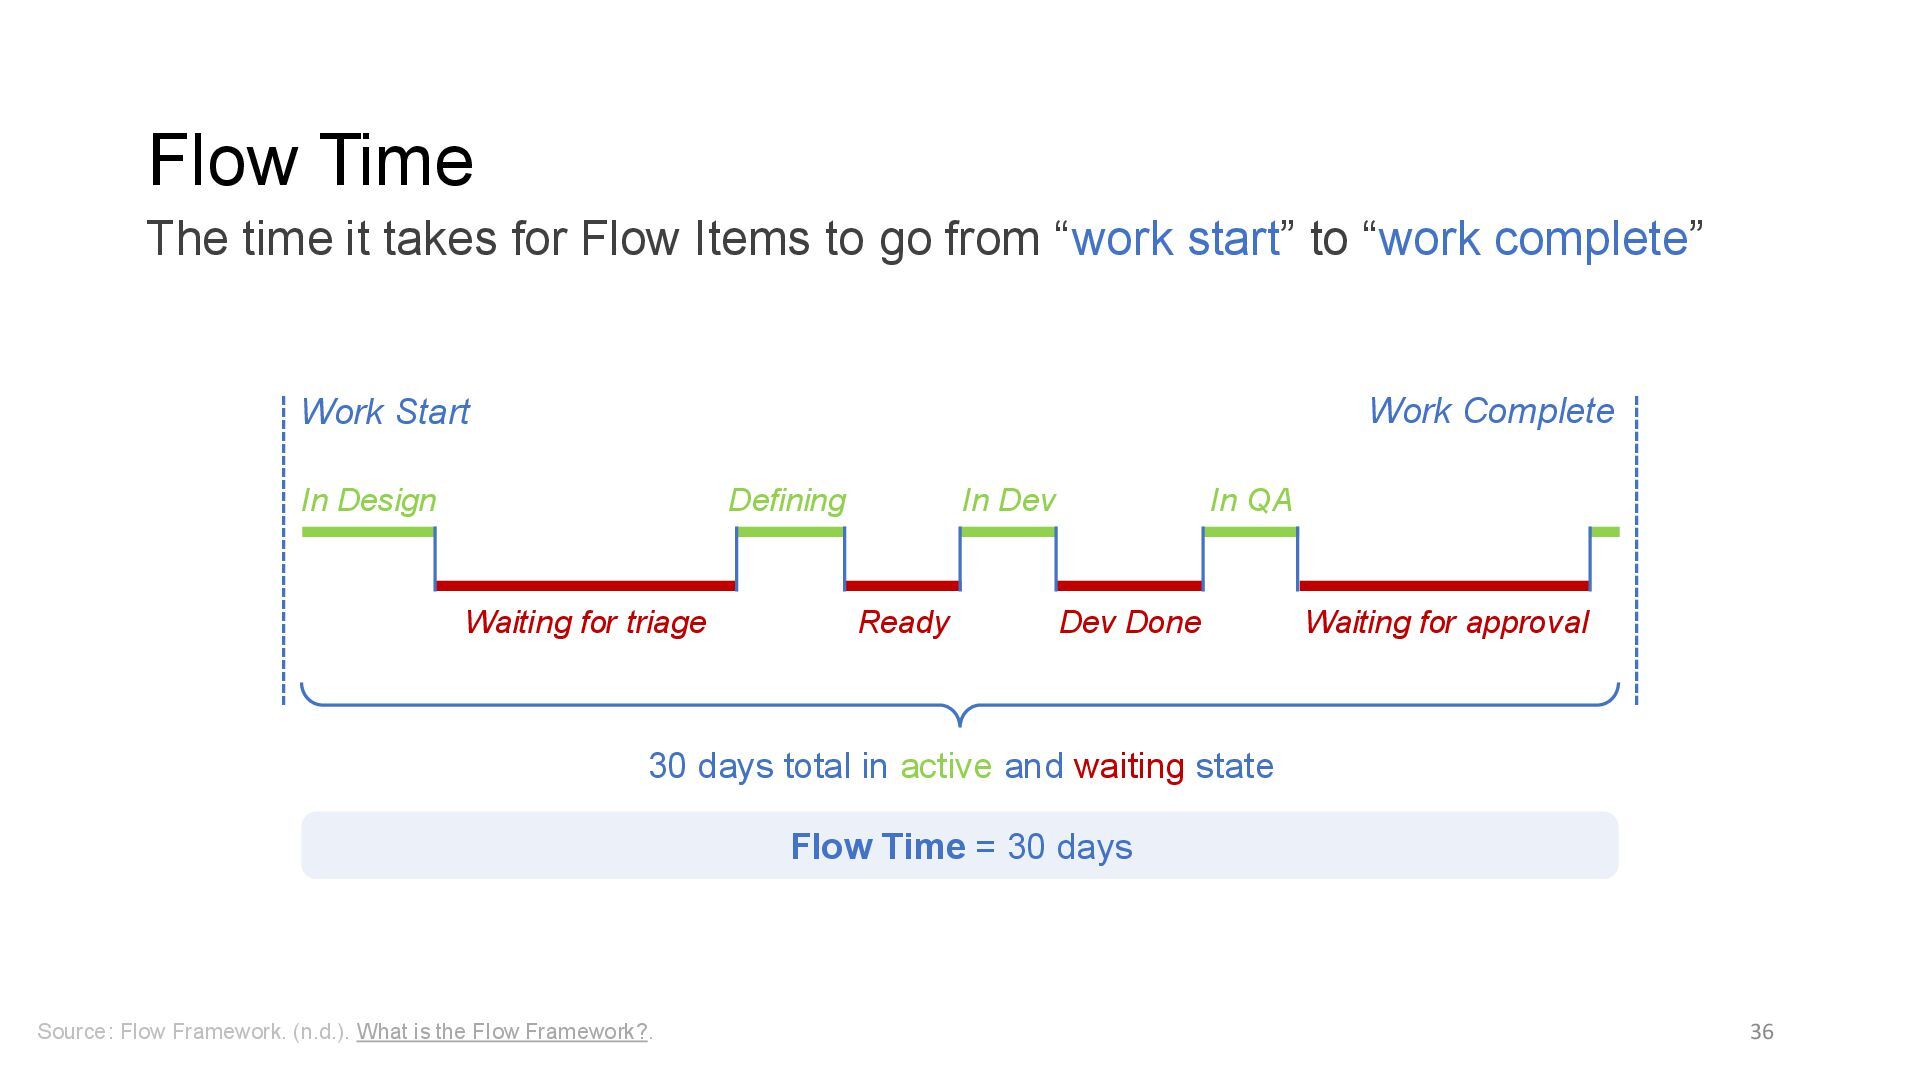
Flow Framework?. The time it takes for Flow Items to go from “work start” to “work complete” Work Complete 30 days total in active and waiting state Flow Time = 30 days Work Start In Design Defining In Dev In QA Waiting for triage Ready Dev Done Waiting for approval
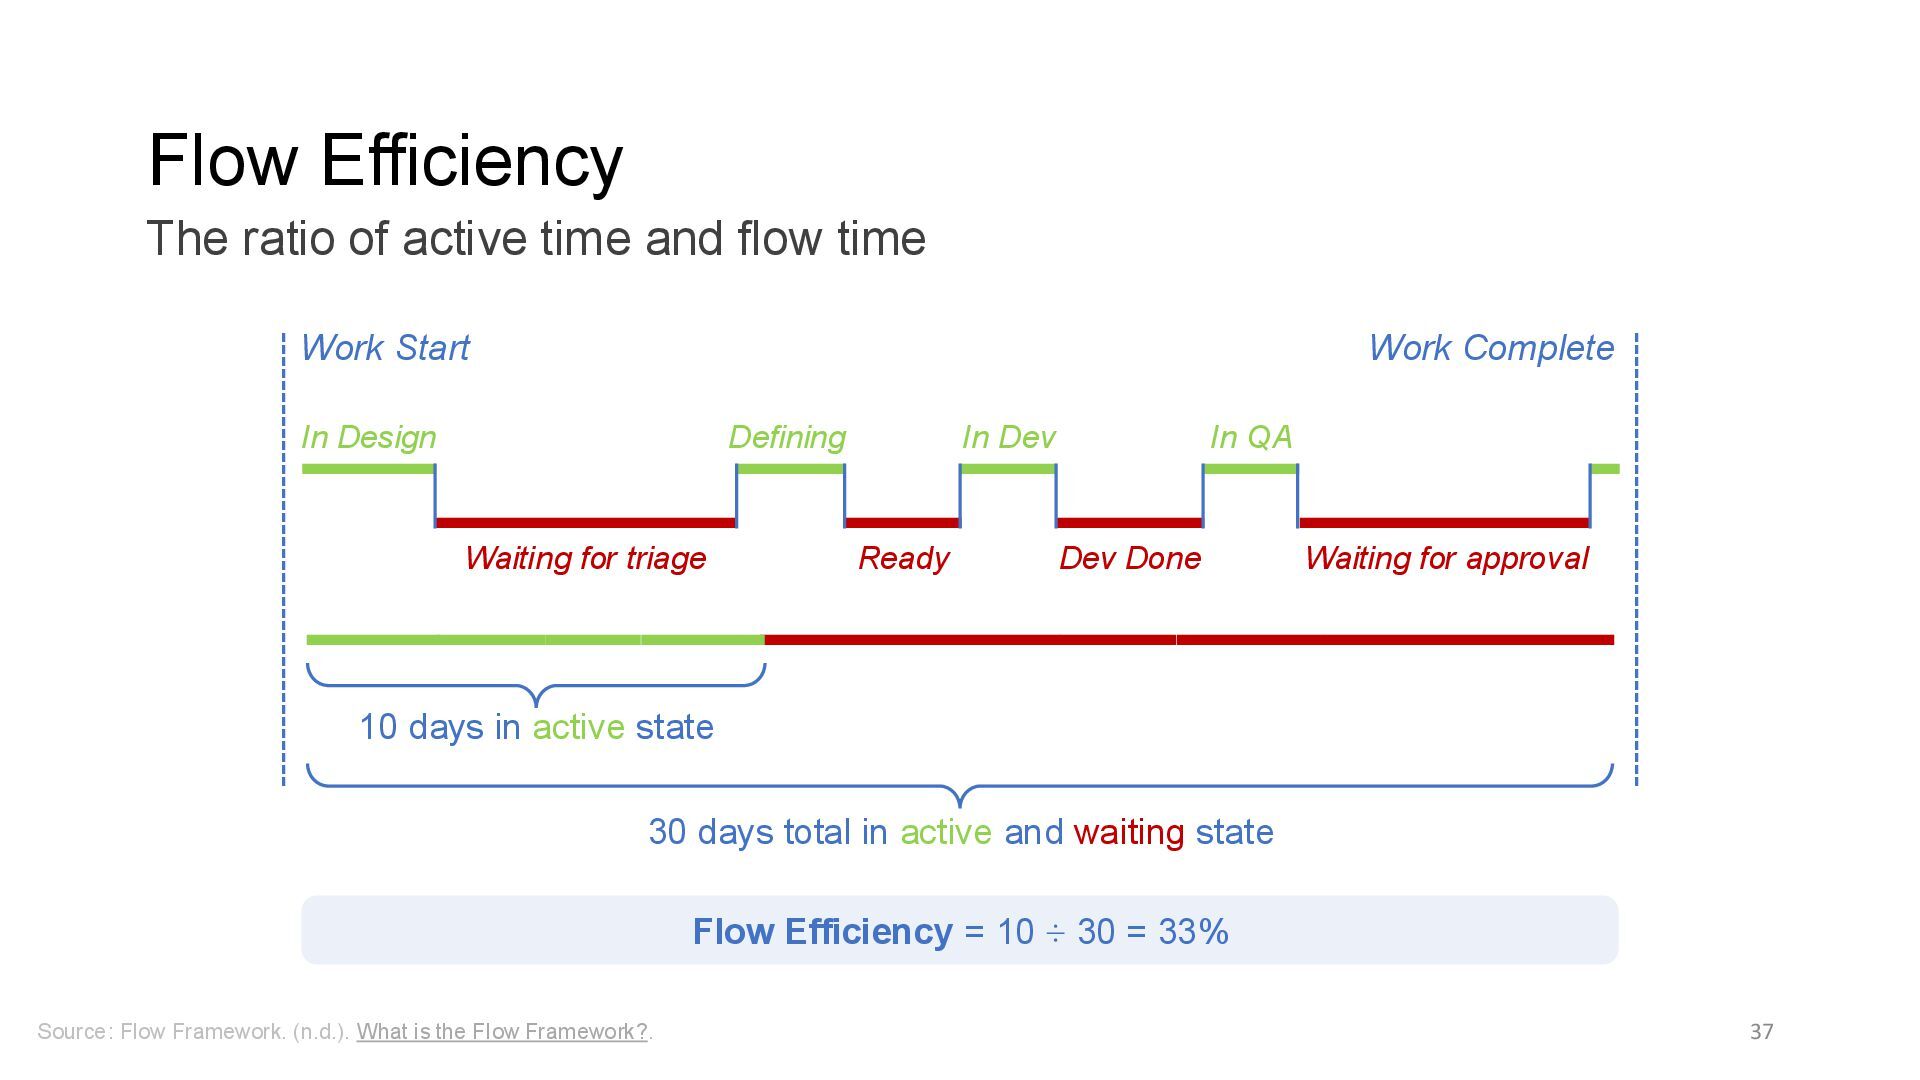
Flow Framework?. The ratio of active time and flow time Work Complete Work Start In Design Defining In Dev In QA Waiting for triage Ready Dev Done Waiting for approval 30 days total in active and waiting state 10 days in active state Flow Efficiency = 10 ÷ 30 = 33%
program from 2014, which validated a number of technical, process, measurement, and cultural capabilities that drive higher software delivery and organizational performance 41 Nicole Forsgren Jez Humble Gene Kim
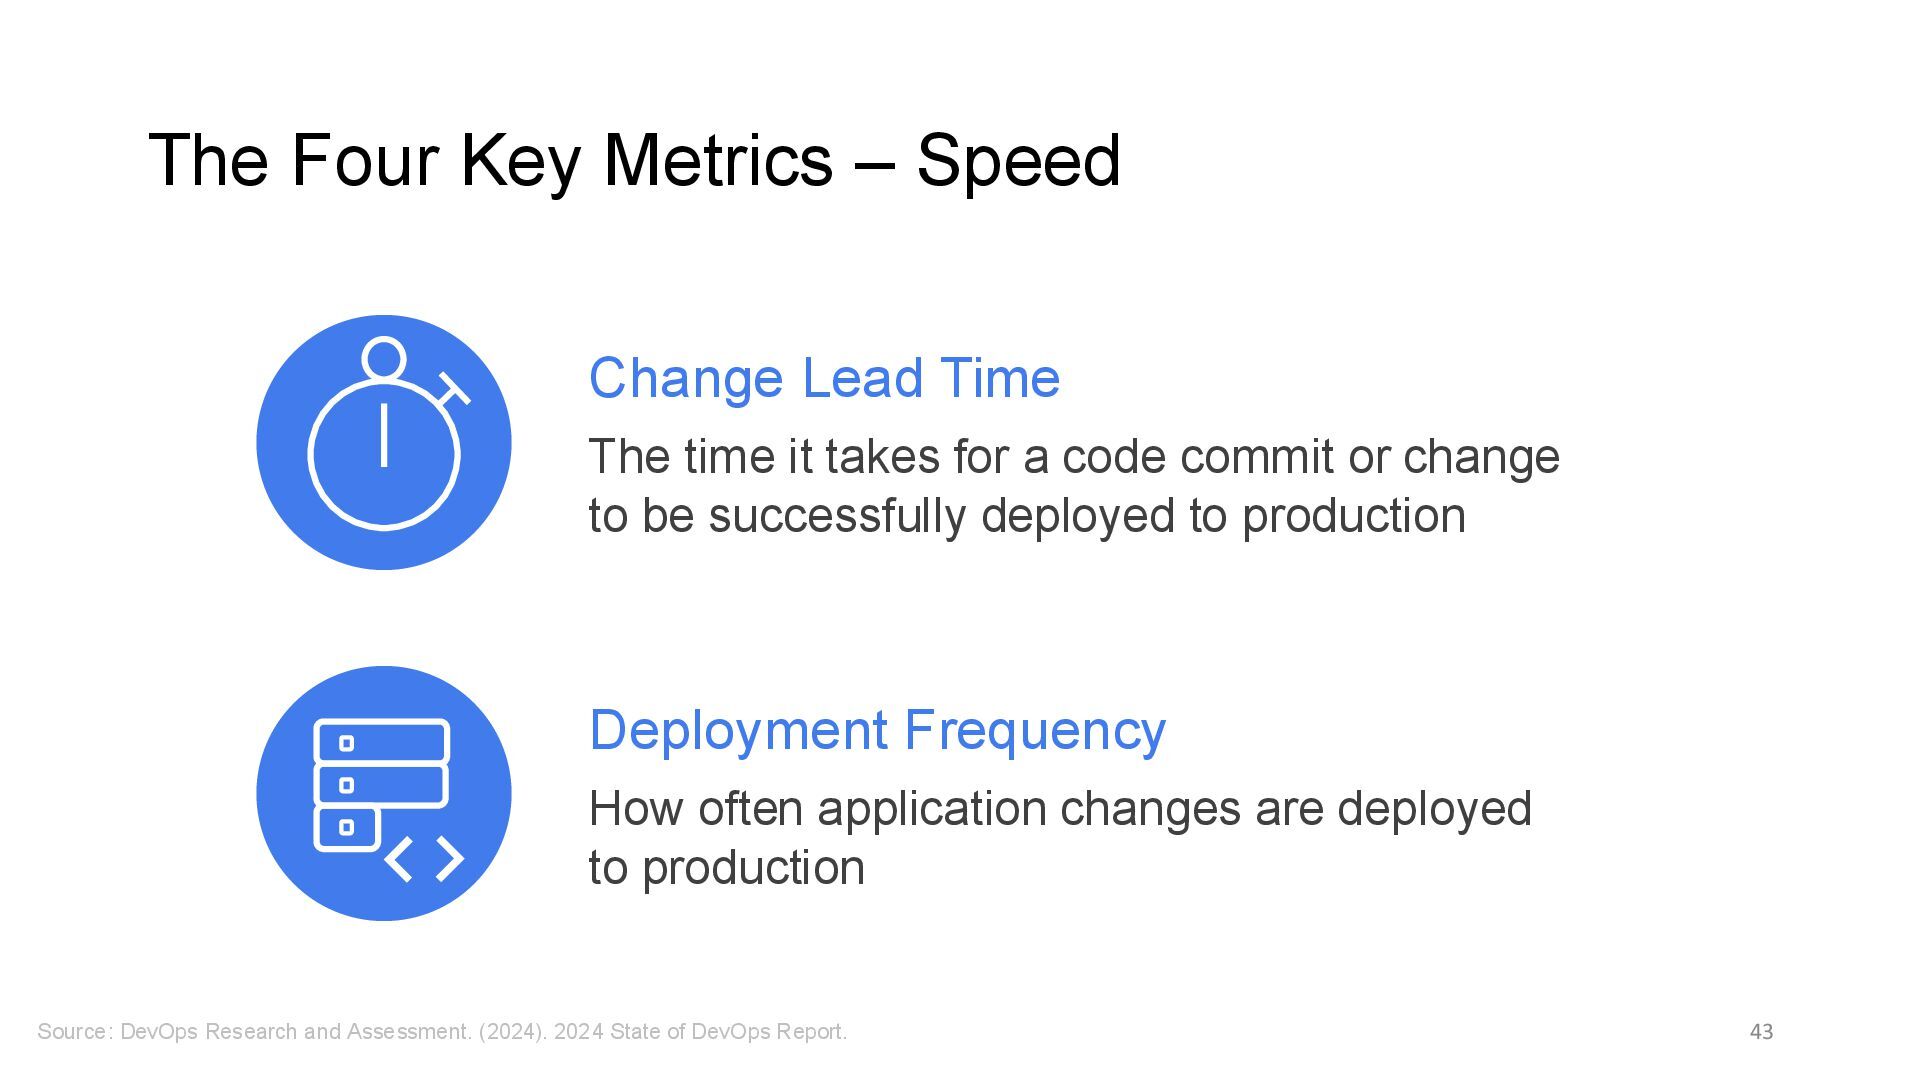
and Assessment. (2024). 2024 State of DevOps Report. Change Lead Time The time it takes for a code commit or change to be successfully deployed to production Deployment Frequency How often application changes are deployed to production
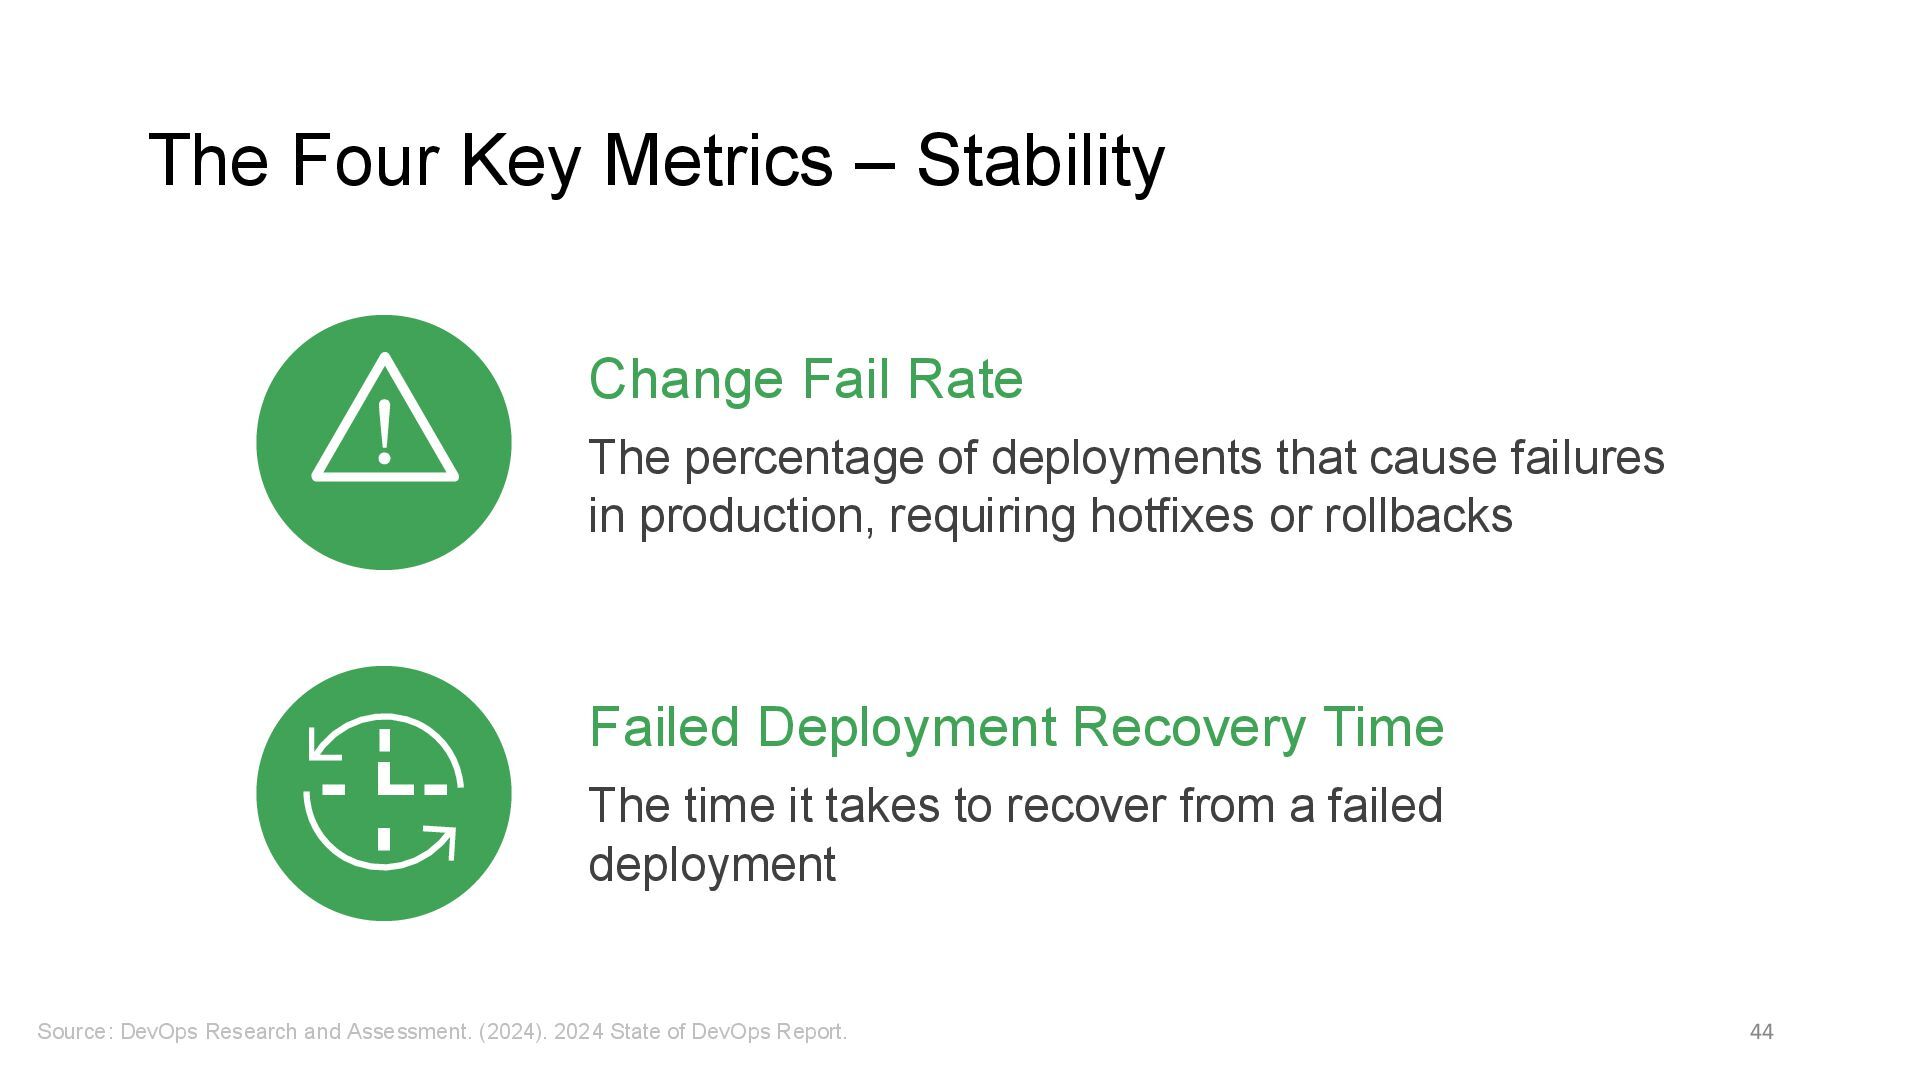
and Assessment. (2024). 2024 State of DevOps Report. Change Fail Rate The percentage of deployments that cause failures in production, requiring hotfixes or rollbacks ! Failed Deployment Recovery Time The time it takes to recover from a failed deployment
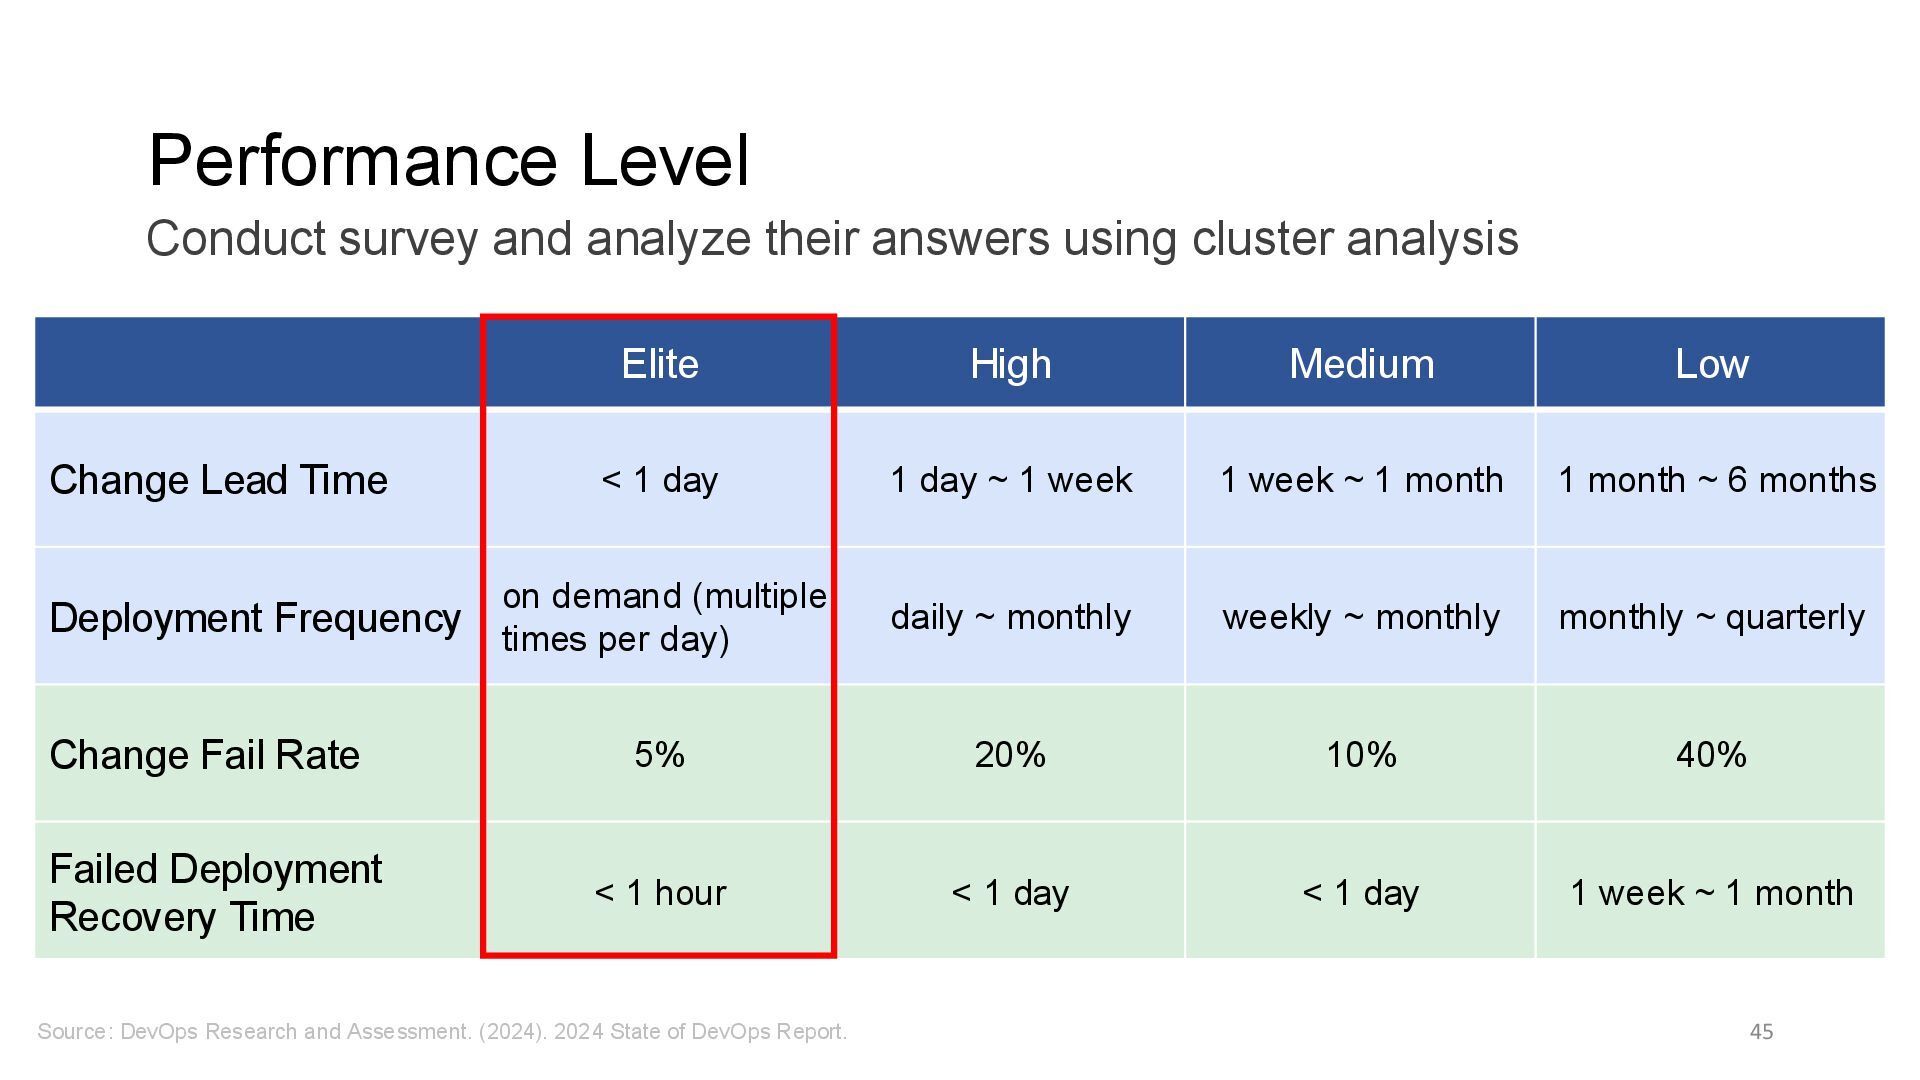
State of DevOps Report. Conduct survey and analyze their answers using cluster analysis Elite High Medium Low Change Lead Time < 1 day 1 day ~ 1 week 1 week ~ 1 month 1 month ~ 6 months Deployment Frequency on demand (multiple times per day) daily ~ monthly weekly ~ monthly monthly ~ quarterly Change Fail Rate 5% 20% 10% 40% Failed Deployment Recovery Time < 1 hour < 1 day < 1 day 1 week ~ 1 month
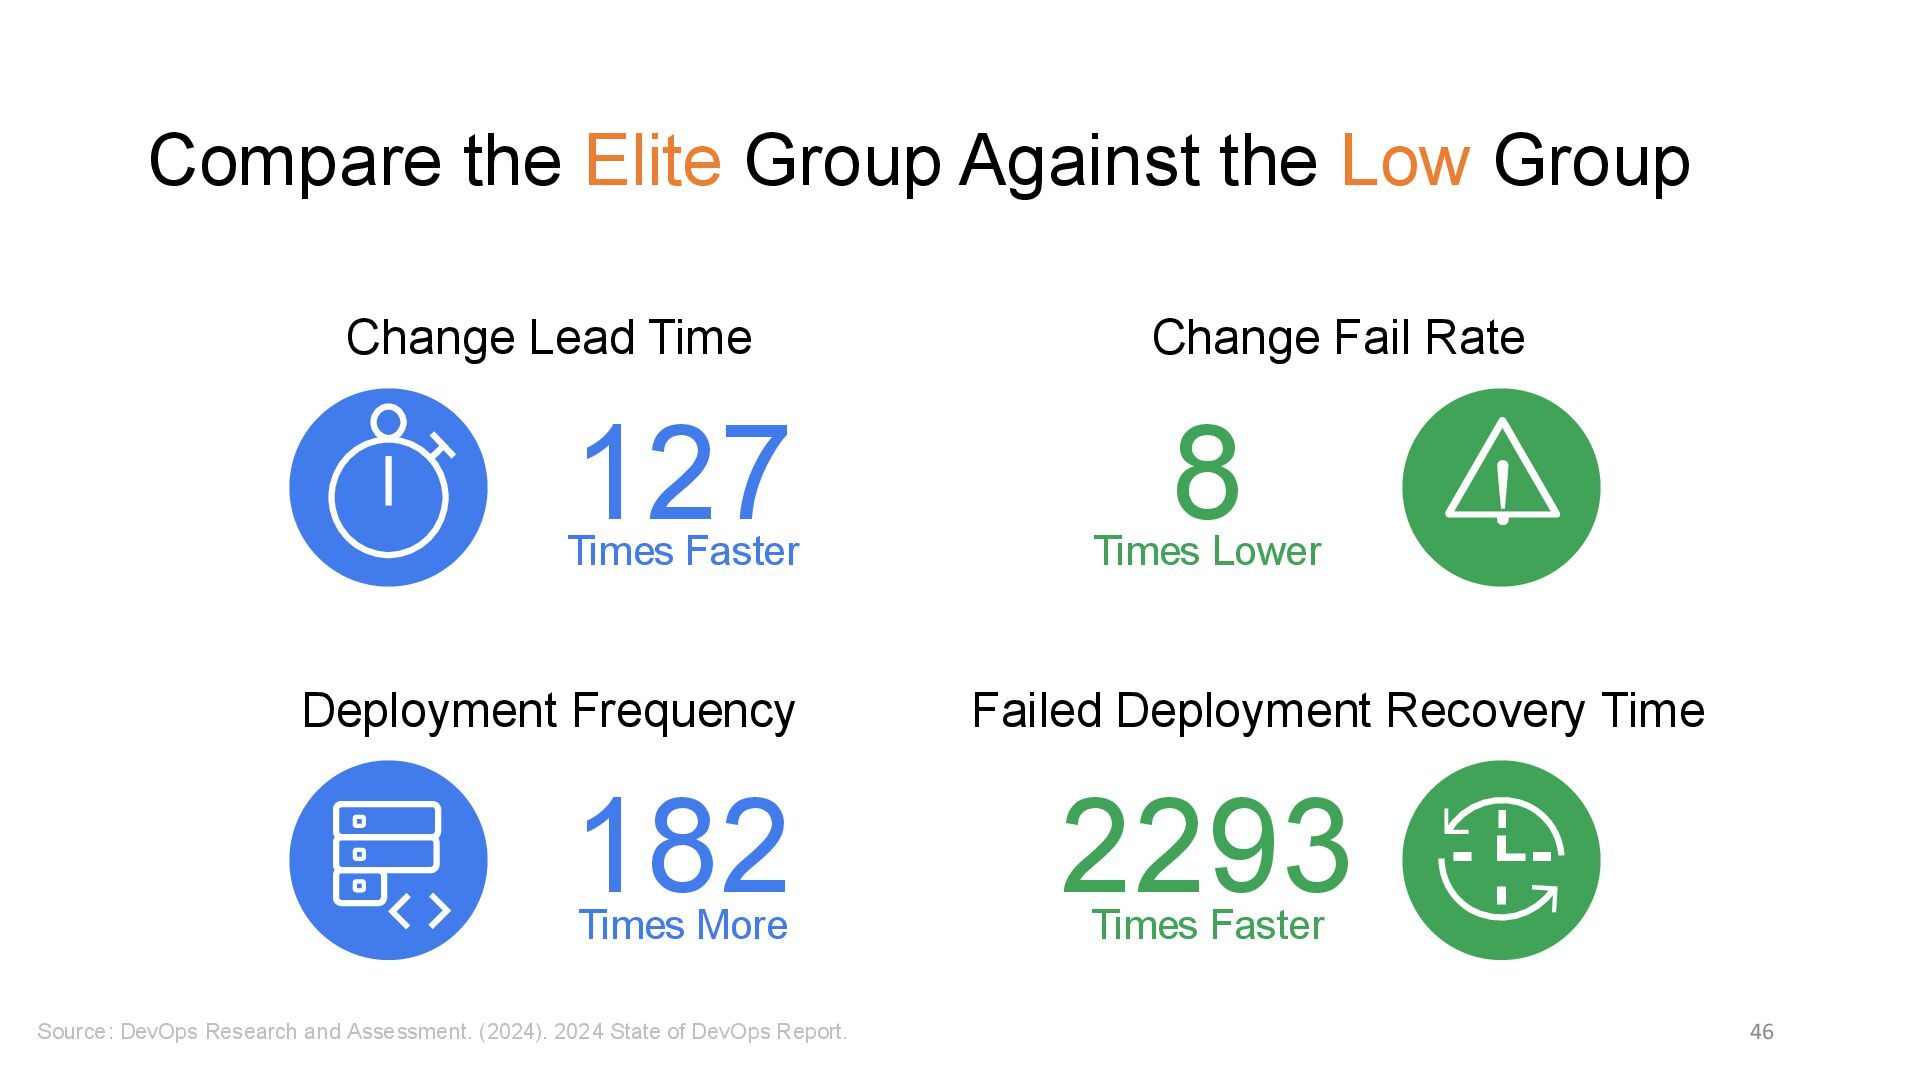
DevOps Research and Assessment. (2024). 2024 State of DevOps Report. Change Lead Time 127 Times Faster Change Fail Rate ! 8 Times Lower Deployment Frequency 182 Times More Failed Deployment Recovery Time 2293 Times Faster
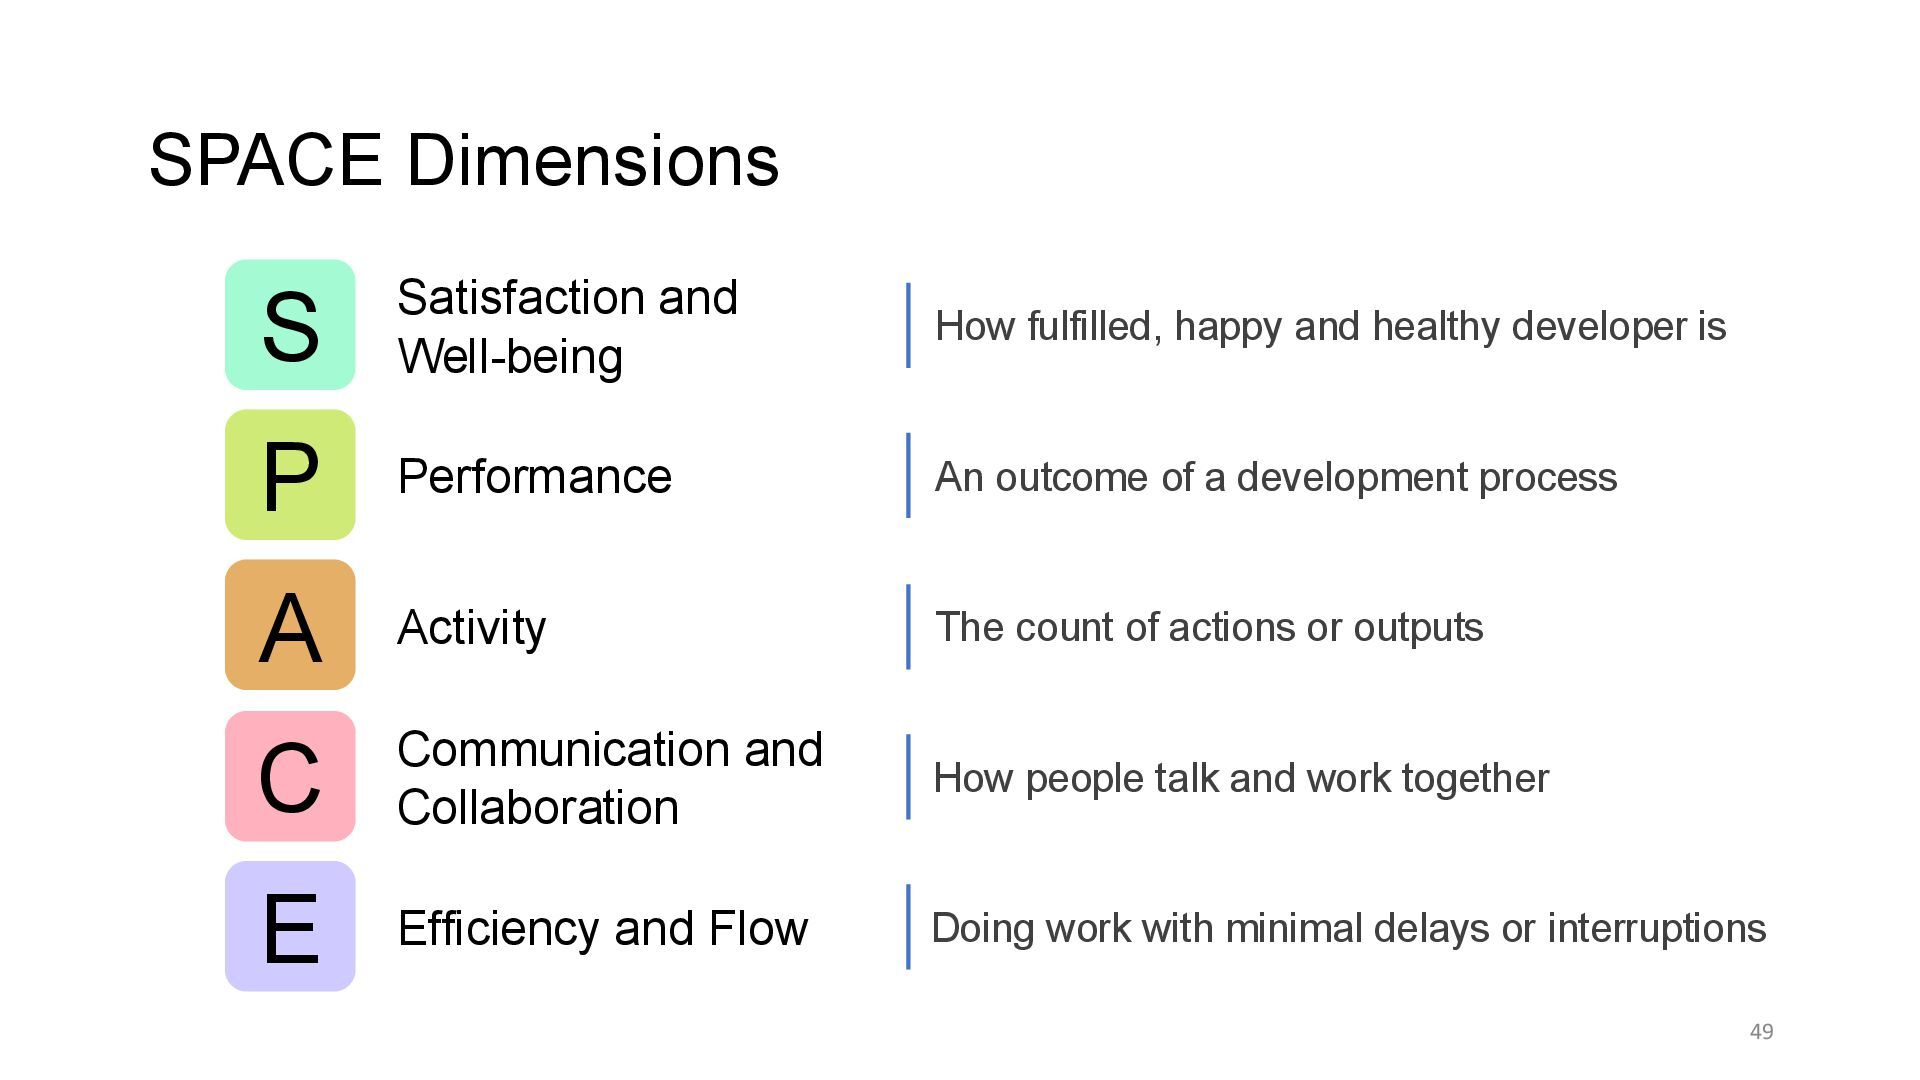
Well-being Performance Activity Communication and Collaboration Efficiency and Flow The count of actions or outputs An outcome of a development process How fulfilled, happy and healthy developer is How people talk and work together Doing work with minimal delays or interruptions
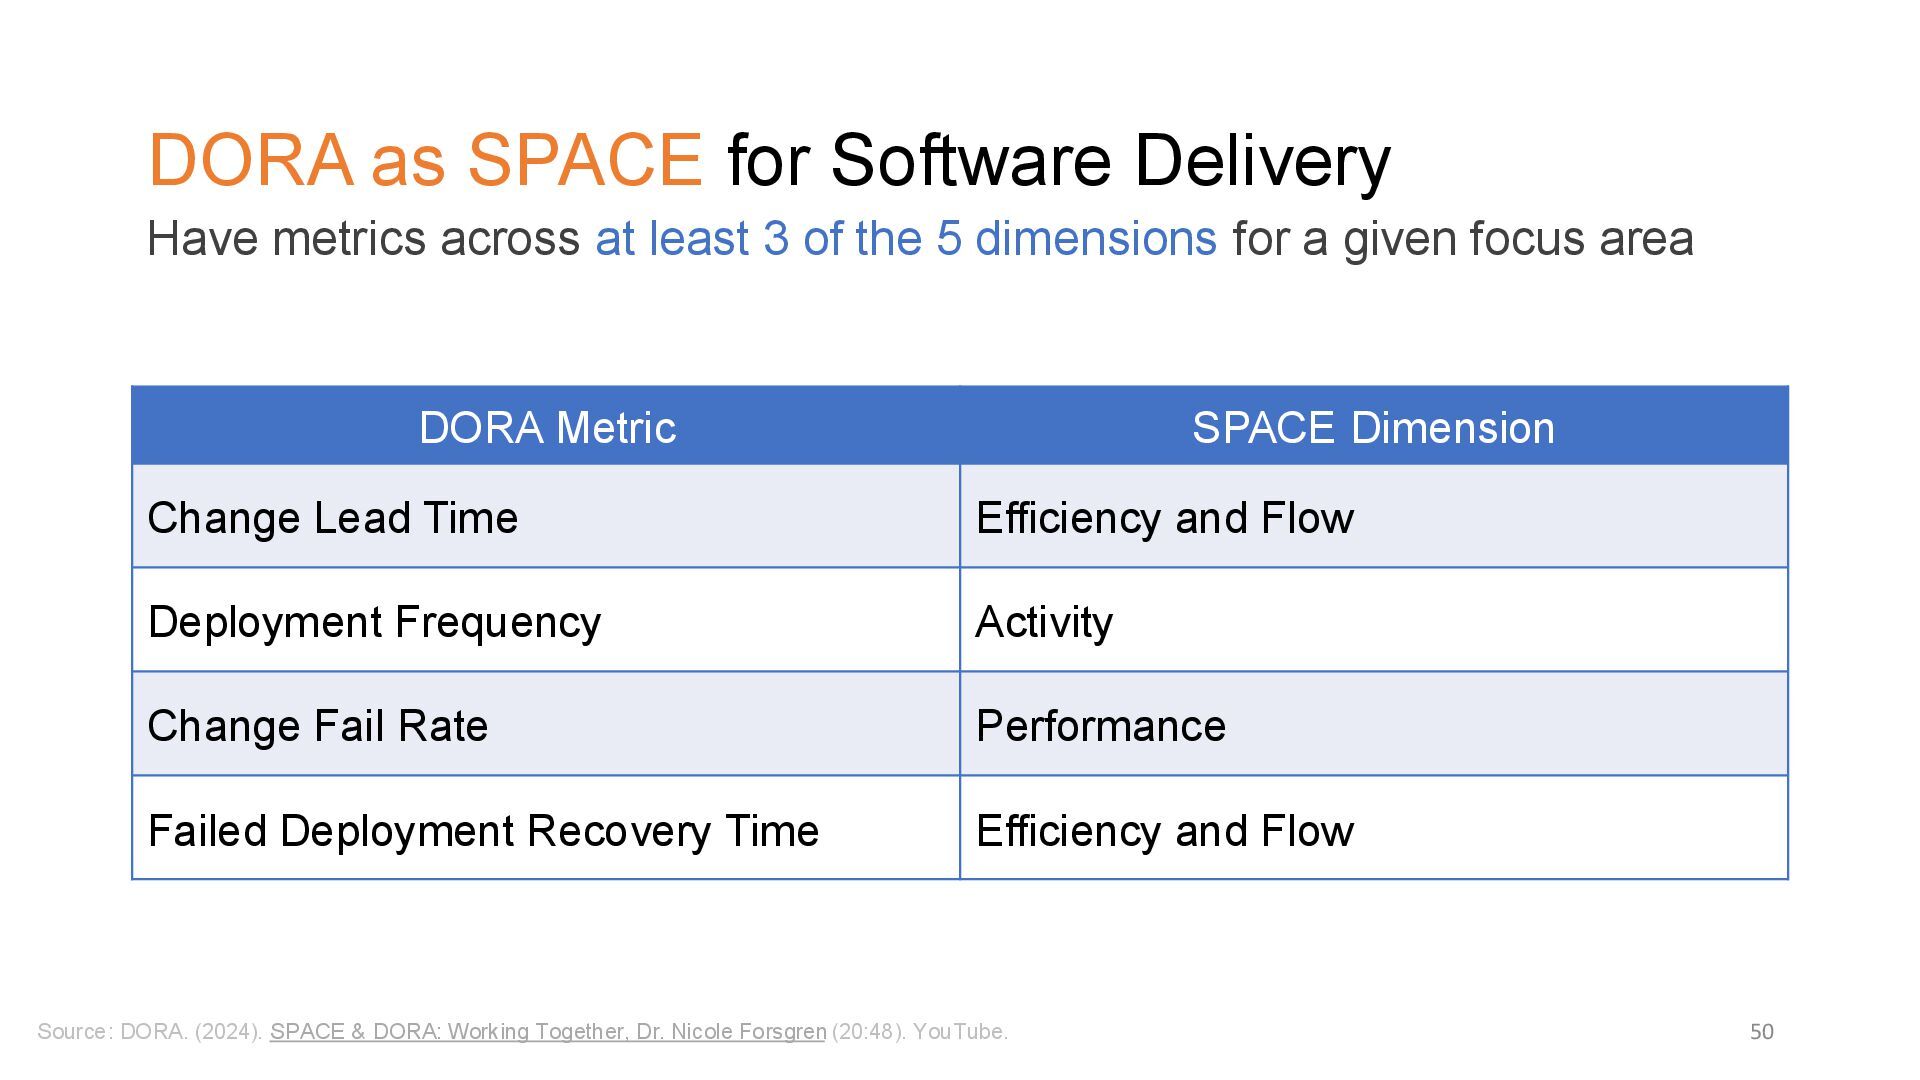
SPACE & DORA: Working Together, Dr. Nicole Forsgren (20:48). YouTube. Have metrics across at least 3 of the 5 dimensions for a given focus area DORA Metric SPACE Dimension Change Lead Time Efficiency and Flow Deployment Frequency Activity Change Fail Rate Performance Failed Deployment Recovery Time Efficiency and Flow
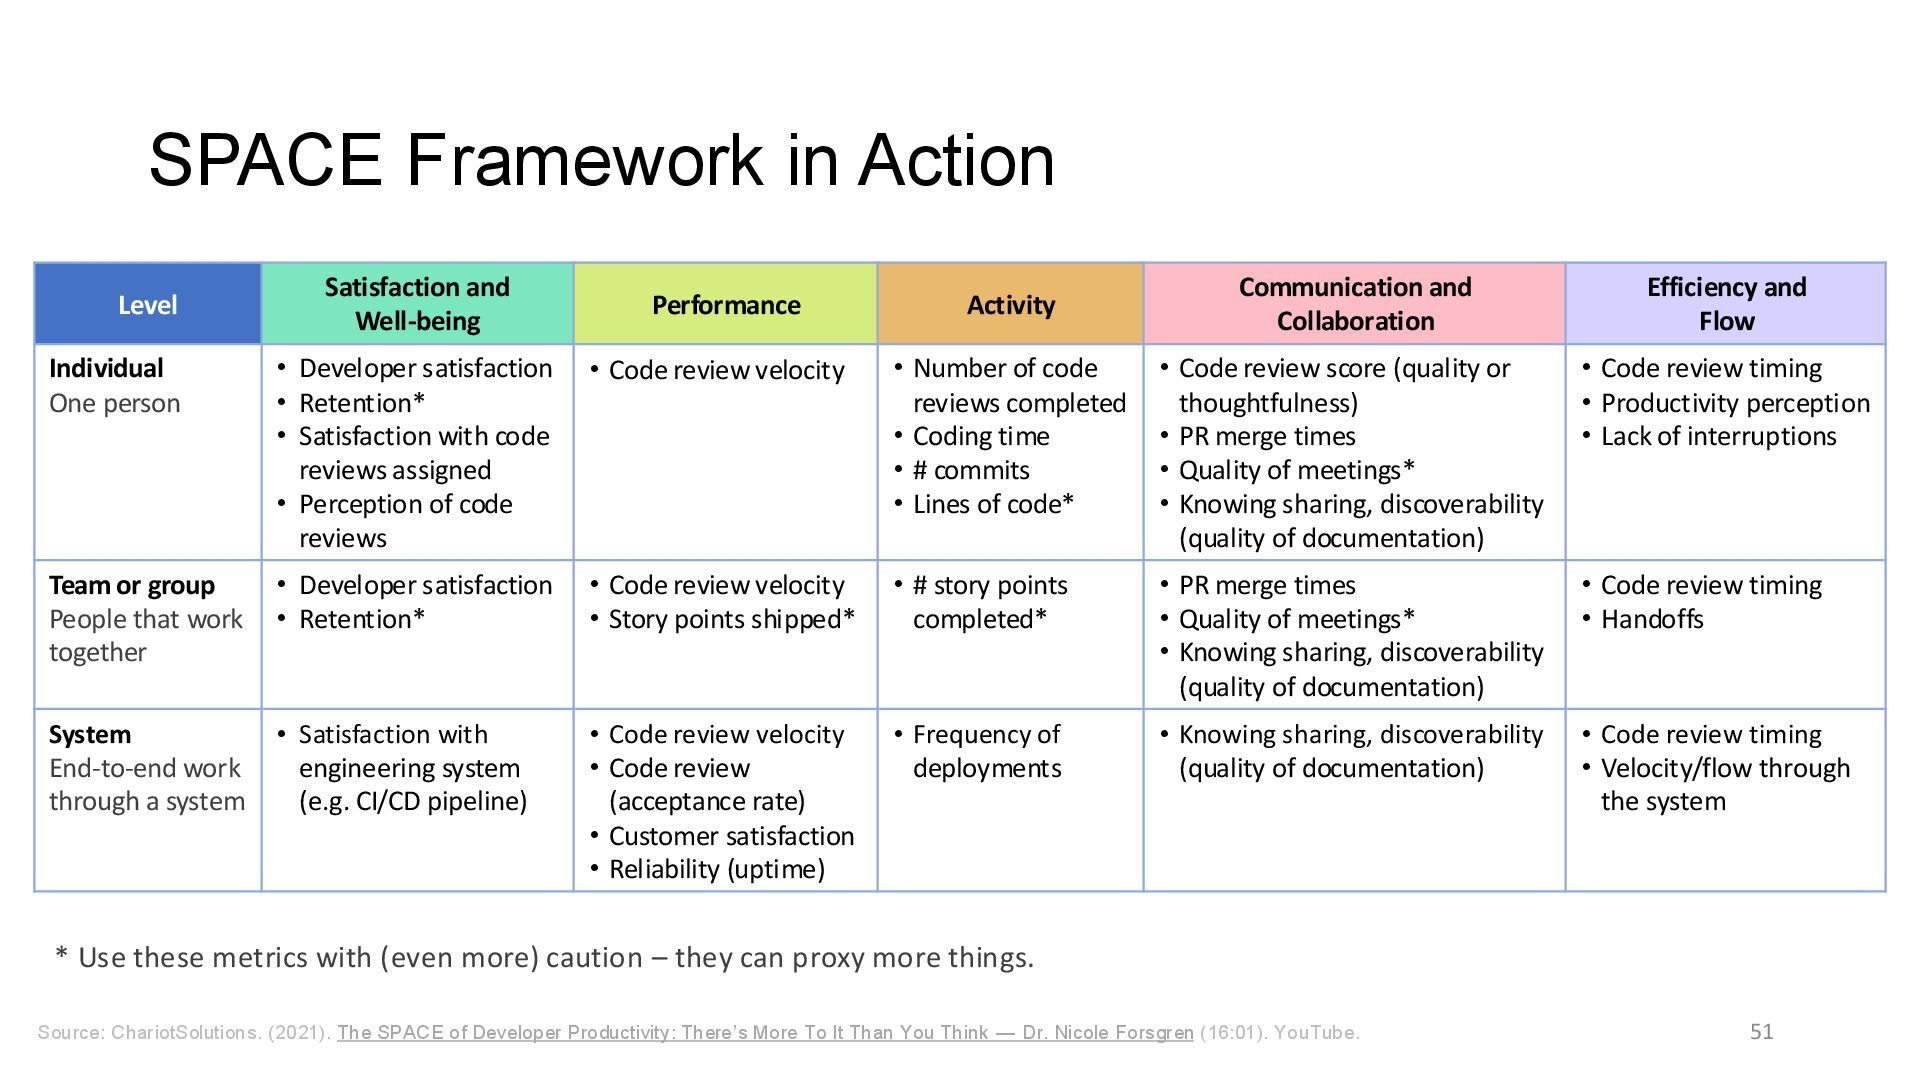
of Developer Productivity: There’s More To It Than You Think — Dr. Nicole Forsgren (16:01). YouTube. Level Satisfaction and Well-being Performance Activity Communication and Collaboration Efficiency and Flow Individual One person • Developer satisfaction • Retention* • Satisfaction with code reviews assigned • Perception of code reviews • Code review velocity • Number of code reviews completed • Coding time • # commits • Lines of code* • Code review score (quality or thoughtfulness) • PR merge times • Quality of meetings* • Knowing sharing, discoverability (quality of documentation) • Code review timing • Productivity perception • Lack of interruptions Team or group People that work together • Developer satisfaction • Retention* • Code review velocity • Story points shipped* • # story points completed* • PR merge times • Quality of meetings* • Knowing sharing, discoverability (quality of documentation) • Code review timing • Handoffs System End-to-end work through a system • Satisfaction with engineering system (e.g. CI/CD pipeline) • Code review velocity • Code review (acceptance rate) • Customer satisfaction • Reliability (uptime) • Frequency of deployments • Knowing sharing, discoverability (quality of documentation) • Code review timing • Velocity/flow through the system * Use these metrics with (even more) caution – they can proxy more things.
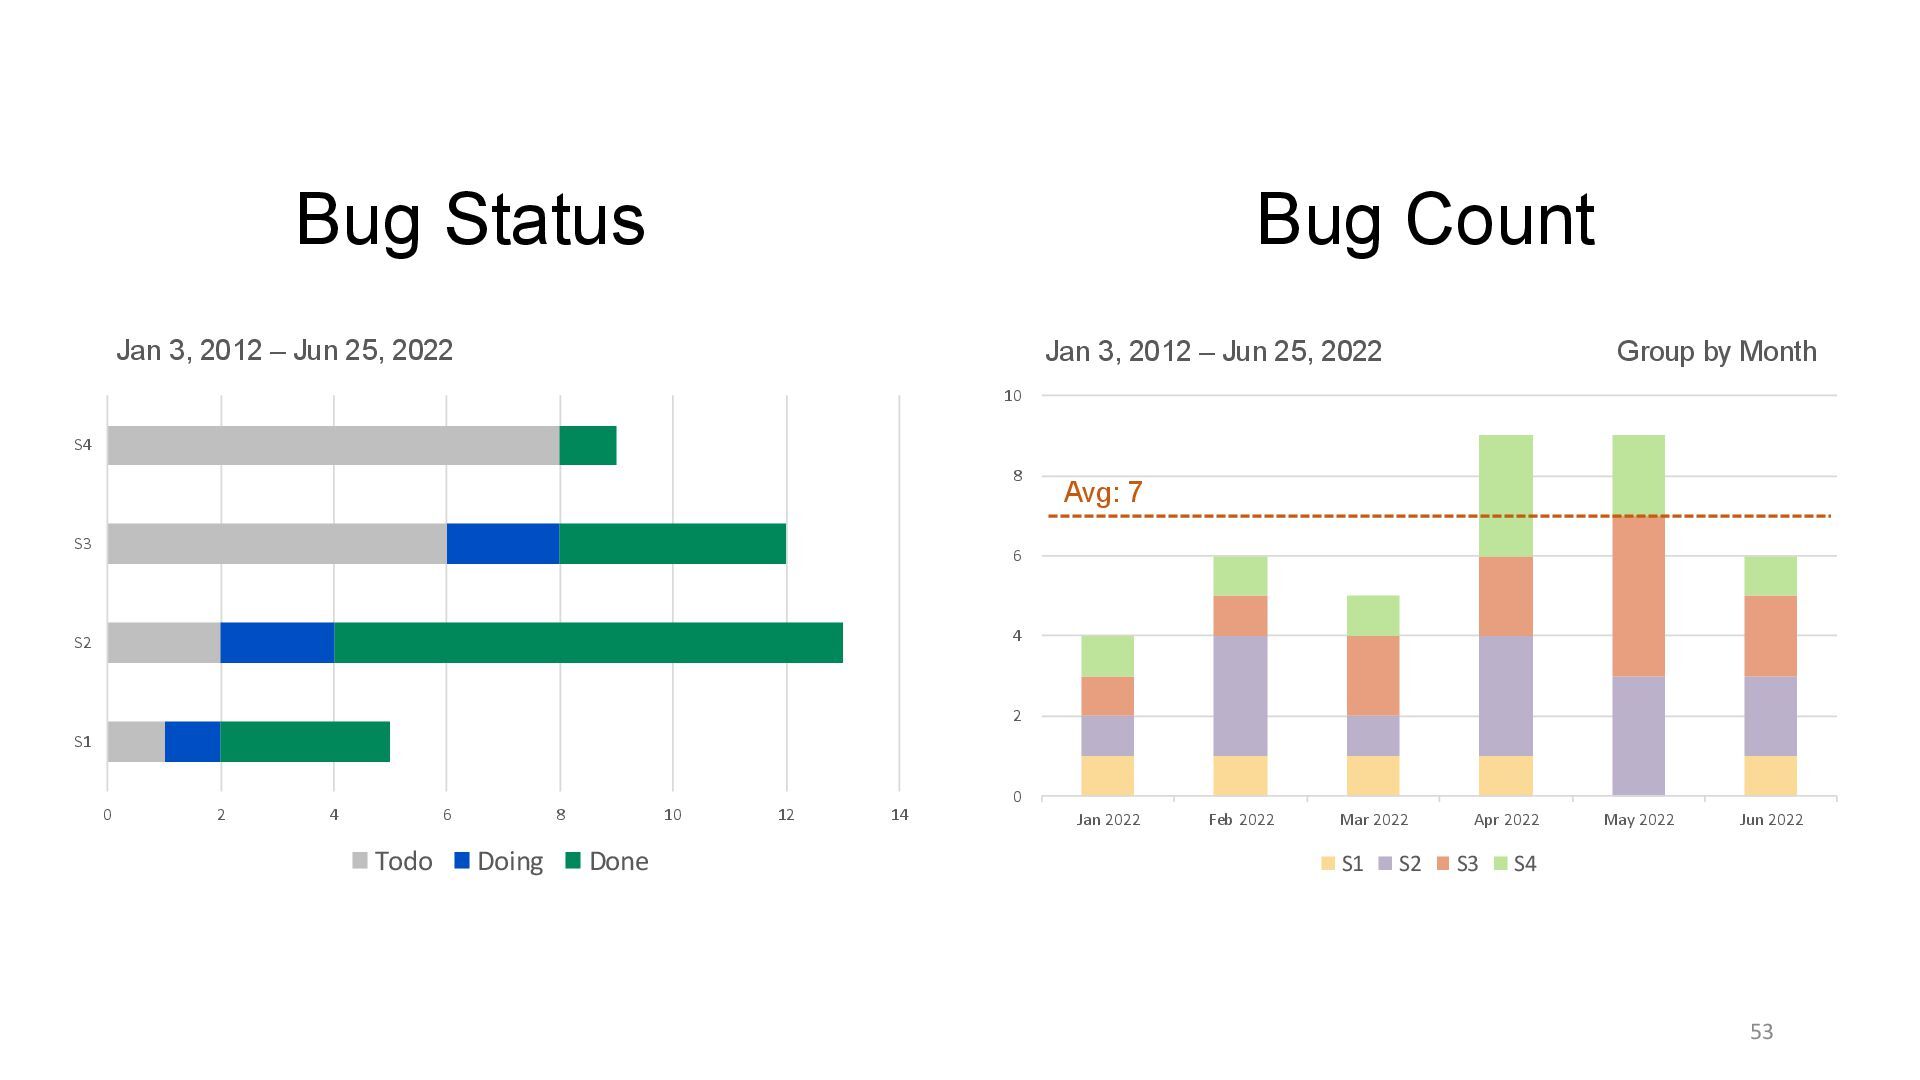
2022 Mar 2022 Apr 2022 May 2022 Jun 2022 S1 S2 S3 S4 Group by Month Jan 3, 2012 – Jun 25, 2022 Avg: 7 Bug Count 0 2 4 6 8 10 12 14 S1 S2 S3 S4 Todo Doing Done Bug Status Jan 3, 2012 – Jun 25, 2022
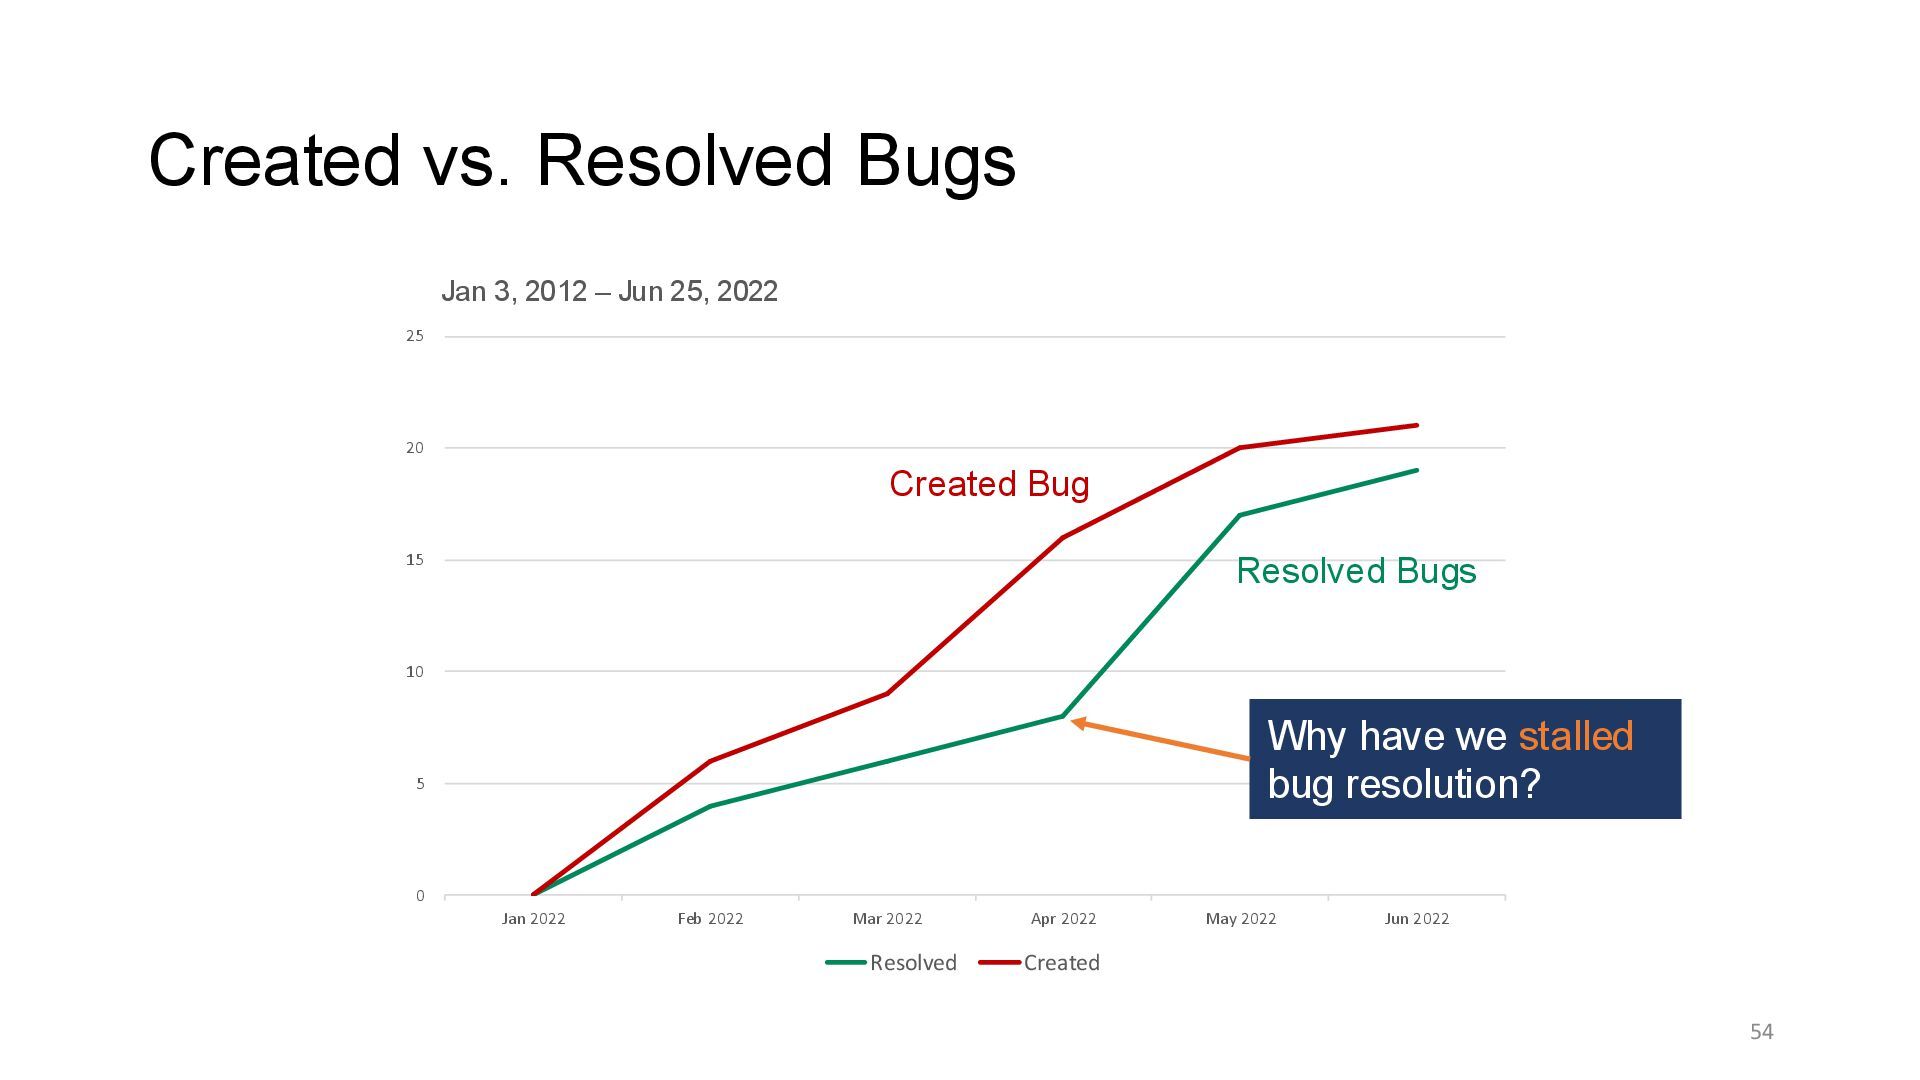
25 Jan 2022 Feb 2022 Mar 2022 Apr 2022 May 2022 Jun 2022 Resolved Created Jan 3, 2012 – Jun 25, 2022 Why have we stalled bug resolution? Created Bug Resolved Bugs