Upgrade to Pro — share decks privately, control downloads, hide ads and more …

data-seams-paa

 data-seams-paa

Christopher Prener

May 07, 2021
Tweet

More Decks by Christopher Prener

Other Decks in Education

Transcript

  1. Data Seams Tracking Local COVID-19 Trends and Disparities Christopher Prener,

    Ph.D. Assistant Professor of Sociology Saint Louis University
  2. Data Seams Tracking Local COVID-19 Trends and Disparities Christopher Prener,

    Ph.D. Assistant Professor of Sociology Saint Louis University
  3. Acknowledgments Saint Louis University Department of Computer Science Especially Chair

    Michael Goldwasser, Ph.D. and David Ferry, Ph.D. Capstone students Alvin Do, Metta Pham, and Eric Quach have contributed code this year. Washington University in STL Ariela Schachter, Ph.D.
  4. AGENDA 1. Preface 2. Situating Public Science 3. Tracking a

    Pandemic 4. Fundamental Causes & COVID-19 5. Where We Go From Here 1. PREFACE
  5. 2. SITUATING PUBLIC SCIENCE PUBLIC SCIENCE “presenting findings in an

    accessible manner” engaging in descriptive research that moves public discourse forward
  6. Similar fabric panels with jagged edges that we need to

    stitch together. Data Seams. Unsplash
  7. 3. TRACKING A PANDEMIC PULLING THE FABRIC TOGETHER New York

    Times COVID-19 Database (via GitHub) County Public Health Zip Code Data (via scrapers+API calls) Missouri COVID Tracking Data Sets State of Missouri and Illinois (via scrapers) CMS Nursing Home Data & HHS Hospitalization Data (via API) Census Bureau (via API)
  8. Sewing these seams requires an array of computational tools for

    scraping and standardizing various jurisdictions’ data, plus a communications strategy. Unsplash
  9. 4. FUNDAMENTAL CAUSES & COVID-19 FUNDAMENTAL CAUSE THEORY segregation (Williams

    & Collins 2001 and Sewell 2016) structural racism (Gee & Ford 2011) systematic racism (Phelan & Link 2015) racial capitalism (Pirtle 2020)
  10. 4. FUNDAMENTAL CAUSES & COVID-19 FOCUSING ON SOUTHERN CITIES Urban

    sociology has focused on a relatively small number of cities, and we often view them as a research site rather than an institution. We need to broaden literatures into the literal and figurative American South and produce deeper literatures on specific cities.
  11. A LABORATORY FOR RACISM INDIGENOUS EXPULSION THE MISSOURI COMPROMISE DRED

    SCOTT BLEEDING KANSAS Clockwise from Upper-left: Author’s Work; Smithsonian Institution; Wikipedia; Wikipedia
  12. A LABORATORY FOR RACISM DEED COVENANTS EXCLUSIONARY ZONING “SLUM” CLEARANCE

    REDLINING Clockwise from Upper-left: Erenow; Google; Wikipedia; Missouri Bar Association
  13. REDLINING A - “Best” B - “Still Desirable” C -

    “Definitely Declining” D - “Hazardous”
  14. REDLINING A - “Best” B - “Still Desirable” C -

    “Definitely Declining” D - “Hazardous” “In St. Louis, the white middle class suburb of Ladue was colored green because…it had ’not a single foreigner or negro.’” (Rothstein 2017) Rothstein, Richard. 2017. The Color of Law. New York, NY: W.W. Norton & Co.
  15. REDLINING A - “Best” B - “Still Desirable” C -

    “Definitely Declining” D - “Hazardous” Rothstein, Richard. 2017. The Color of Law. New York, NY: W.W. Norton & Co. “Lincoln Terrace was colored red because ‘it had little or no value today…due to the colored element now controlling the district’” (Rothstein 2017)
  16. 4. FUNDAMENTAL CAUSES & COVID-19 MEASURING SEGREGATION The Index of

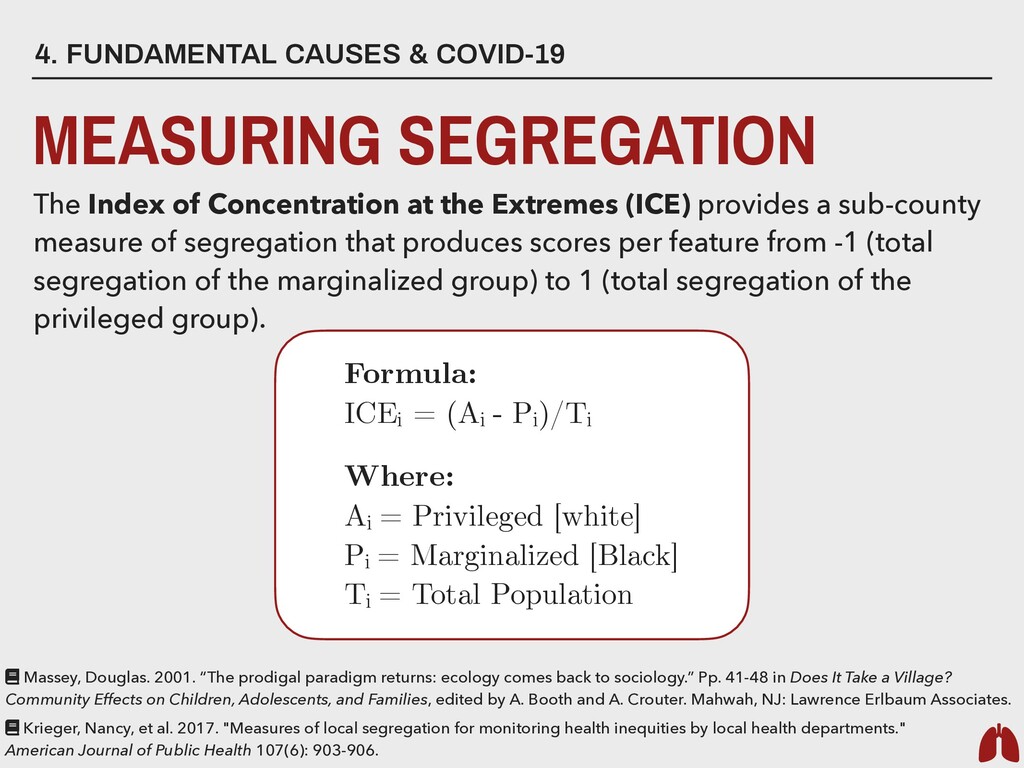
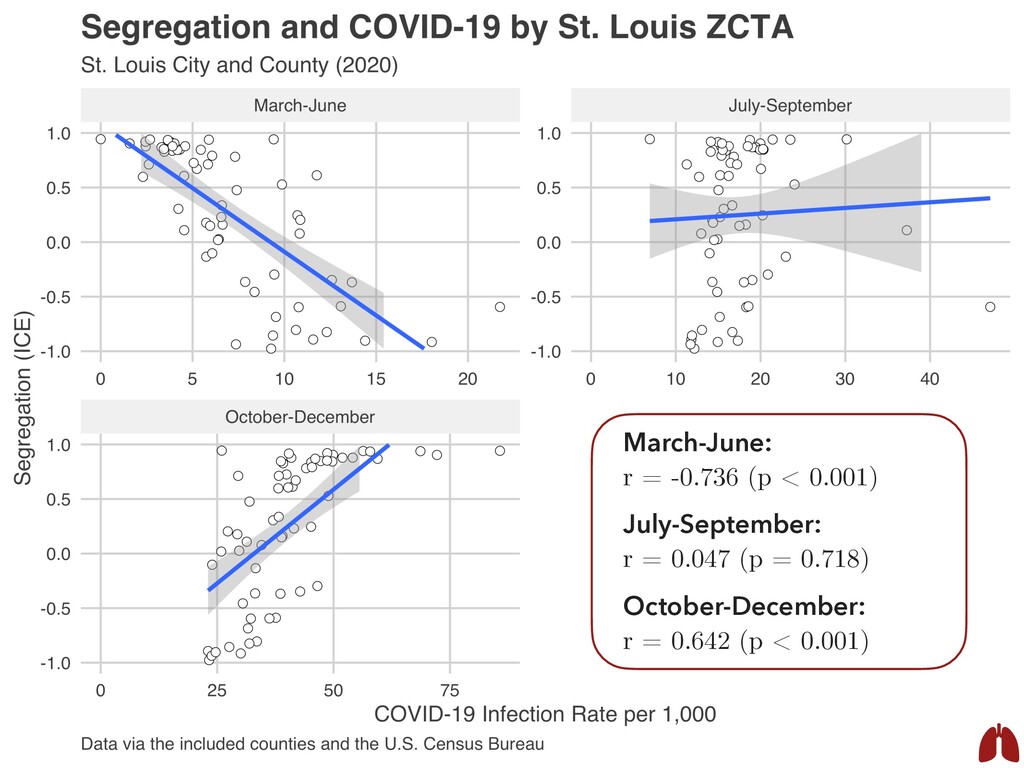
    Concentration at the Extremes (ICE) provides a sub-county measure of segregation that produces scores per feature from -1 (total segregation of the marginalized group) to 1 (total segregation of the privileged group). Formula: ICEi = (Ai - Pi )/Ti Where: Ai = Privileged [white] Pi = Marginalized [Black] Ti = Total Population Massey, Douglas. 2001. “The prodigal paradigm returns: ecology comes back to sociology.” Pp. 41-48 in Does It Take a Village? Community Effects on Children, Adolescents, and Families, edited by A. Booth and A. Crouter. Mahwah, NJ: Lawrence Erlbaum Associates. Krieger, Nancy, et al. 2017. "Measures of local segregation for monitoring health inequities by local health departments." American Journal of Public Health 107(6): 903-906.
  17. March-June: r = -0.736 (p < 0.001) July-September: r =

    0.047 (p = 0.718) October-December: r = 0.642 (p < 0.001)
  18. March-June: r = 0.644 (p < 0.001) July-September: r =

    -0.063 (p = 0.628) October-December: r = -0.633 (p < 0.001)
  19. 4. FUNDAMENTAL CAUSES & COVID-19 DATA ARE OFTEN POORLY VISUALIZED

    Basic rules, like using per capita rates, are often ignored.
  20. 5. WHERE WE GO FROM HERE PARTING THOUGHTS ▸ Research,

    data, and communication have not been the most pressing concerns for local public health agencies in MO. ▸ Public science and public sociology can help cut through the most challenging issues we face right now - COVID, racism, poverty. ▸ COVID-19 patterns that appear durable as cross-sections have important period effects that we need to interrogate. ▸ We need to focus on how power relations influence COVID risk. ▸ Iterating on analyses is not something we always get to do, but it is tremendously gratifying.
  21. Slides available via SpeakerDeck Follow on the web: speakerdeck.com/chrisprener/data- seams-paa

    Raw data, code available via GitHub github.com/slu-openGIS/ MO_HEALTH_Covid_Tracking [email protected] chris-prener.github.io LEARN MORE THANKS FOR COMING! @chrisprener Visualization code available via GitHub github.com/slu-openGIS/ covid_daily_viz slu-opengis.github.io/ covid_daily_viz/ chrisprener.substack.com