Upgrade to Pro — share decks privately, control downloads, hide ads and more …

Self-service dashboards vs guided web analytics...

Sponsored · Your Podcast. Everywhere. Effortlessly. Share. Educate. Inspire. Entertain. You do you. We'll handle the rest. →
Corina Burri
March 13, 2025
52

Self-service dashboards vs guided web analytics reports

Self-Service Dashboards vs Guided Web Analytics Reports 📊
Last week at @Analyticscamp ZĂźrich, Nic Glauser and I facilitated a discussion on the differences, pros & cons, and use cases of self-service dashboards vs guided reports.
What's That Again? 🤔
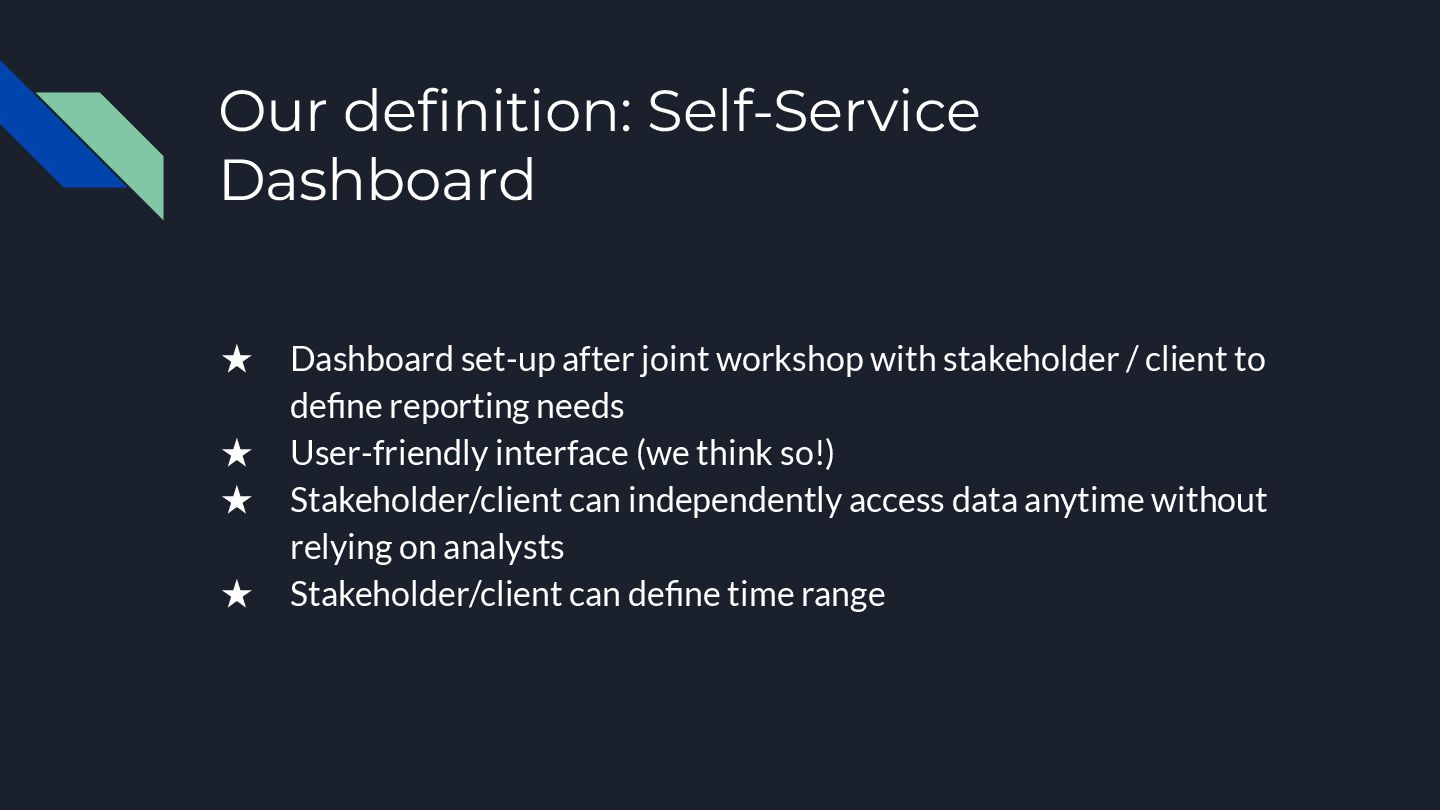
• Self-service dashboards provide a user-friendly interface that allows stakeholders to independently access data and make data-driven decisions without relying on analysts.
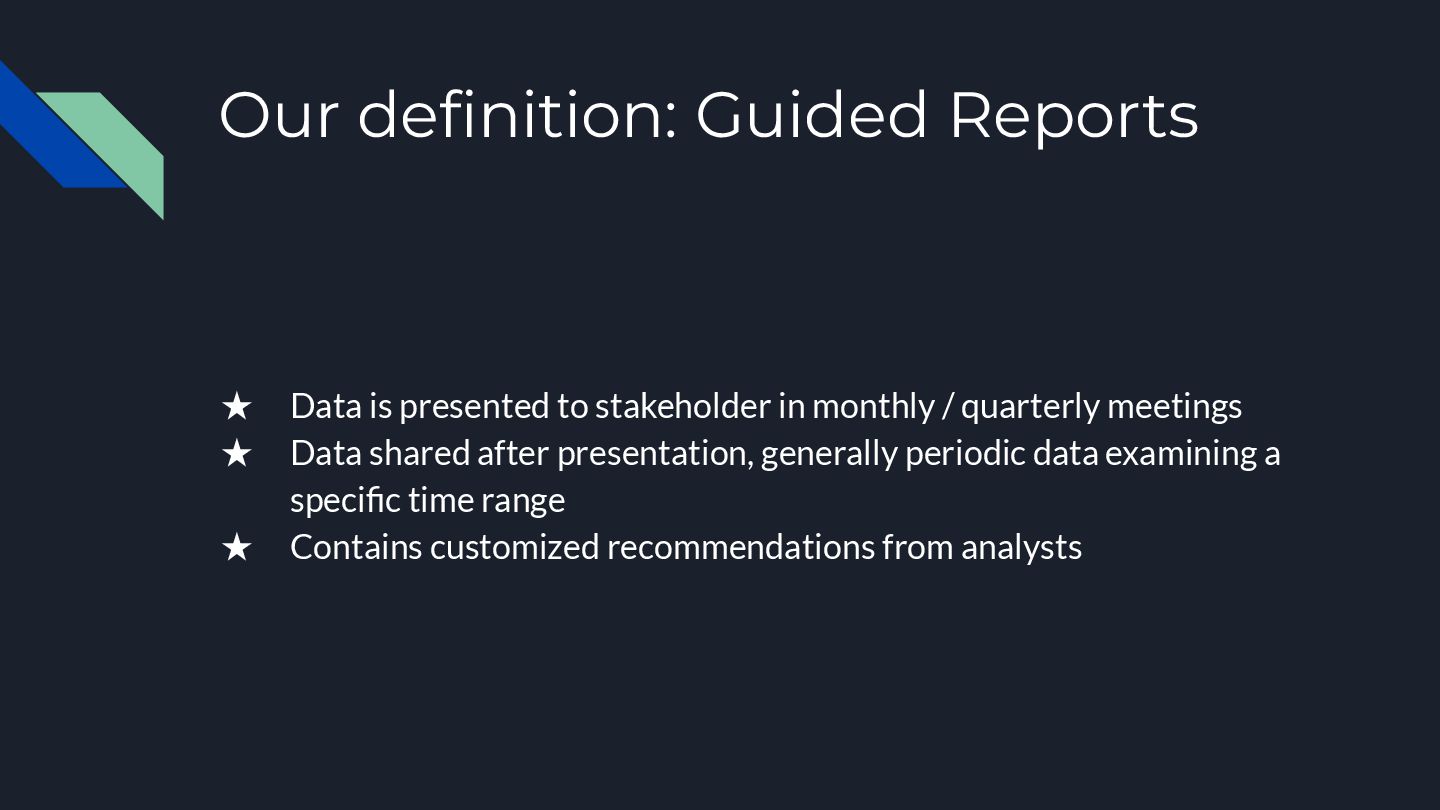
• Guided reports are periodic, analyst-curated reports presented in meetings, including tailored recommendations to support stakeholder decision-making.
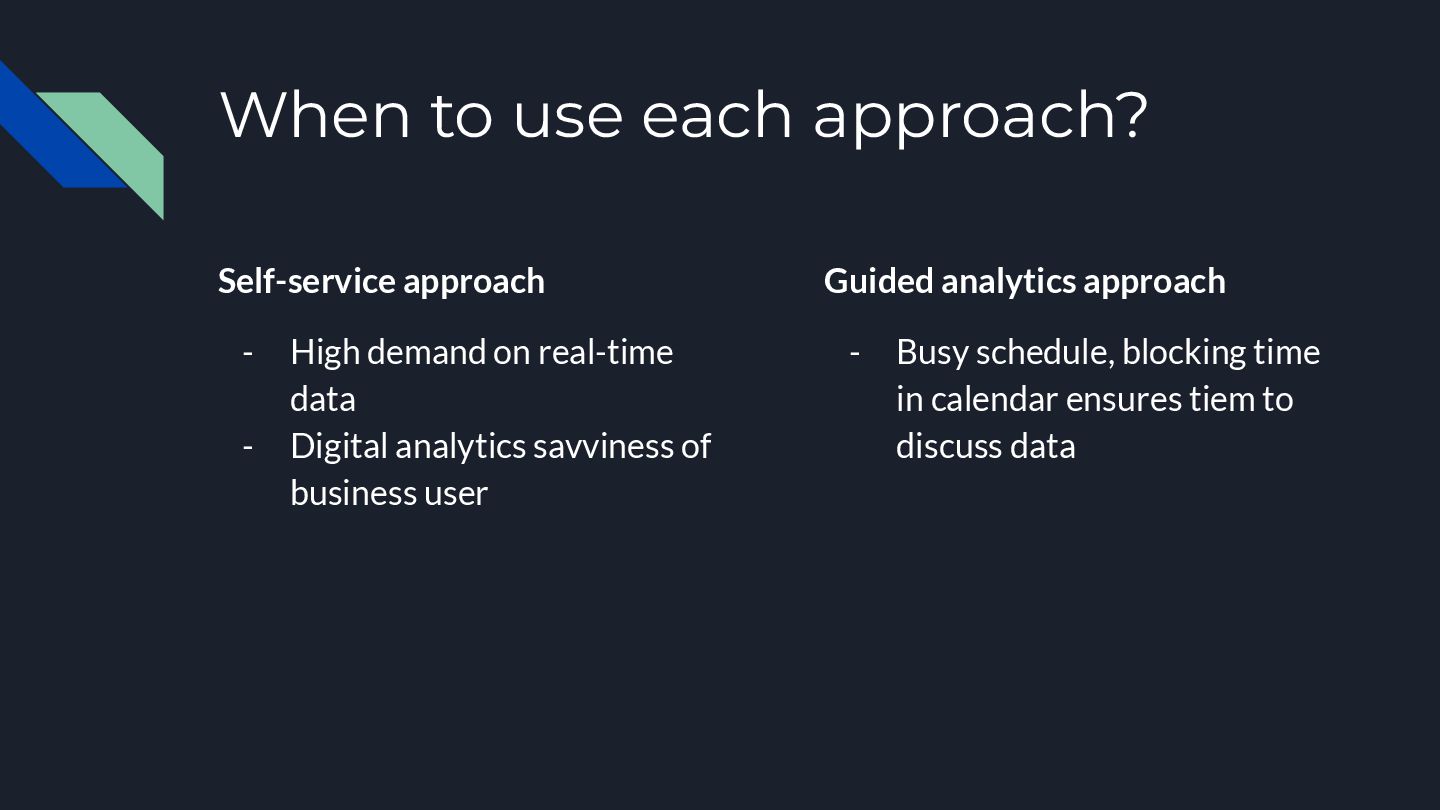
When to Use Which Approach? 🧐
• Self-service dashboards are ideal for data and digitally savvy users
• Guided analytics reports help structure discussions for stakeholders with busy schedules
Key Insights from the Discussion: 💡
• Align on internal KPI framework first
• Employee training goes a long way - not all users are data savvy, but it's a skill that can be acquired
• Ask for feedback! Some participants embedded a "rate the dashboard" function in their reports.

Corina Burri

March 13, 2025

Transcript

8 slides
  1. This is us. And why we choose the topic. Corina

    Burri Ex SEO & Web Analytics Lead Nic Glauser Co-founder flin marketing agency
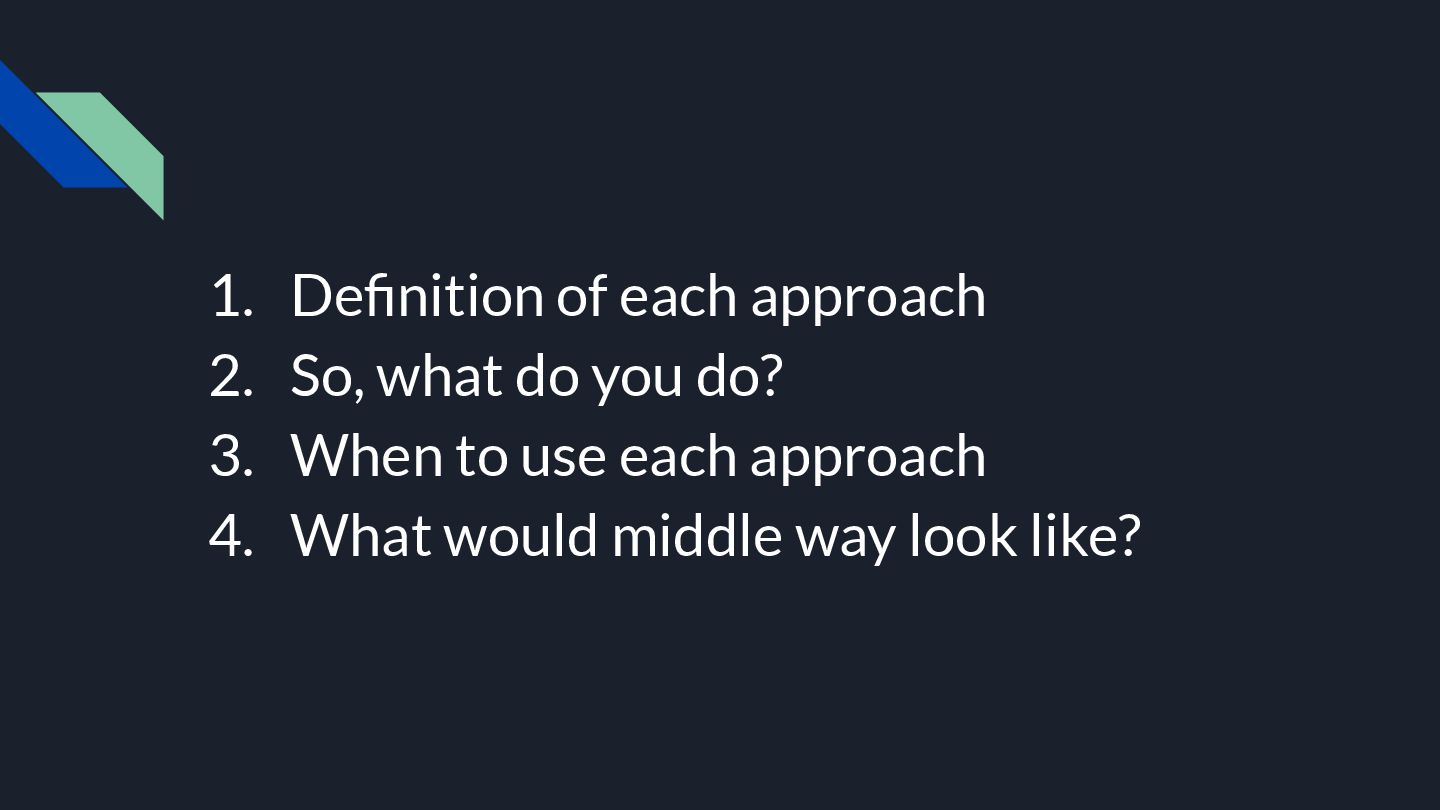
  2. 1. Denition of each approach 2. So, what do you

    do? 3. When to use each approach 4. What would middle way look like?
  3. Our definition: Self-Service Dashboard ★ Dashboard set-up after joint workshop

    with stakeholder / client to define reporting needs ★ User-friendly interface (we think so!) ★ Stakeholder/client can independently access data anytime without relying on analysts ★ Stakeholder/client can define time range
  4. Our definition: Guided Reports ★ Data is presented to stakeholder

    in monthly / quarterly meetings ★ Data shared after presentation, generally periodic data examining a specific time range ★ Contains customized recommendations from analysts
  5. When to use each approach? Self-service approach - High demand

    on real-time data - Digital analytics savviness of business user Guided analytics approach - Busy schedule, blocking time in calendar ensures tiem to discuss data
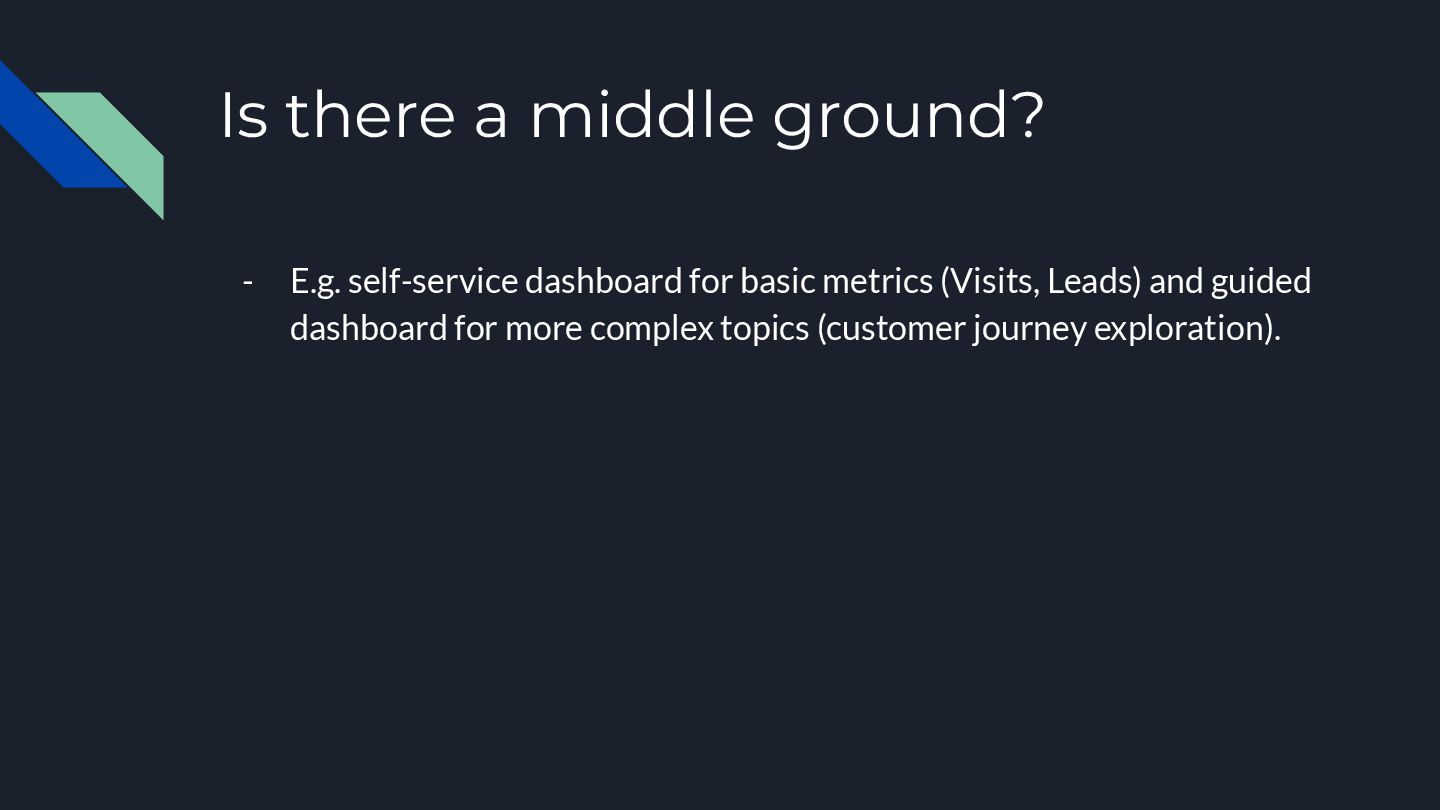
  6. Is there a middle ground? - E.g. self-service dashboard for

    basic metrics (Visits, Leads) and guided dashboard for more complex topics (customer journey exploration).