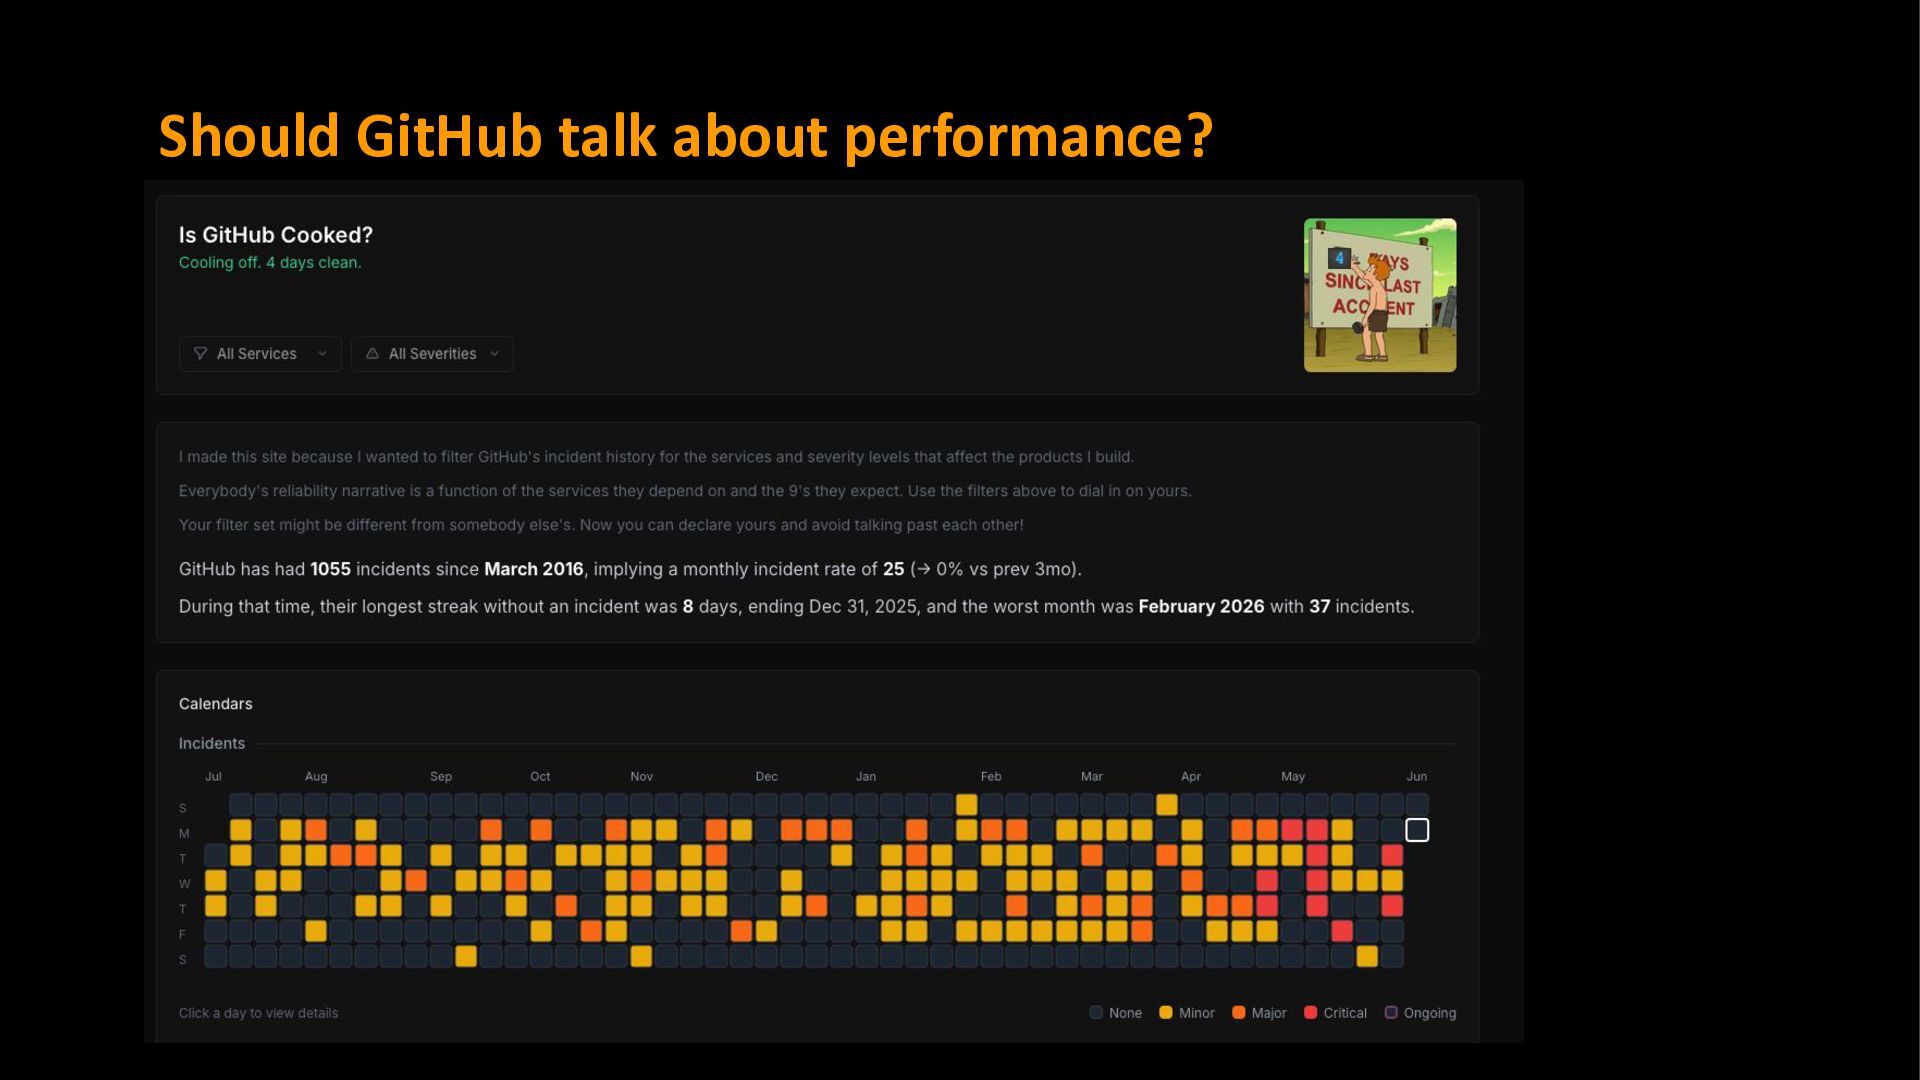
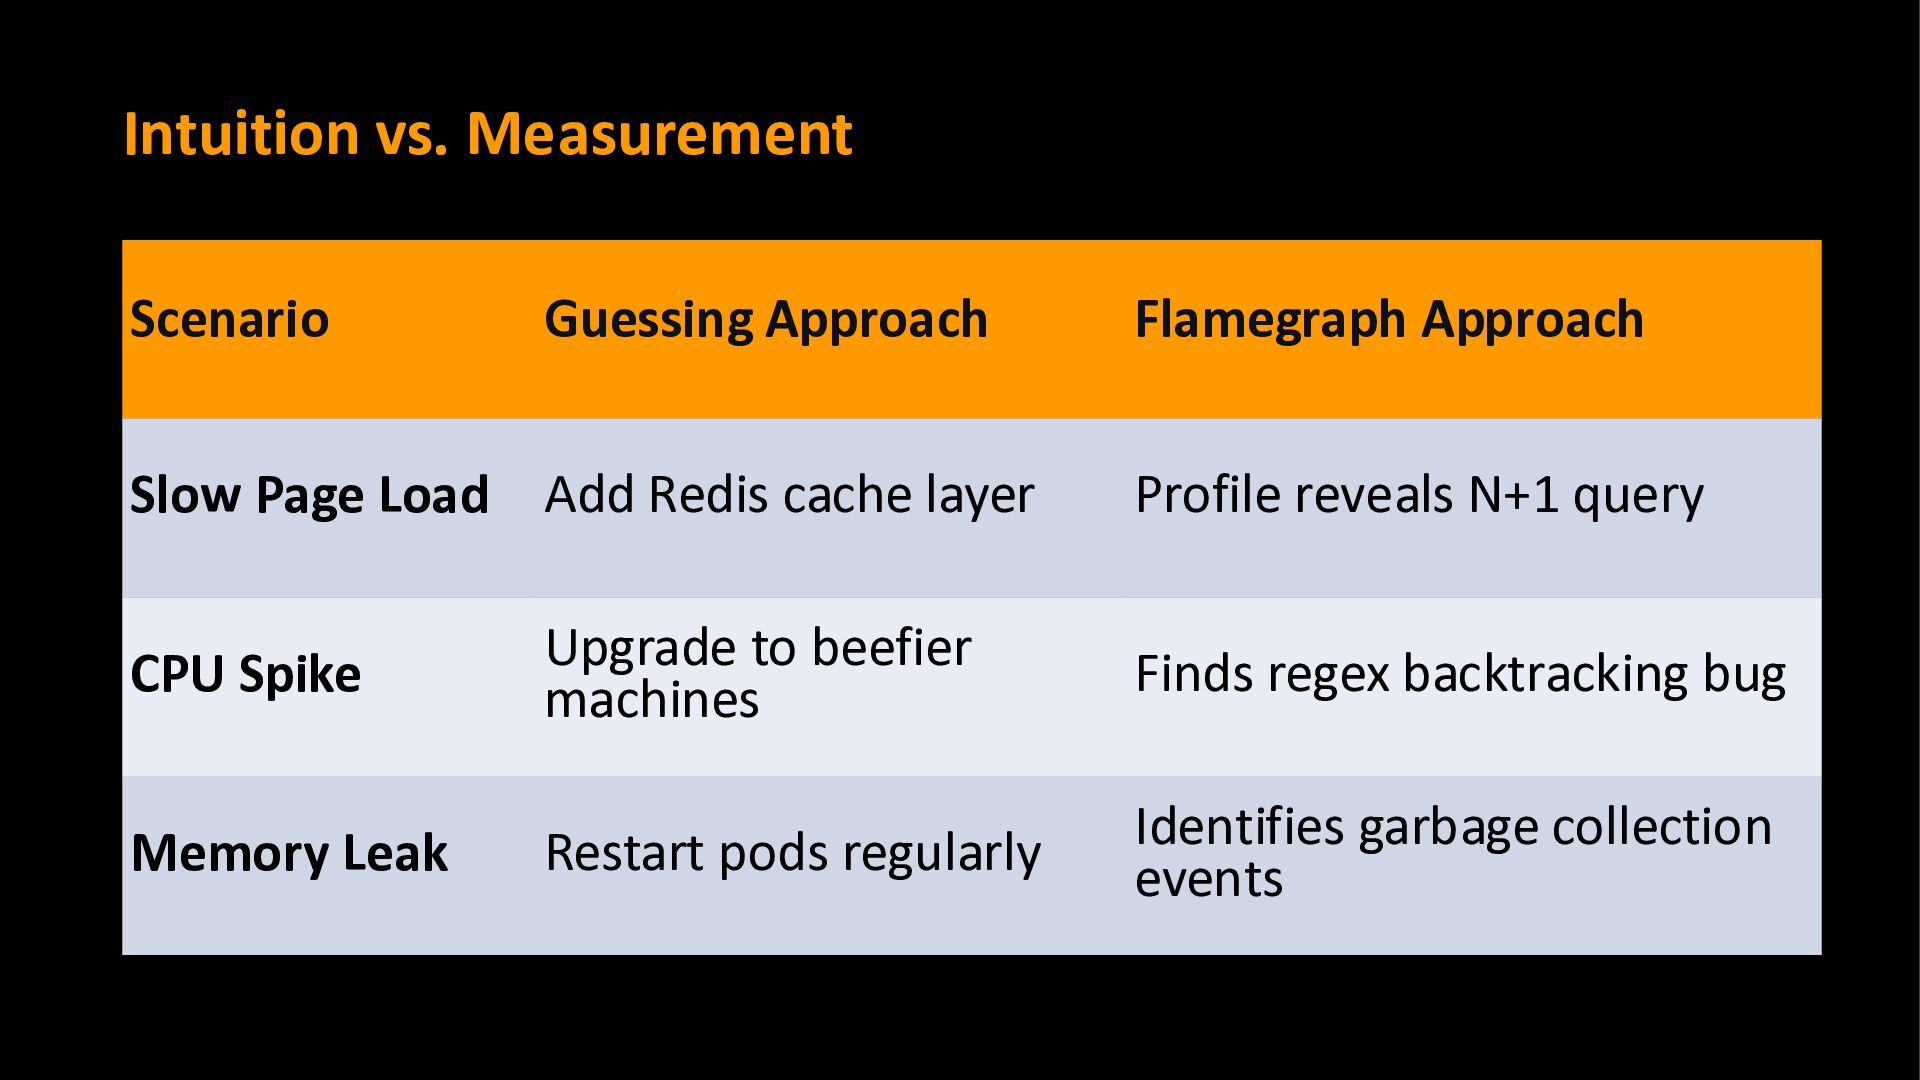
a guessing game. We know something is slow, but we rely on suspicions rather than evidence. "This is fine," we say, as latency spikes and users complain.
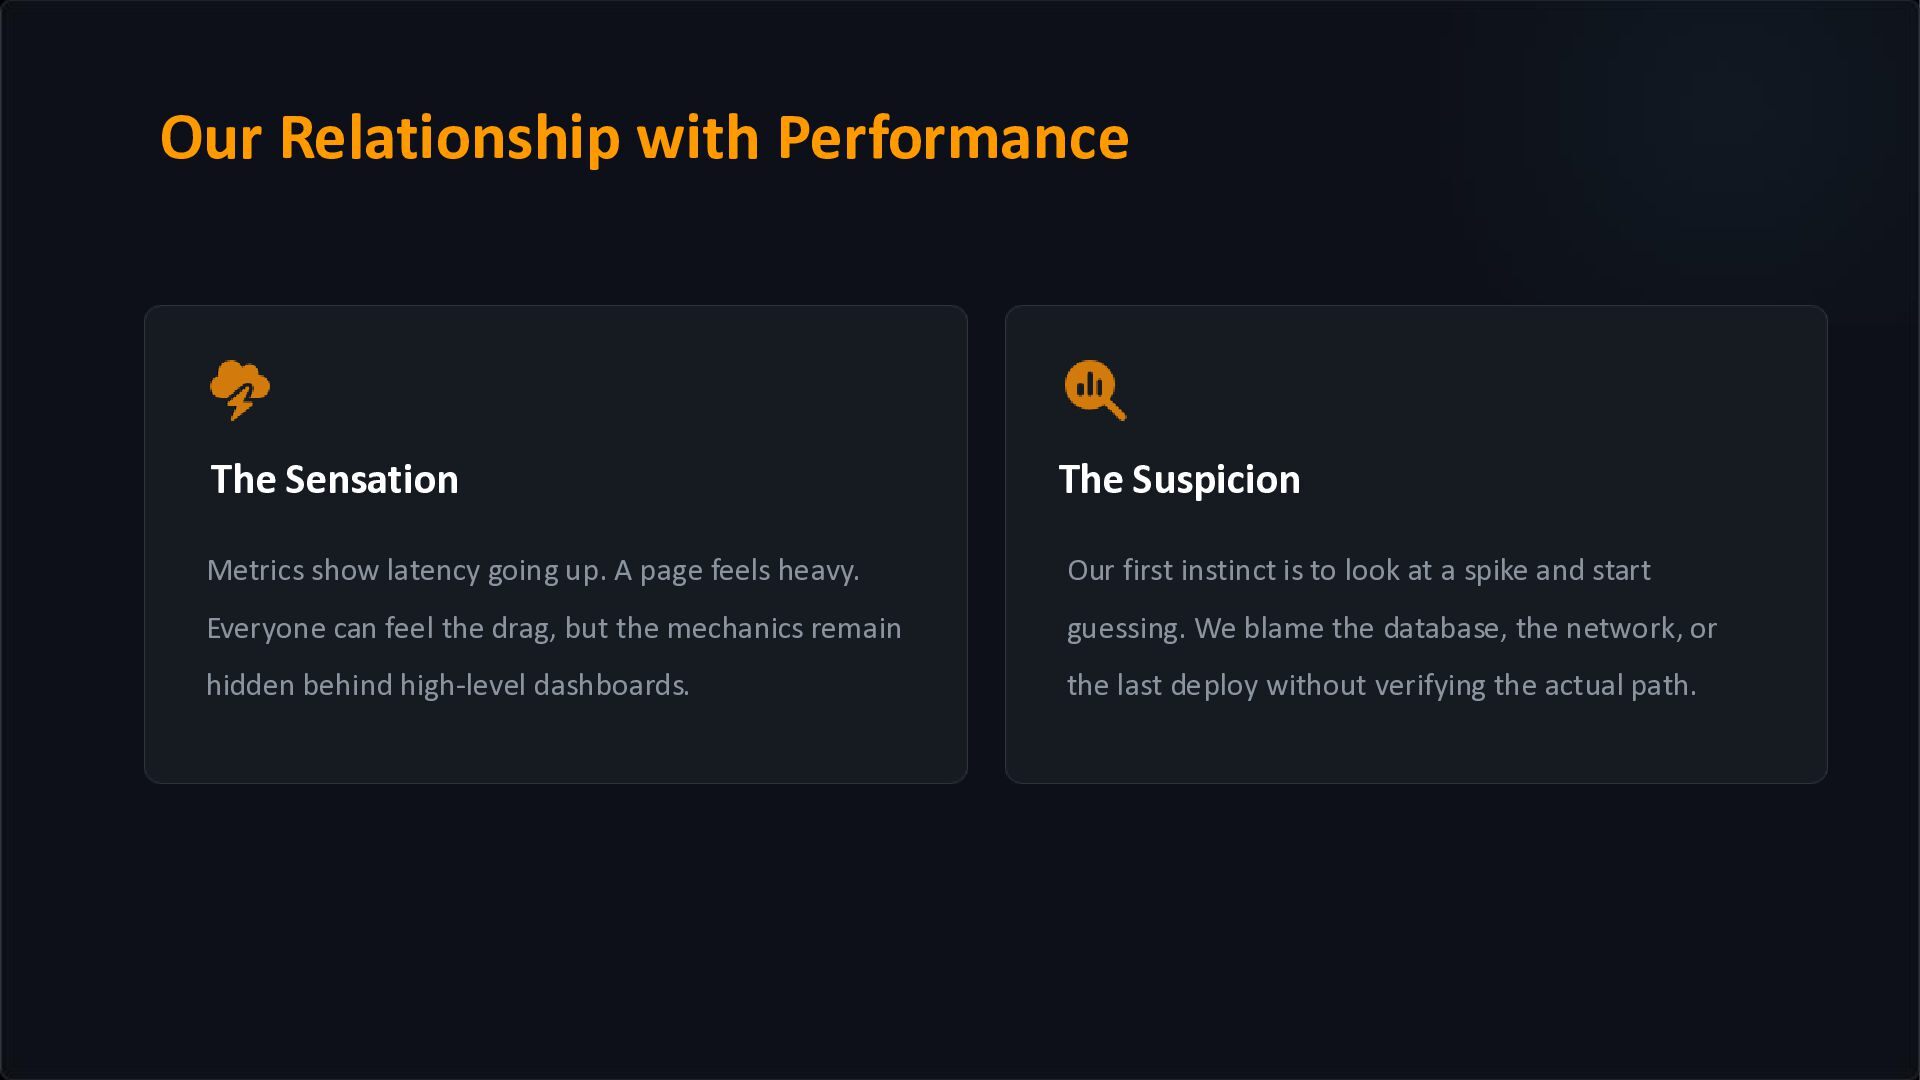
page feels heavy. Everyone can feel the drag, but the mechanics remain hidden behind high-level dashboards. Our first instinct is to look at a spike and start guessing. We blame the database, the network, or the last deploy without verifying the actual path. Our Relationship with Performance
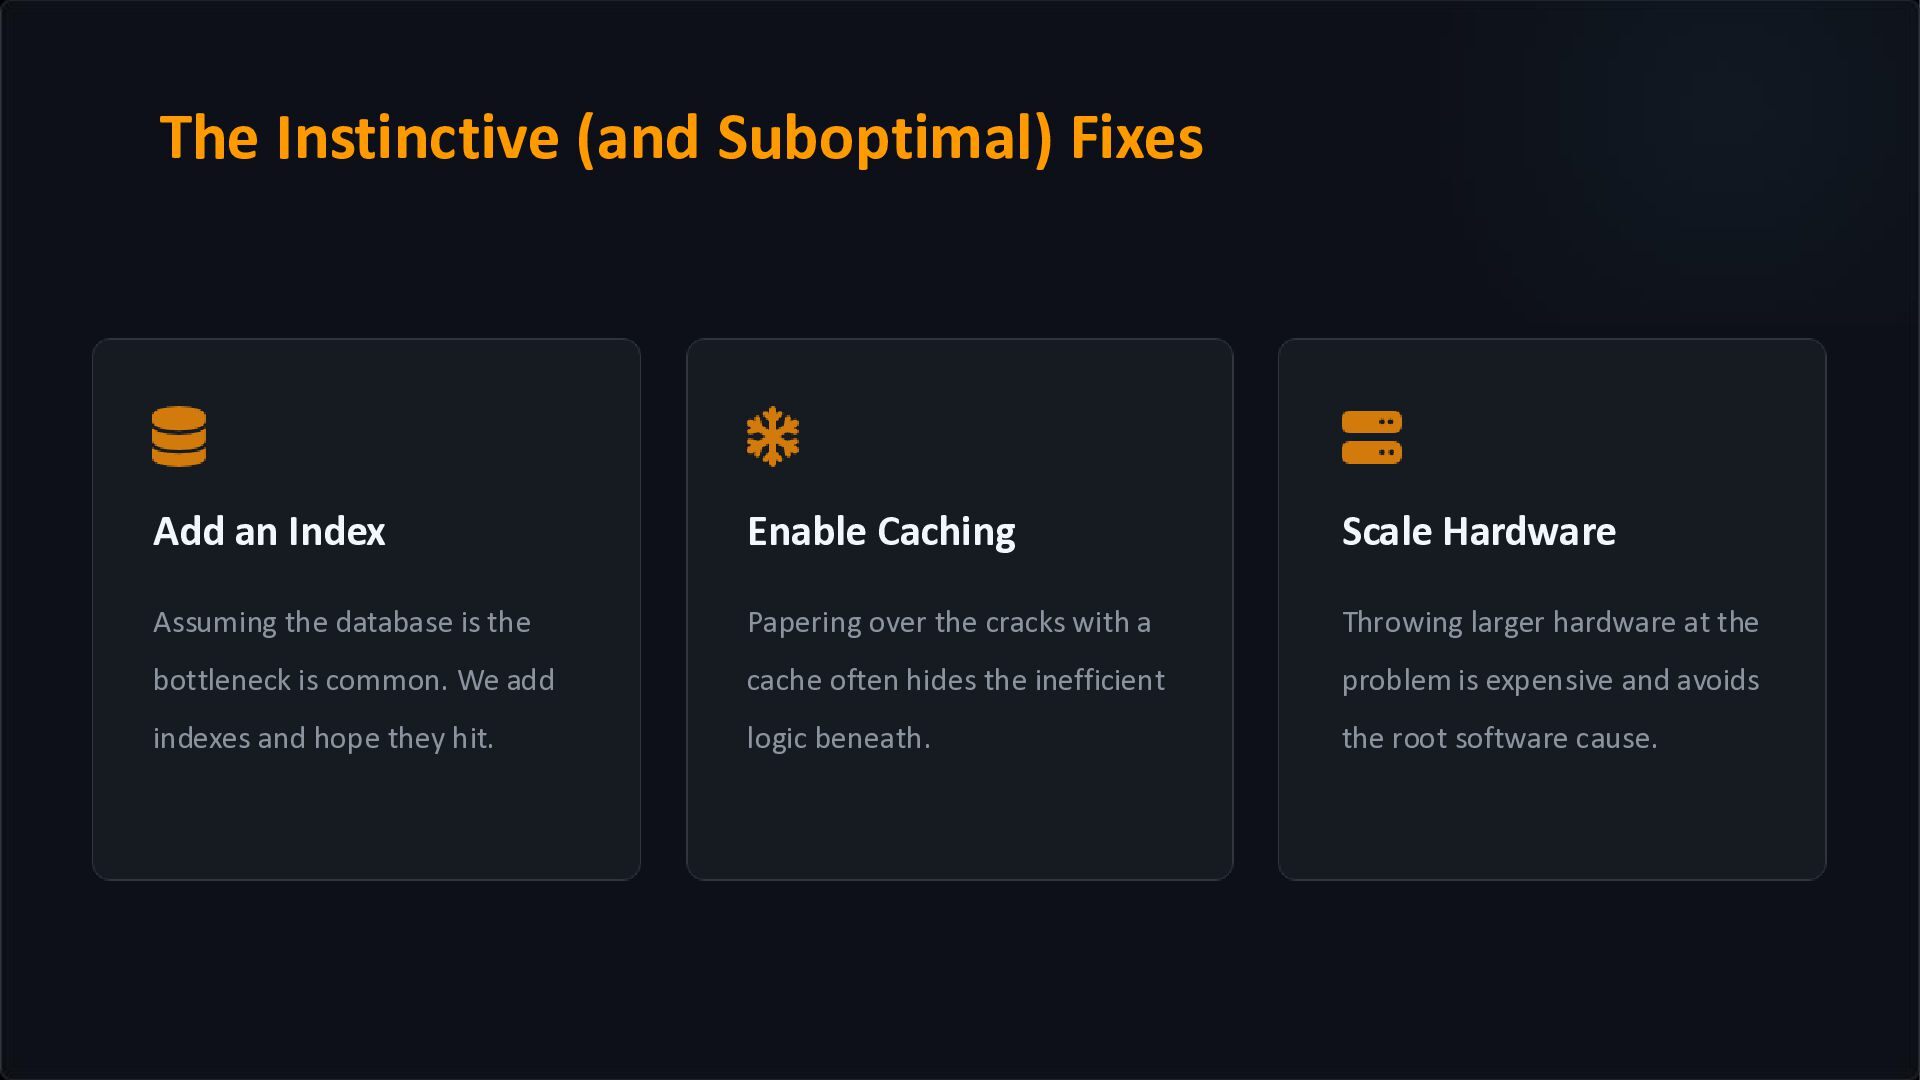
is the bottleneck is common. We add indexes and hope they hit. Papering over the cracks with a cache often hides the inefficient logic beneath. Throwing larger hardware at the problem is expensive and avoids the root software cause. The Instinctive (and Suboptimal) Fixes
optimization is counter-intuitive. The method you've been suspicious of for years? It's probably fine. The innocuous single line of code that nobody looks at? That might be your main culprit.
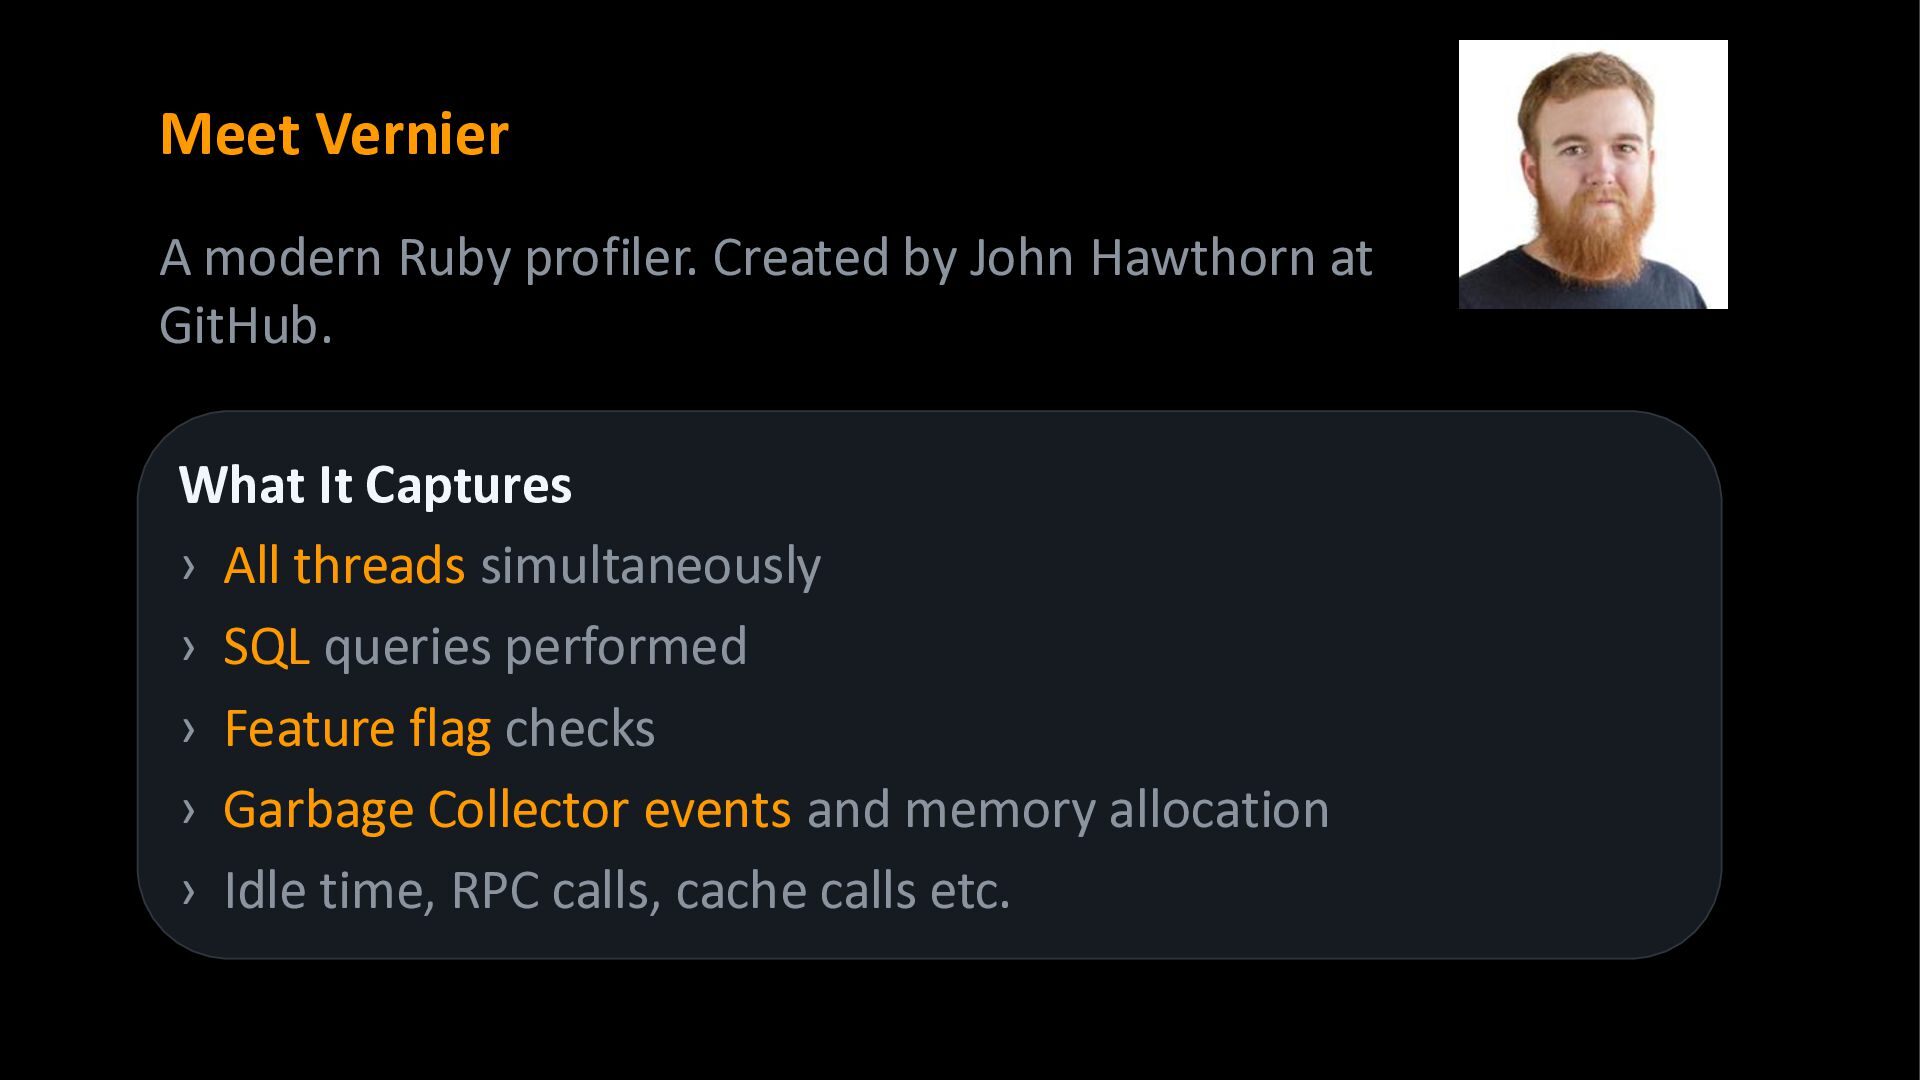
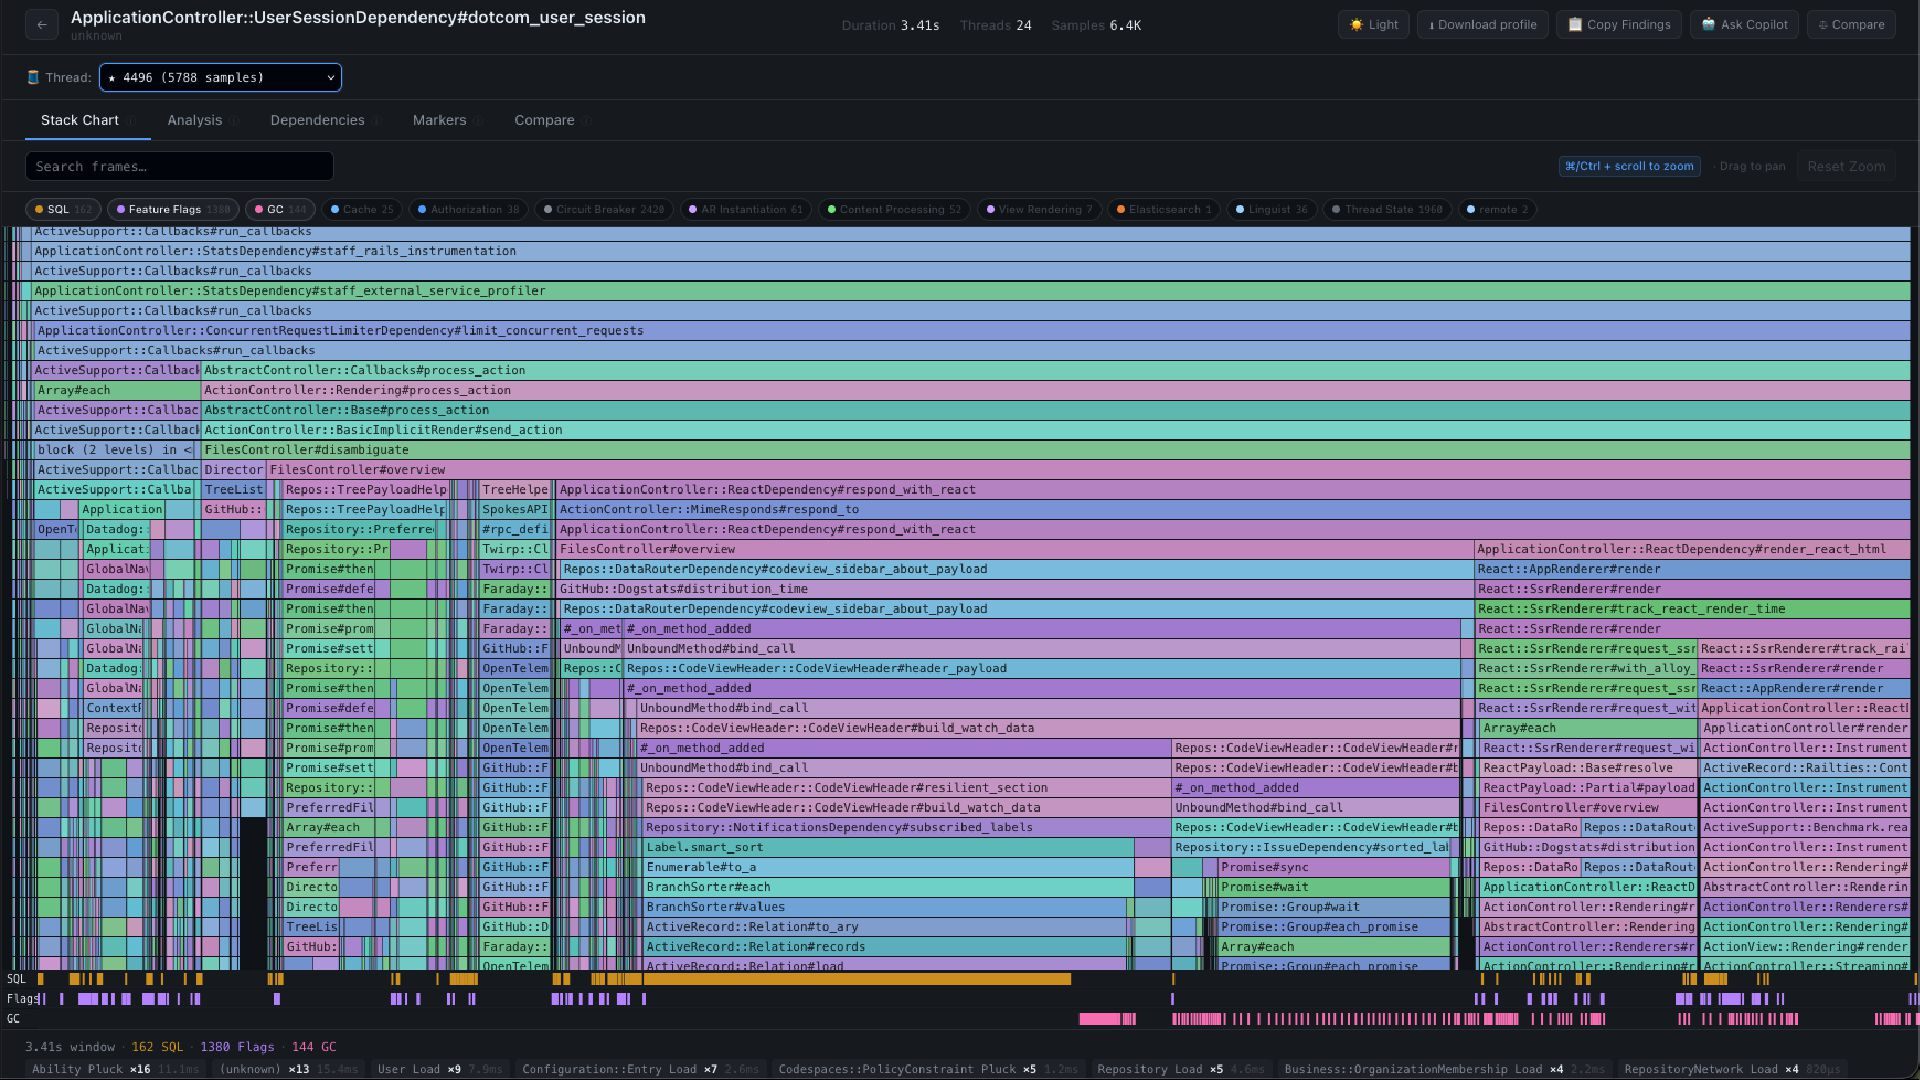
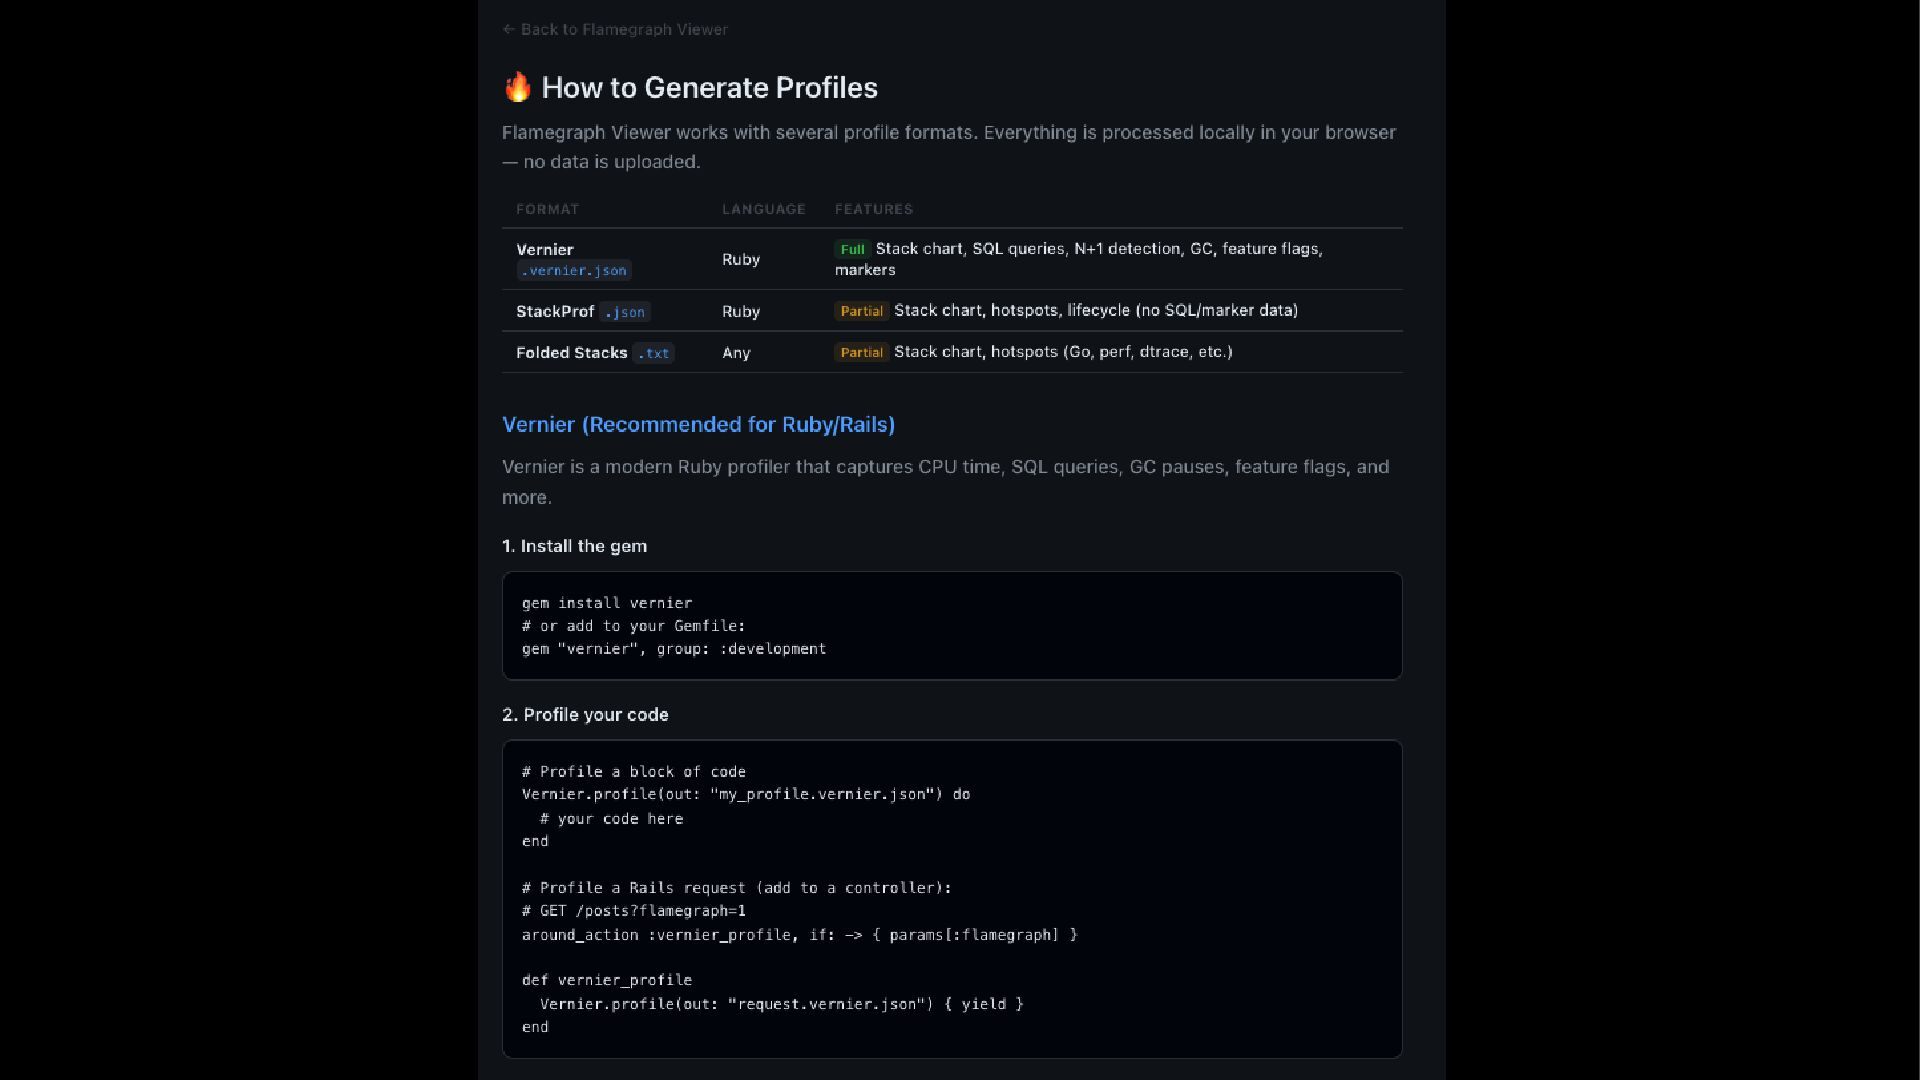
at GitHub. What It Captures › All threads simultaneously › SQL queries performed › Feature flag checks › Garbage Collector events and memory allocation › Idle time, RPC calls, cache calls etc.
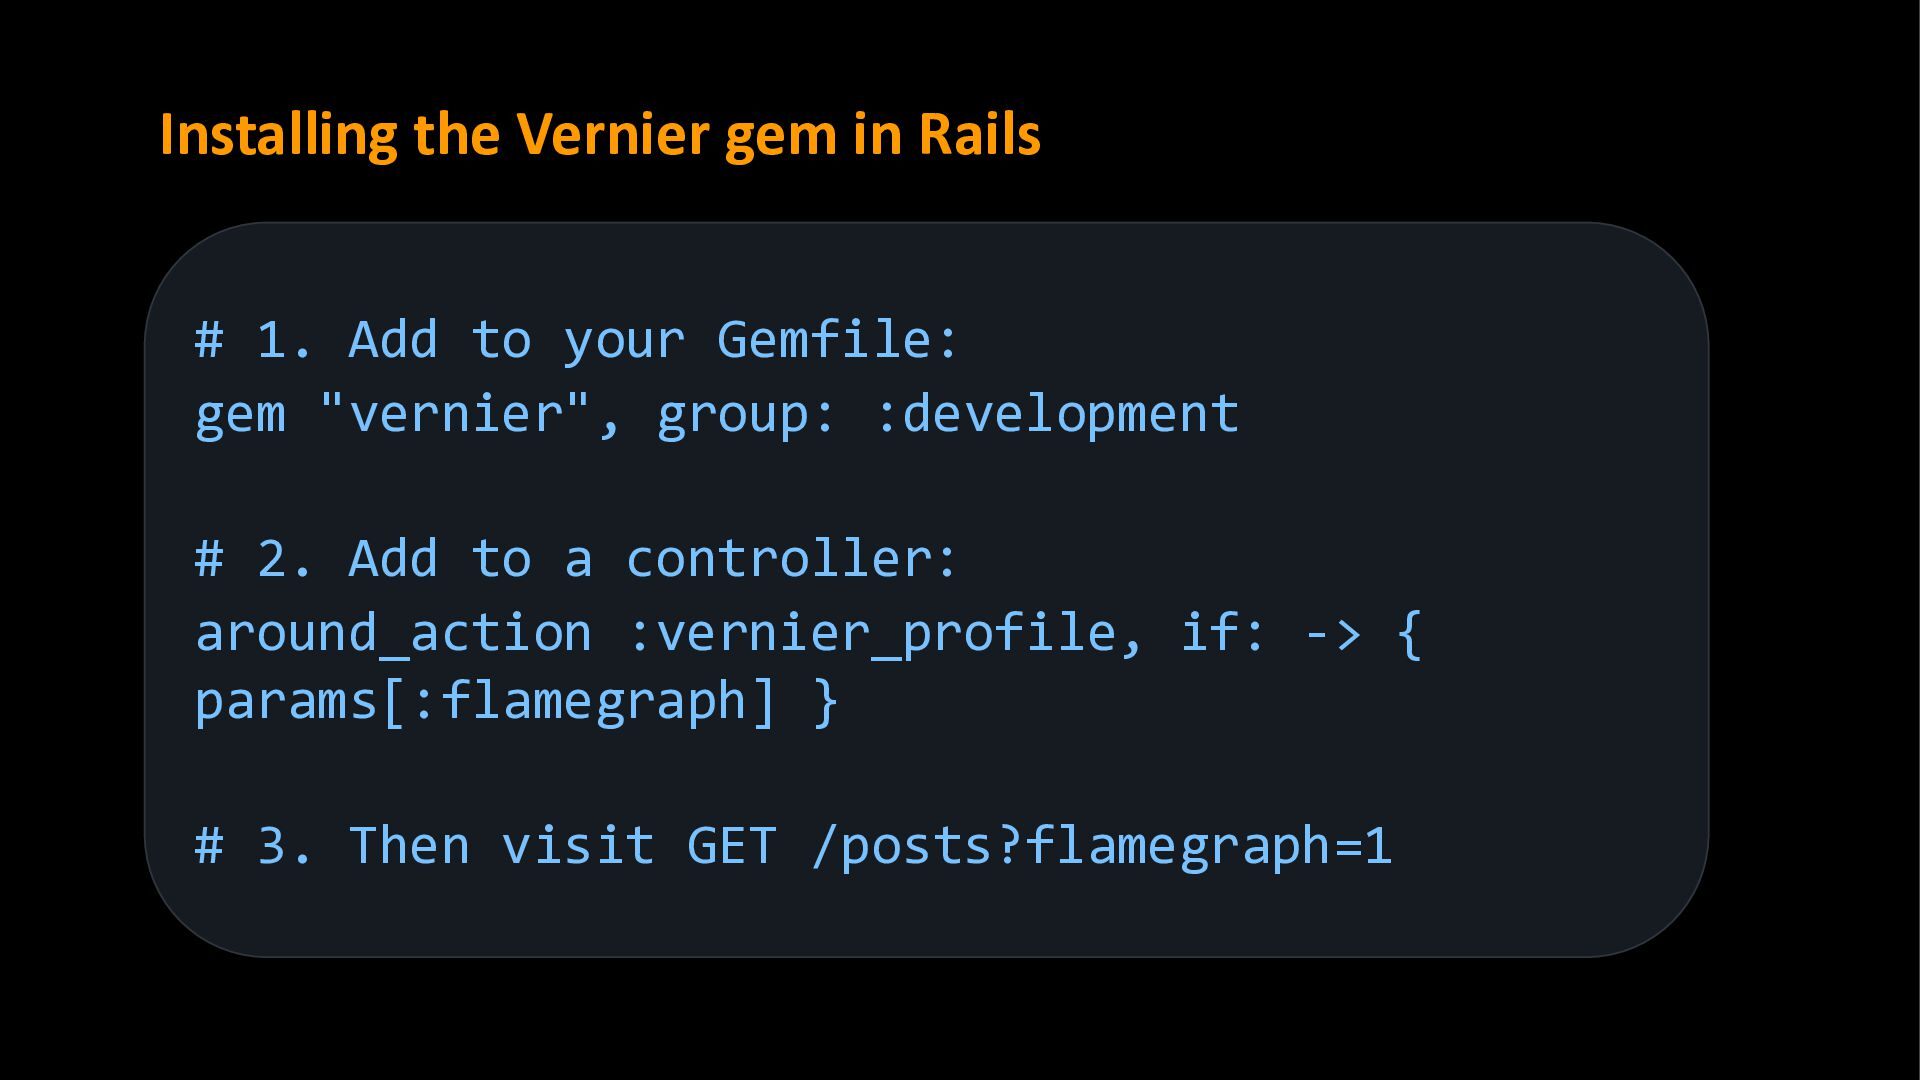
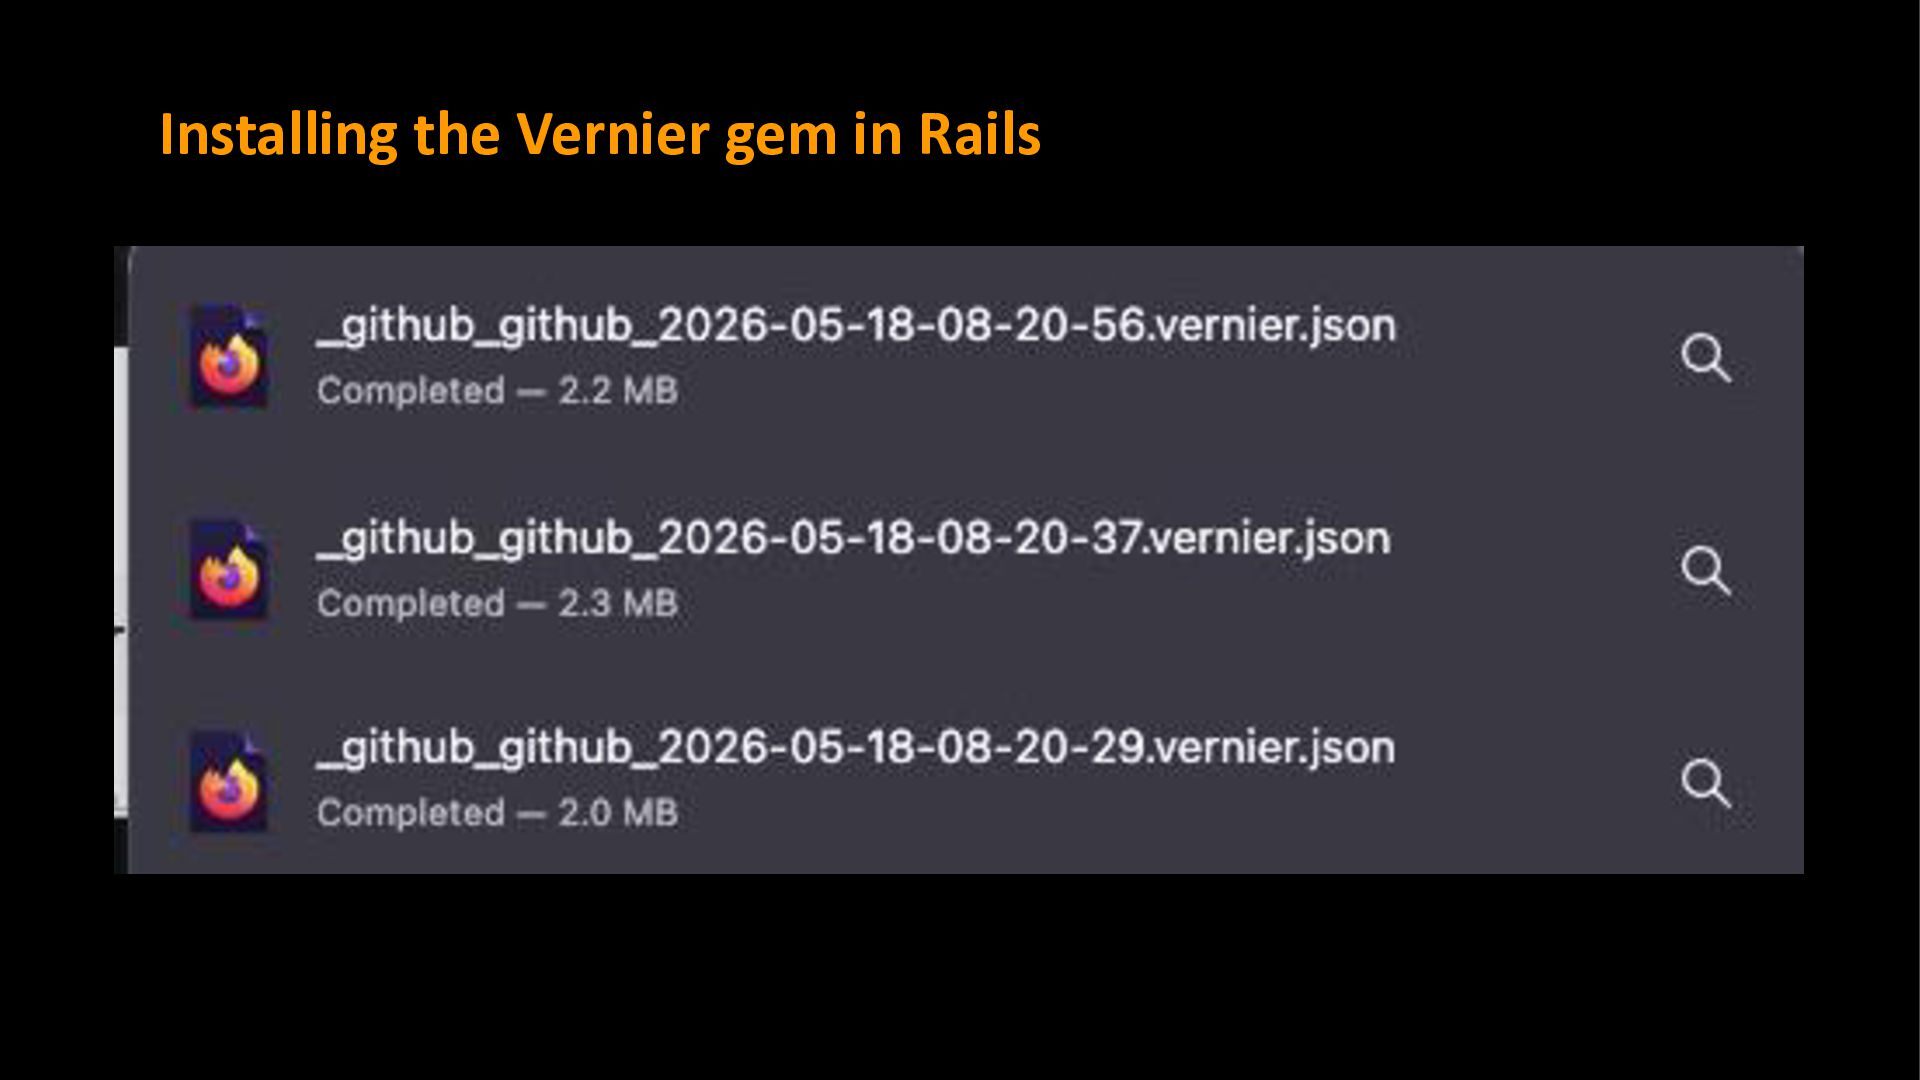
your Gemfile: gem "vernier", group: :development # 2. Add to a controller: around_action :vernier_profile, if: -> { params[:flamegraph] } # 3. Then visit GET /posts?flamegraph=1
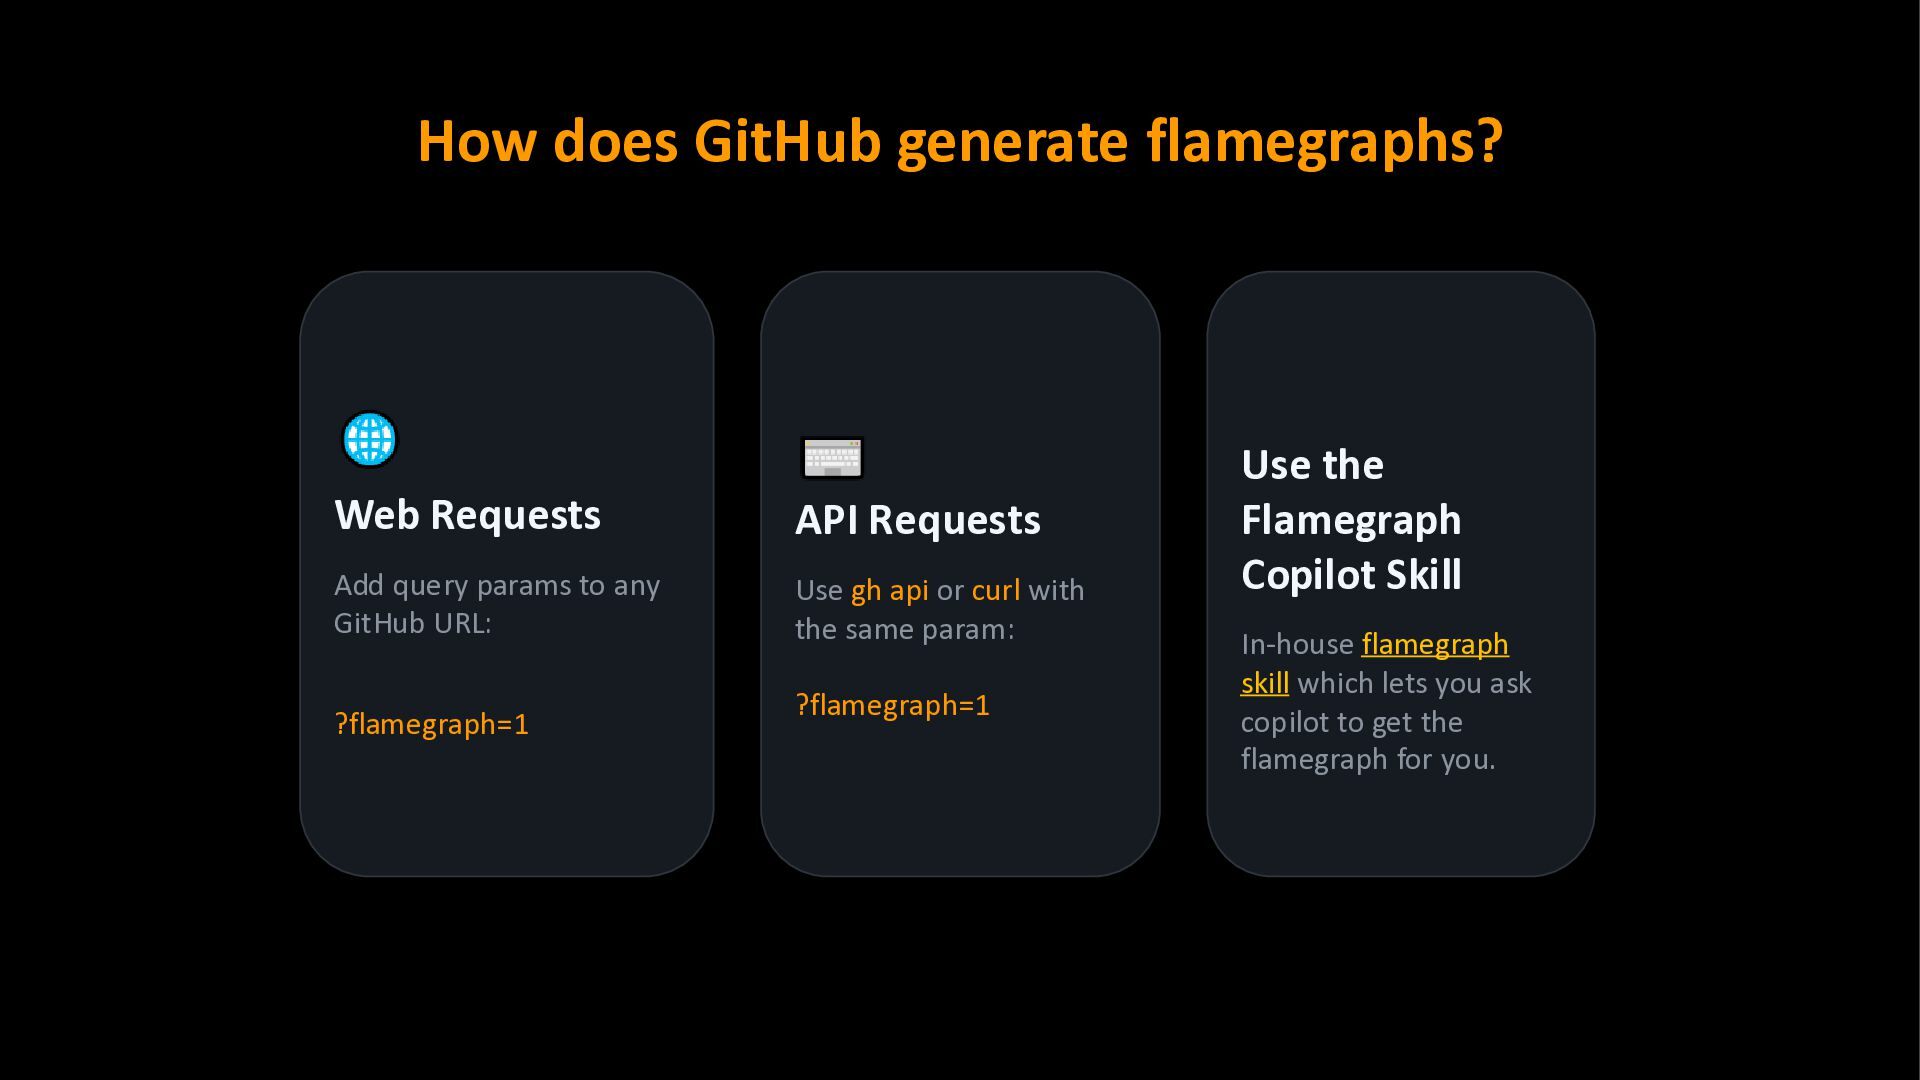
to any GitHub URL: ?flamegraph=1 API Requests Use gh api or curl with the same param: ?flamegraph=1 Use the Flamegraph Copilot Skill In-house flamegraph skill which lets you ask copilot to get the flamegraph for you.
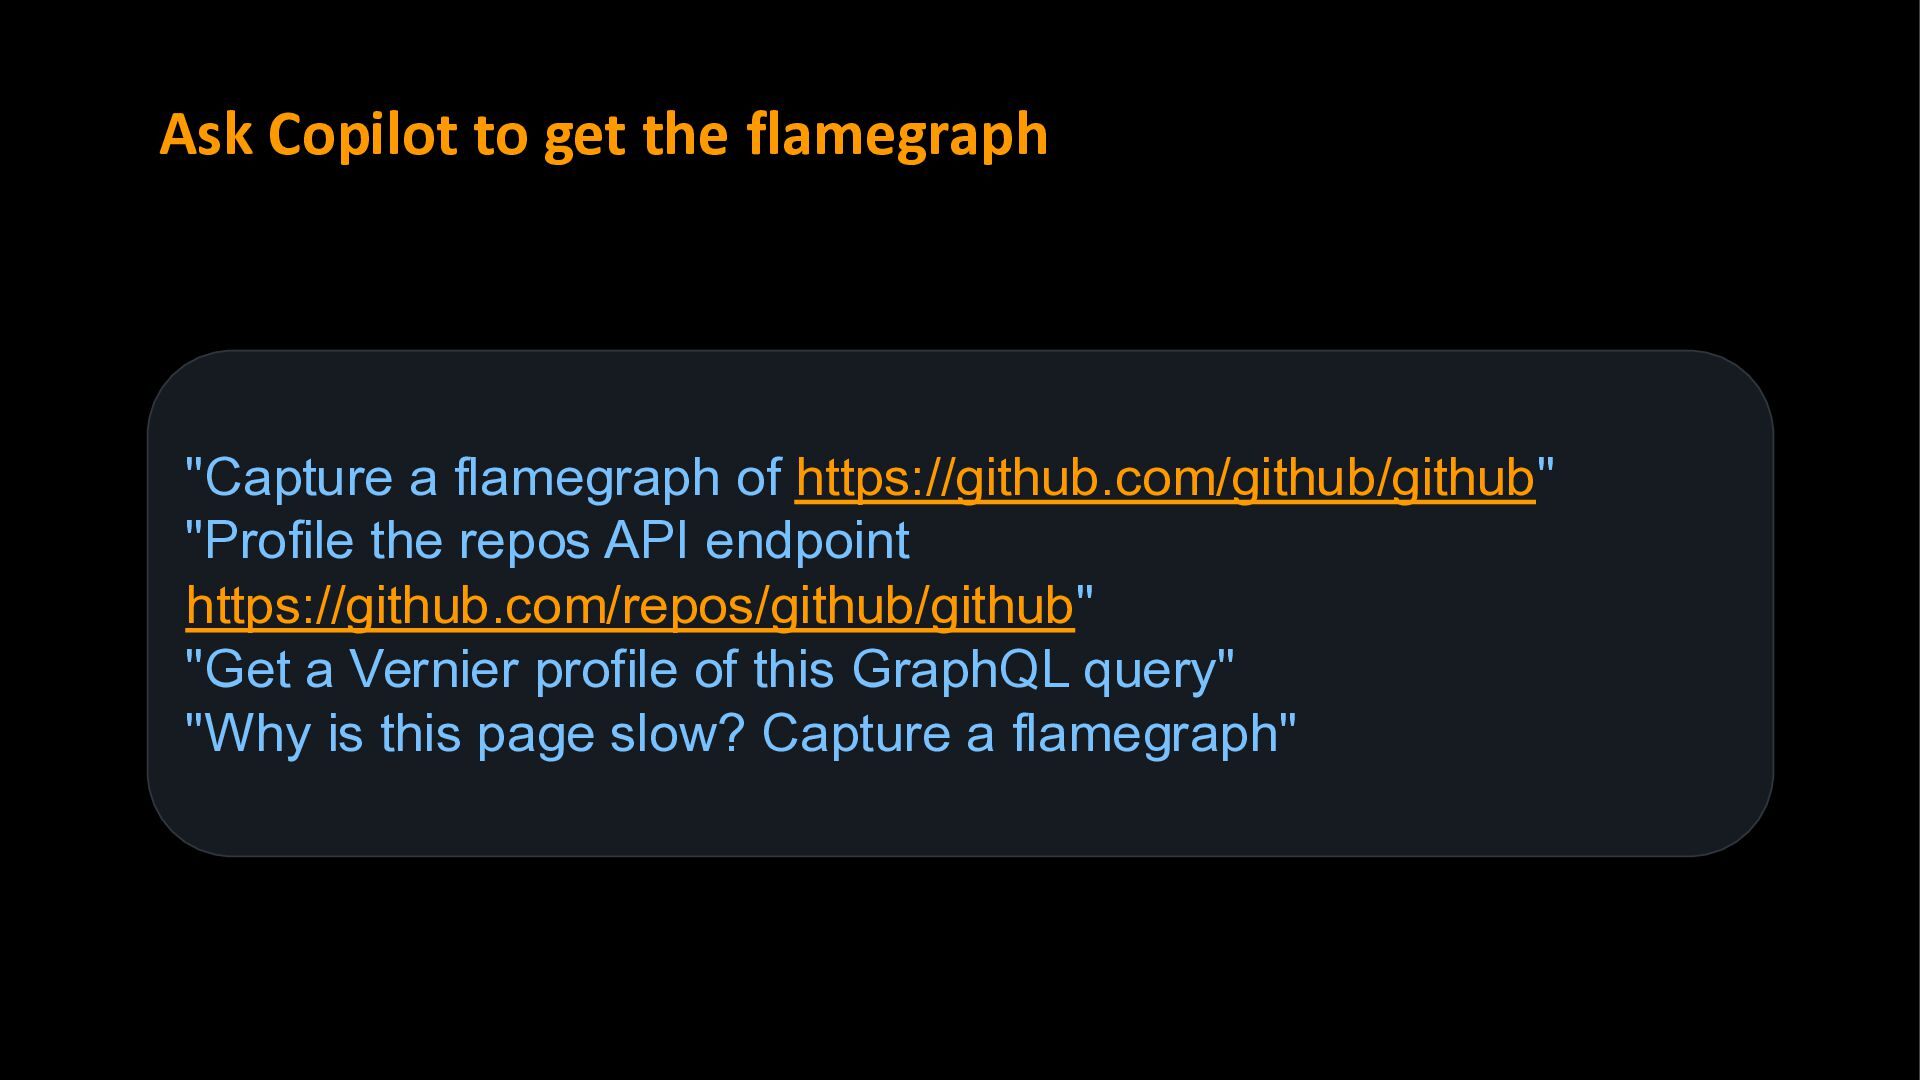
https://github.com/github/github" "Profile the repos API endpoint https://github.com/repos/github/github" "Get a Vernier profile of this GraphQL query" "Why is this page slow? Capture a flamegraph"
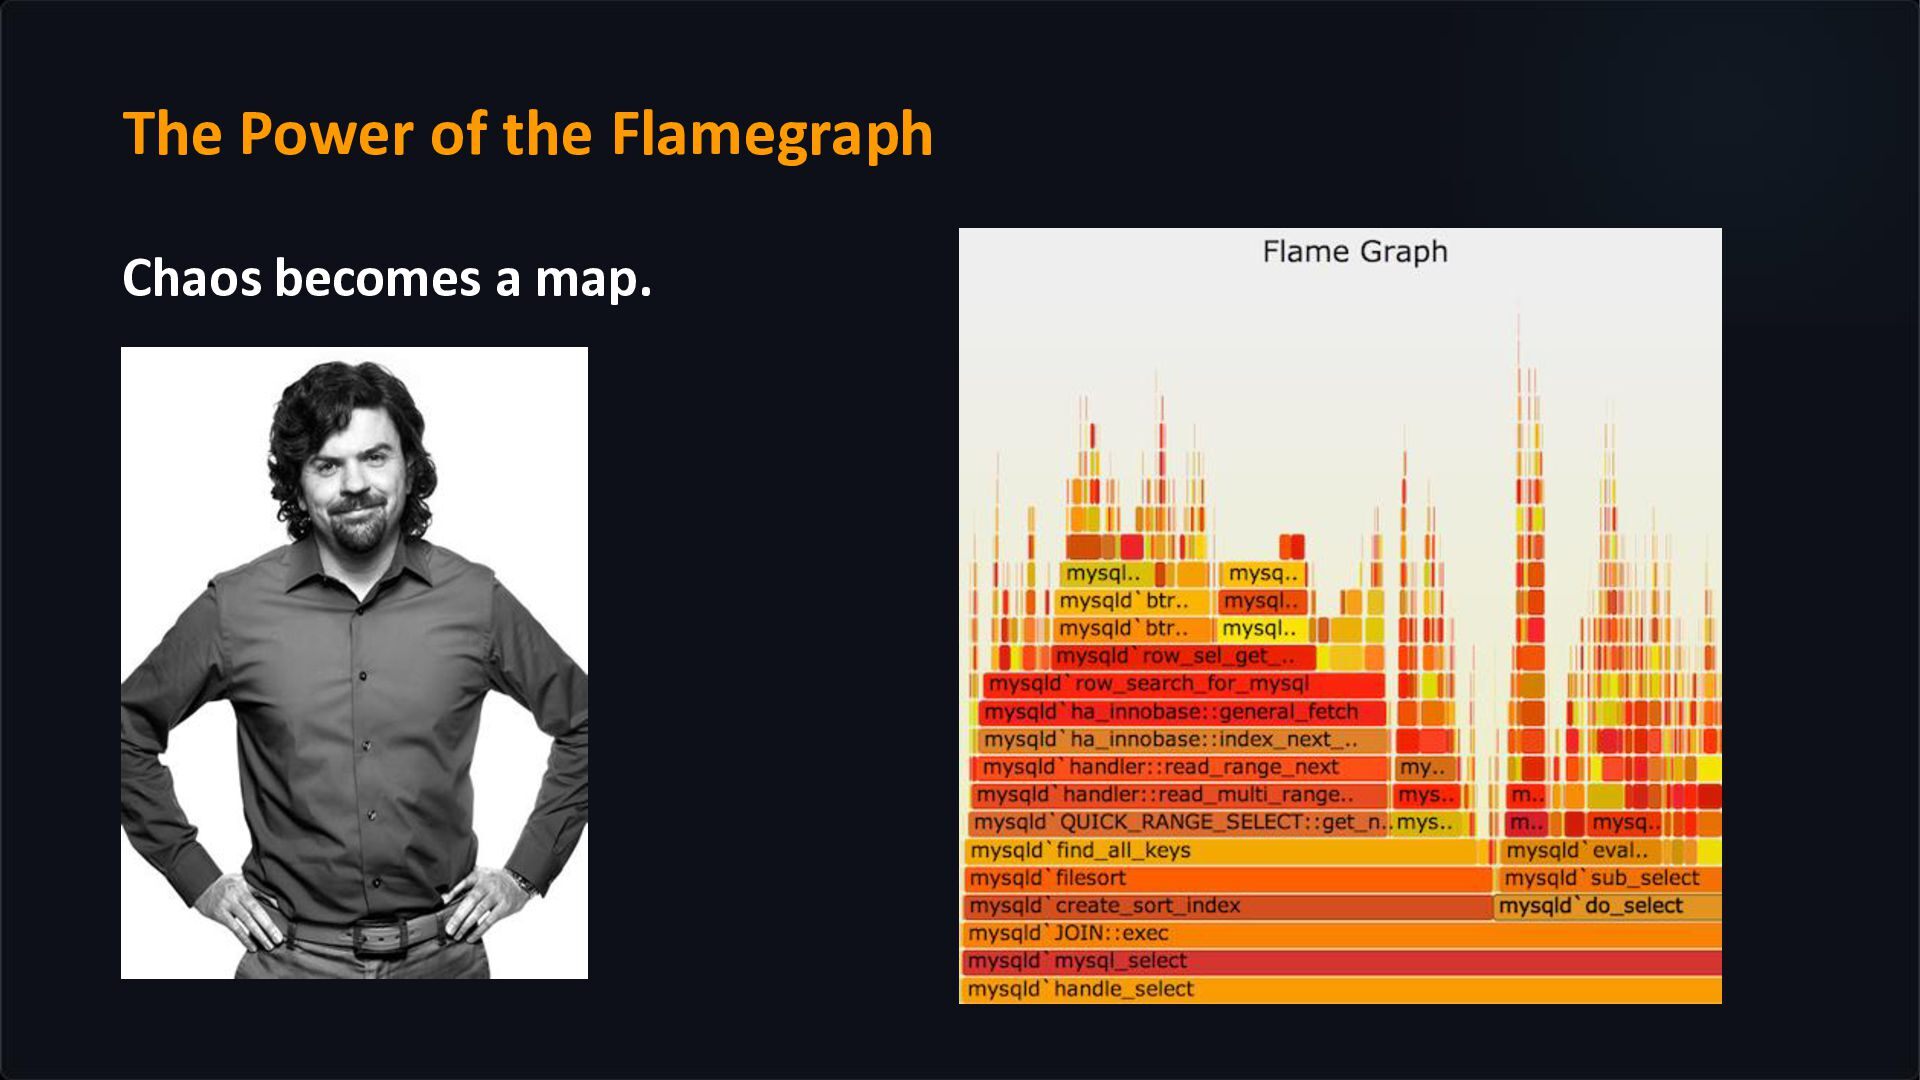
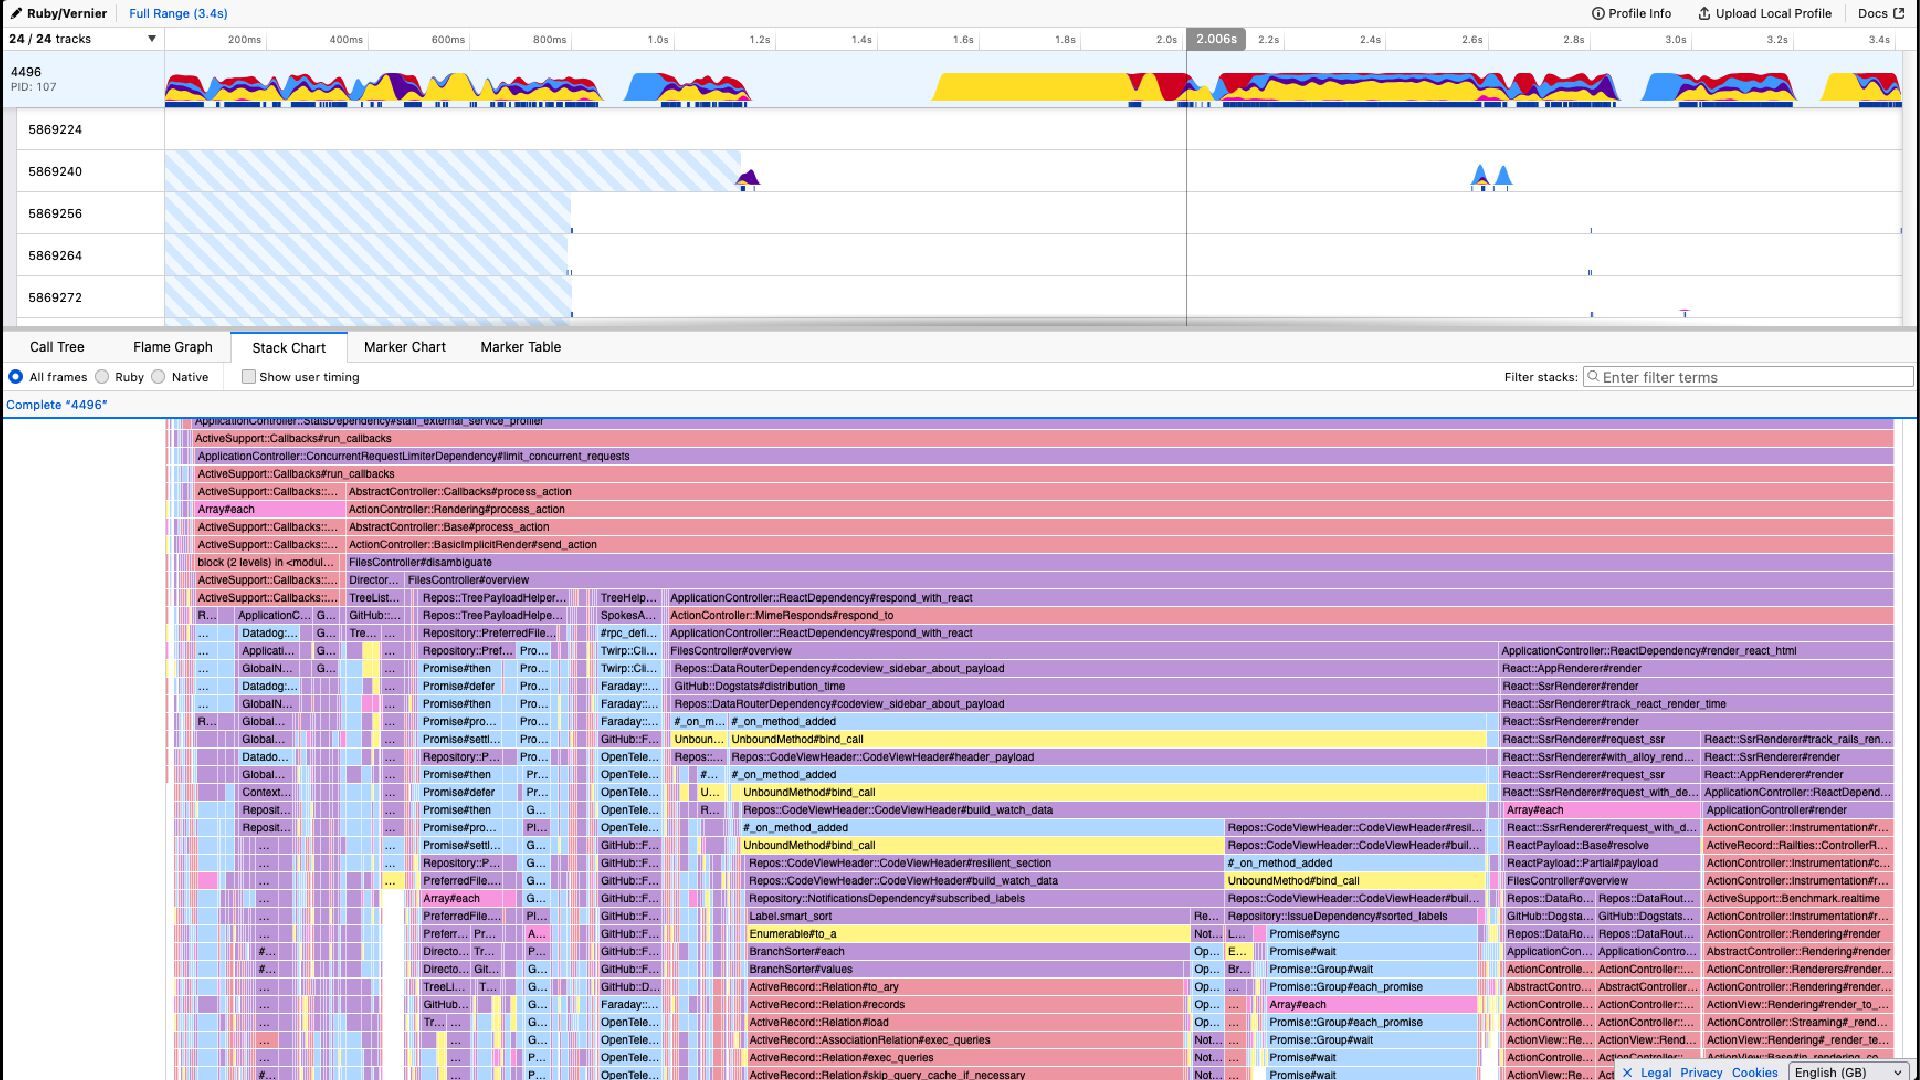
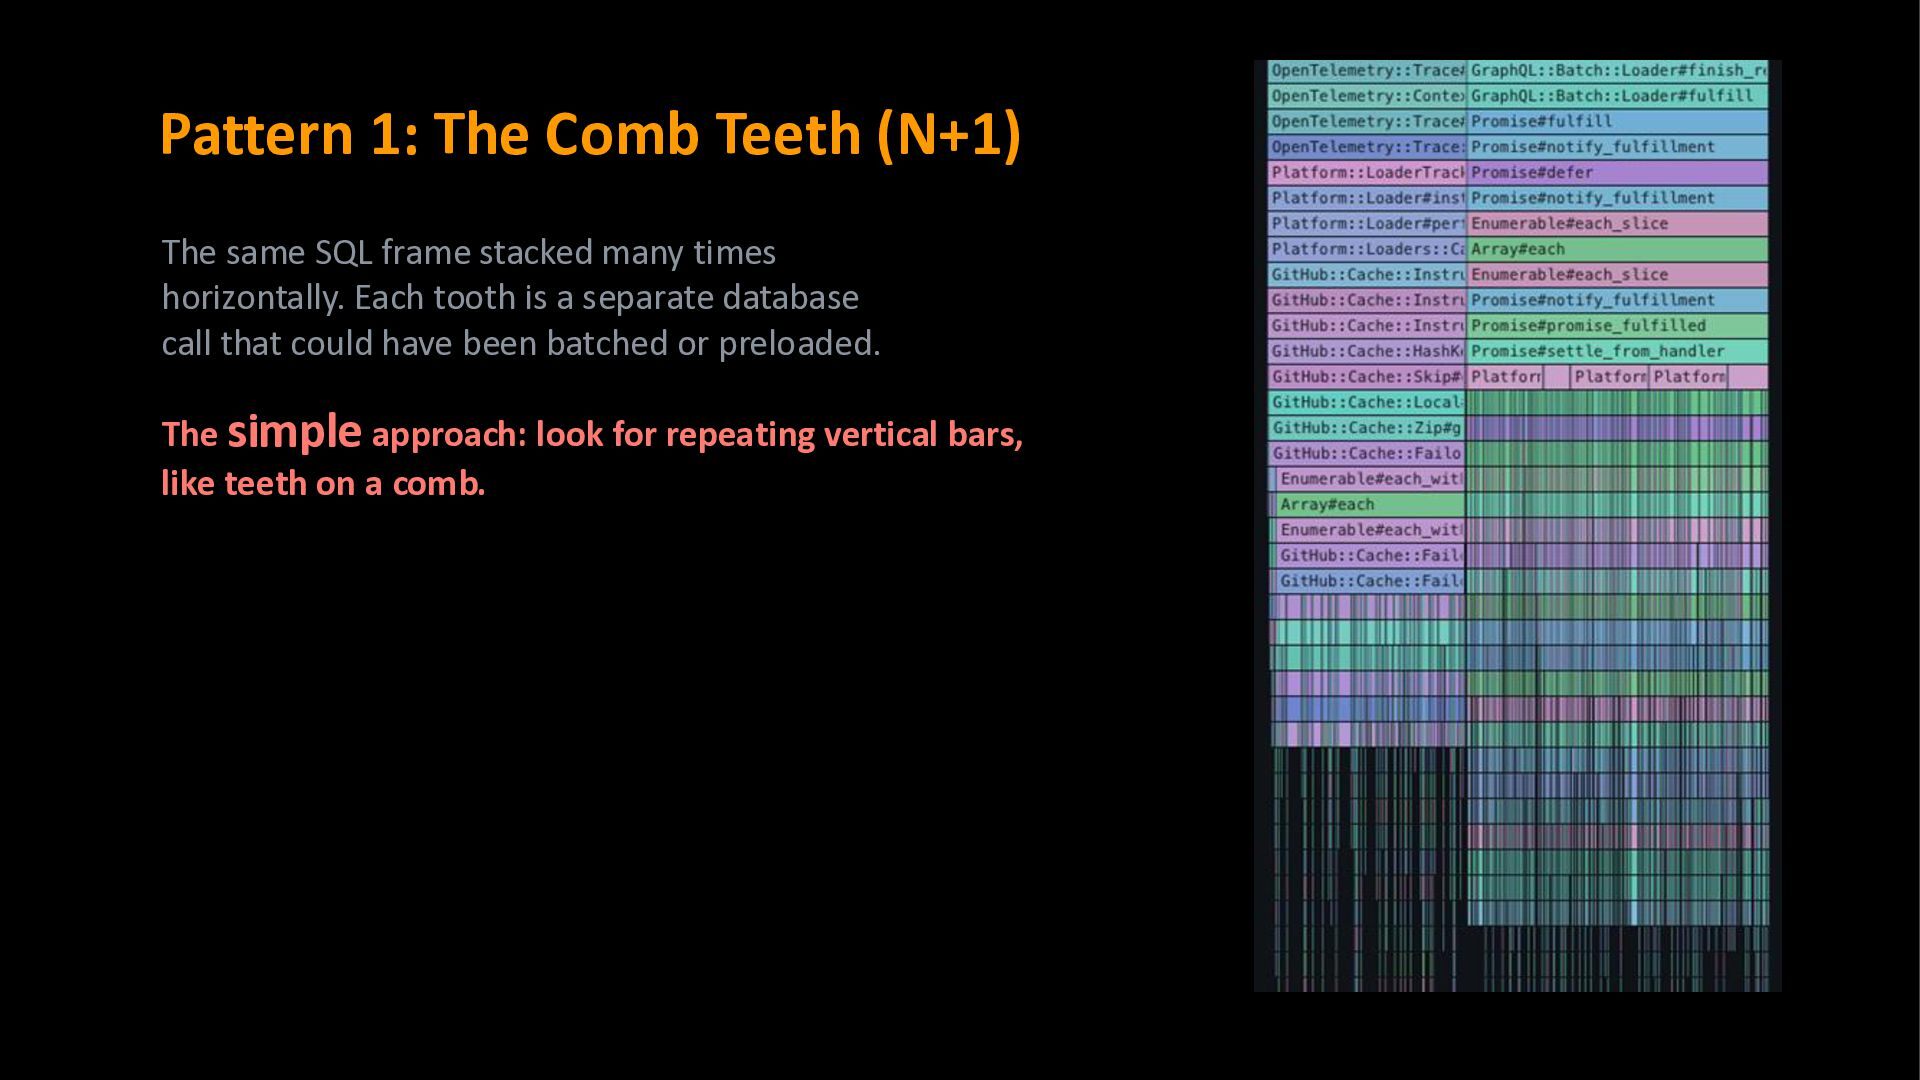
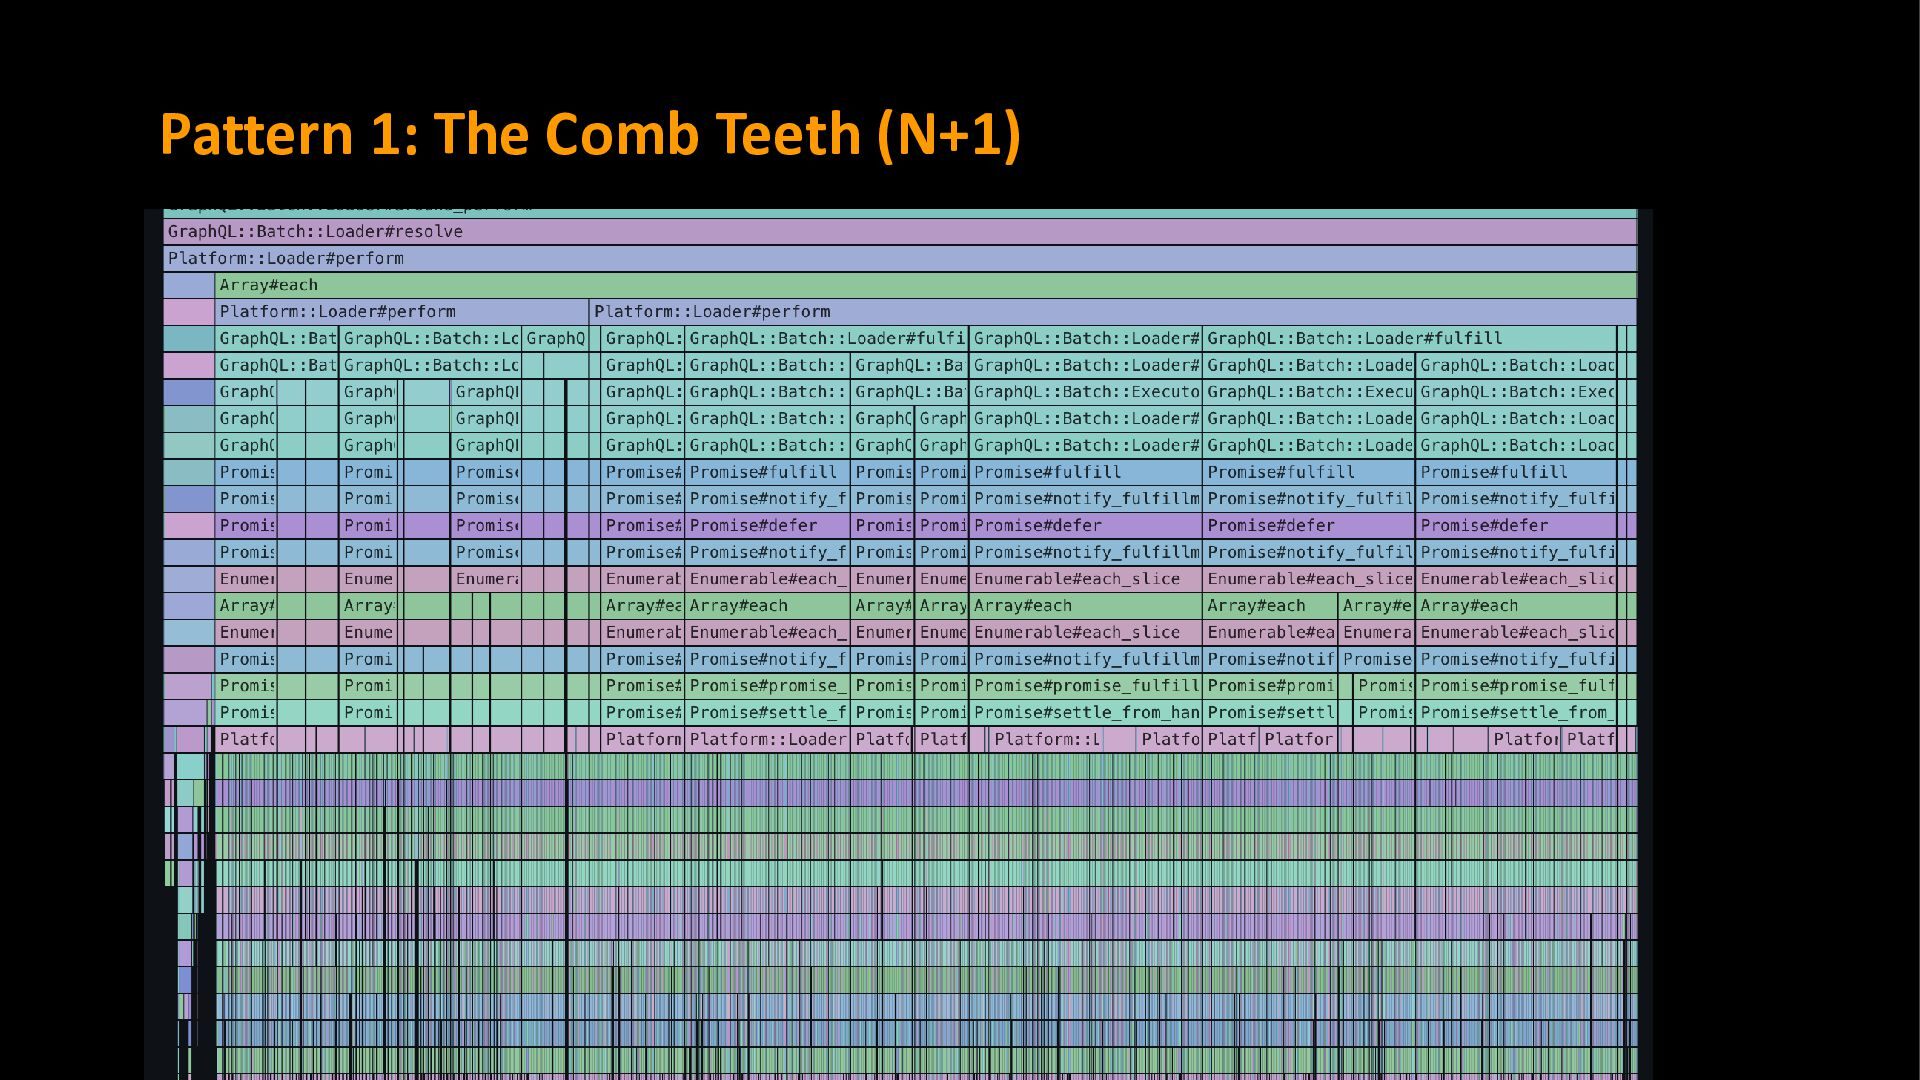
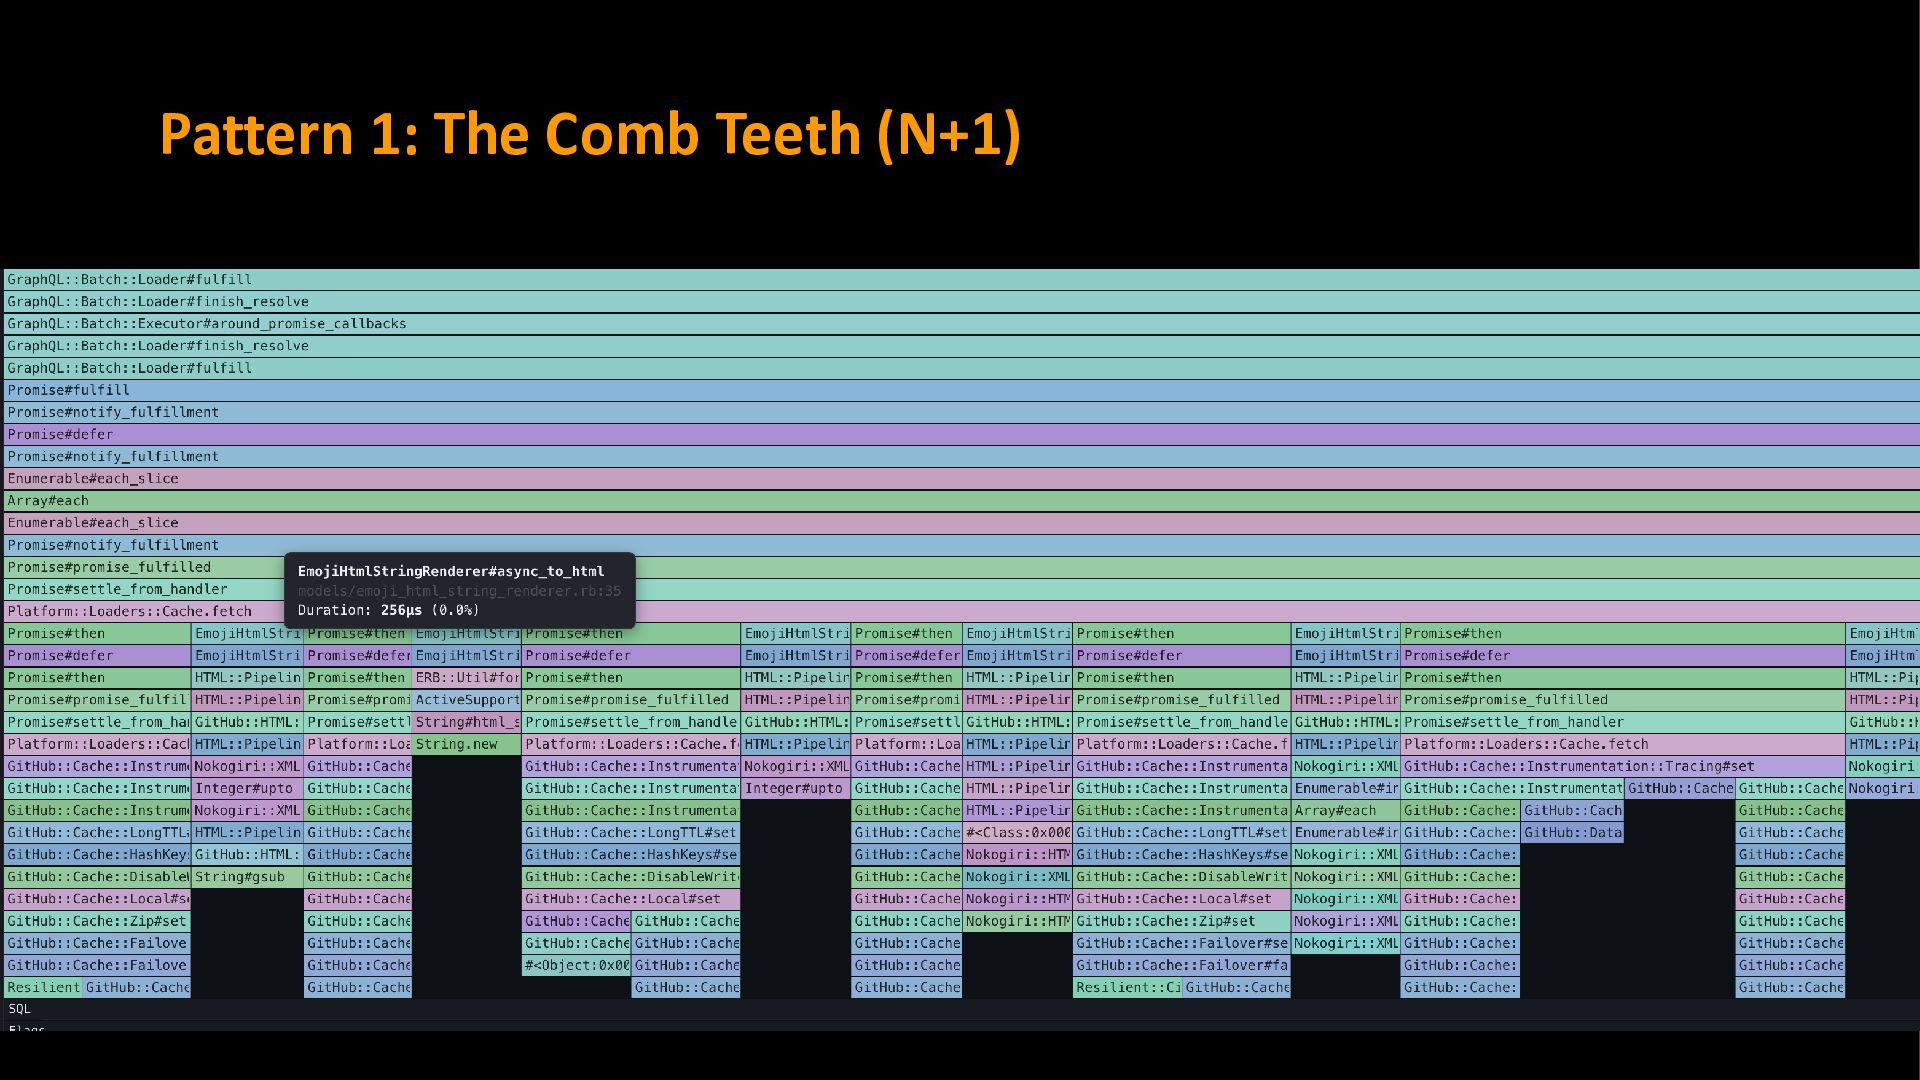
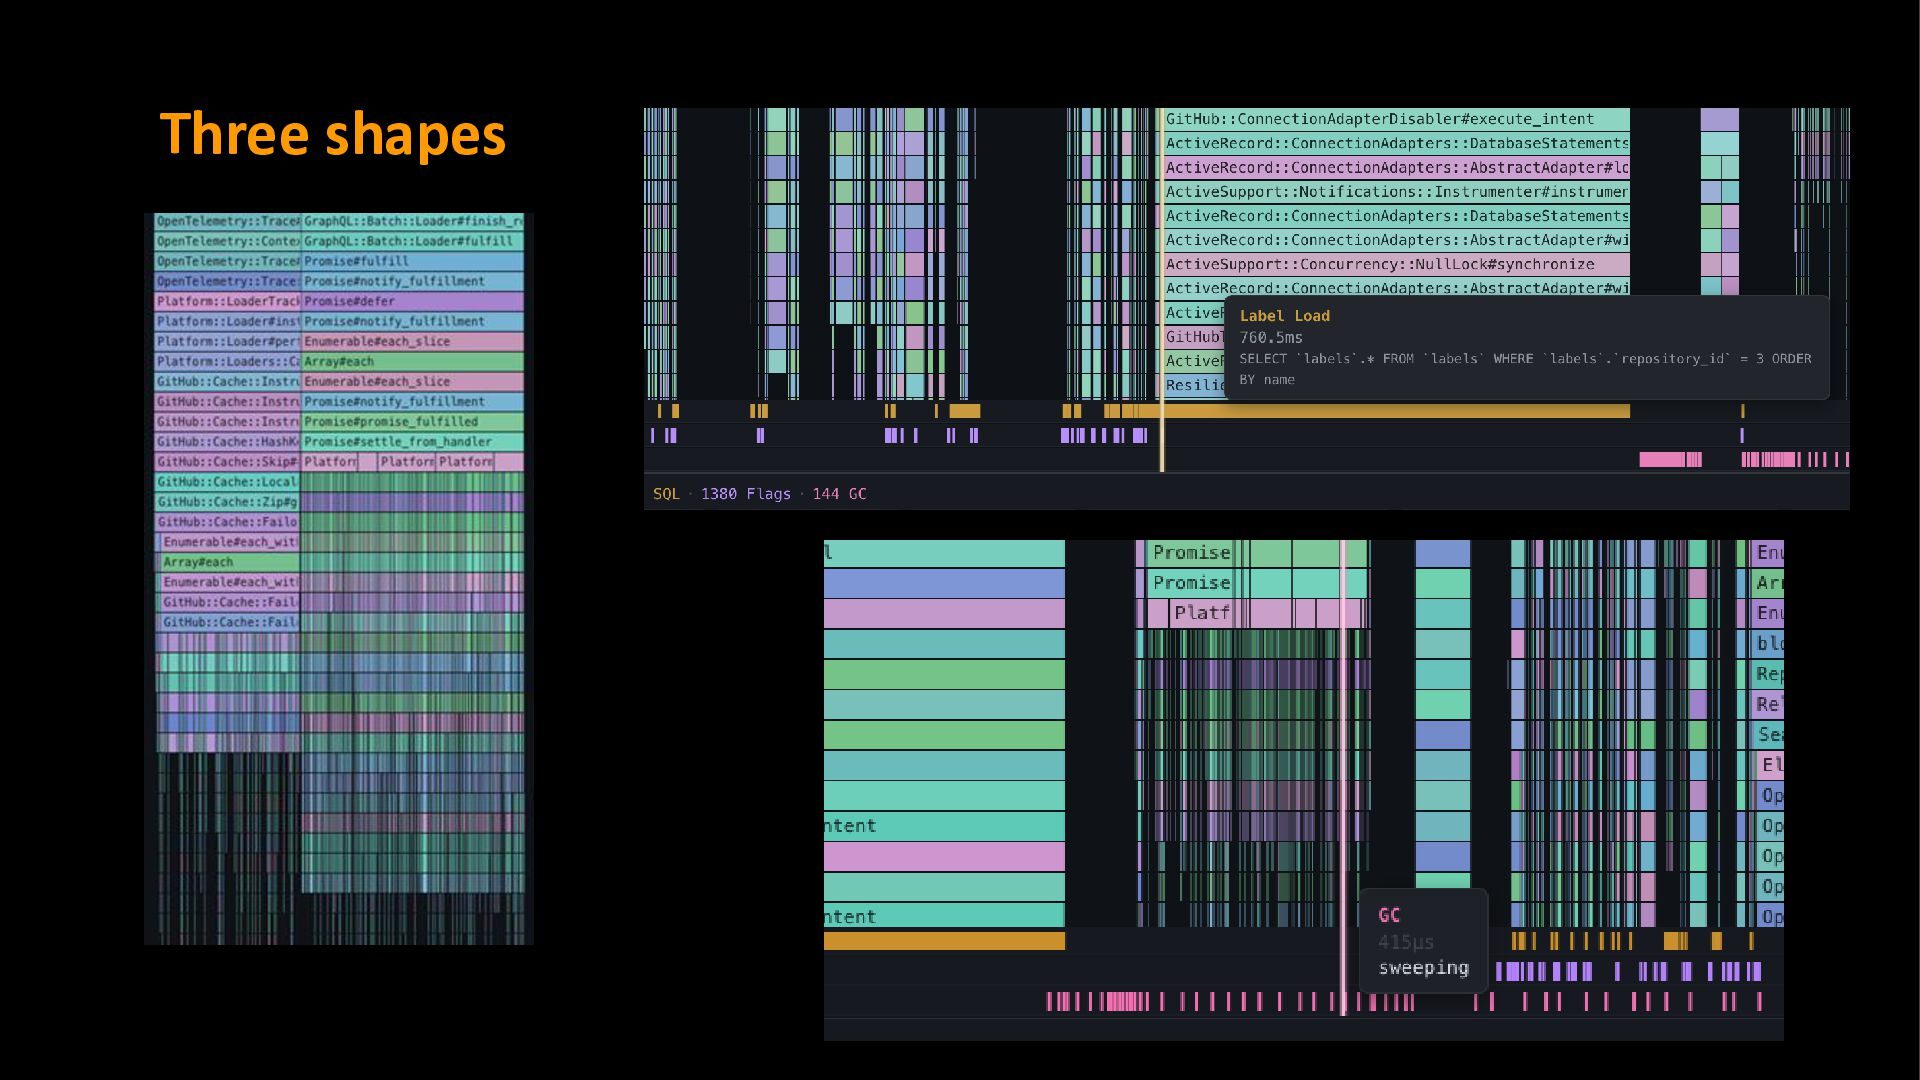
stacked many times horizontally. Each tooth is a separate database call that could have been batched or preloaded. The simple approach: look for repeating vertical bars, like teeth on a comb.
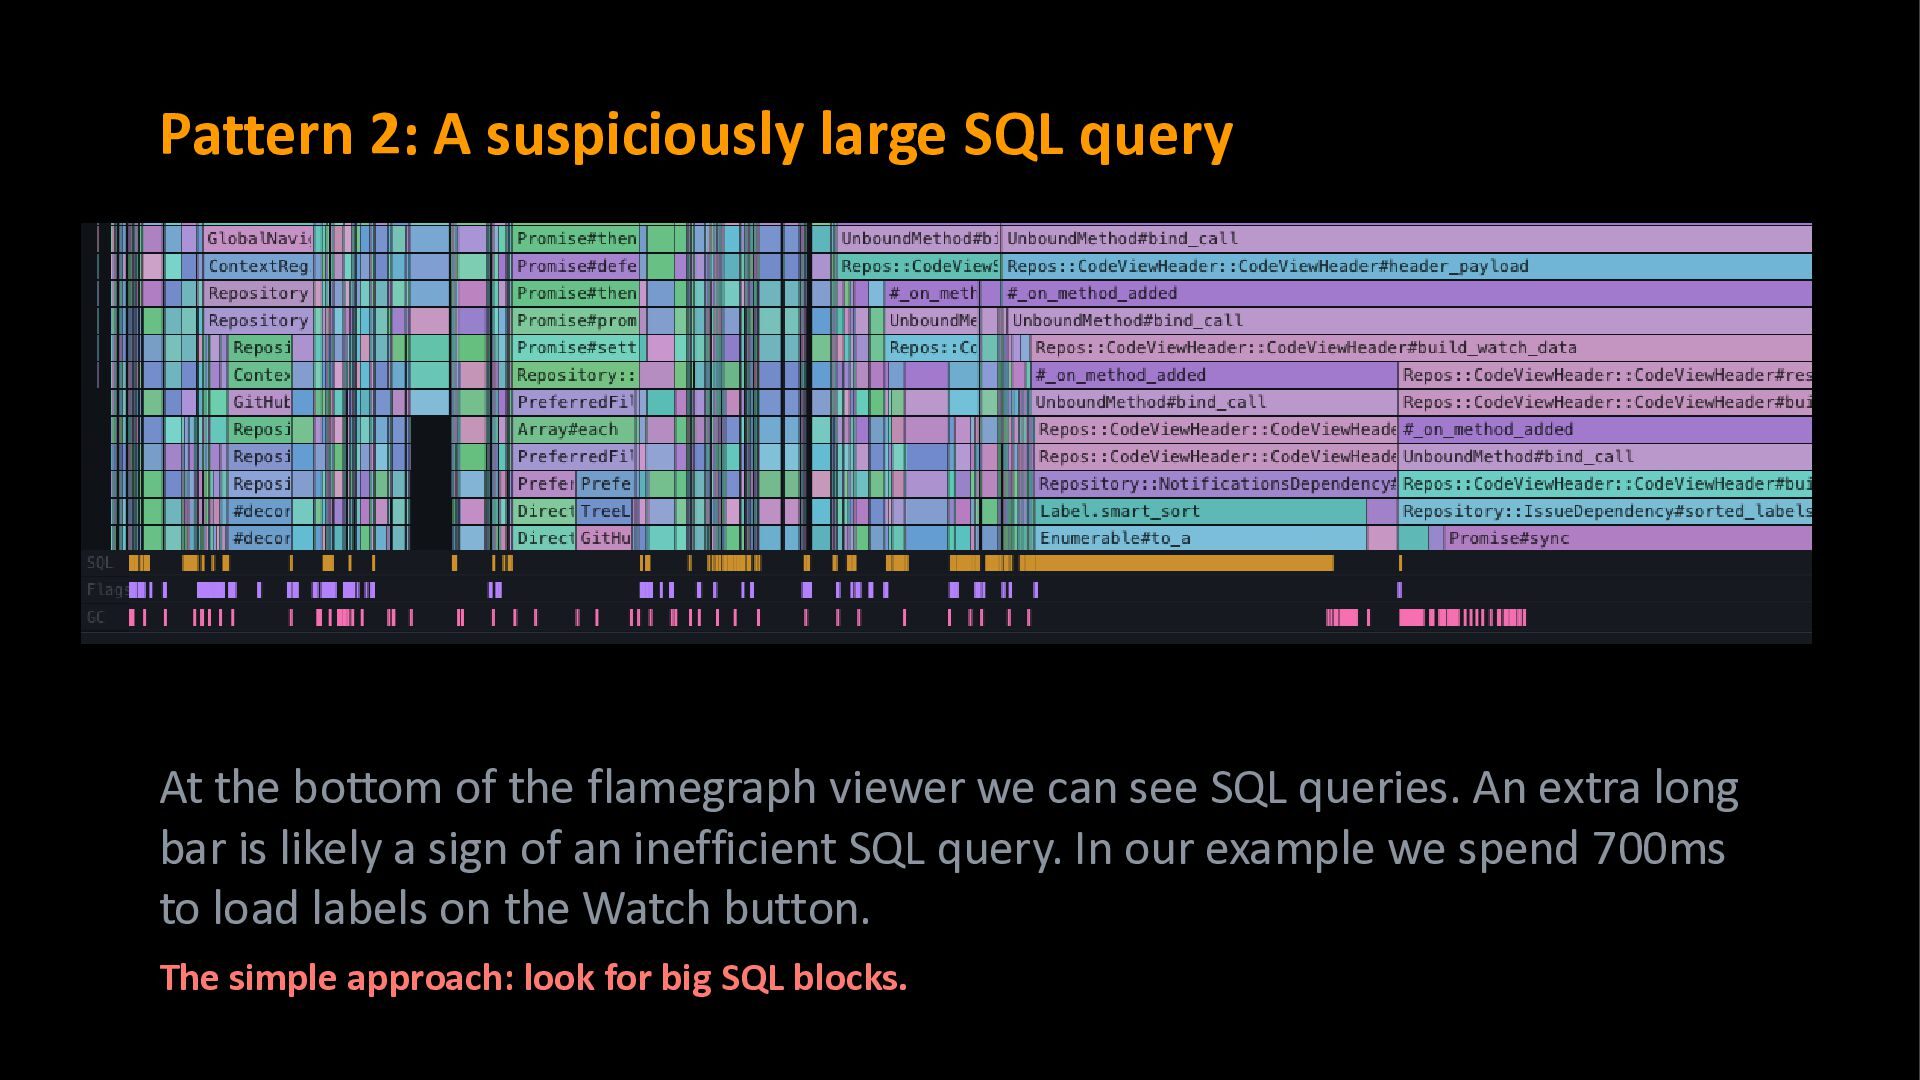
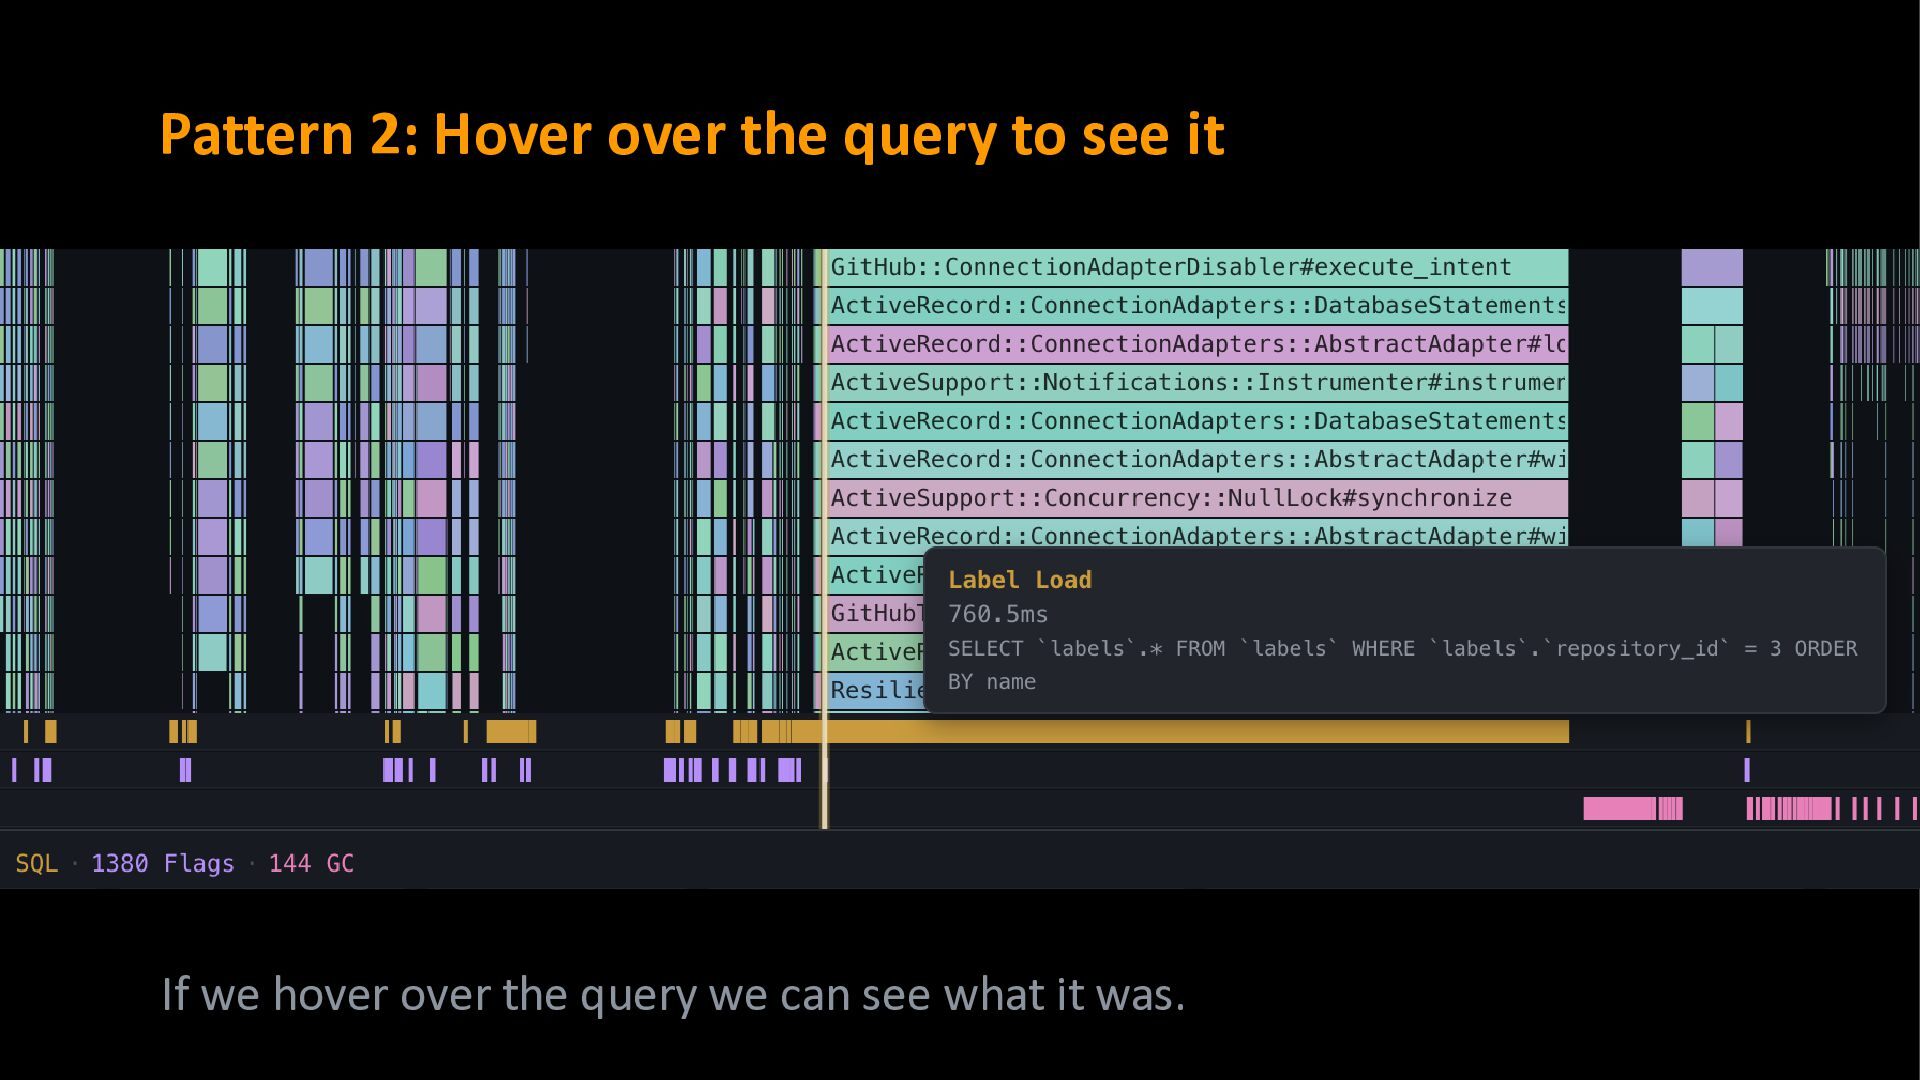
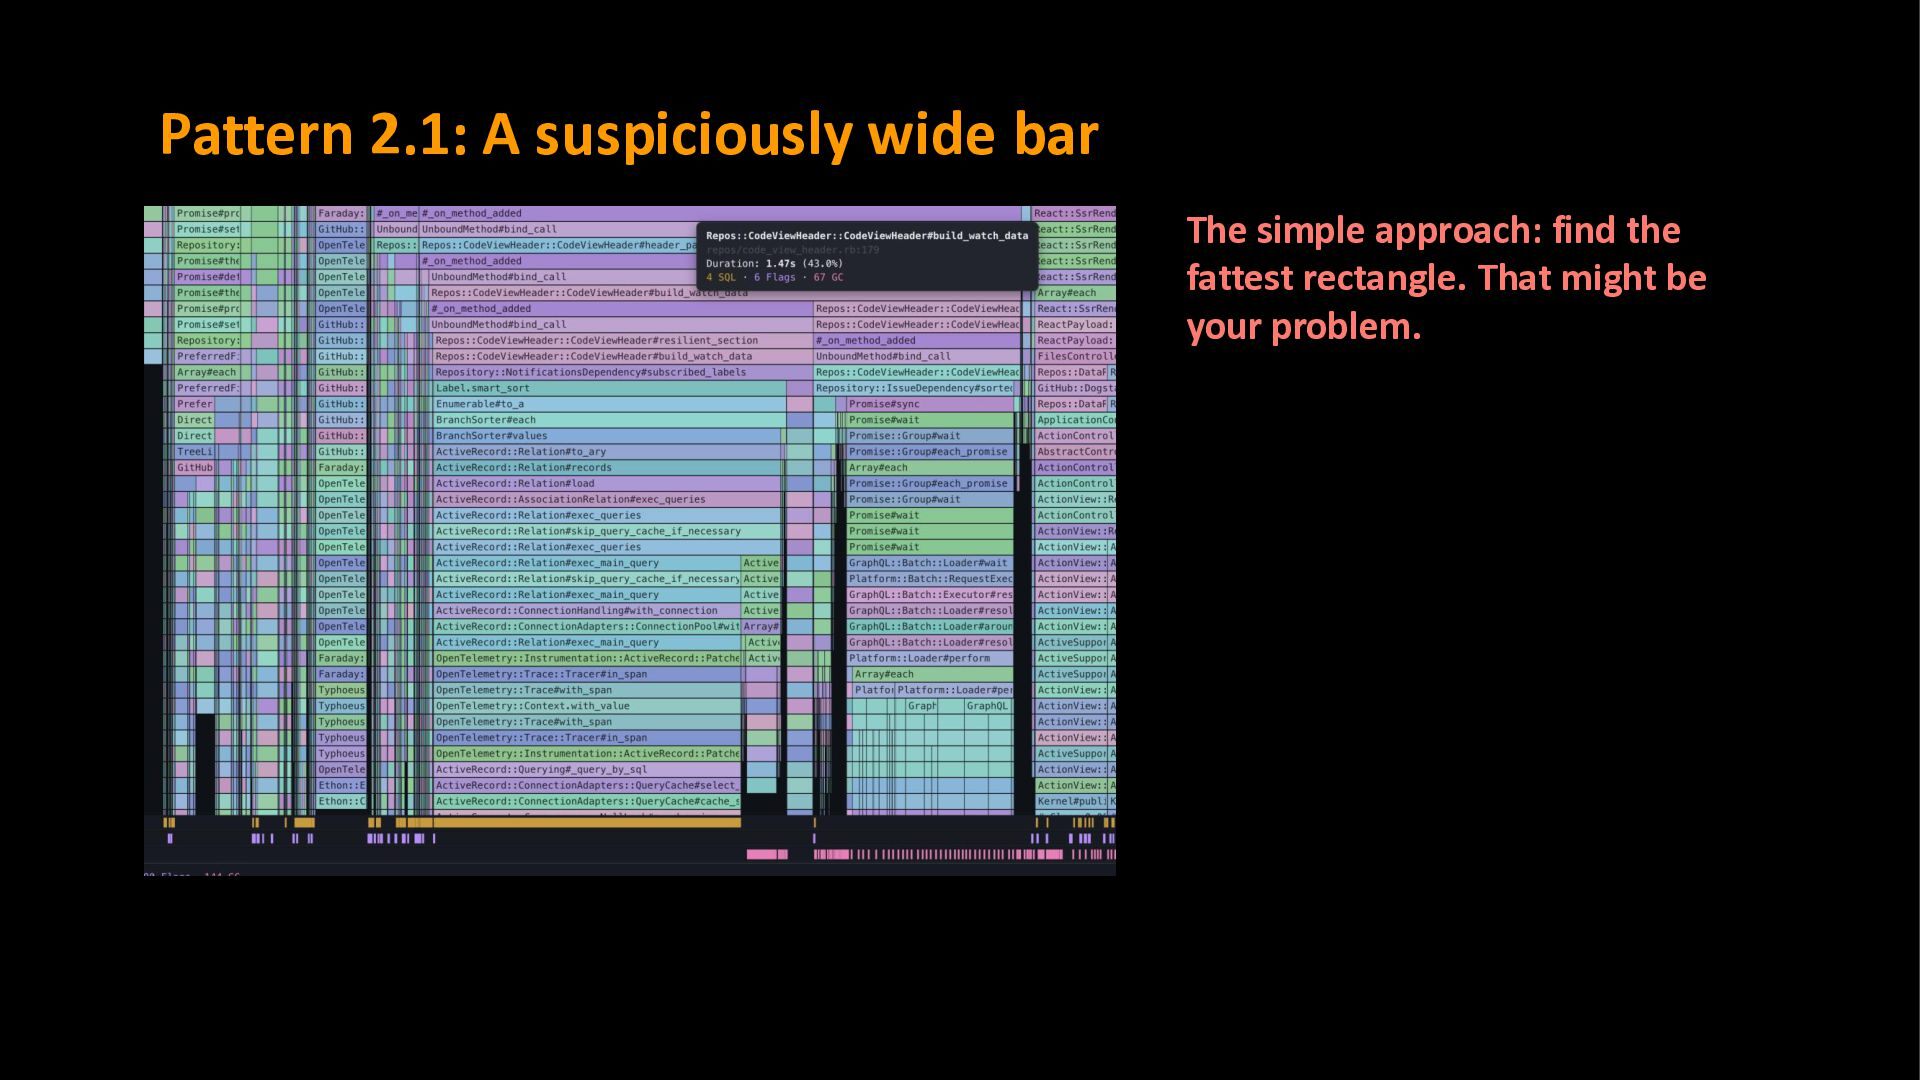
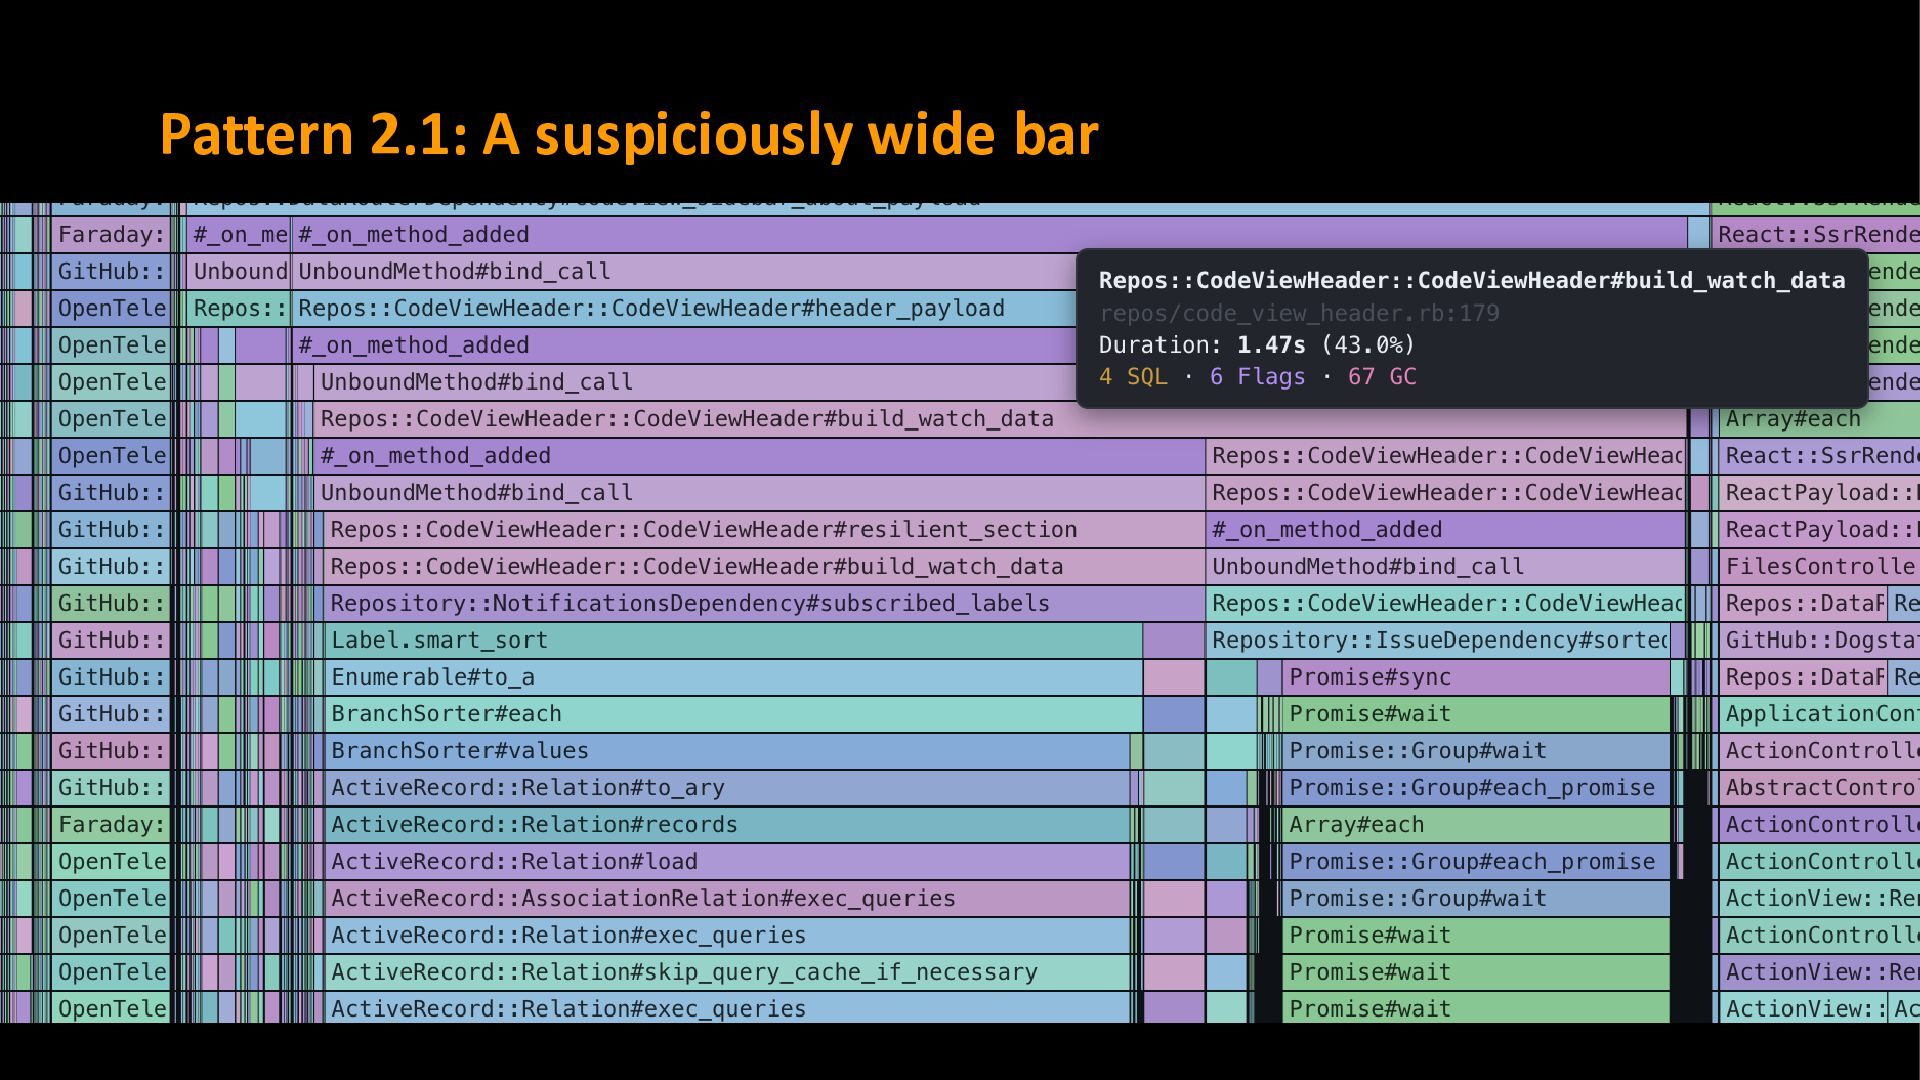
of the flamegraph viewer we can see SQL queries. An extra long bar is likely a sign of an inefficient SQL query. In our example we spend 700ms to load labels on the Watch button. The simple approach: look for big SQL blocks.
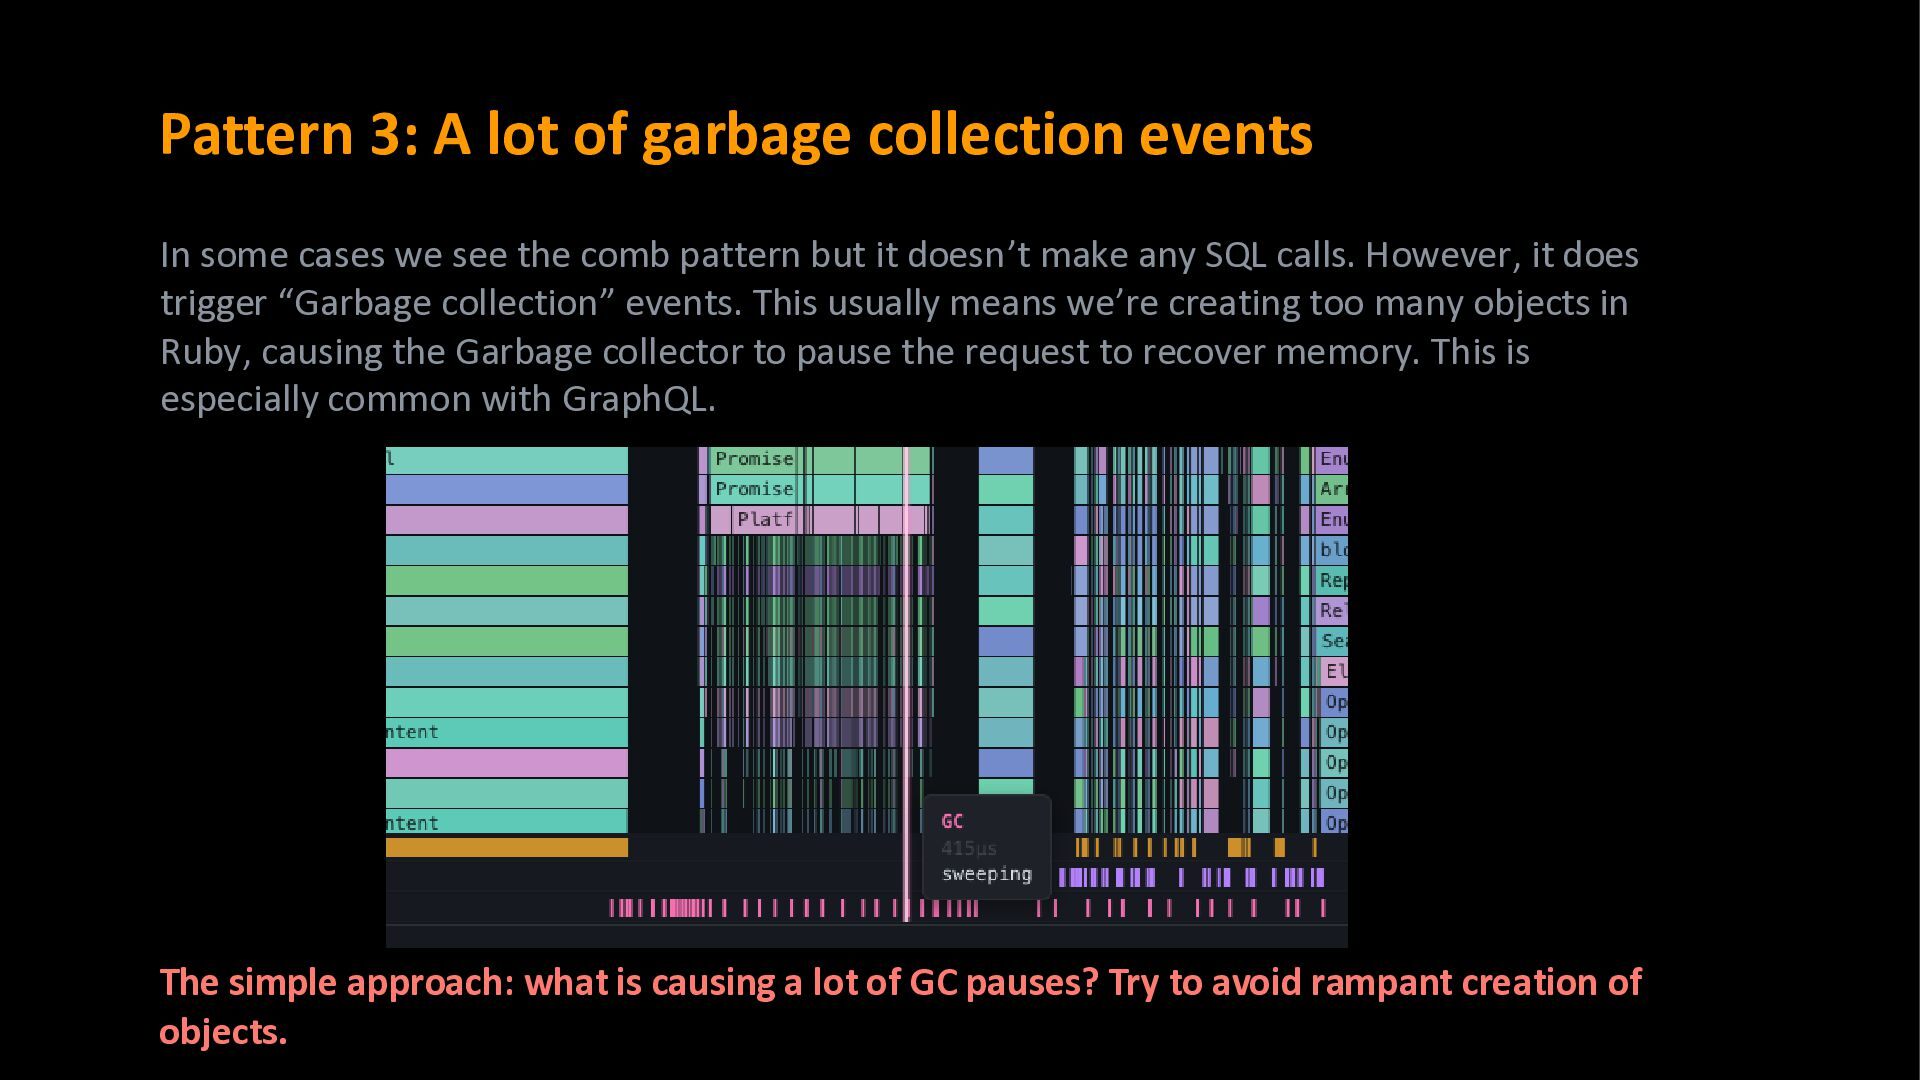
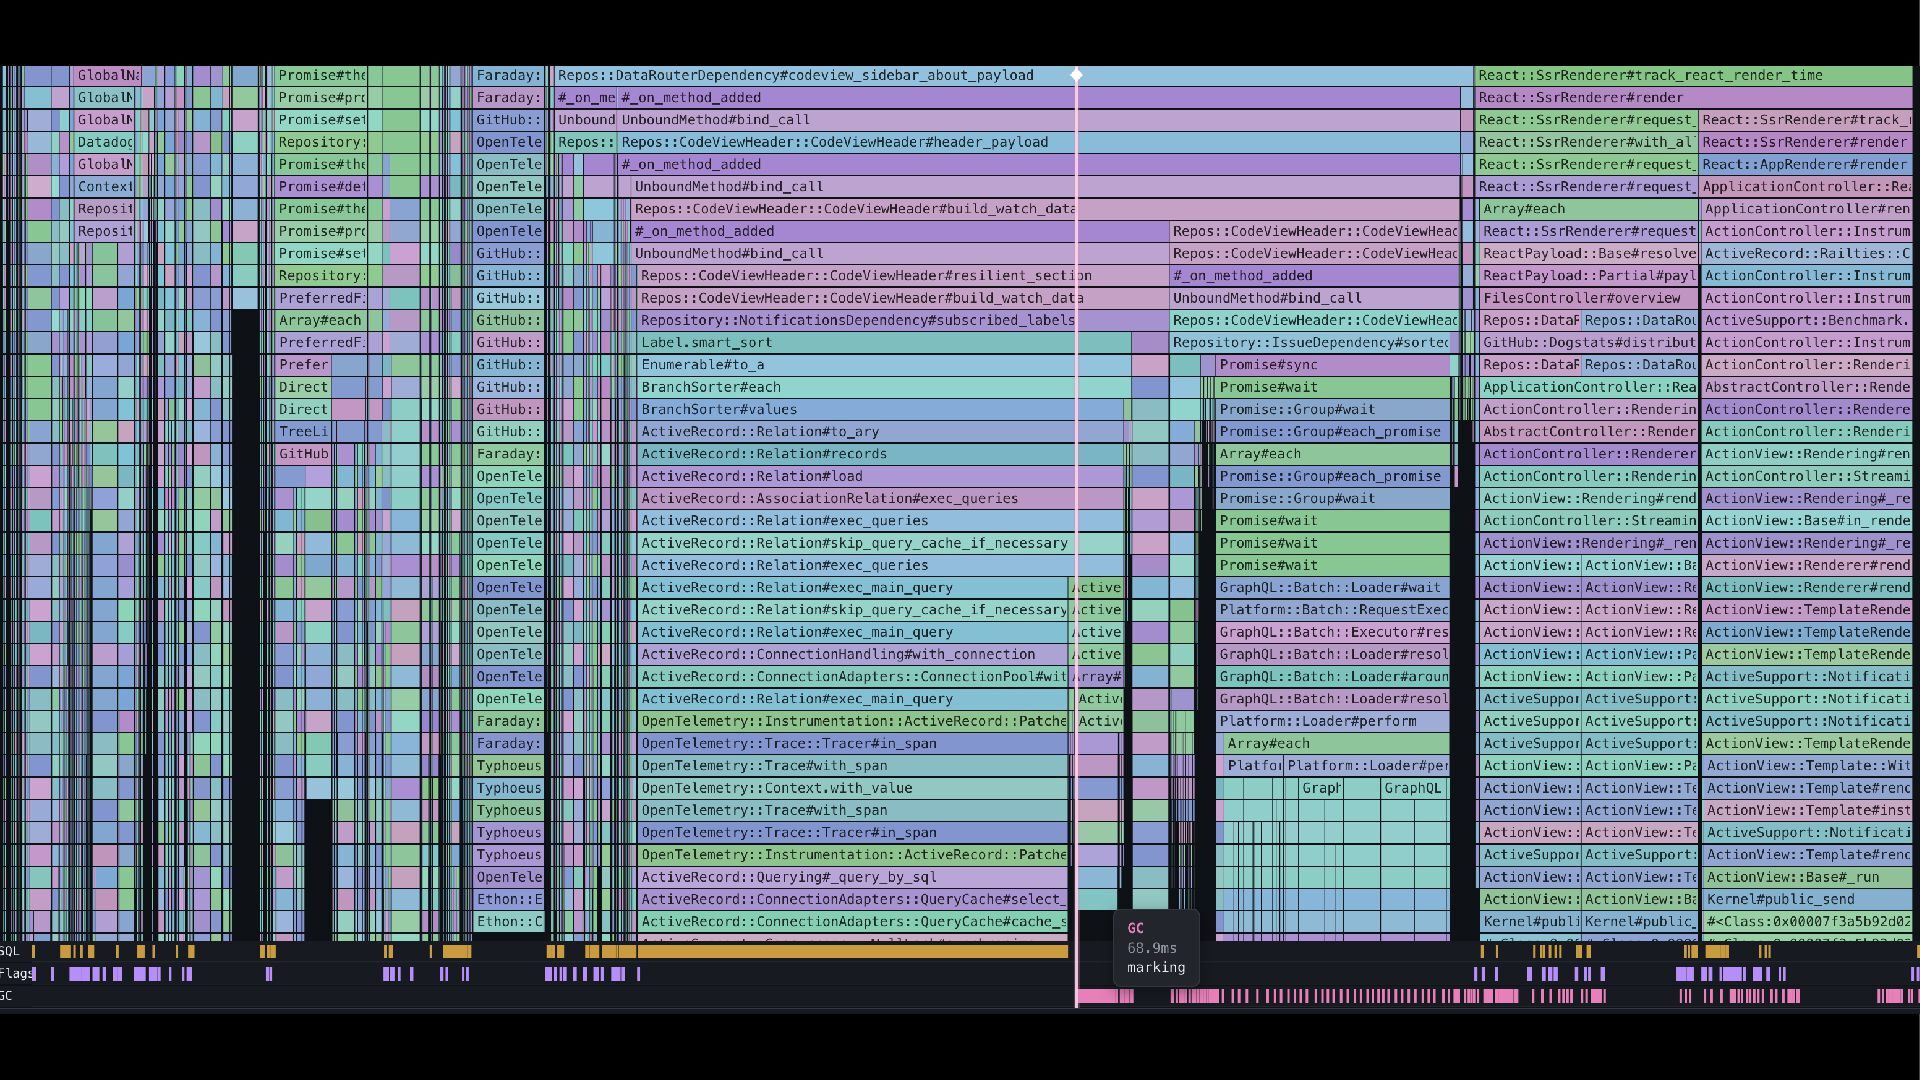
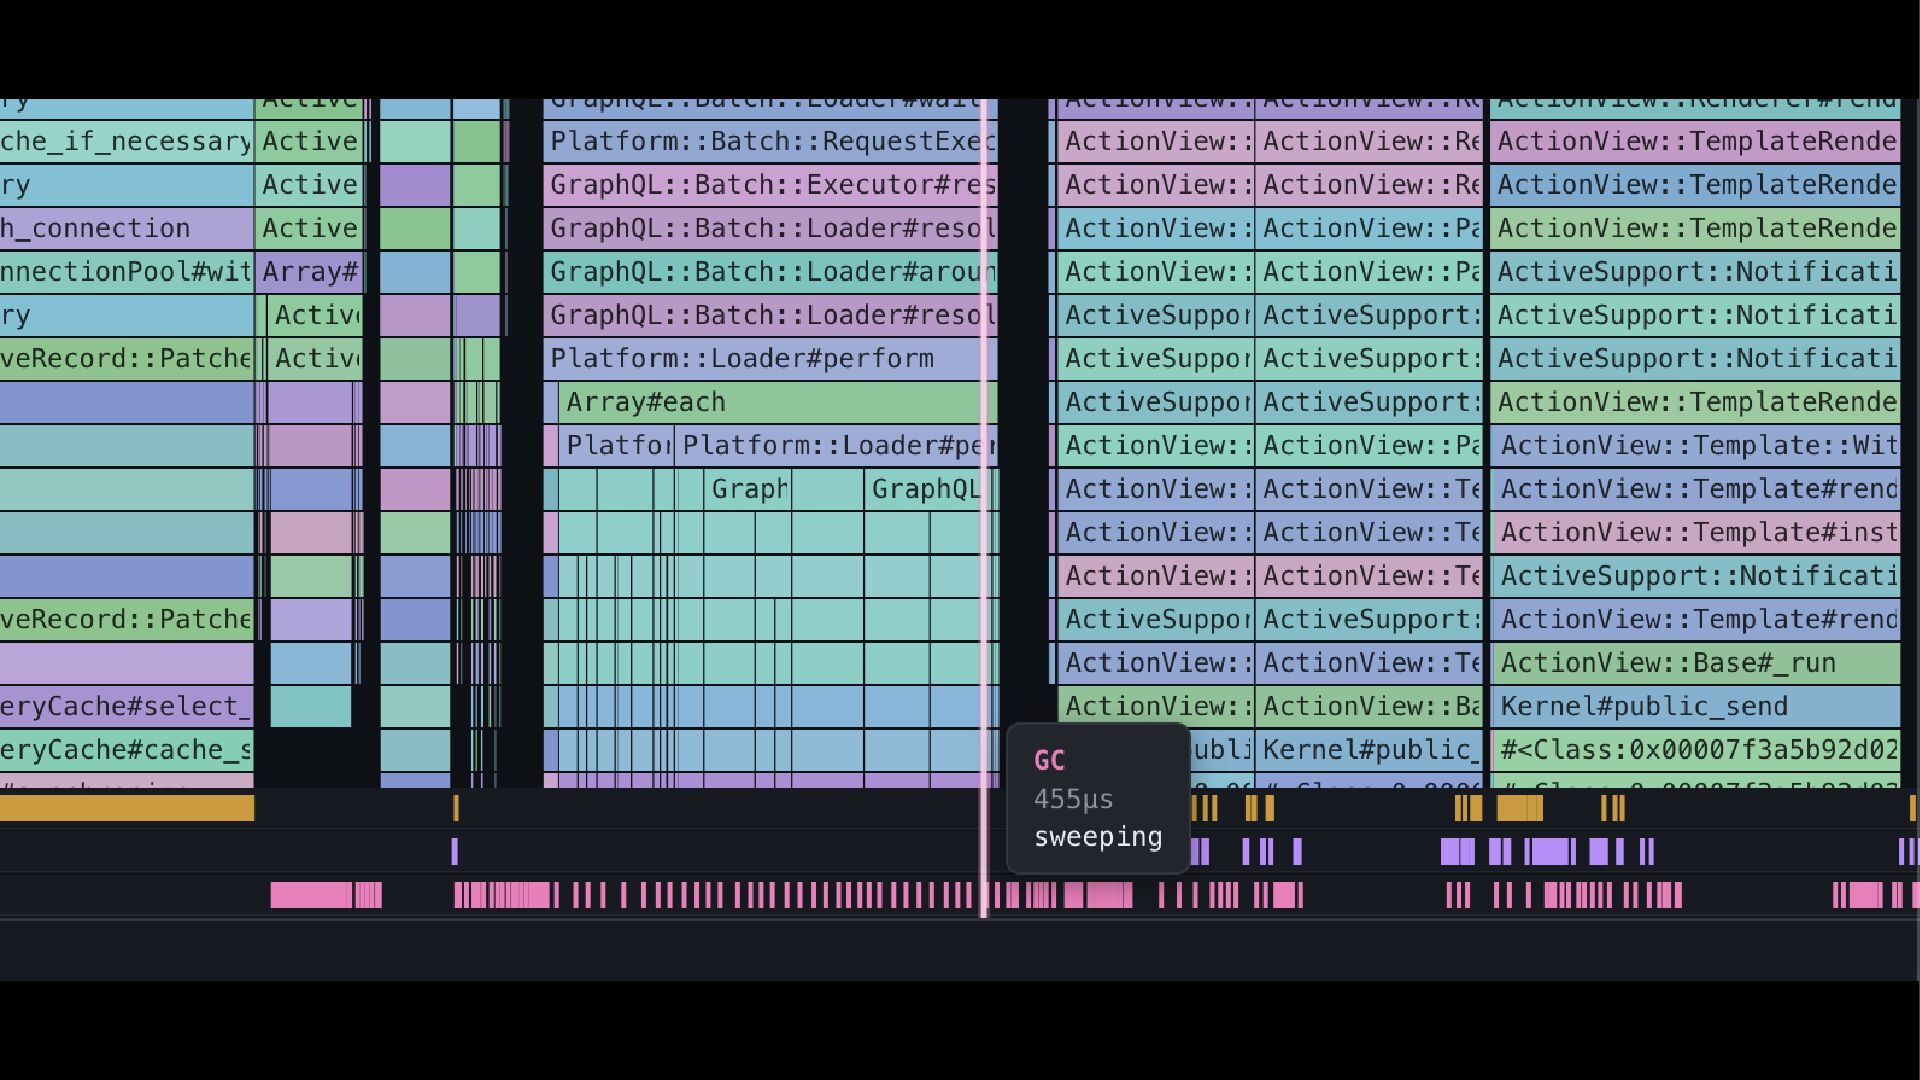
approach: what is causing a lot of GC pauses? Try to avoid rampant creation of objects. In some cases we see the comb pattern but it doesn’t make any SQL calls. However, it does trigger “Garbage collection” events. This usually means we’re creating too many objects in Ruby, causing the Garbage collector to pause the request to recover memory. This is especially common with GraphQL.
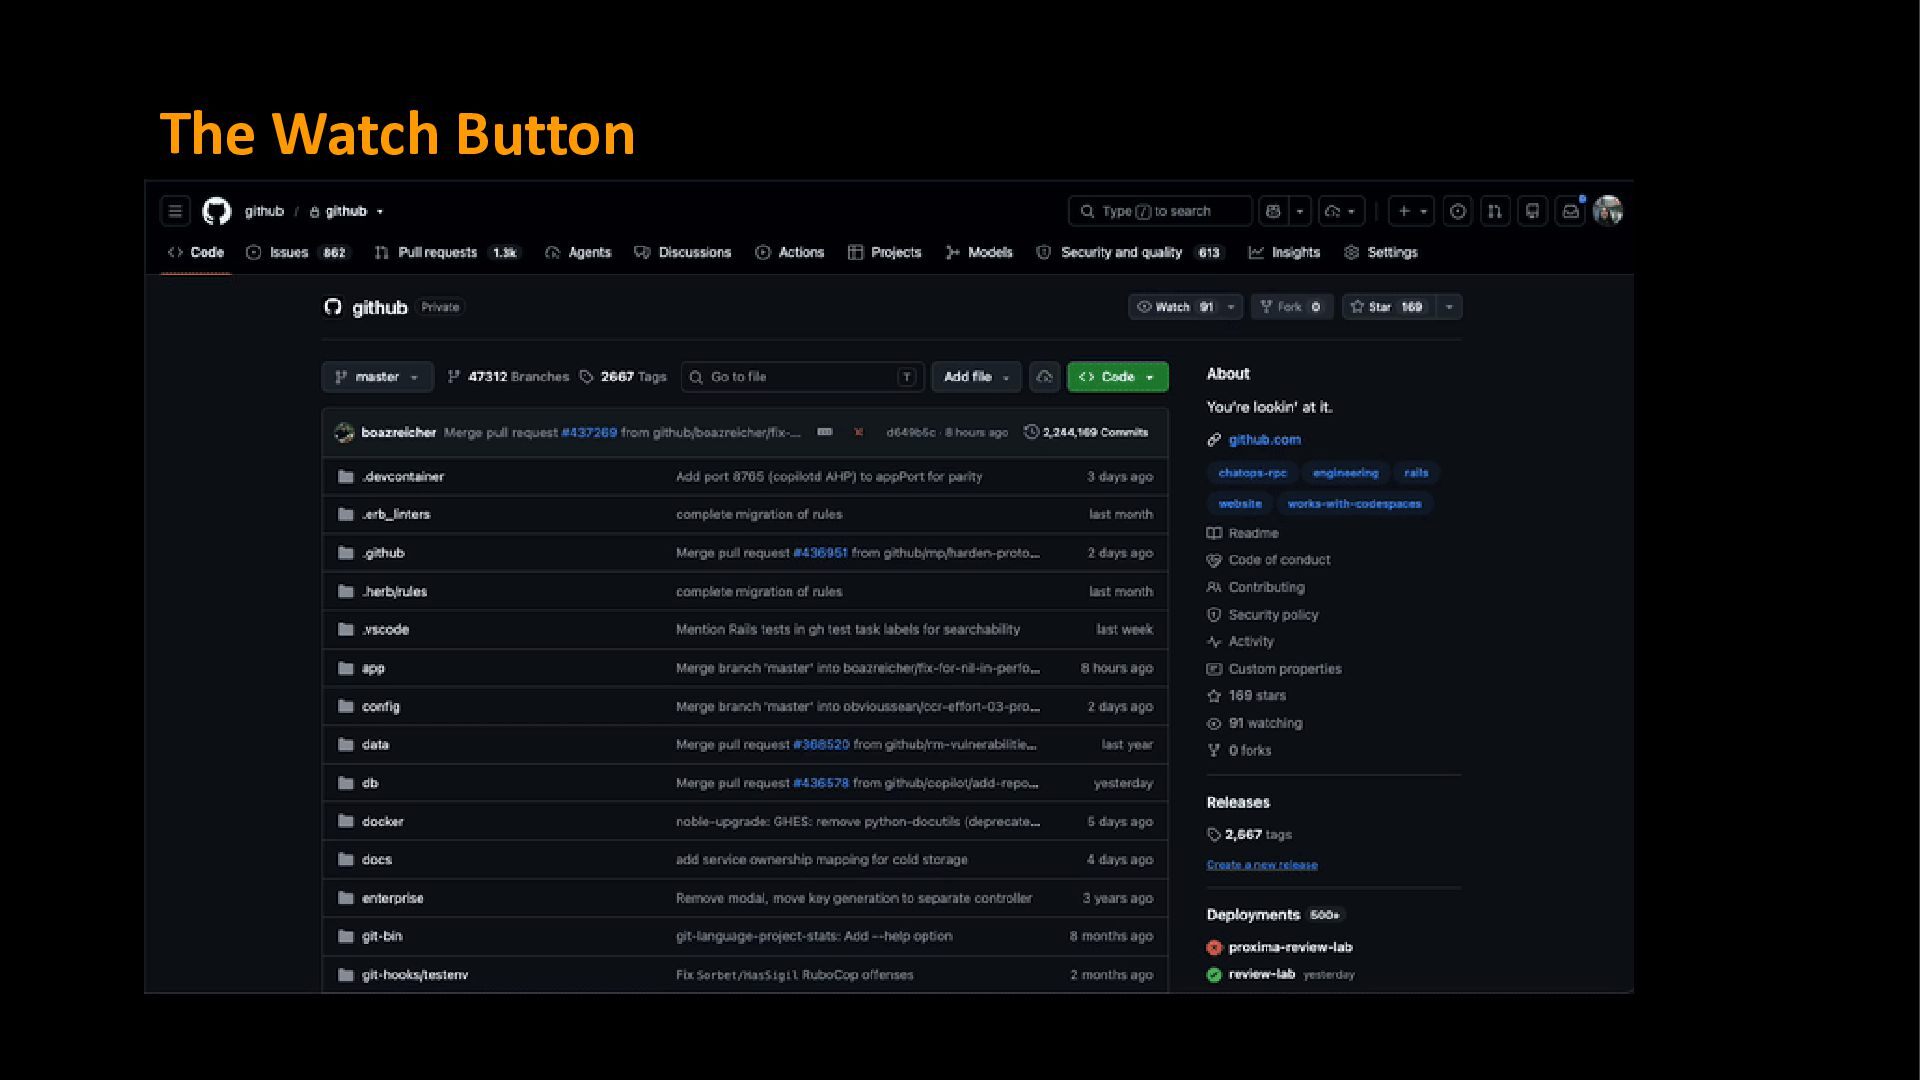
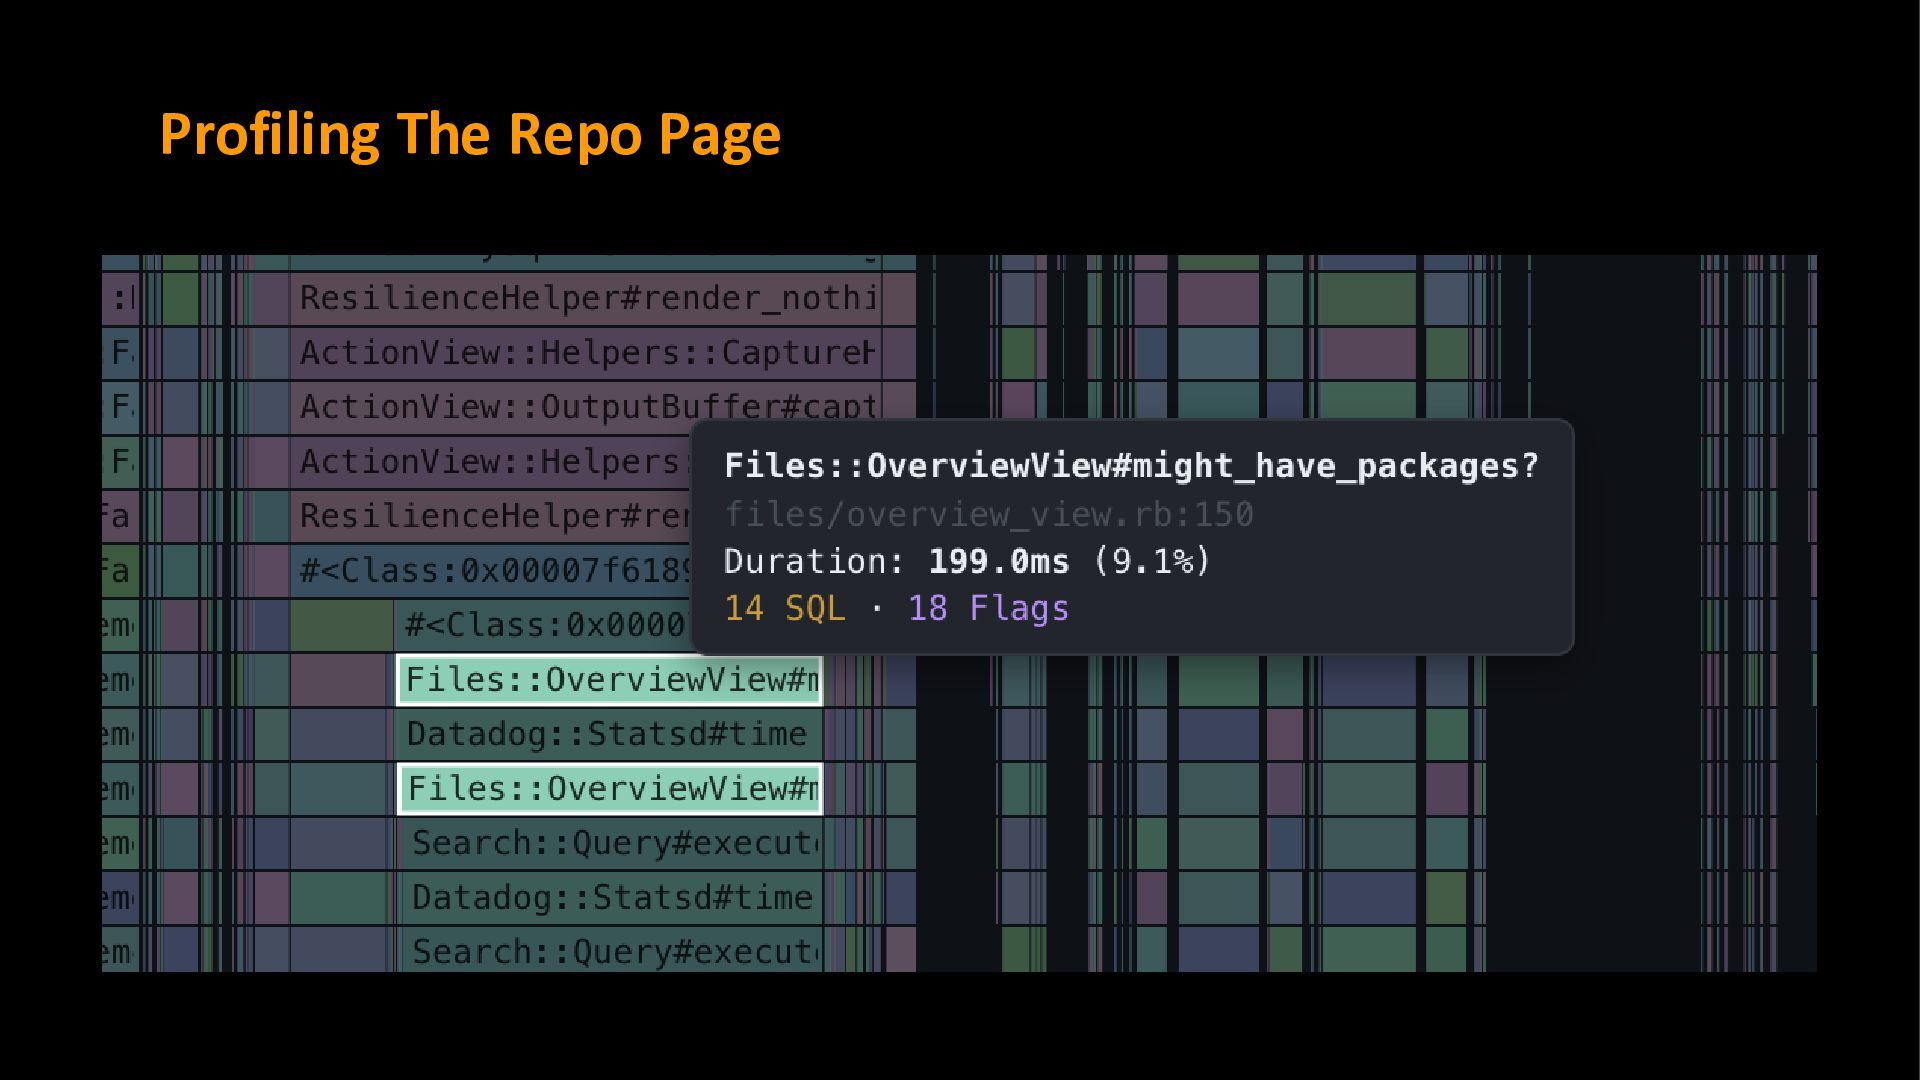
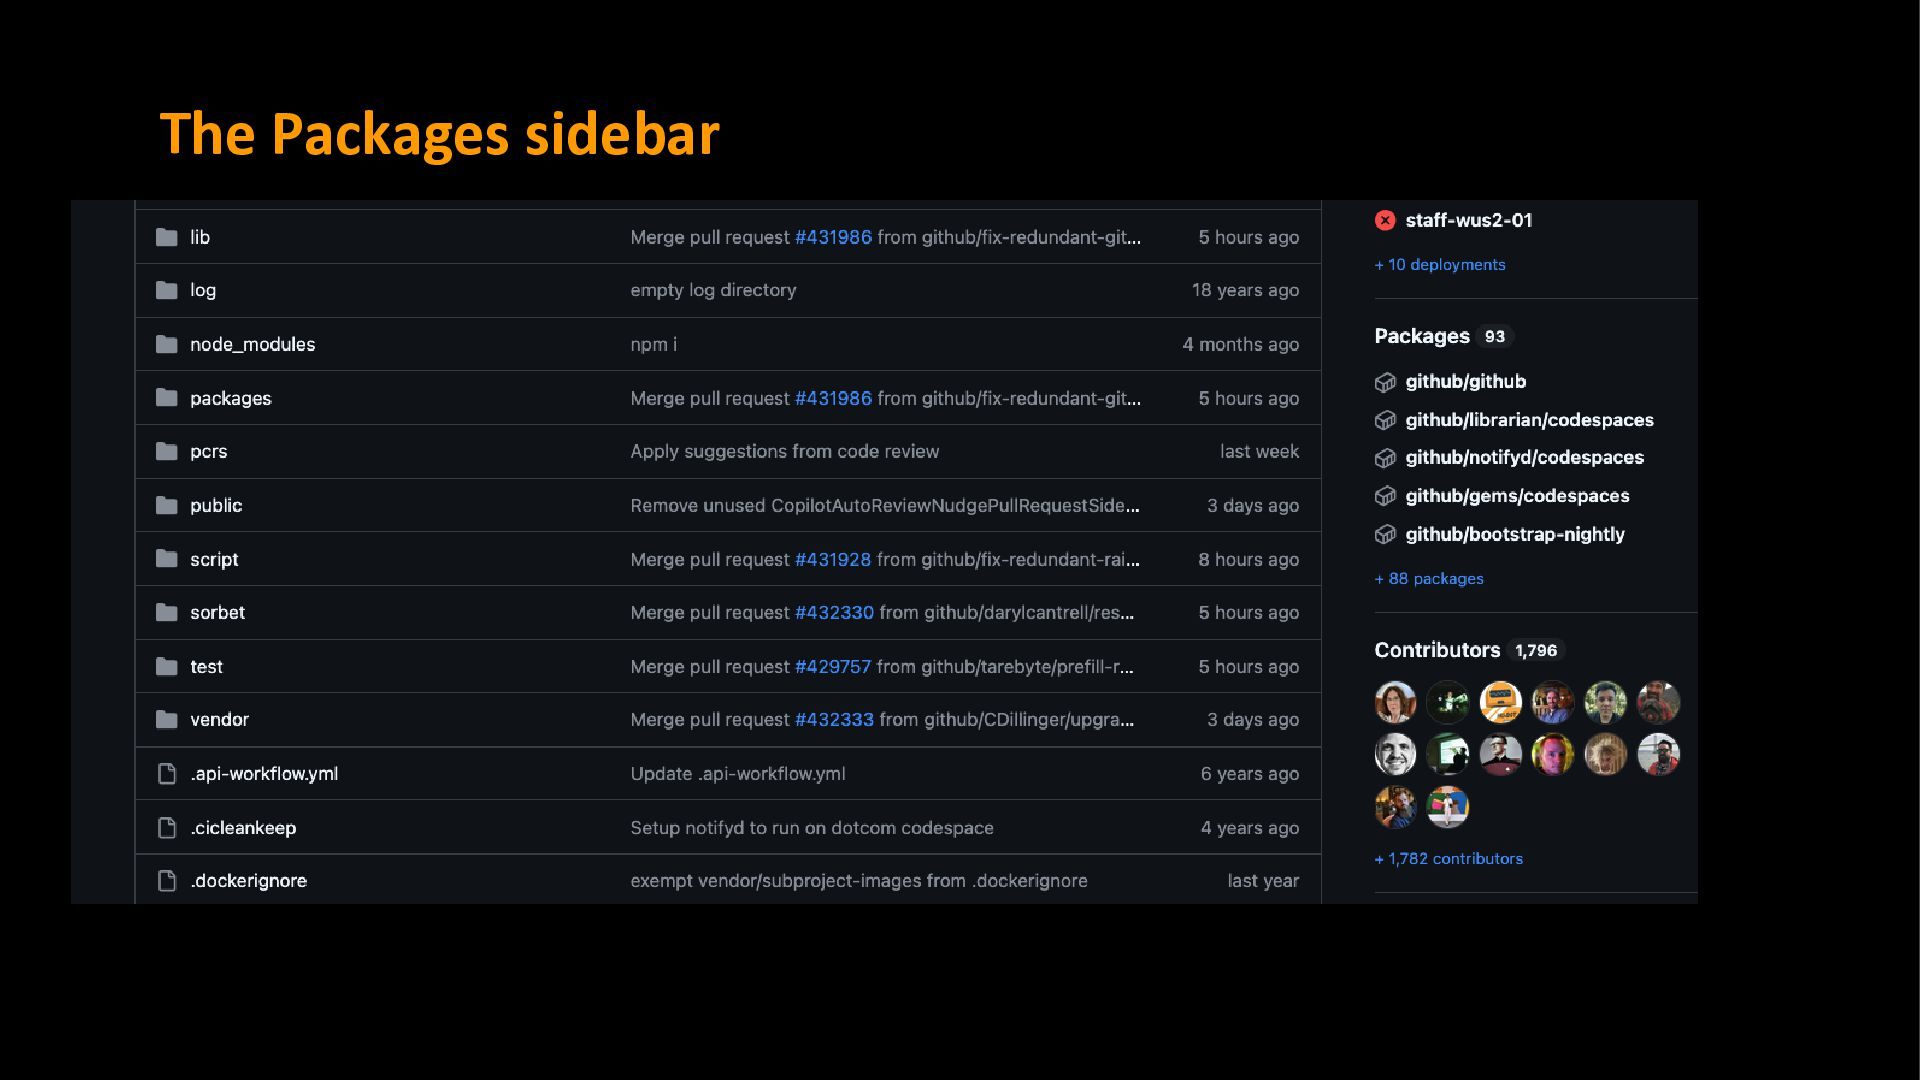
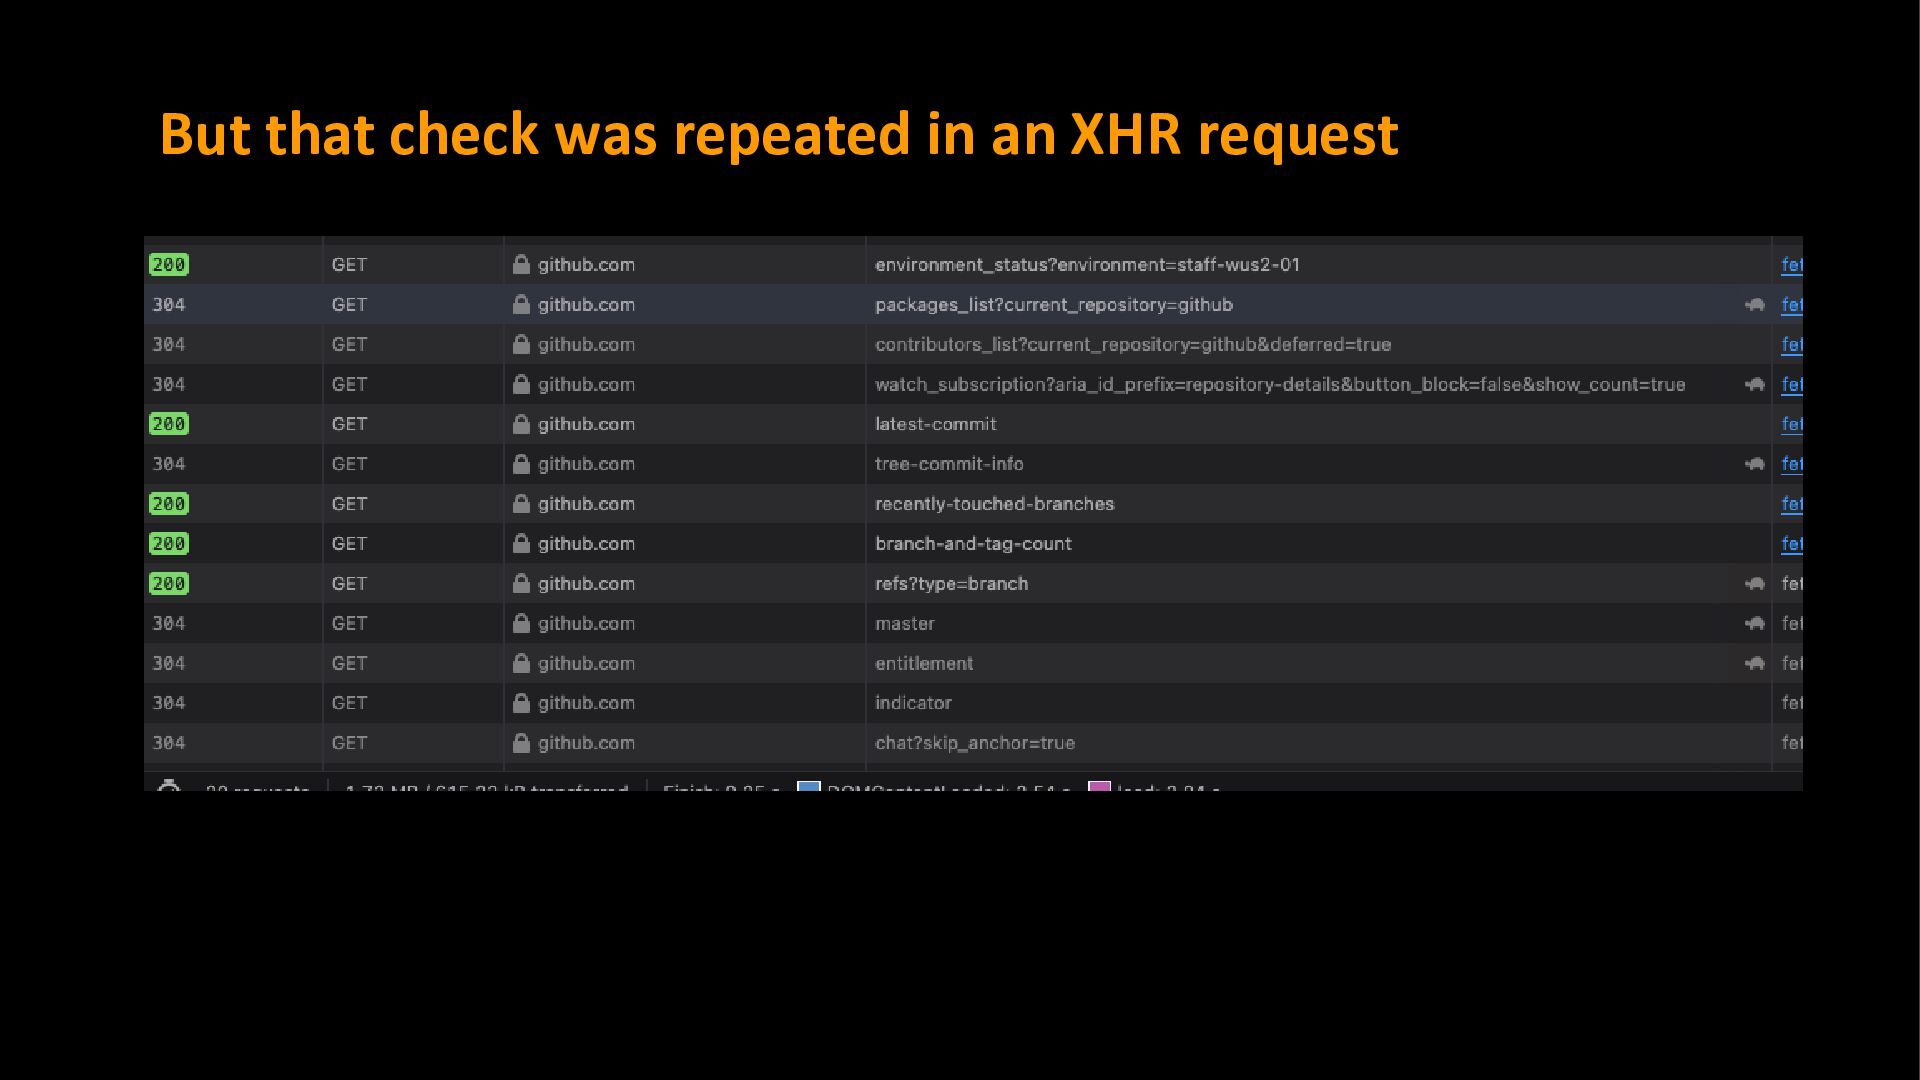
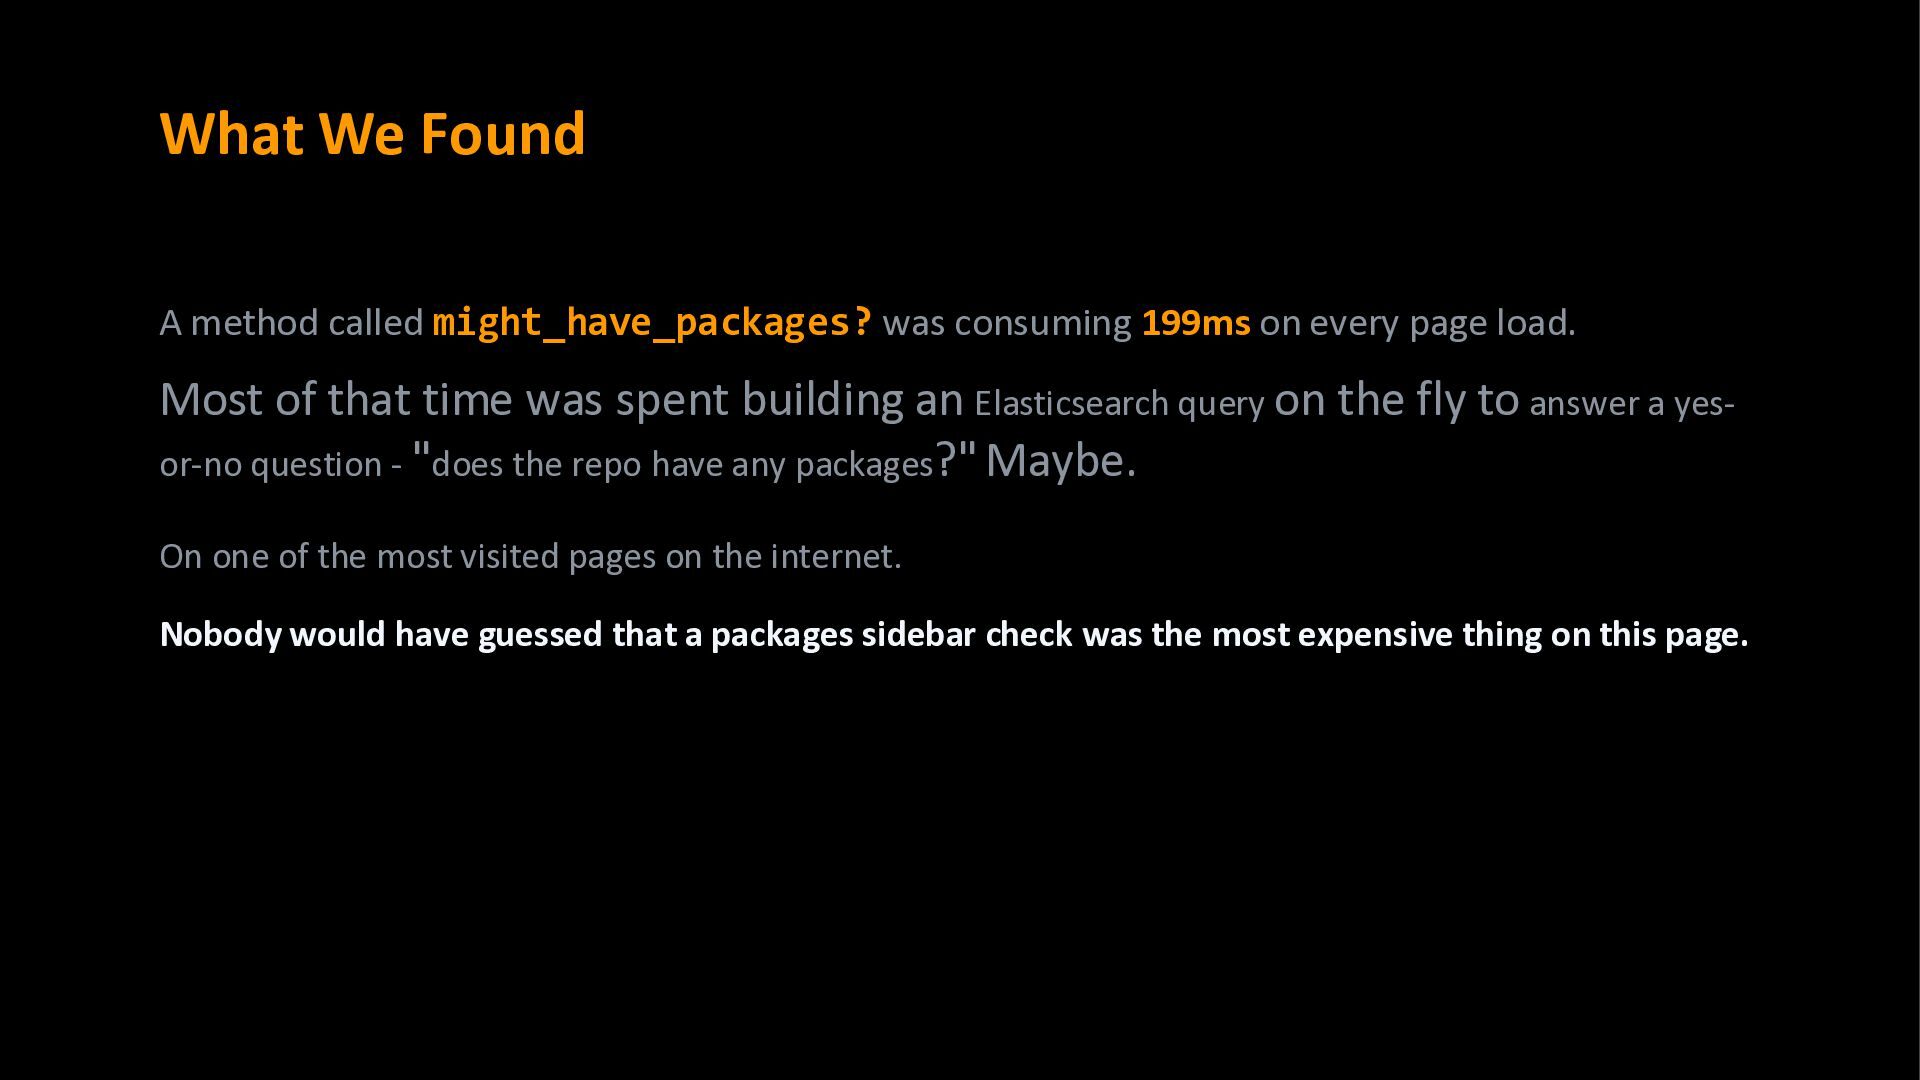
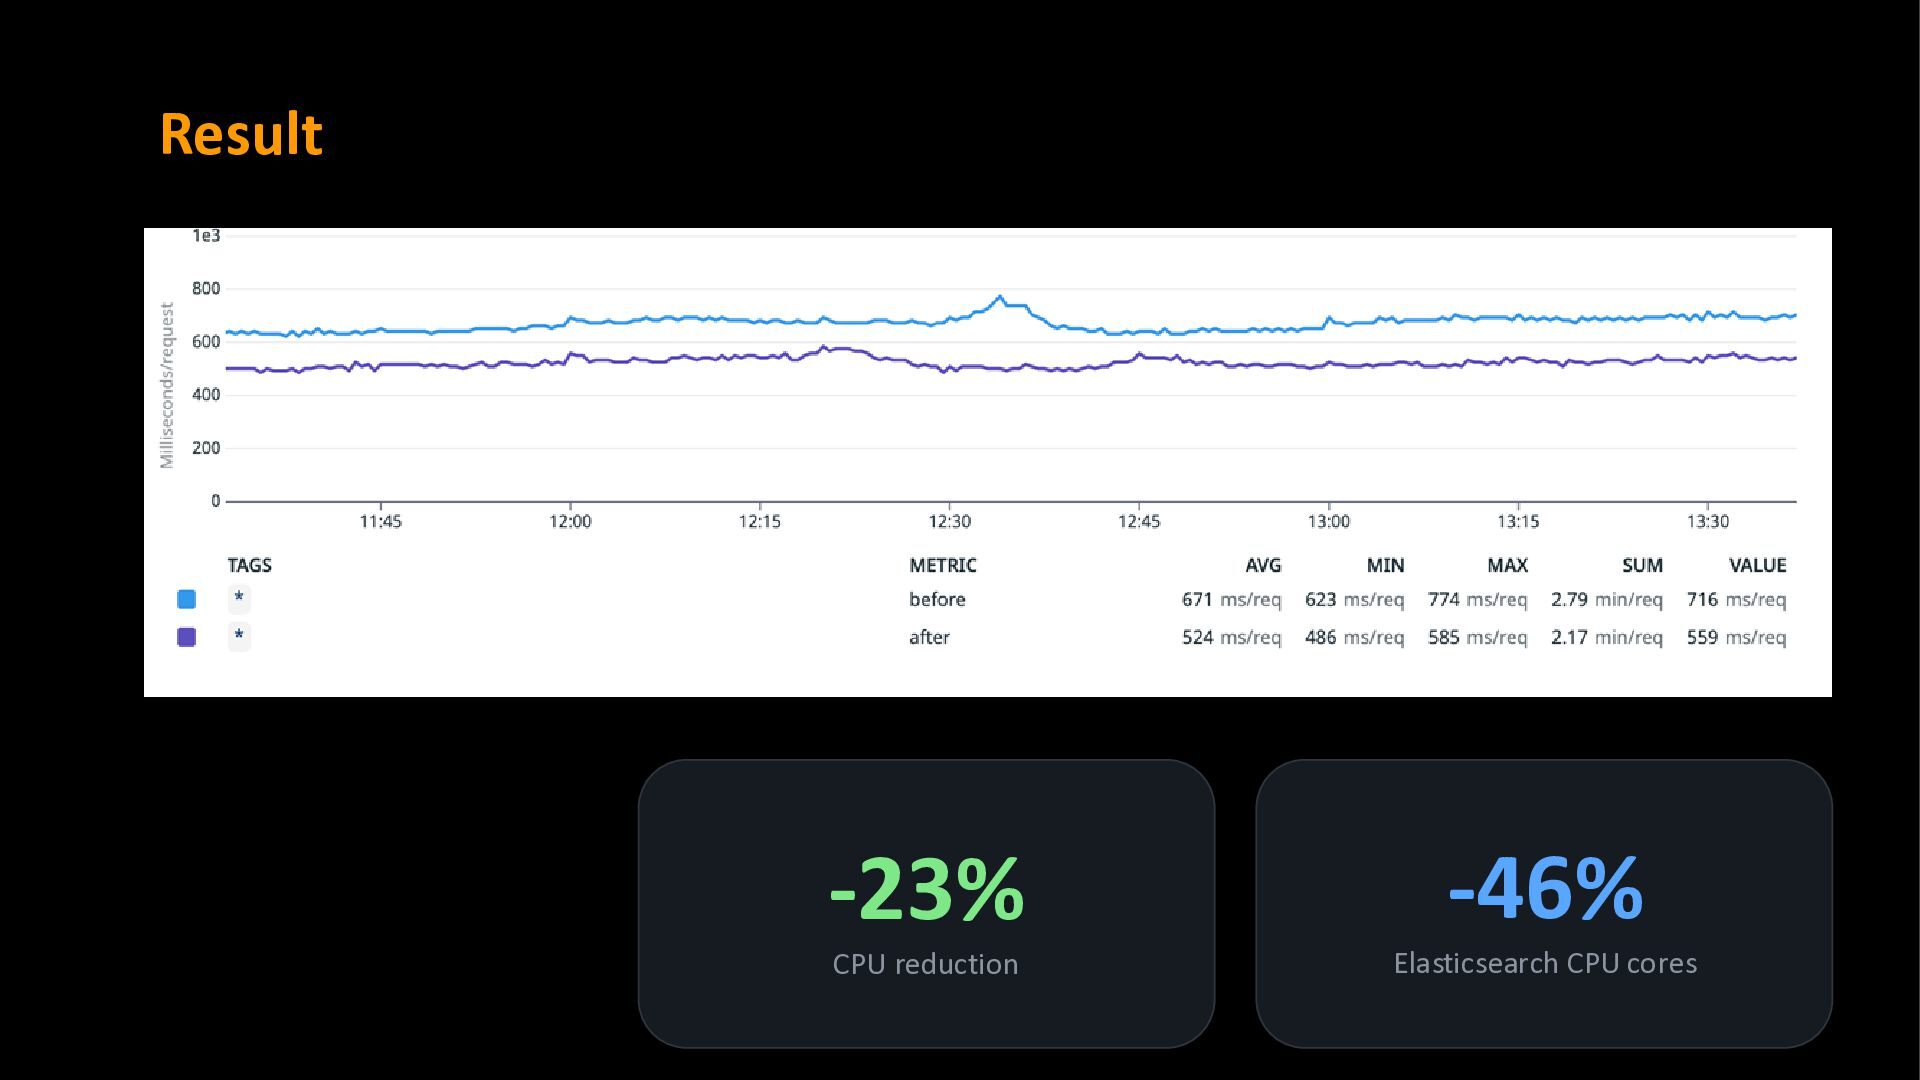
on every page load. Most of that time was spent building an Elasticsearch query on the fly to answer a yes- or-no question - "does the repo have any packages?" Maybe. On one of the most visited pages on the internet. Nobody would have guessed that a packages sidebar check was the most expensive thing on this page.
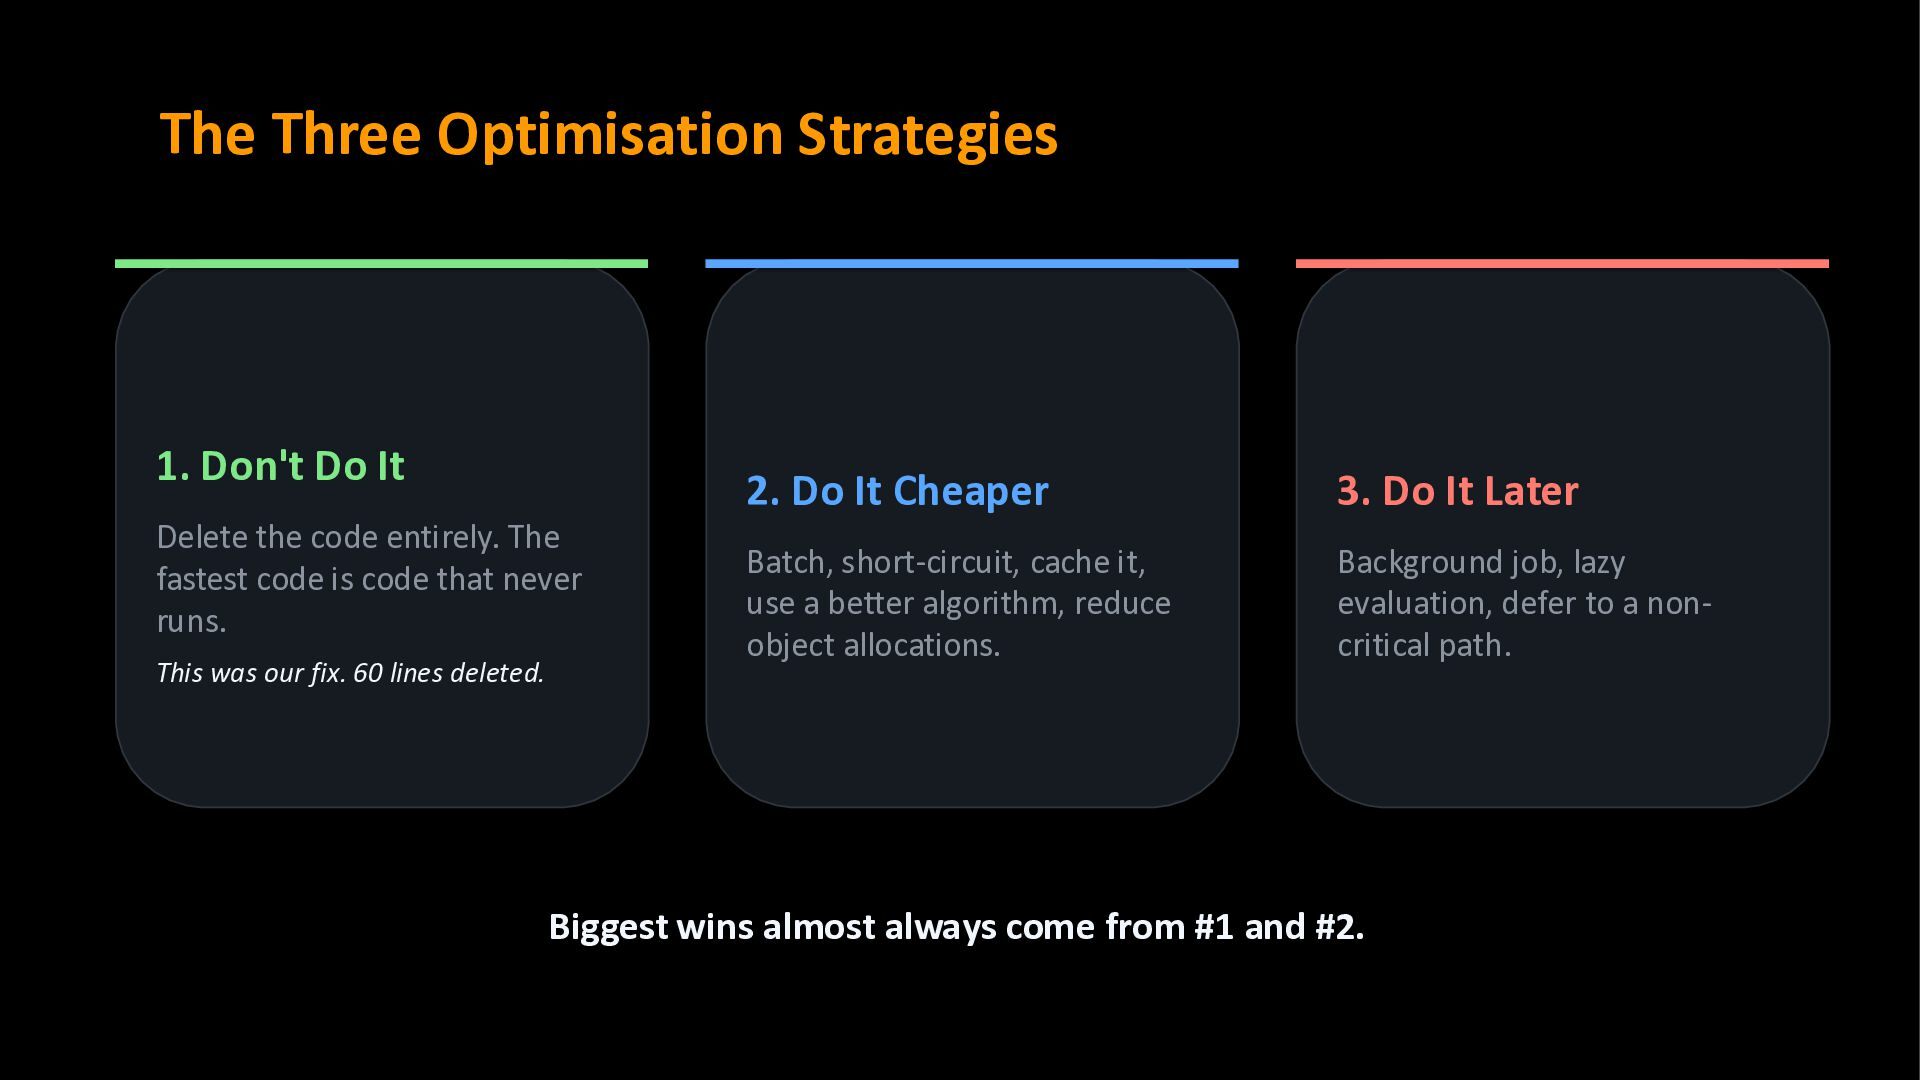
code entirely. The fastest code is code that never runs. This was our fix. 60 lines deleted. 2. Do It Cheaper Batch, short-circuit, cache it, use a better algorithm, reduce object allocations. 3. Do It Later Background job, lazy evaluation, defer to a non- critical path. Biggest wins almost always come from #1 and #2.
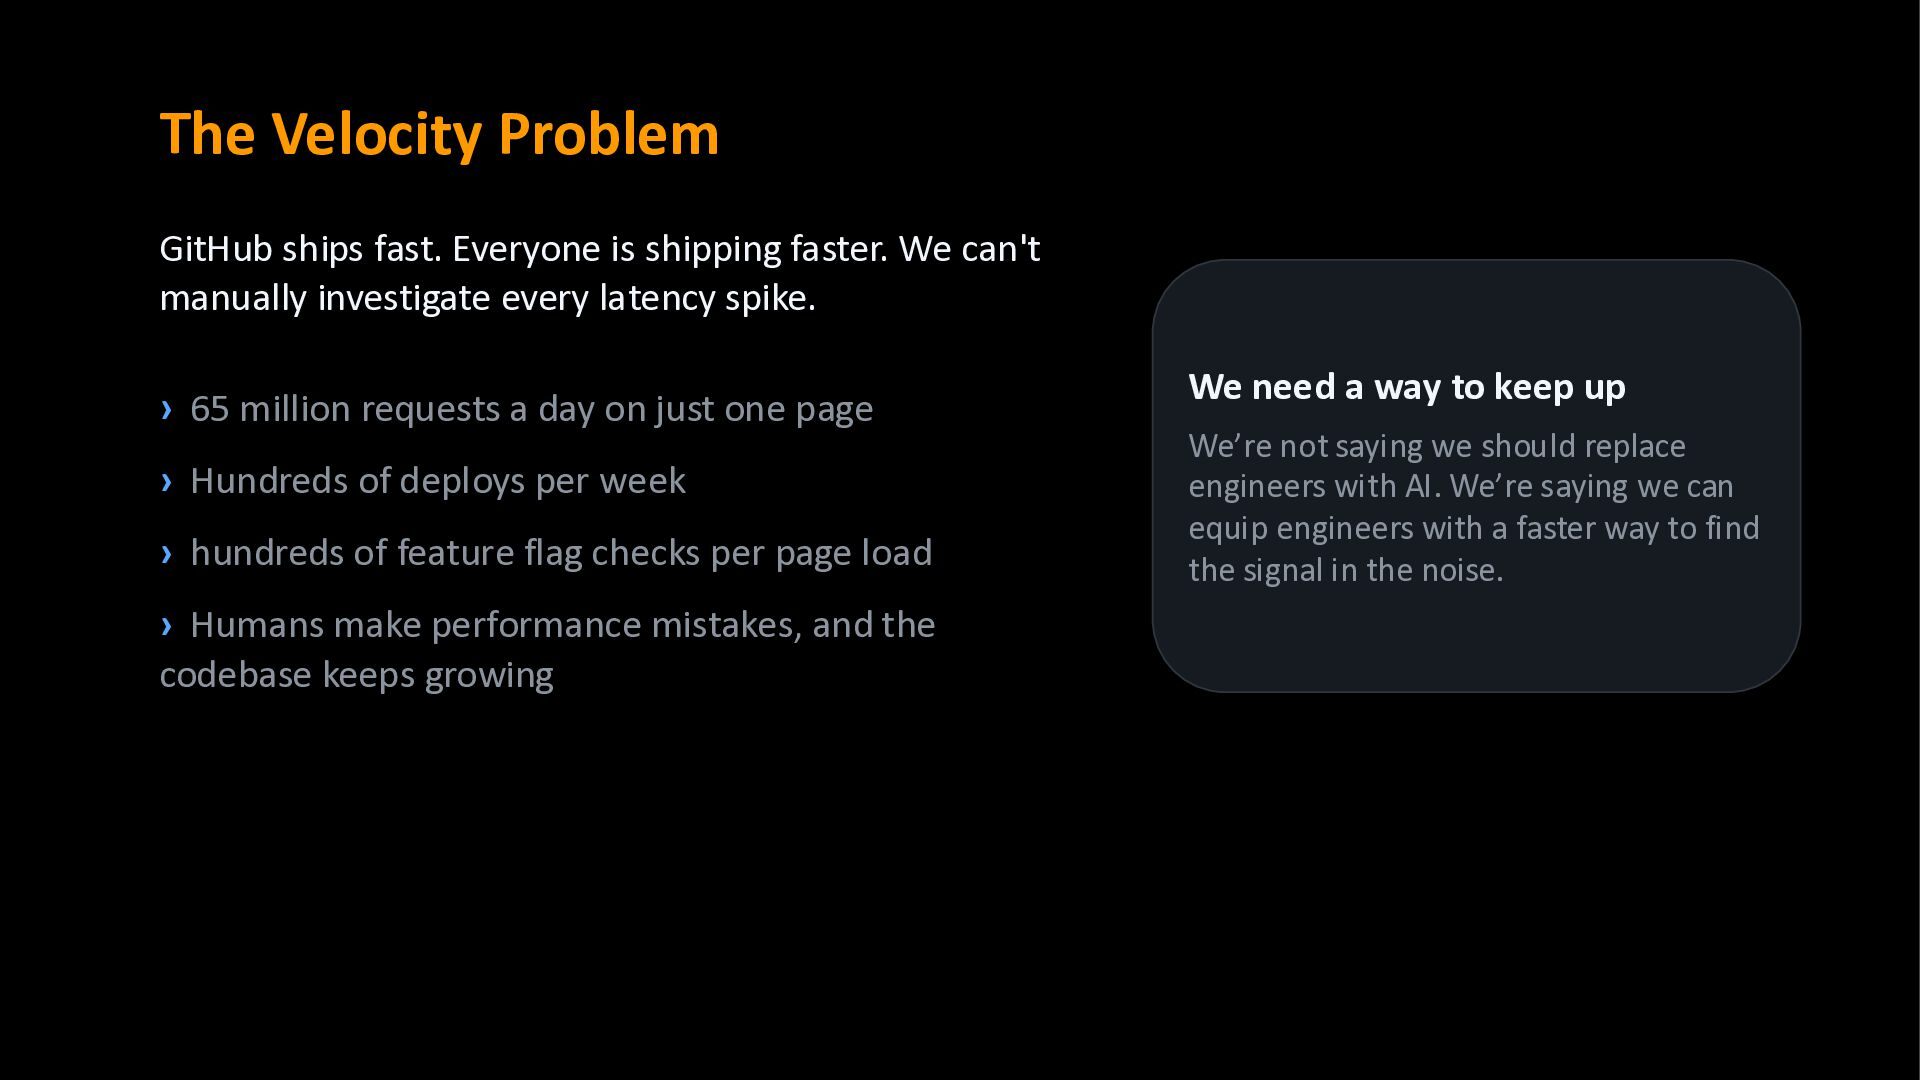
We can't manually investigate every latency spike. › 65 million requests a day on just one page › Hundreds of deploys per week › hundreds of feature flag checks per page load › Humans make performance mistakes, and the codebase keeps growing We need a way to keep up We’re not saying we should replace engineers with AI. We’re saying we can equip engineers with a faster way to find the signal in the noise.
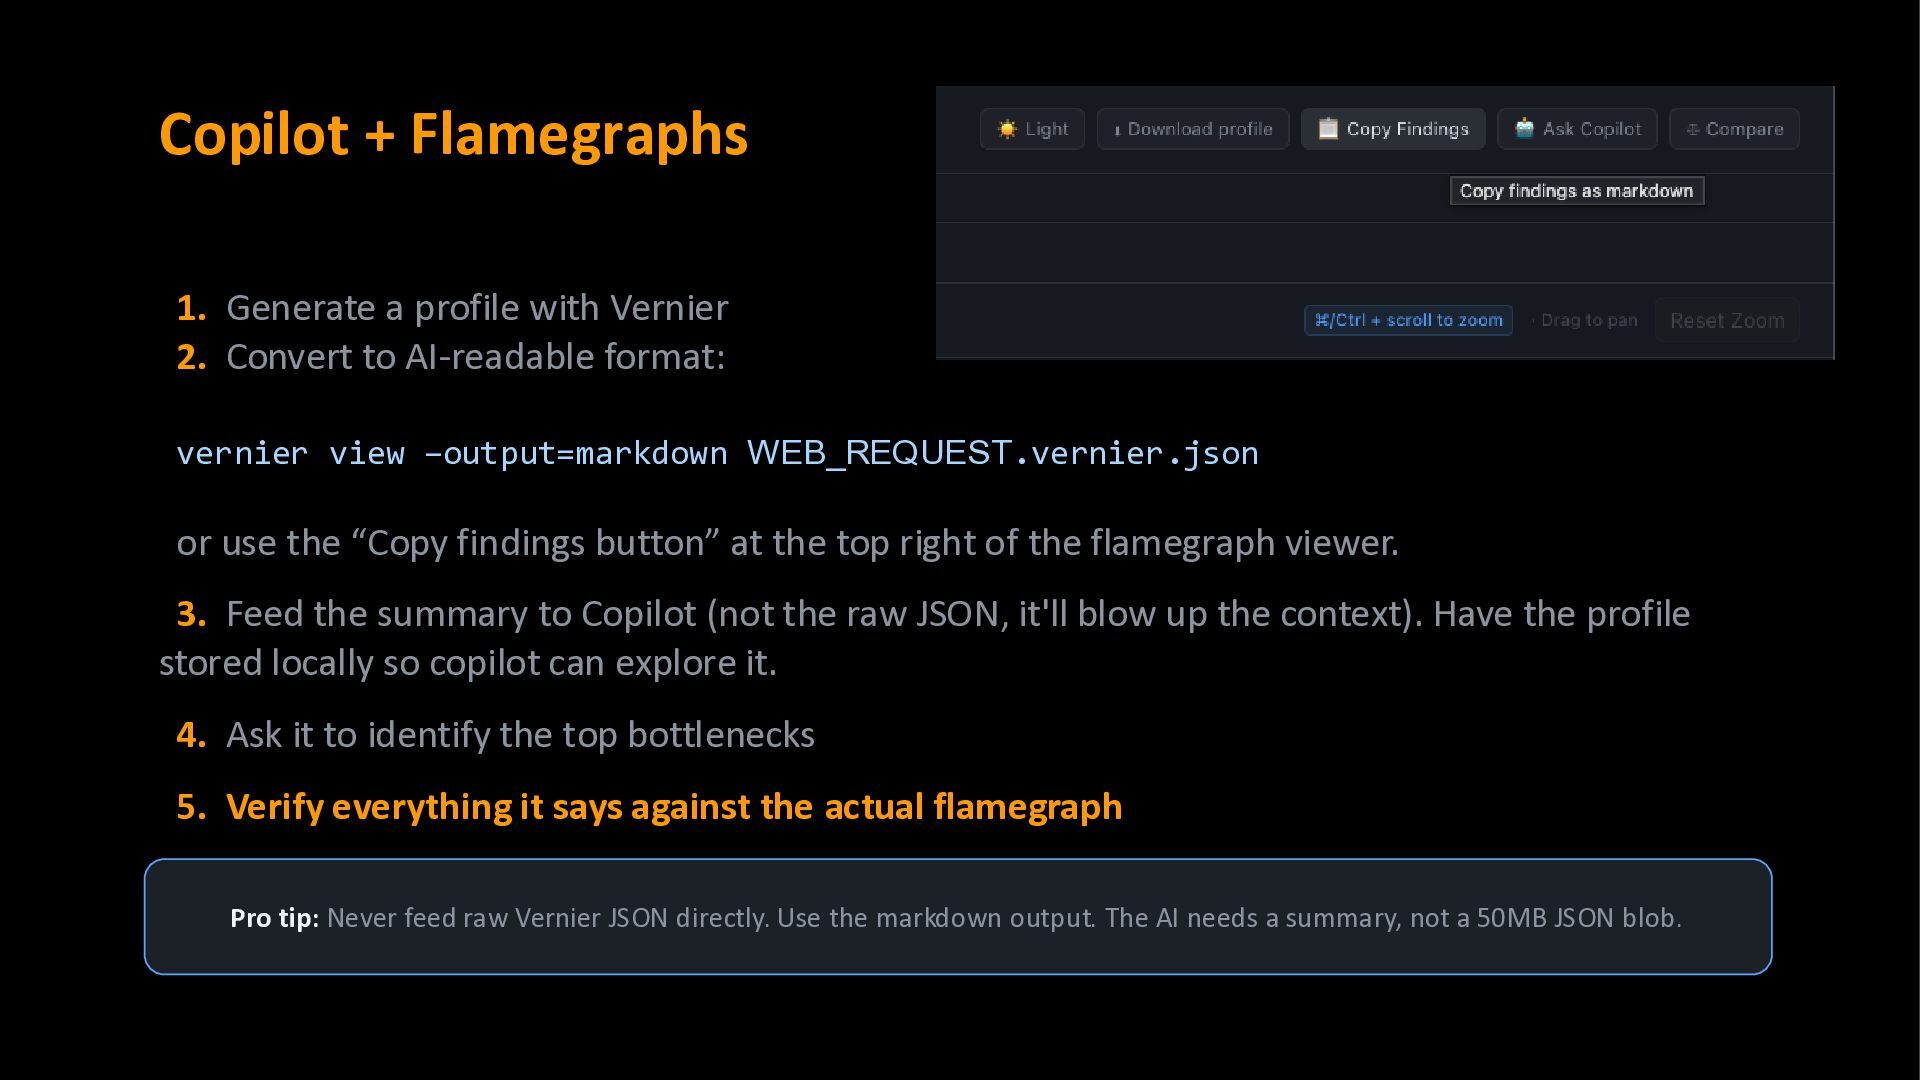
Convert to AI-readable format: vernier view –output=markdown WEB_REQUEST.vernier.json or use the “Copy findings button” at the top right of the flamegraph viewer. 3. Feed the summary to Copilot (not the raw JSON, it'll blow up the context). Have the profile stored locally so copilot can explore it. 4. Ask it to identify the top bottlenecks 5. Verify everything it says against the actual flamegraph Pro tip: Never feed raw Vernier JSON directly. Use the markdown output. The AI needs a summary, not a 50MB JSON blob.
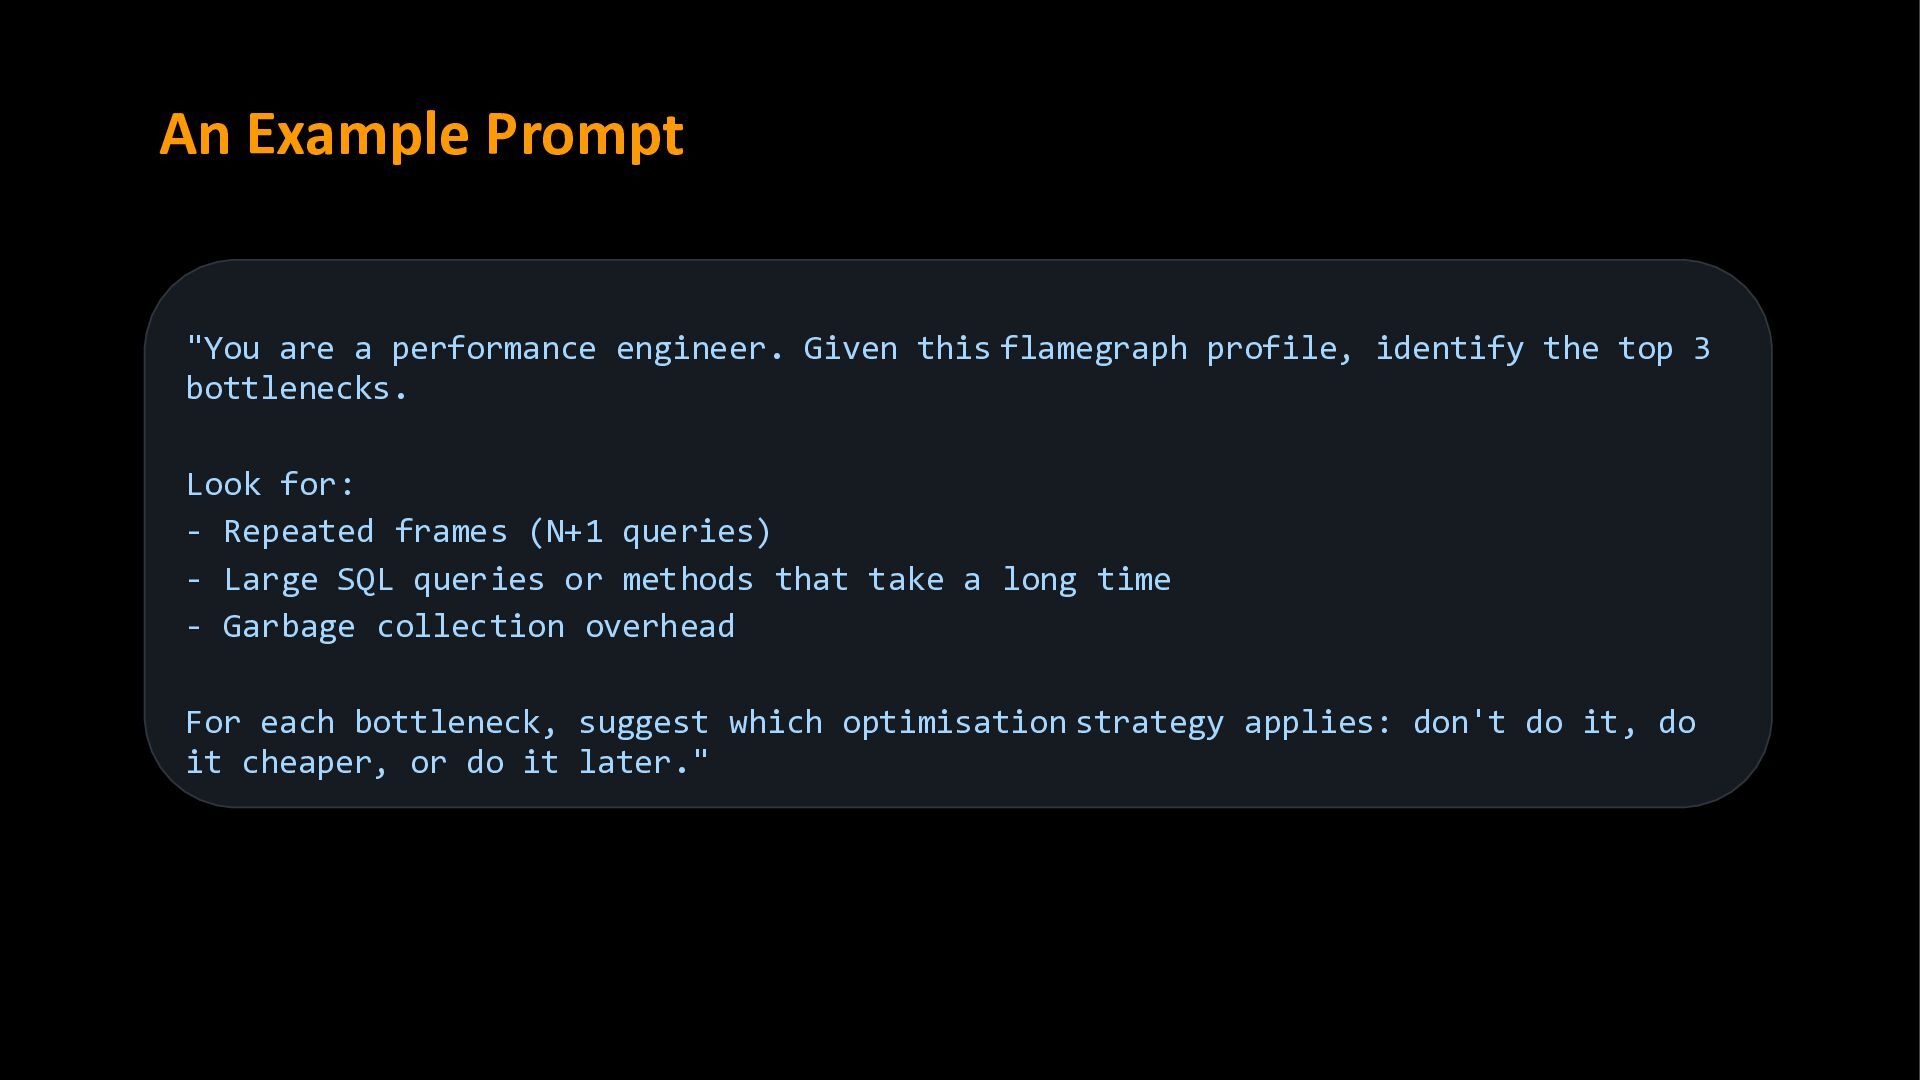
flamegraph profile, identify the top 3 bottlenecks. Look for: - Repeated frames (N+1 queries) - Large SQL queries or methods that take a long time - Garbage collection overhead For each bottleneck, suggest which optimisation strategy applies: don't do it, do it cheaper, or do it later."
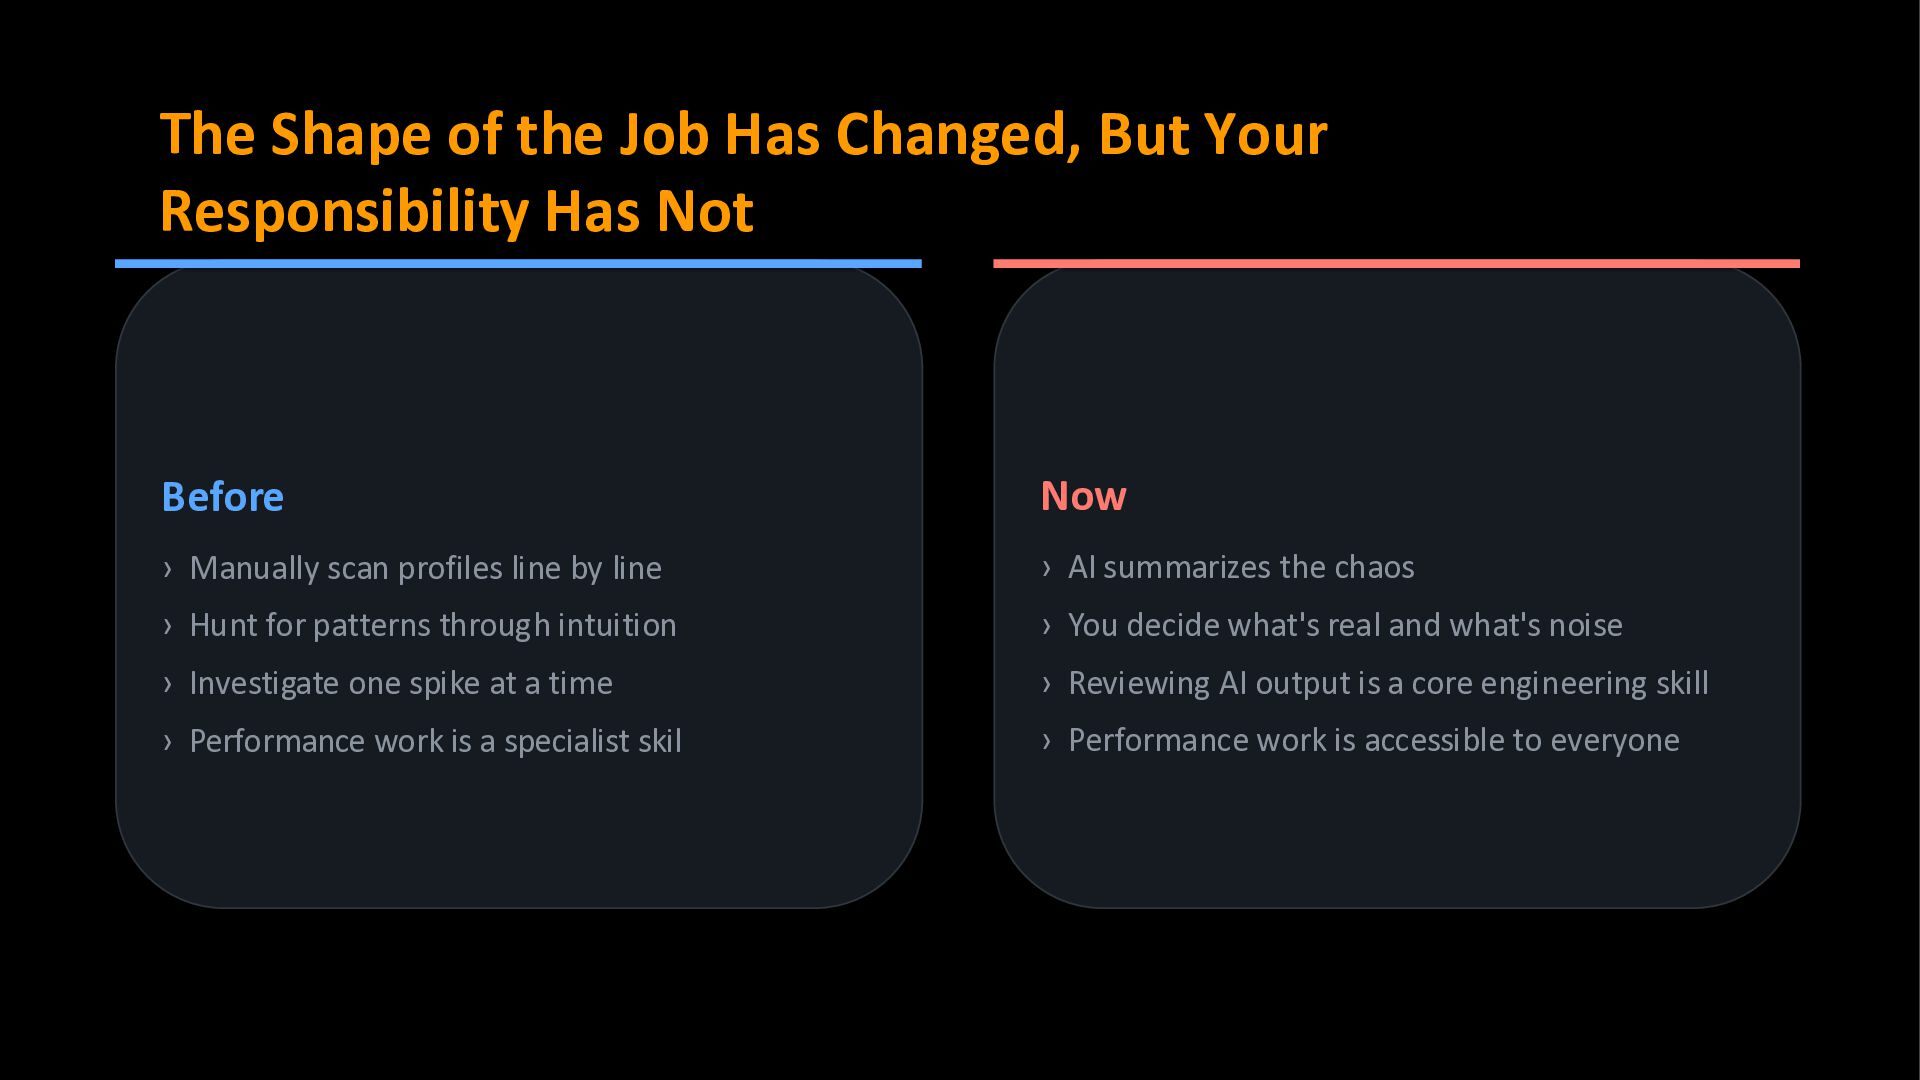
Has Not Before › Manually scan profiles line by line › Hunt for patterns through intuition › Investigate one spike at a time › Performance work is a specialist skil Now › AI summarizes the chaos › You decide what's real and what's noise › Reviewing AI output is a core engineering skill › Performance work is accessible to everyone
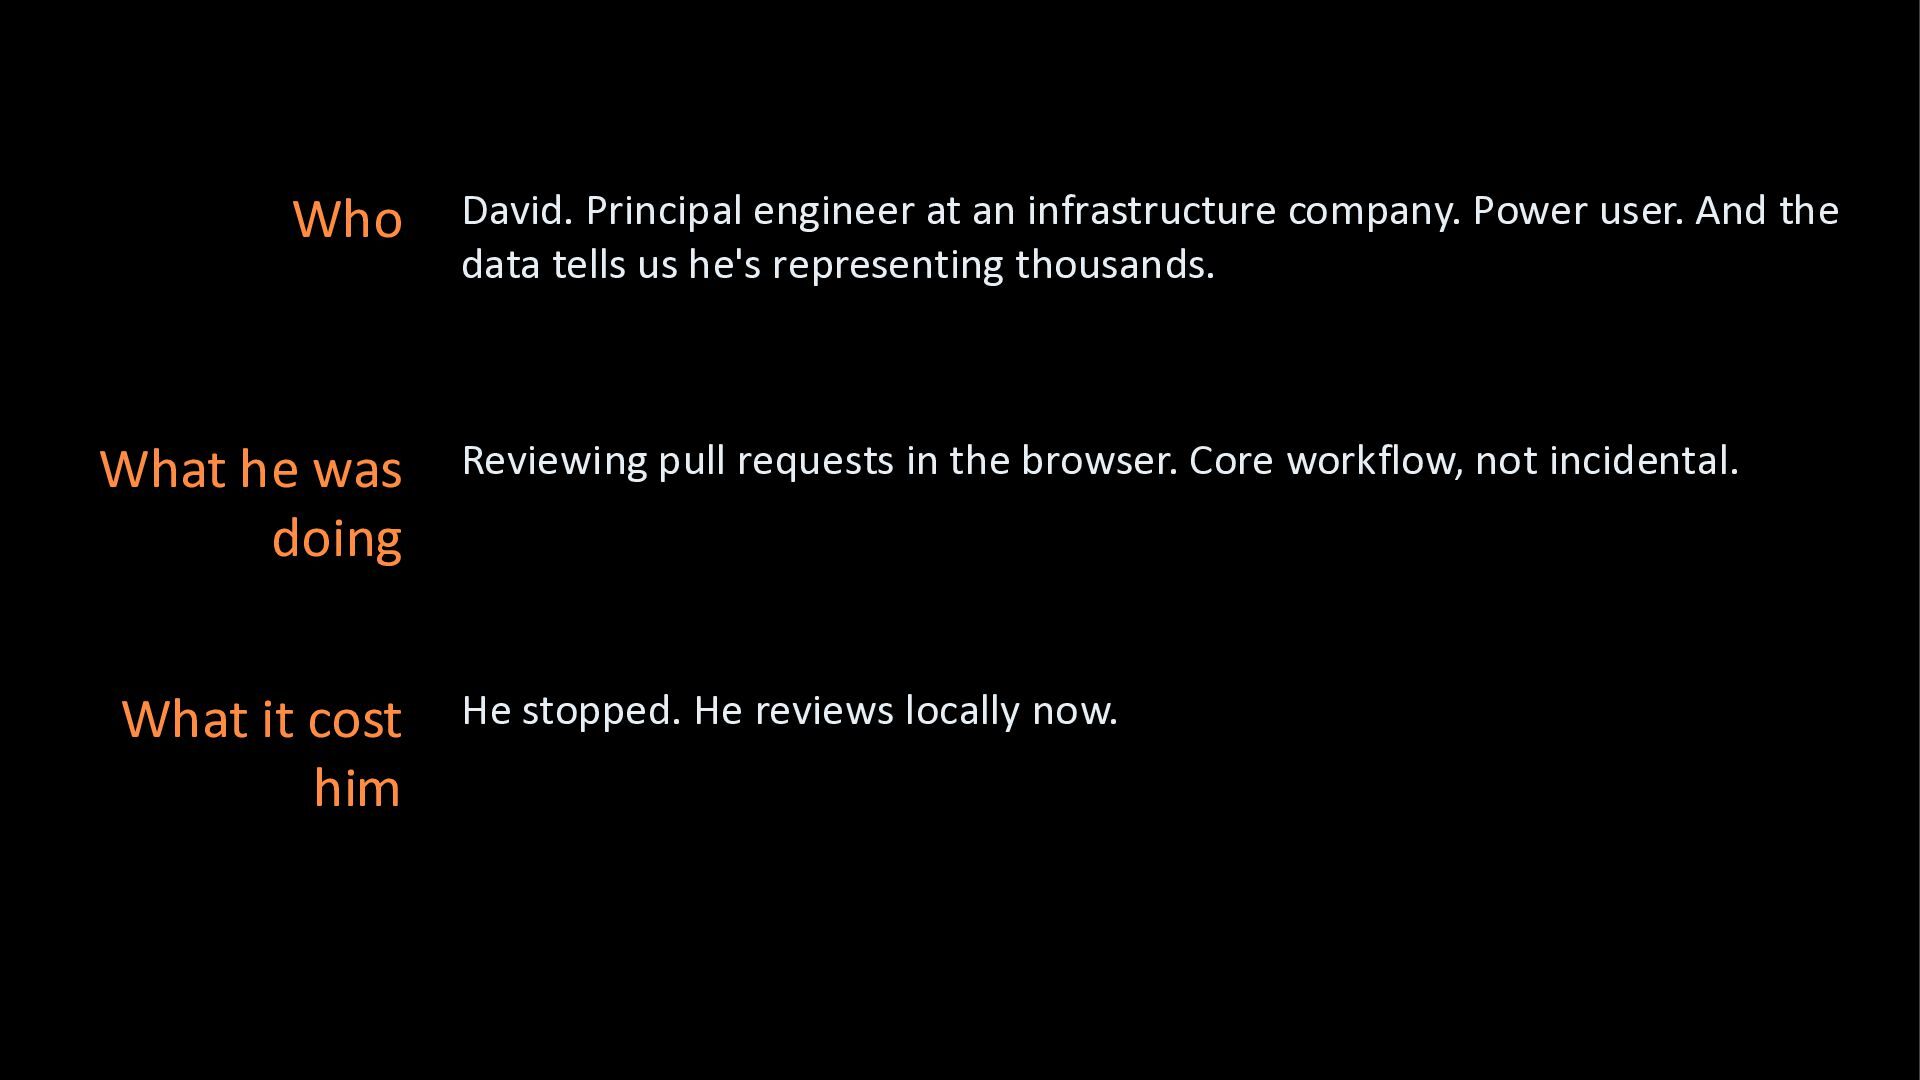
And the data tells us he's representing thousands. What he was doing Reviewing pull requests in the browser. Core workflow, not incidental. What it cost him He stopped. He reviews locally now.