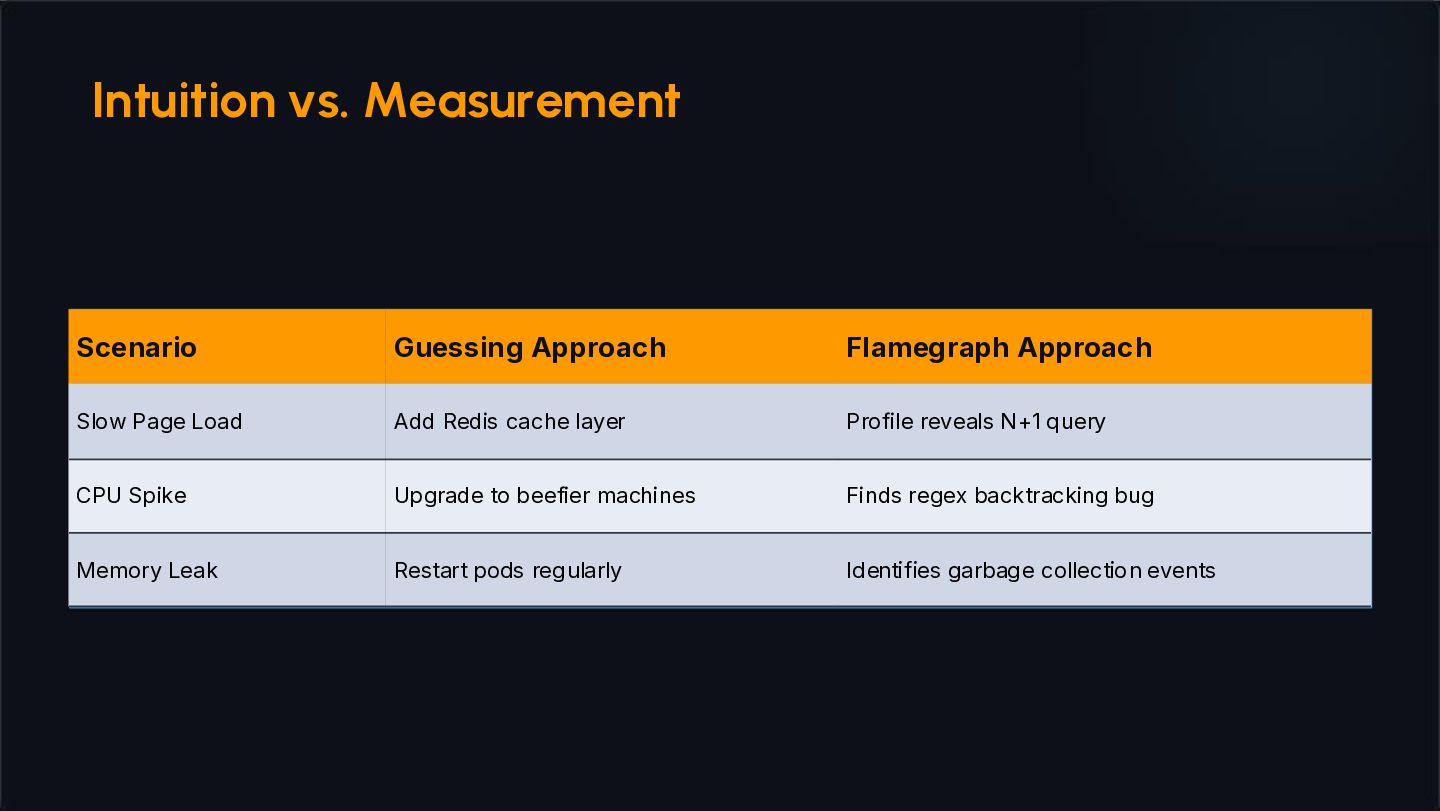
a guessing game. We know something is slow, but we rely on suspicions rather than evidence. "This is fine," we say, as latency spikes and users complain.
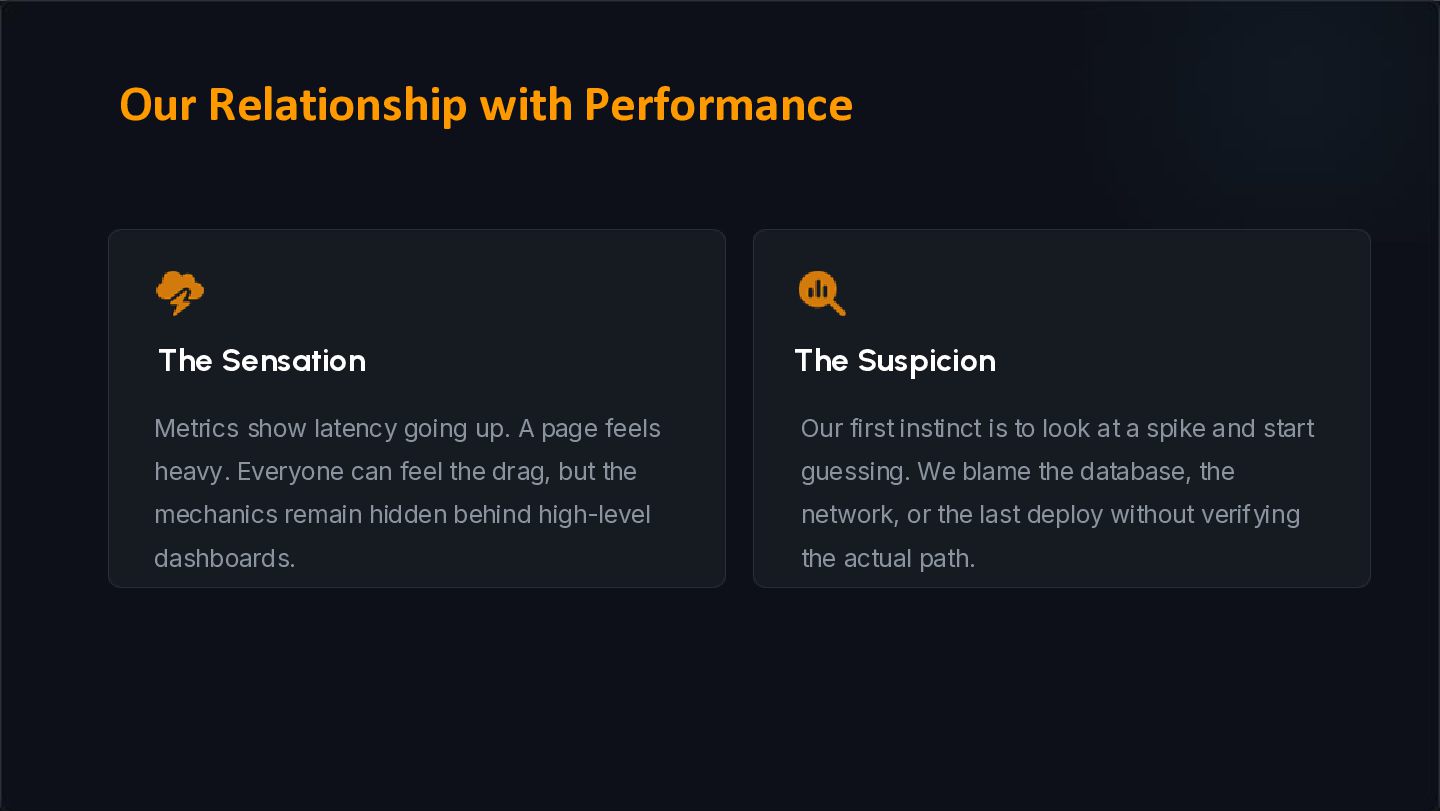
page feels heavy. Everyone can feel the drag, but the mechanics remain hidden behind high-level dashboards. Our first instinct is to look at a spike and start guessing. We blame the database, the network, or the last deploy without verifying the actual path. Our Relationship with Performance
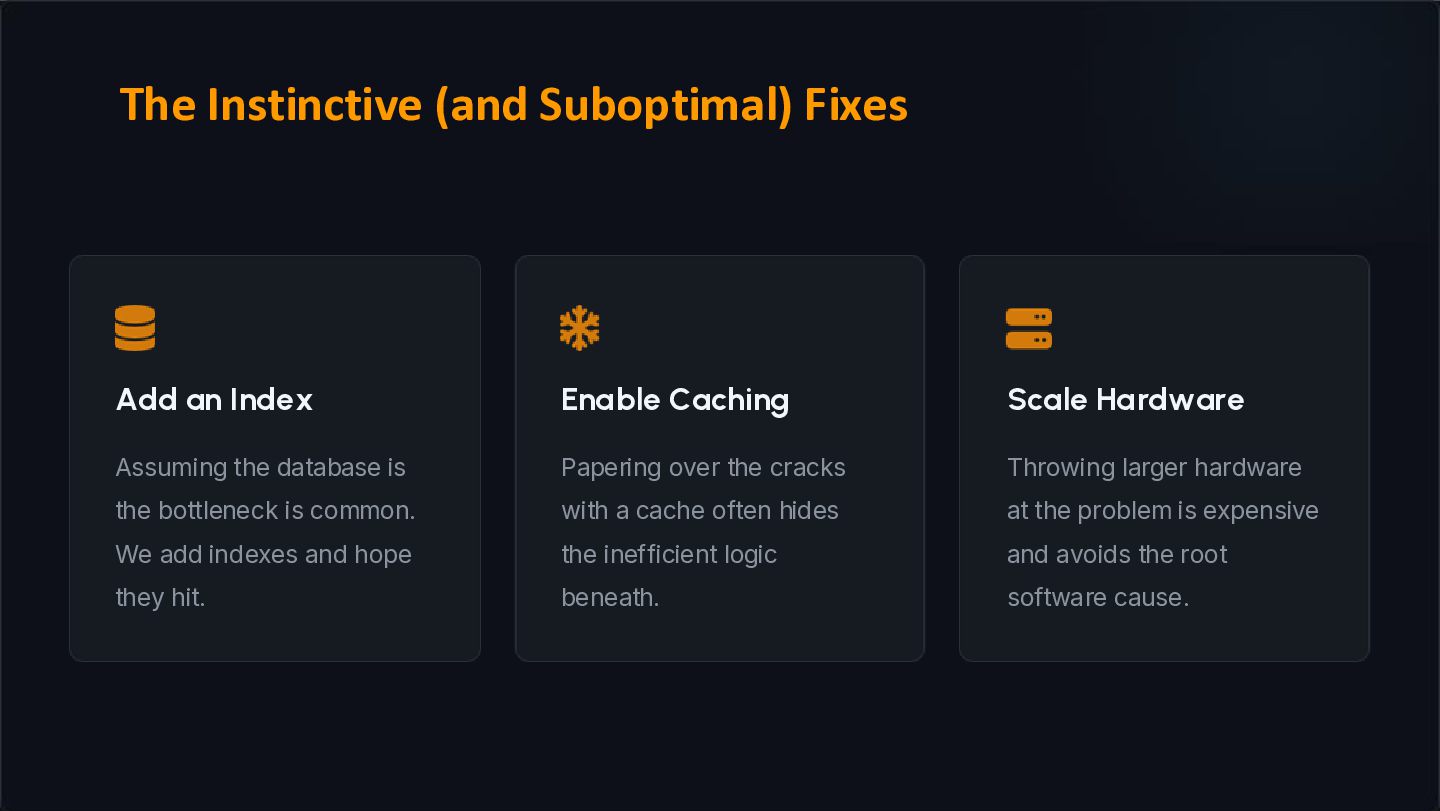
is the bottleneck is common. We add indexes and hope they hit. Papering over the cracks with a cache often hides the inefficient logic beneath. Throwing larger hardware at the problem is expensive and avoids the root software cause. The Instinctive (and Suboptimal) Fixes
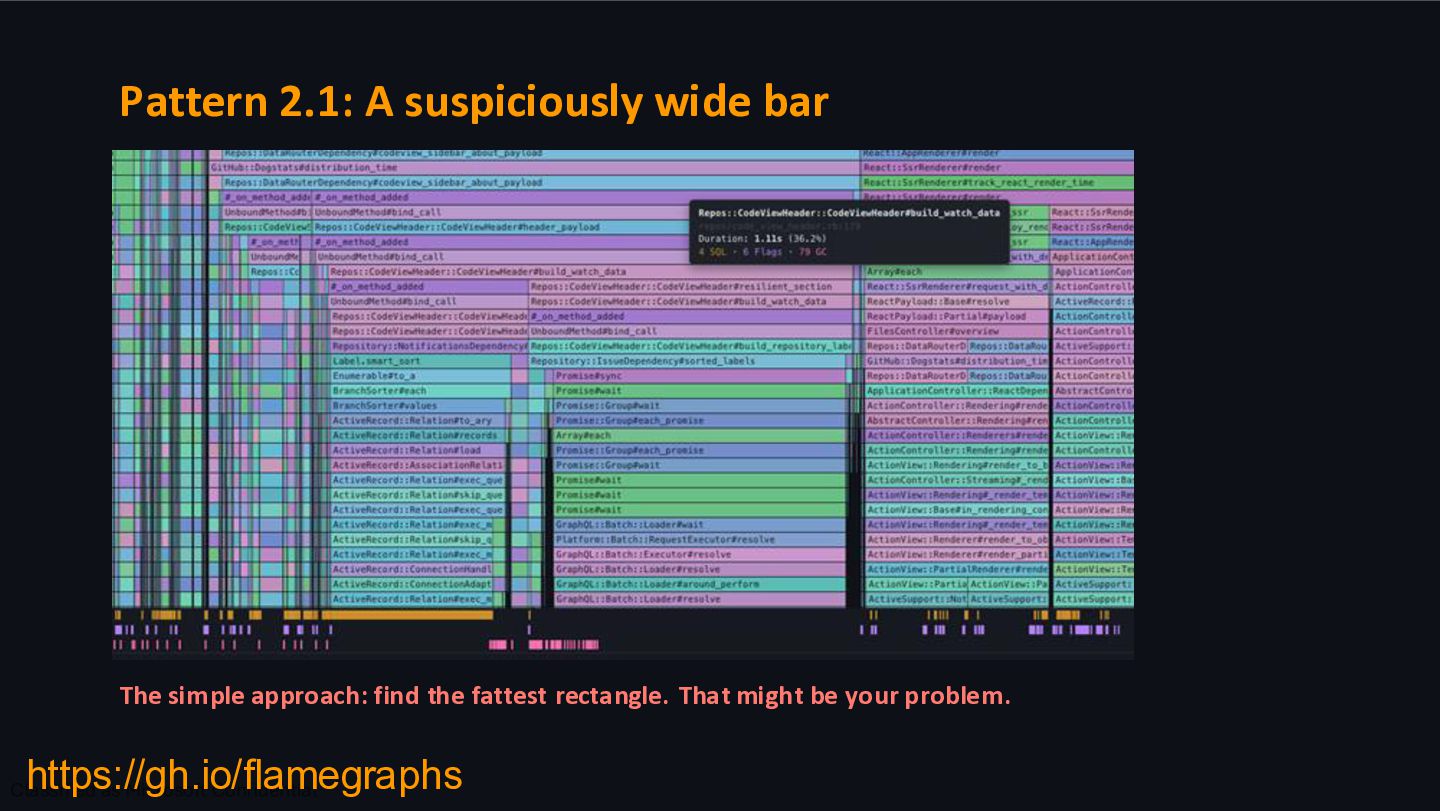
optimization is counter-intuitive. The method you've been suspicious of for years? It's probably fine. The innocuous single line of code that nobody looks at? That might be your main culprit.
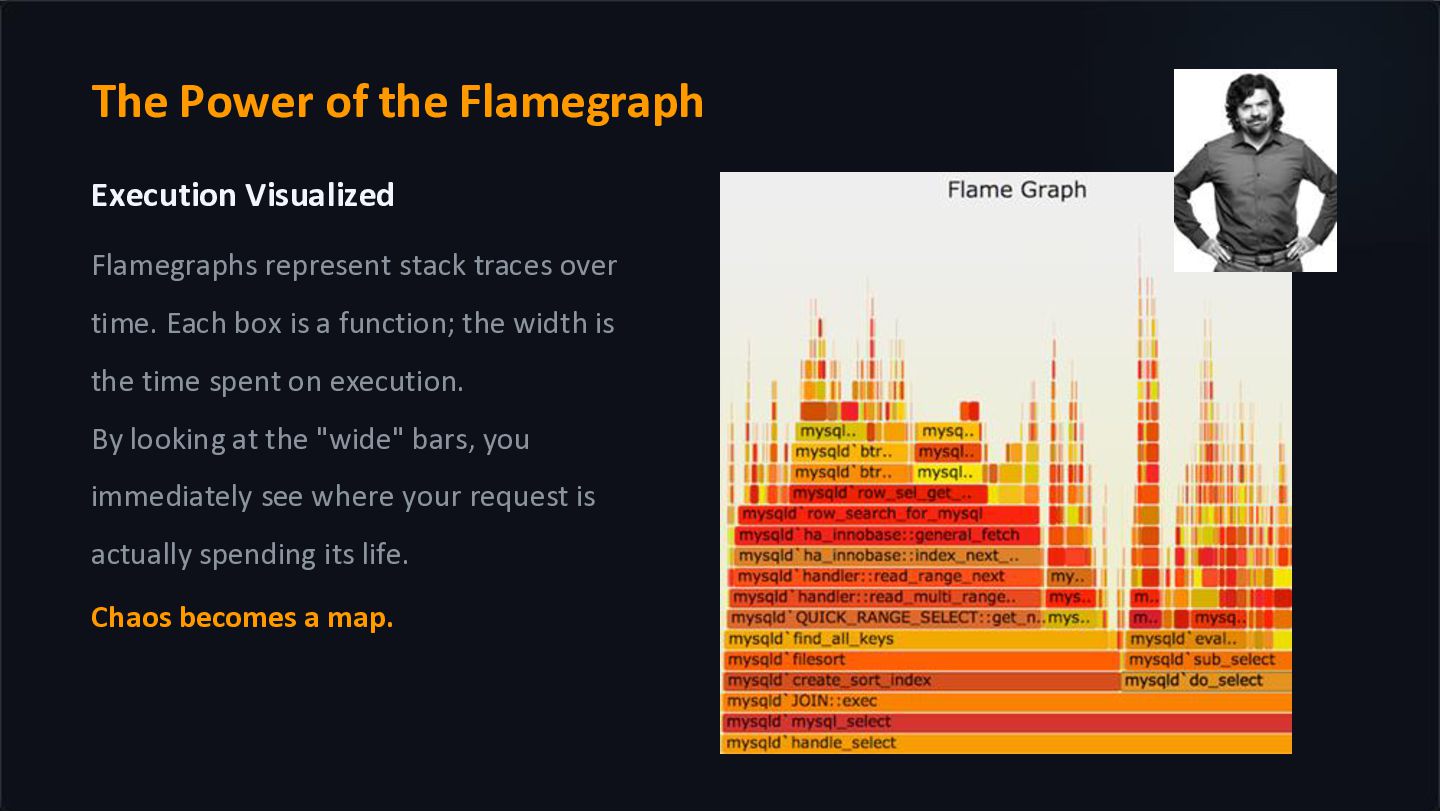
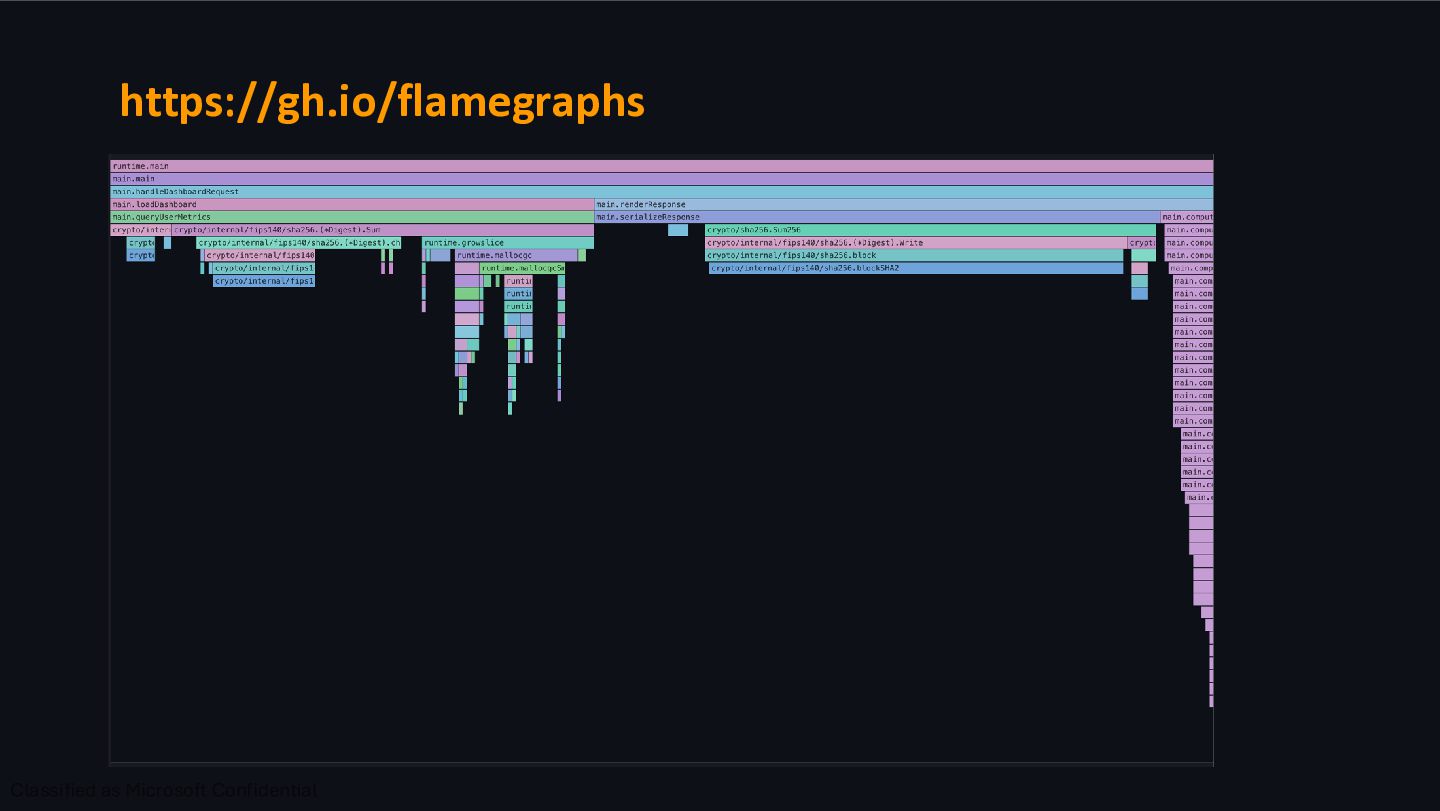
traces over time. Each box is a function; the width is the time spent on execution. By looking at the "wide" bars, you immediately see where your request is actually spending its life. Chaos becomes a map.
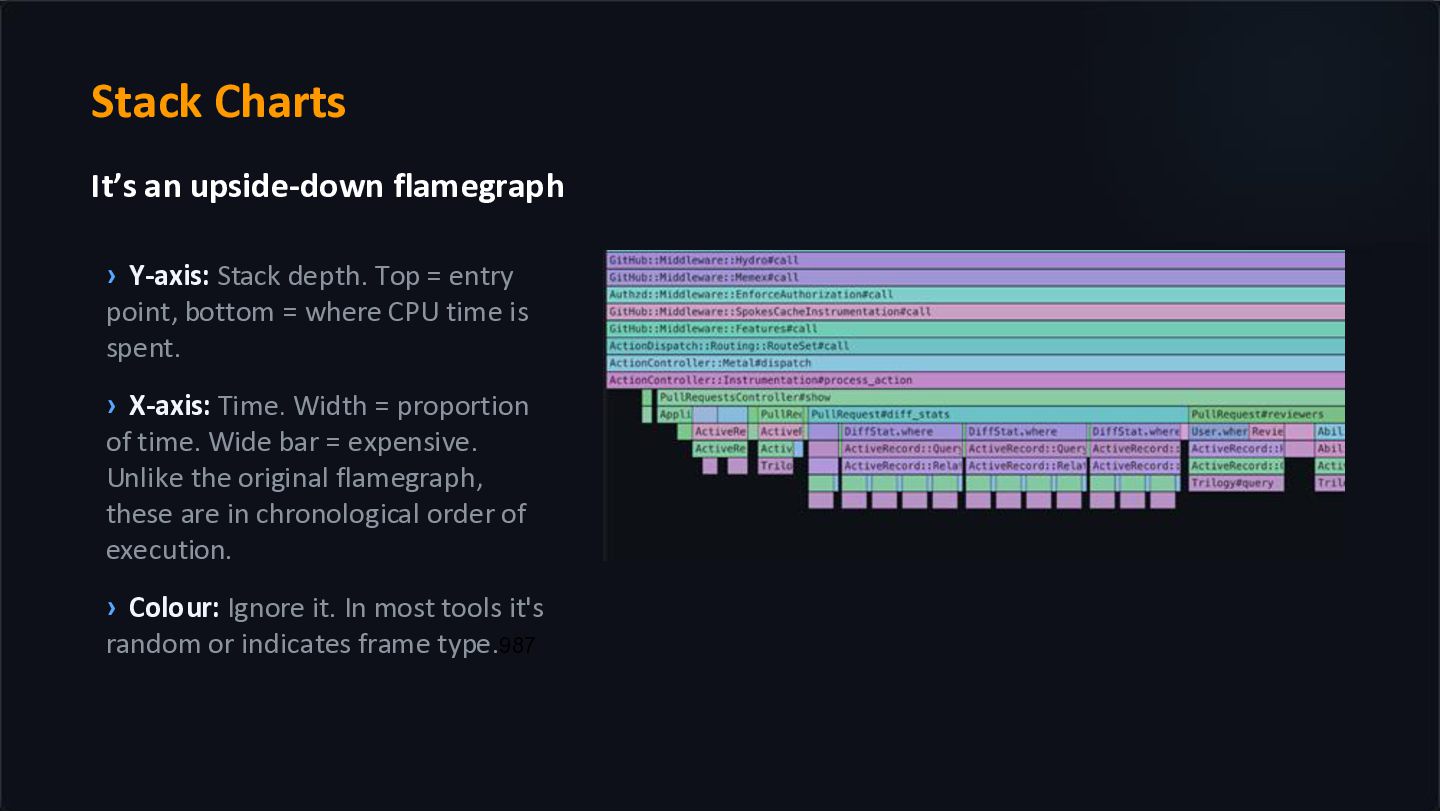
Top = entry point, bottom = where CPU time is spent. › X-axis: Time. Width = proportion of time. Wide bar = expensive. Unlike the original flamegraph, these are in chronological order of execution. › Colour: Ignore it. In most tools it's random or indicates frame type.987
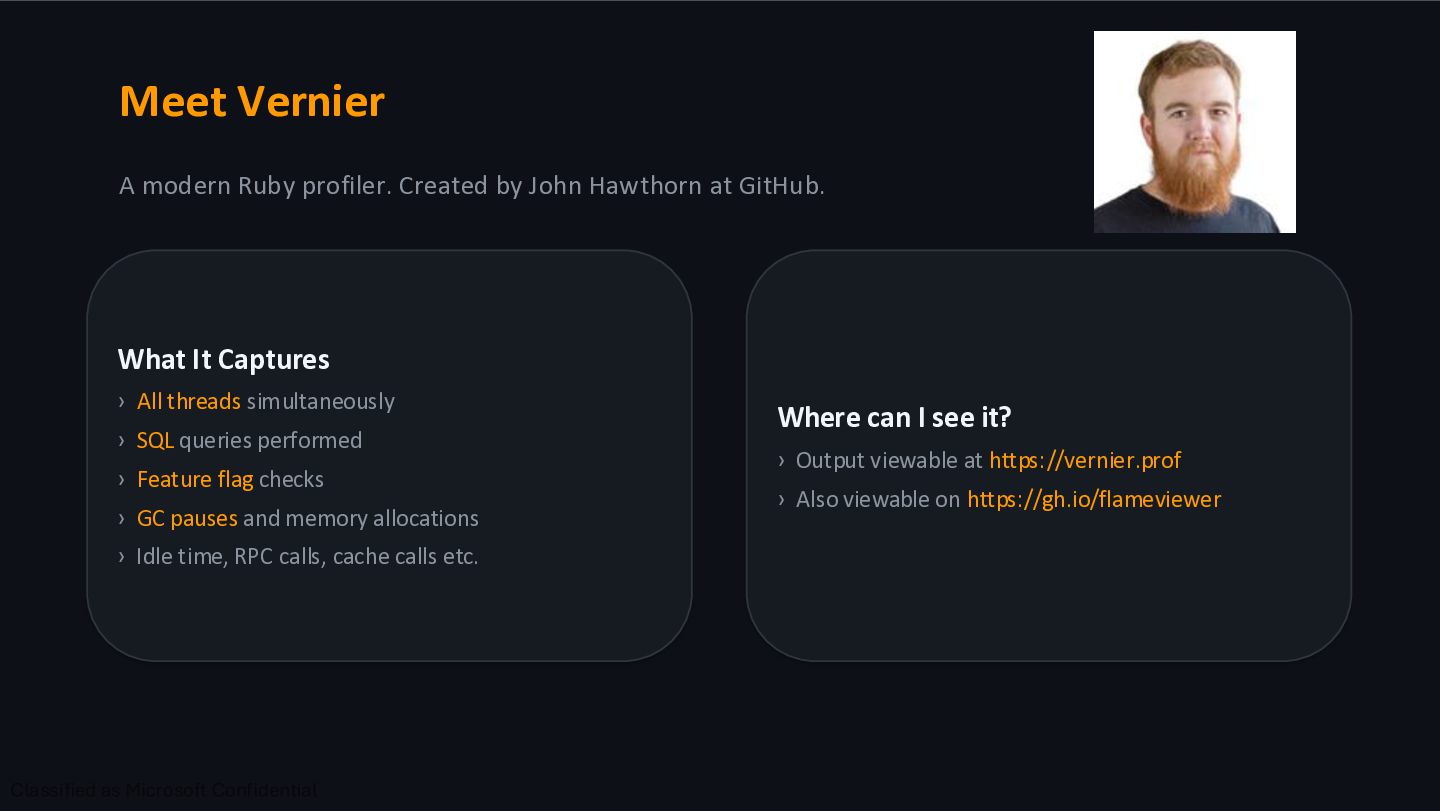
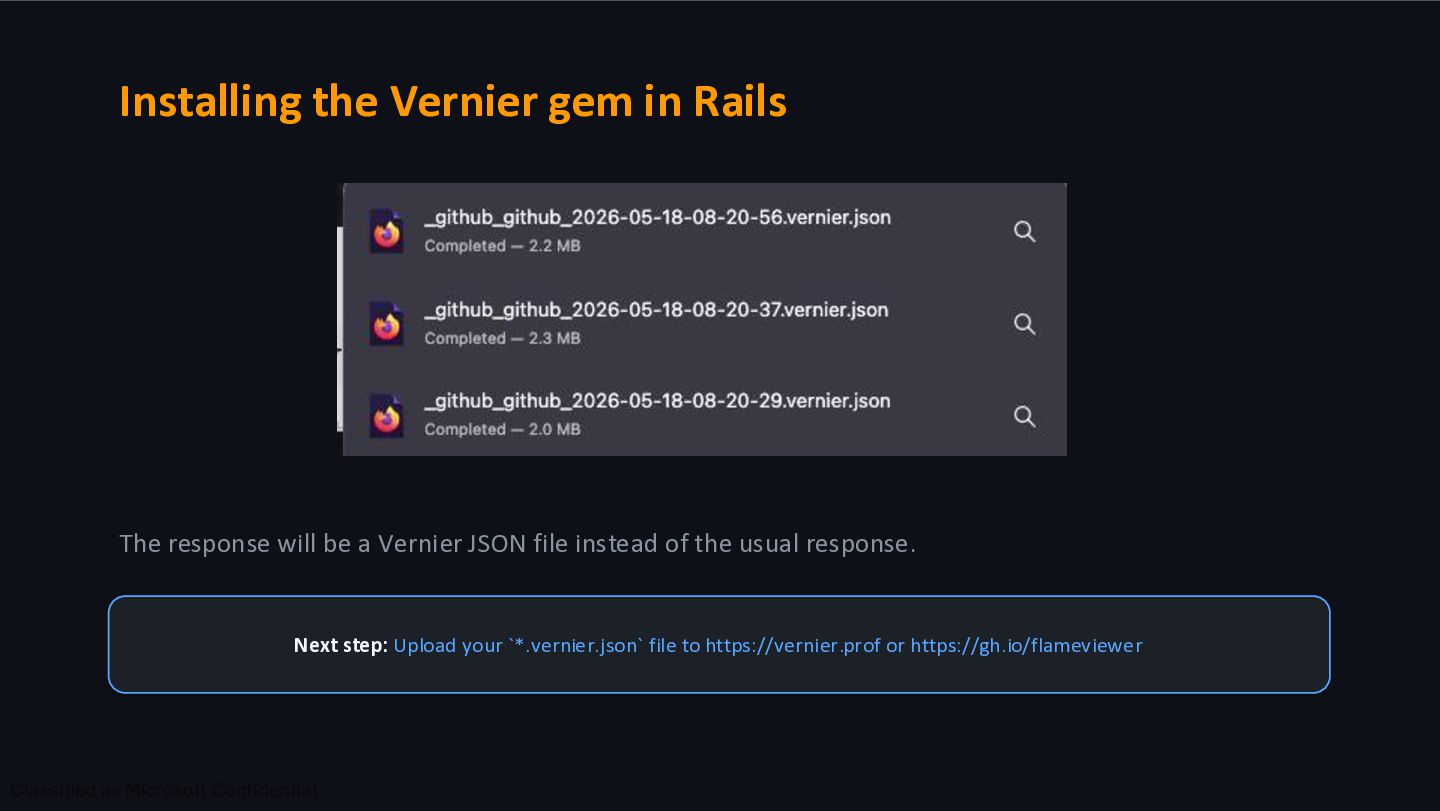
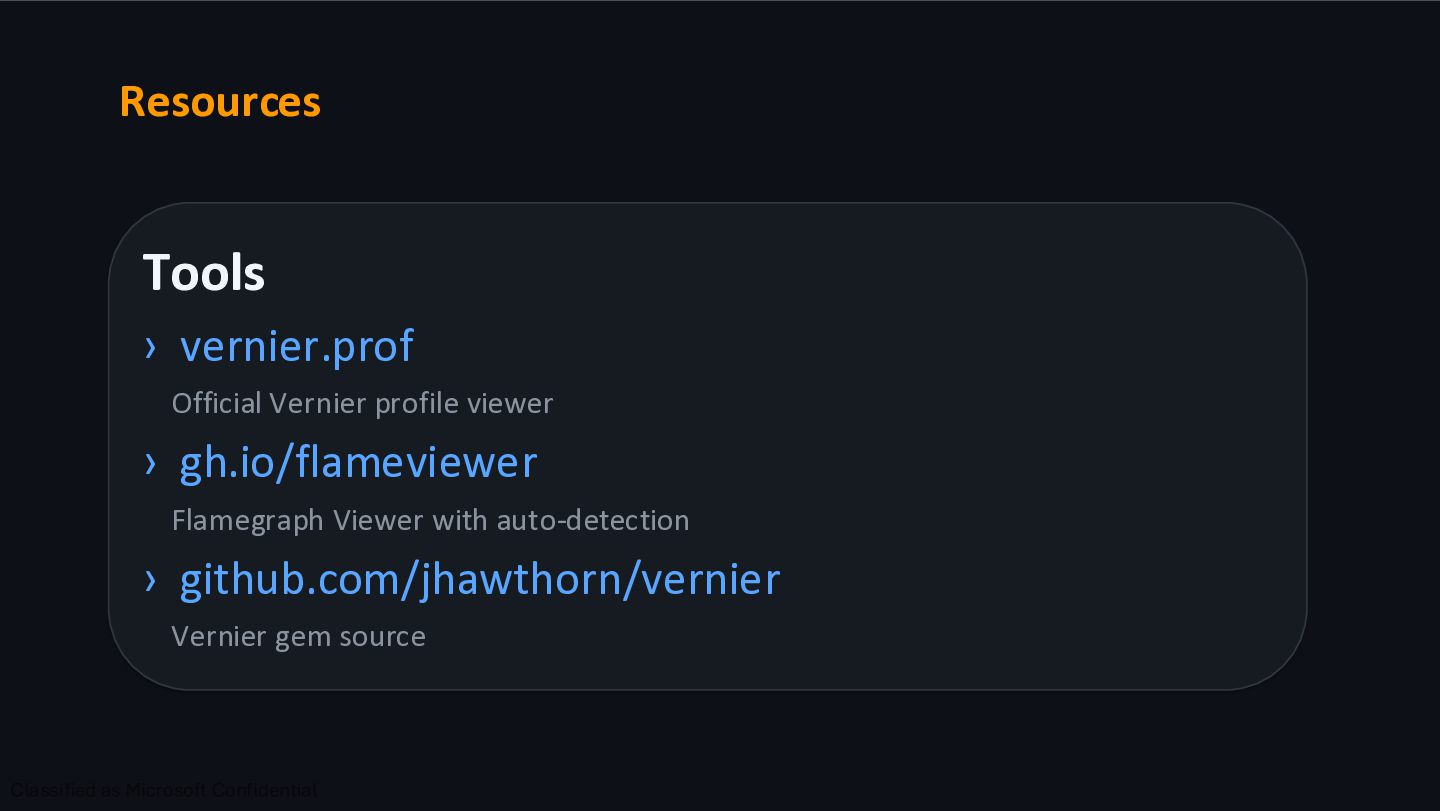
at GitHub. What It Captures › All threads simultaneously › SQL queries performed › Feature flag checks › GC pauses and memory allocations › Idle time, RPC calls, cache calls etc. Where can I see it? › Output viewable at https://vernier.prof › Also viewable on https://gh.io/flameviewer
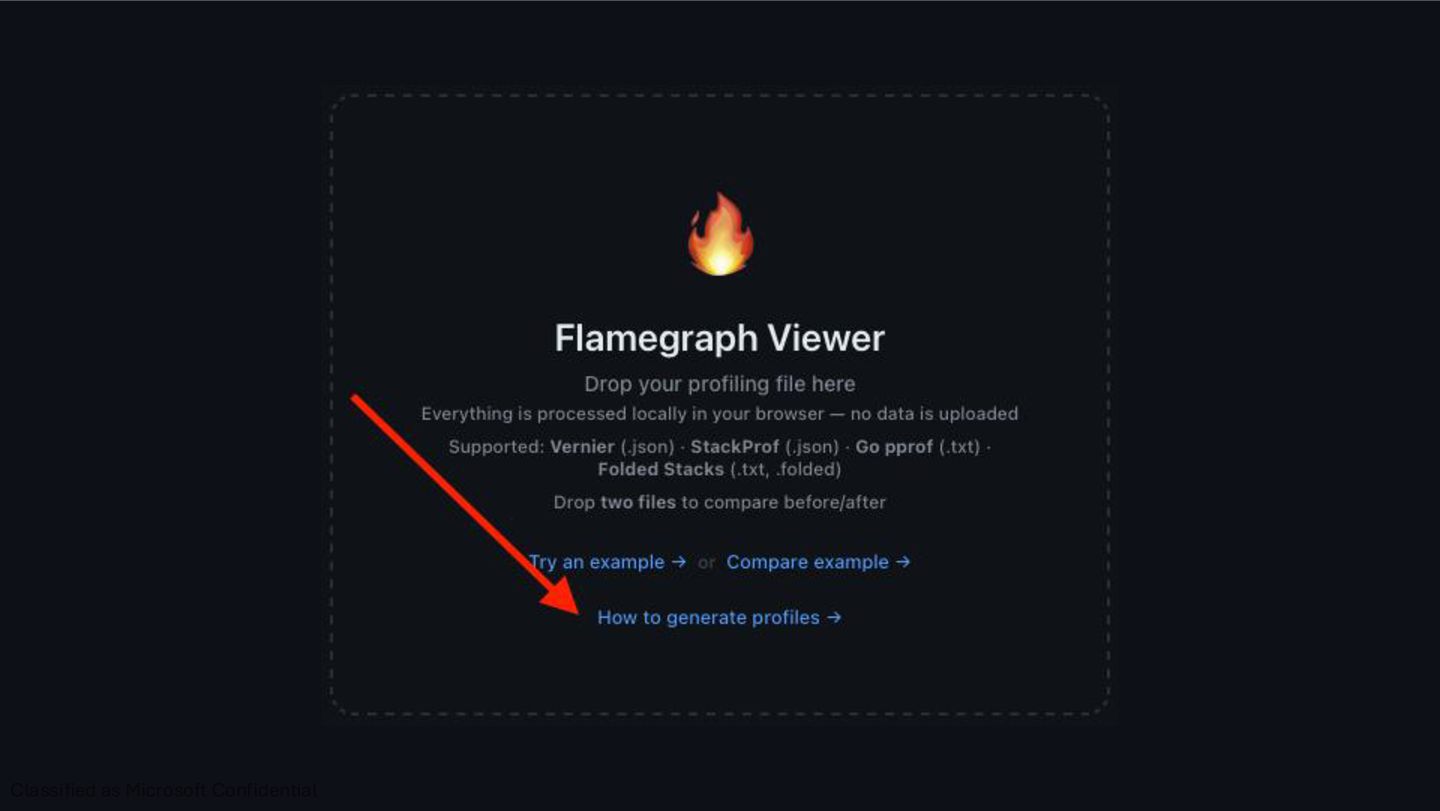
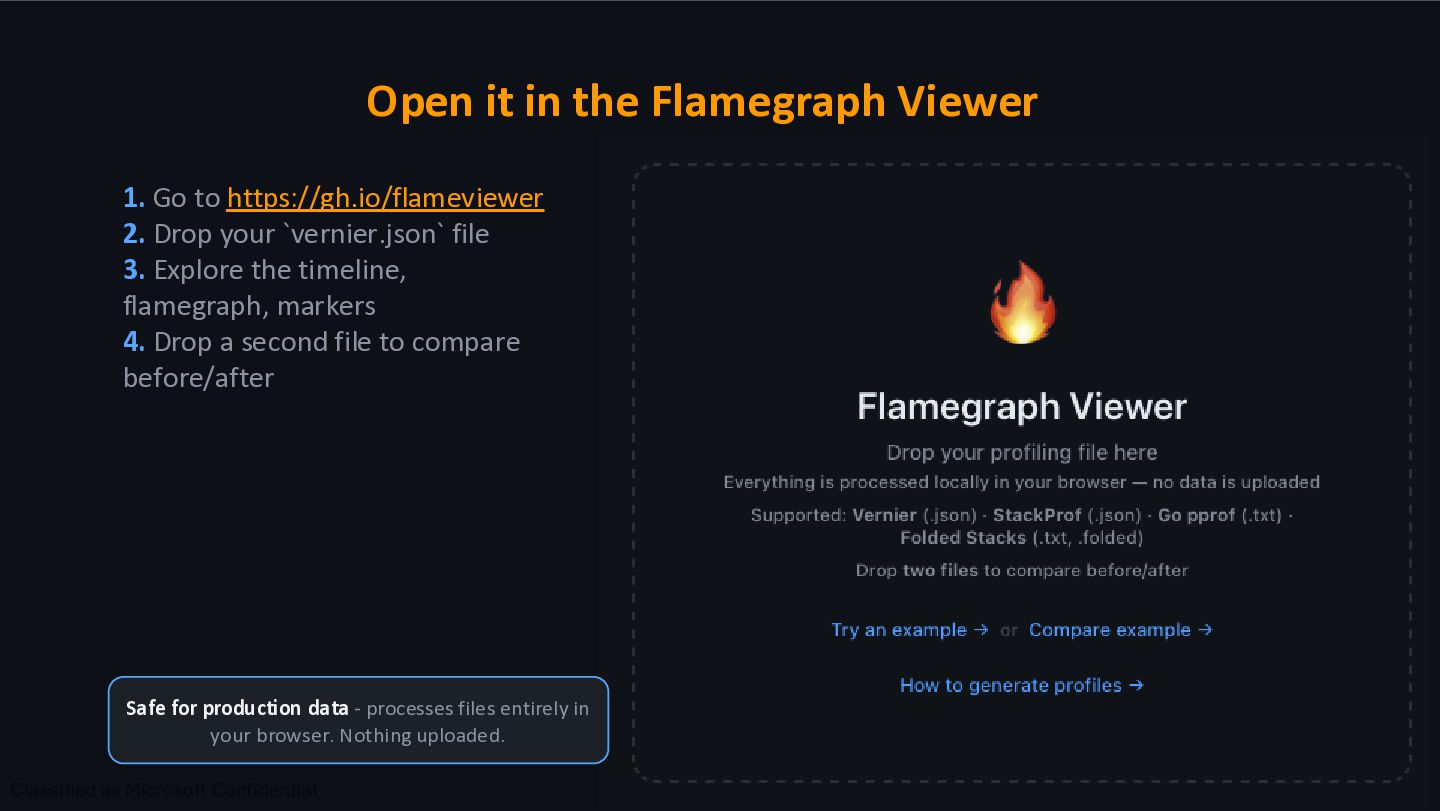
- processes files entirely in your browser. Nothing uploaded. 1. Go to https://gh.io/flameviewer 2. Drop your `vernier.json` file 3. Explore the timeline, flamegraph, markers 4. Drop a second file to compare before/after
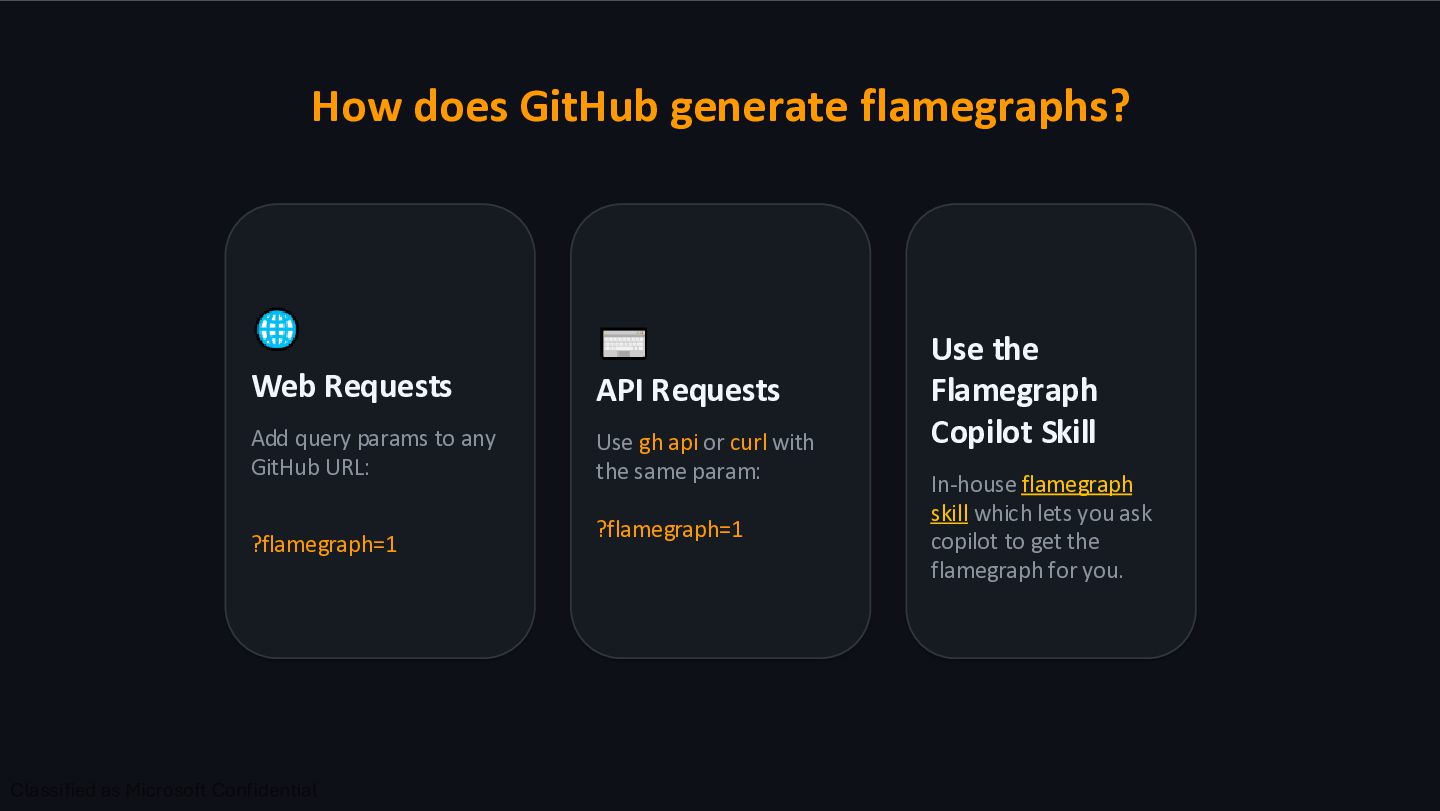
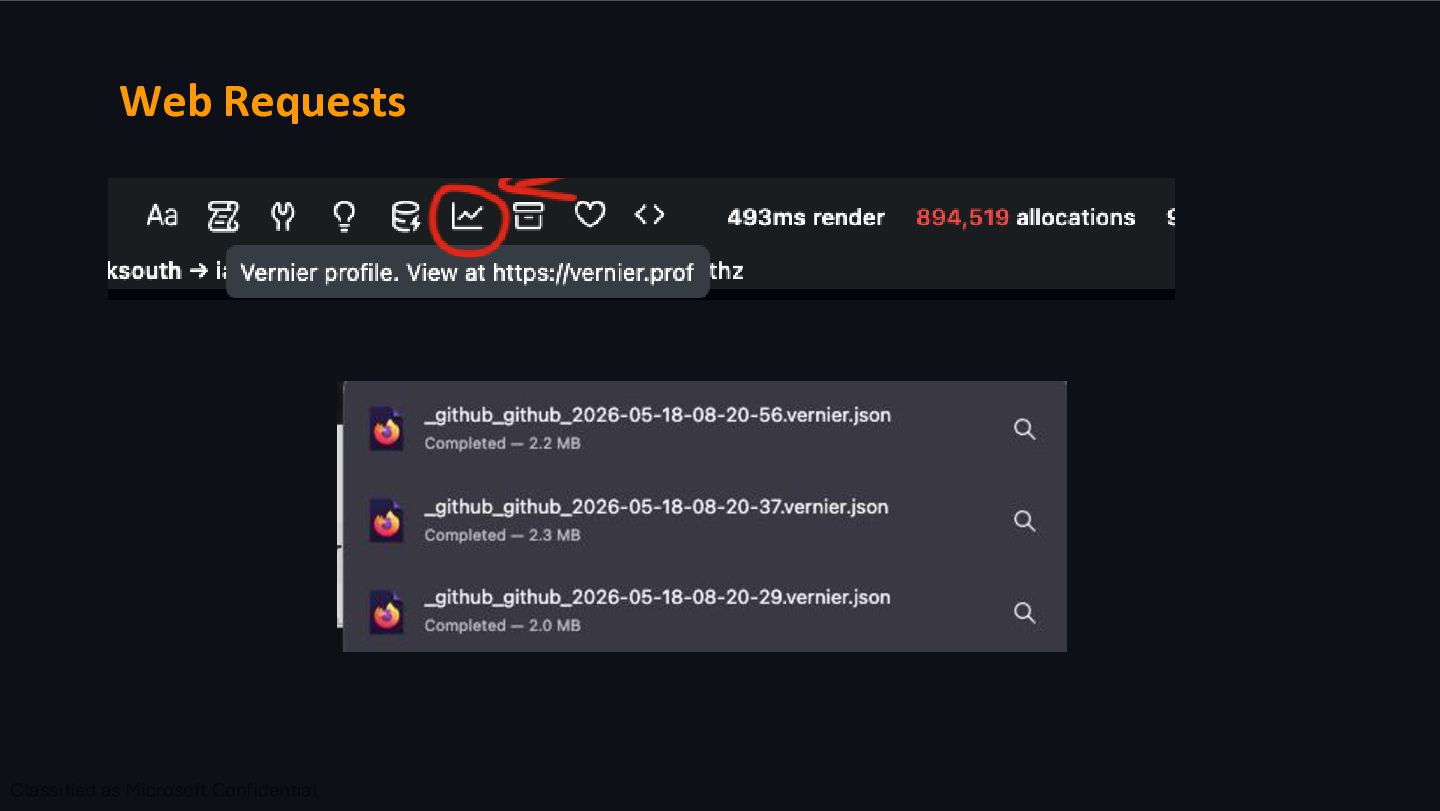
to any GitHub URL: ?flamegraph=1 API Requests Use gh api or curl with the same param: ?flamegraph=1 Use the Flamegraph Copilot Skill In-house flamegraph skill which lets you ask copilot to get the flamegraph for you.
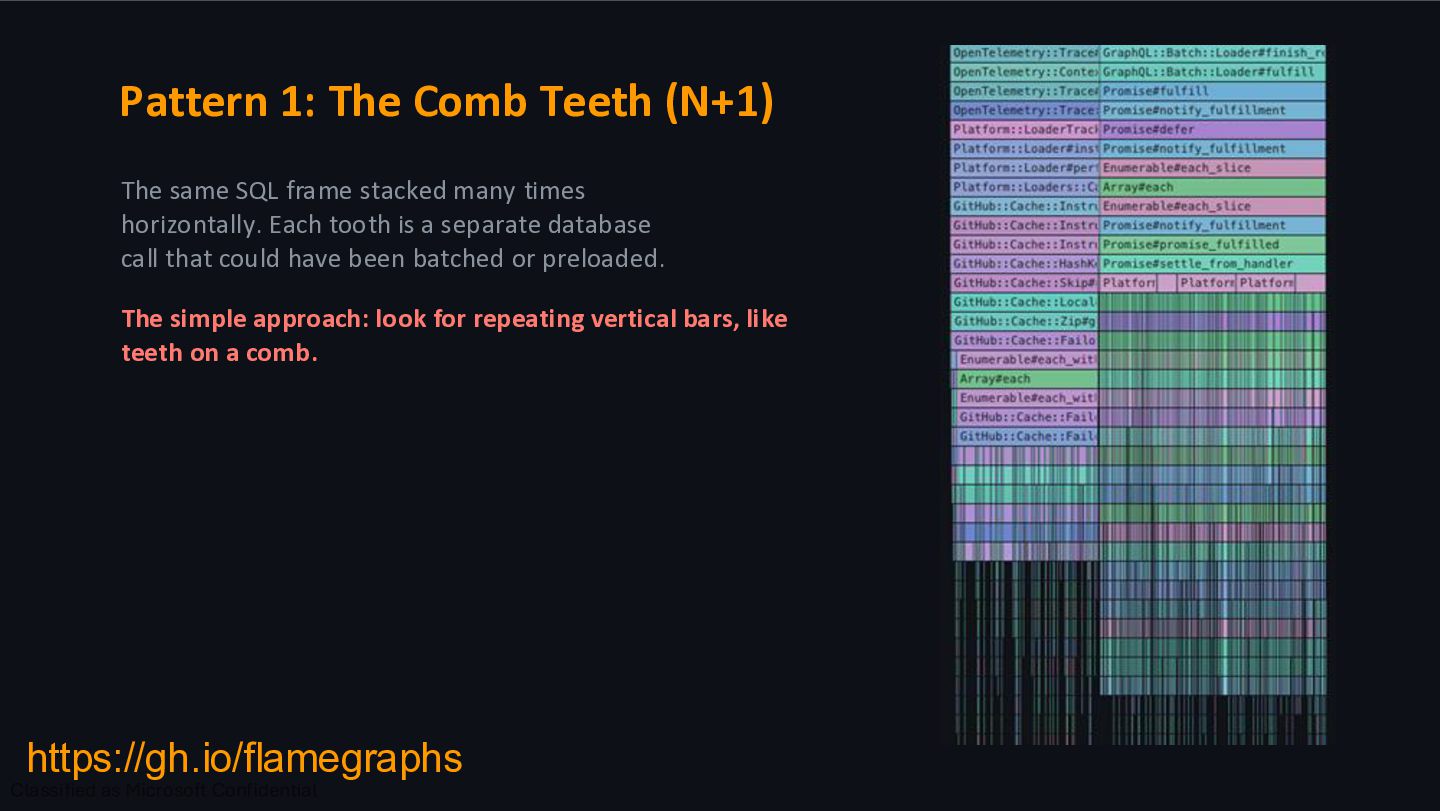
stacked many times horizontally. Each tooth is a separate database call that could have been batched or preloaded. The simple approach: look for repeating vertical bars, like teeth on a comb. https://gh.io/flamegraphs
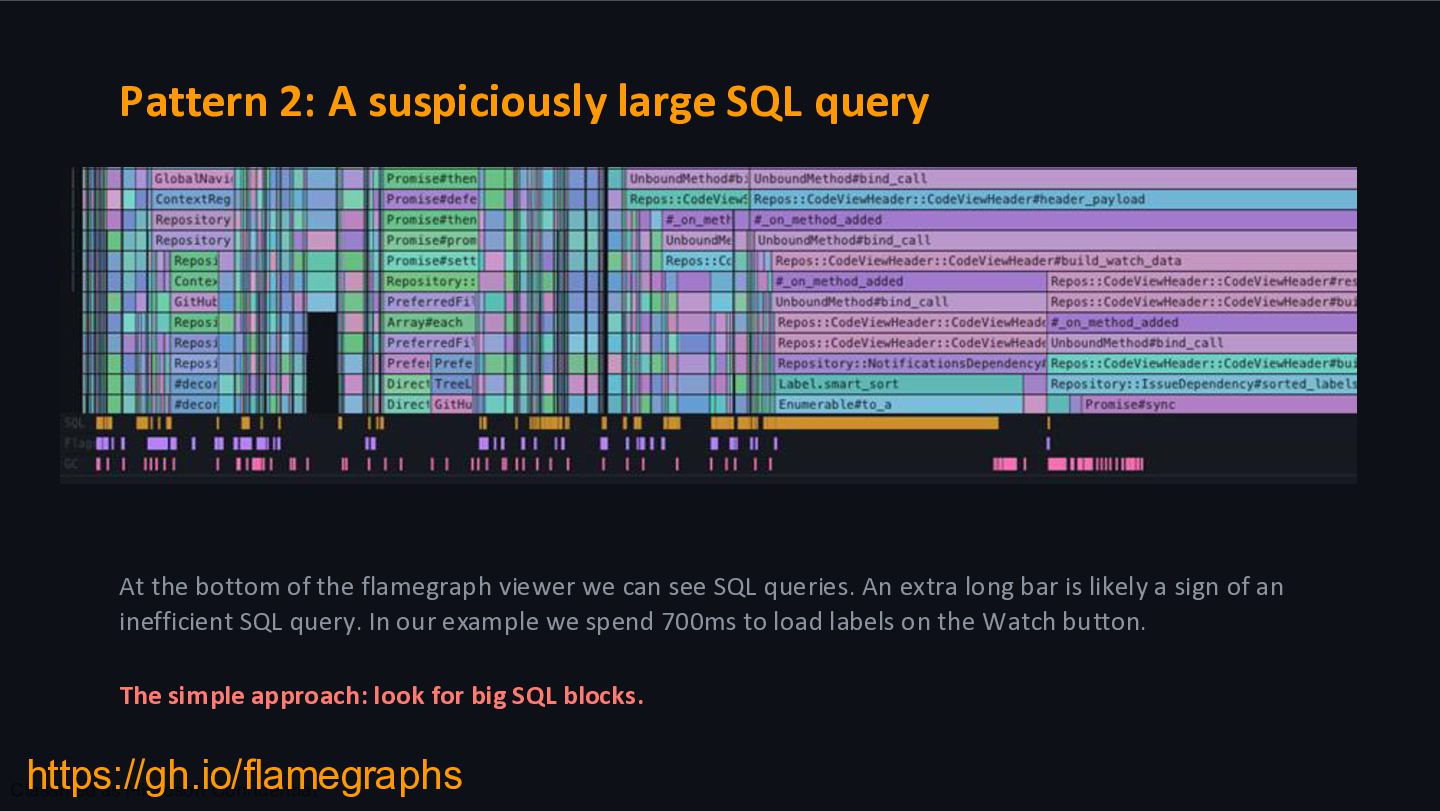
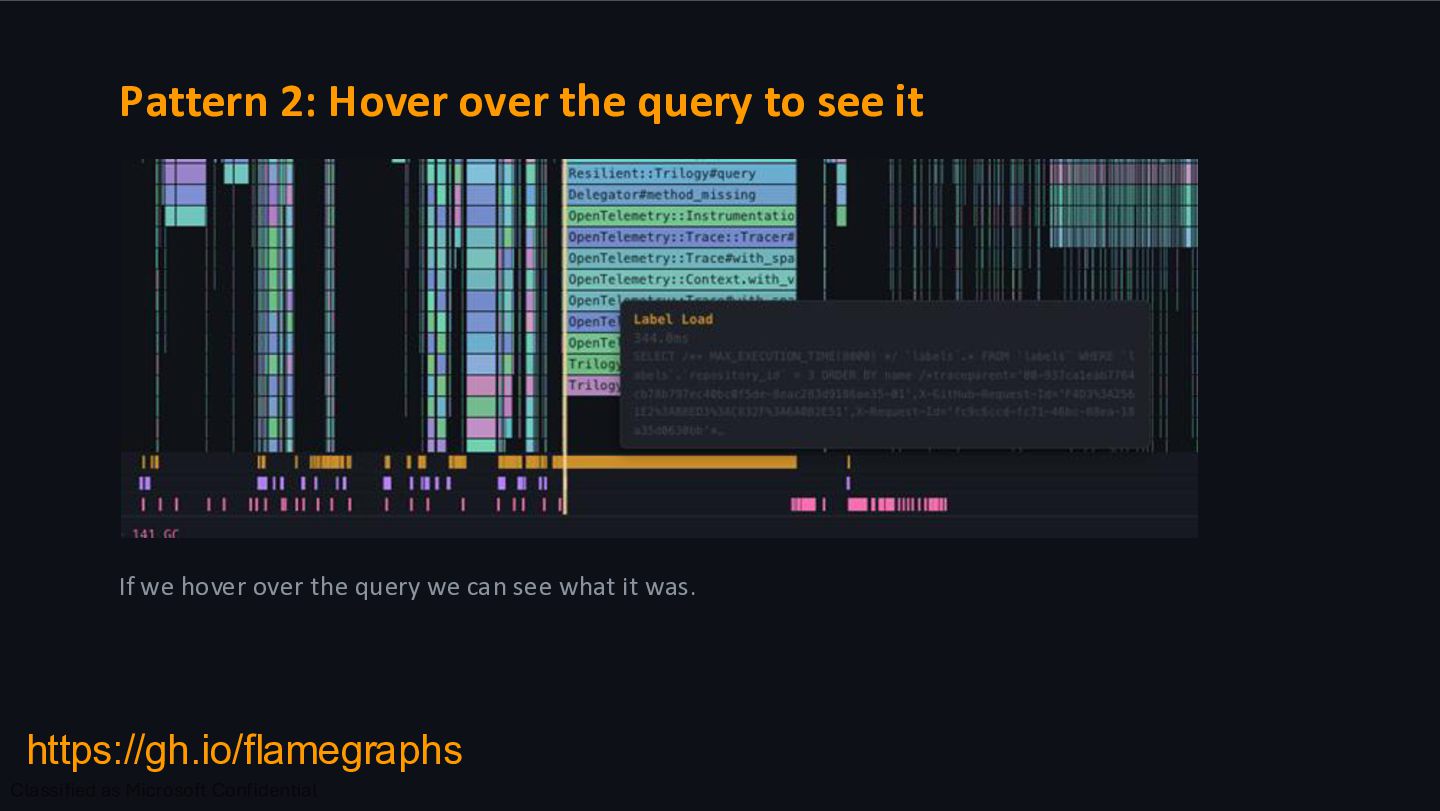
of the flamegraph viewer we can see SQL queries. An extra long bar is likely a sign of an inefficient SQL query. In our example we spend 700ms to load labels on the Watch button. The simple approach: look for big SQL blocks. https://gh.io/flamegraphs
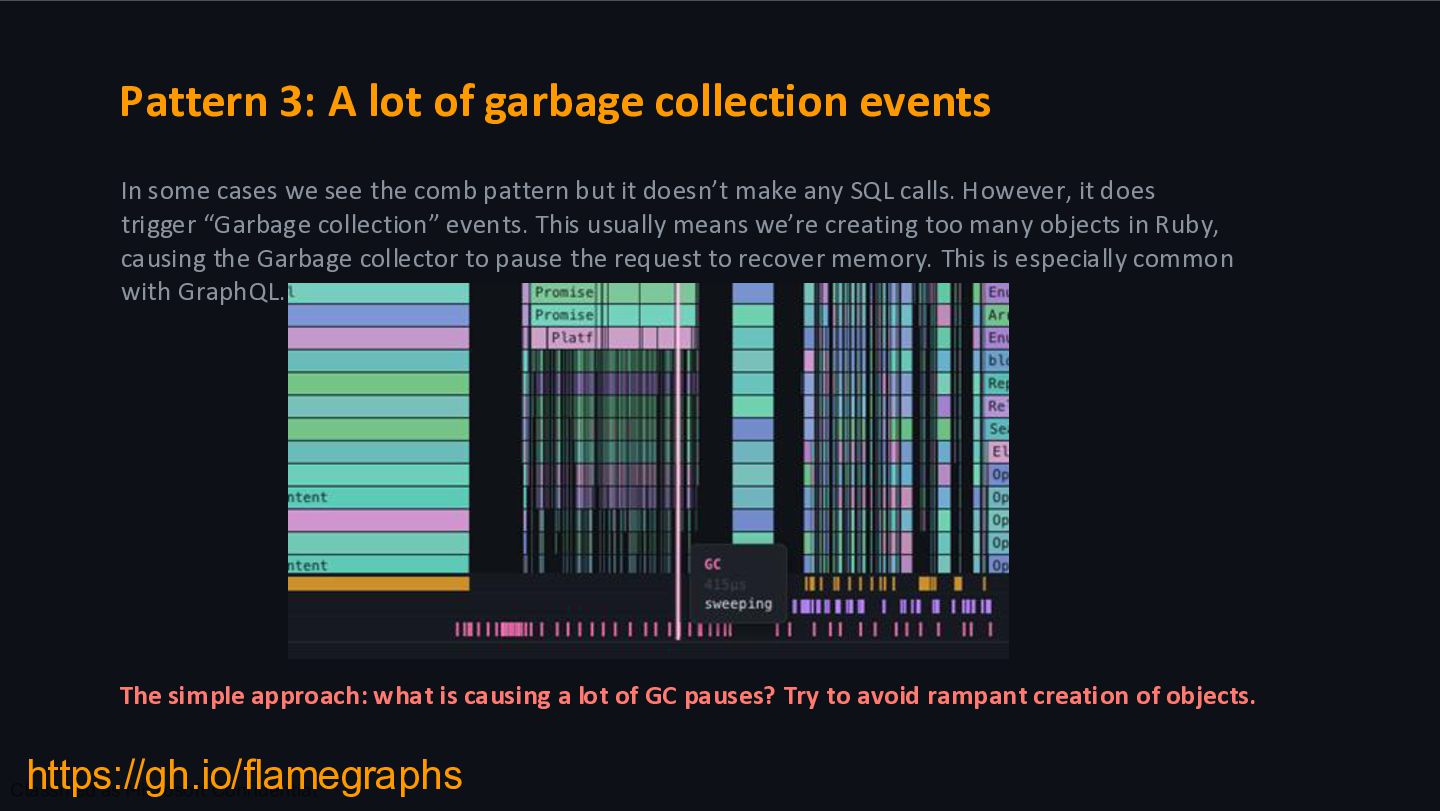
approach: what is causing a lot of GC pauses? Try to avoid rampant creation of objects. In some cases we see the comb pattern but it doesn’t make any SQL calls. However, it does trigger “Garbage collection” events. This usually means we’re creating too many objects in Ruby, causing the Garbage collector to pause the request to recover memory. This is especially common with GraphQL. https://gh.io/flamegraphs
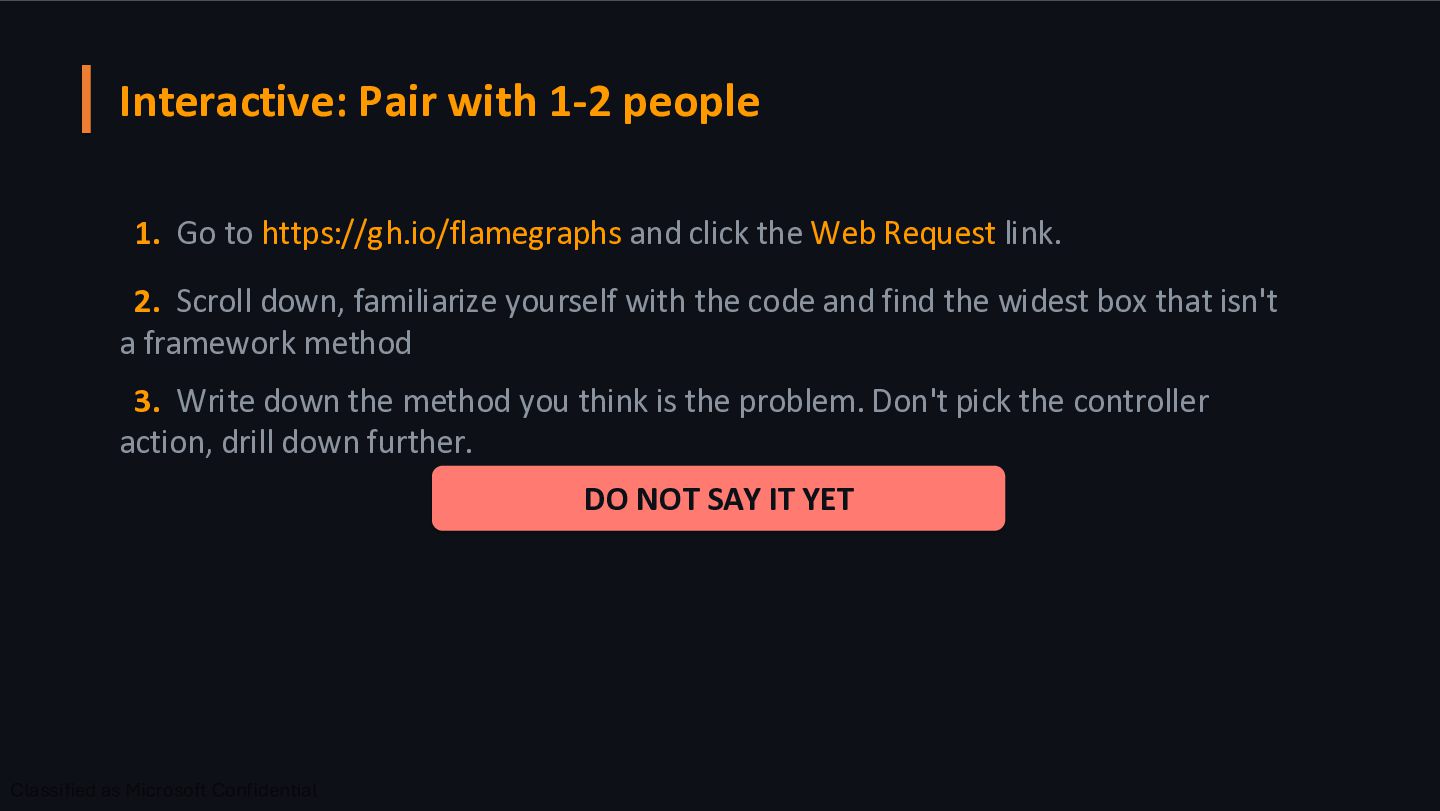
click the Web Request link. 2. Scroll down, familiarize yourself with the code and find the widest box that isn't a framework method 3. Write down the method you think is the problem. Don't pick the controller action, drill down further. DO NOT SAY IT YET
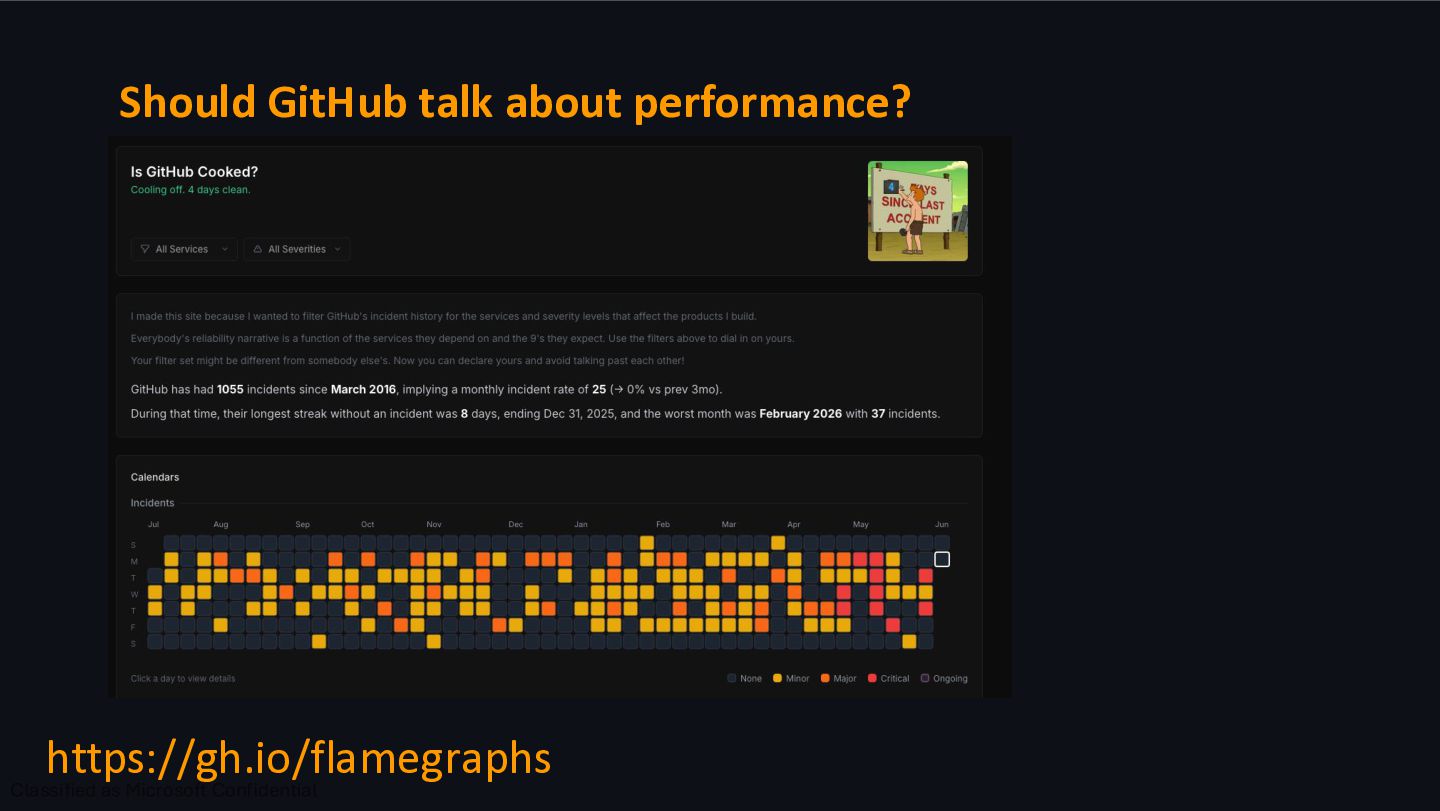
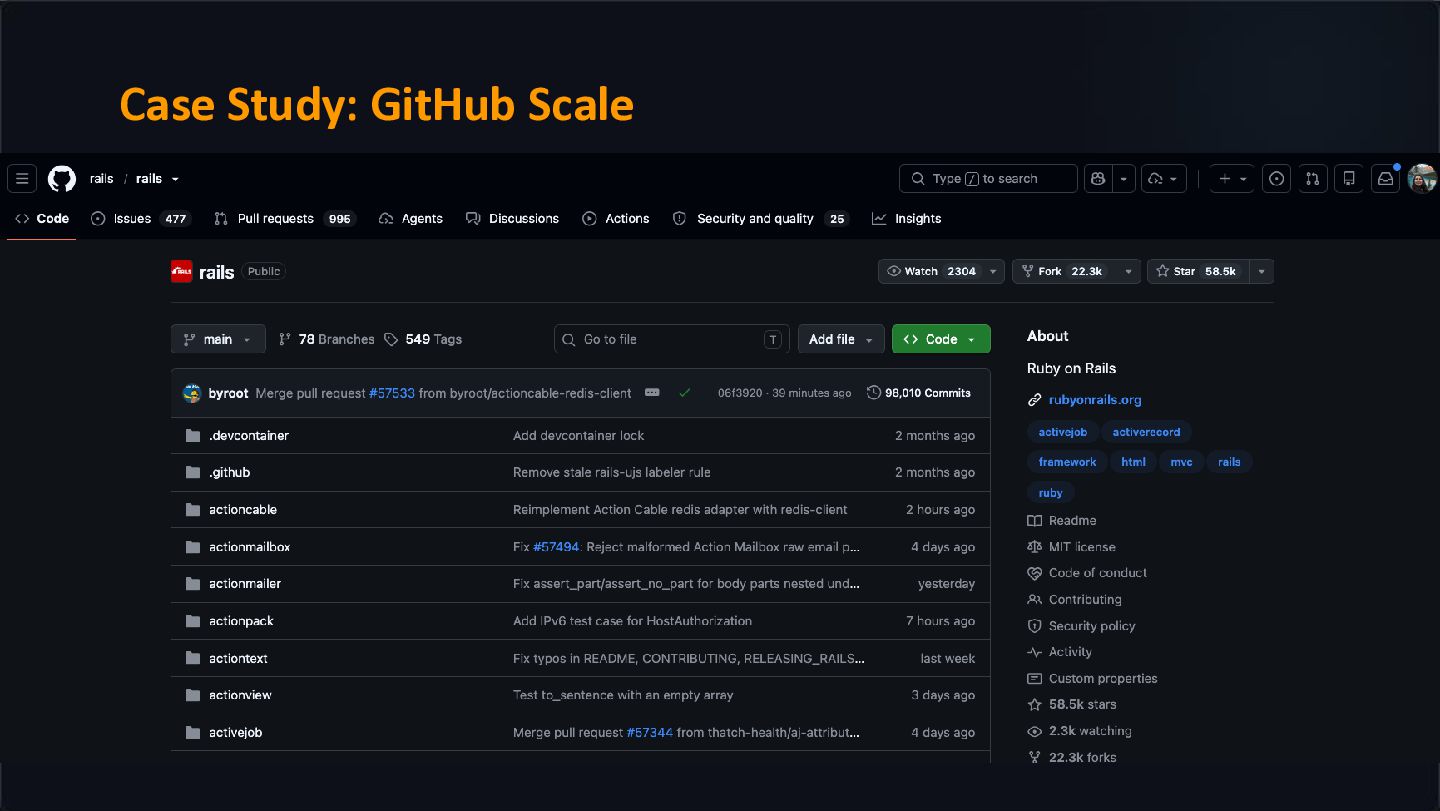
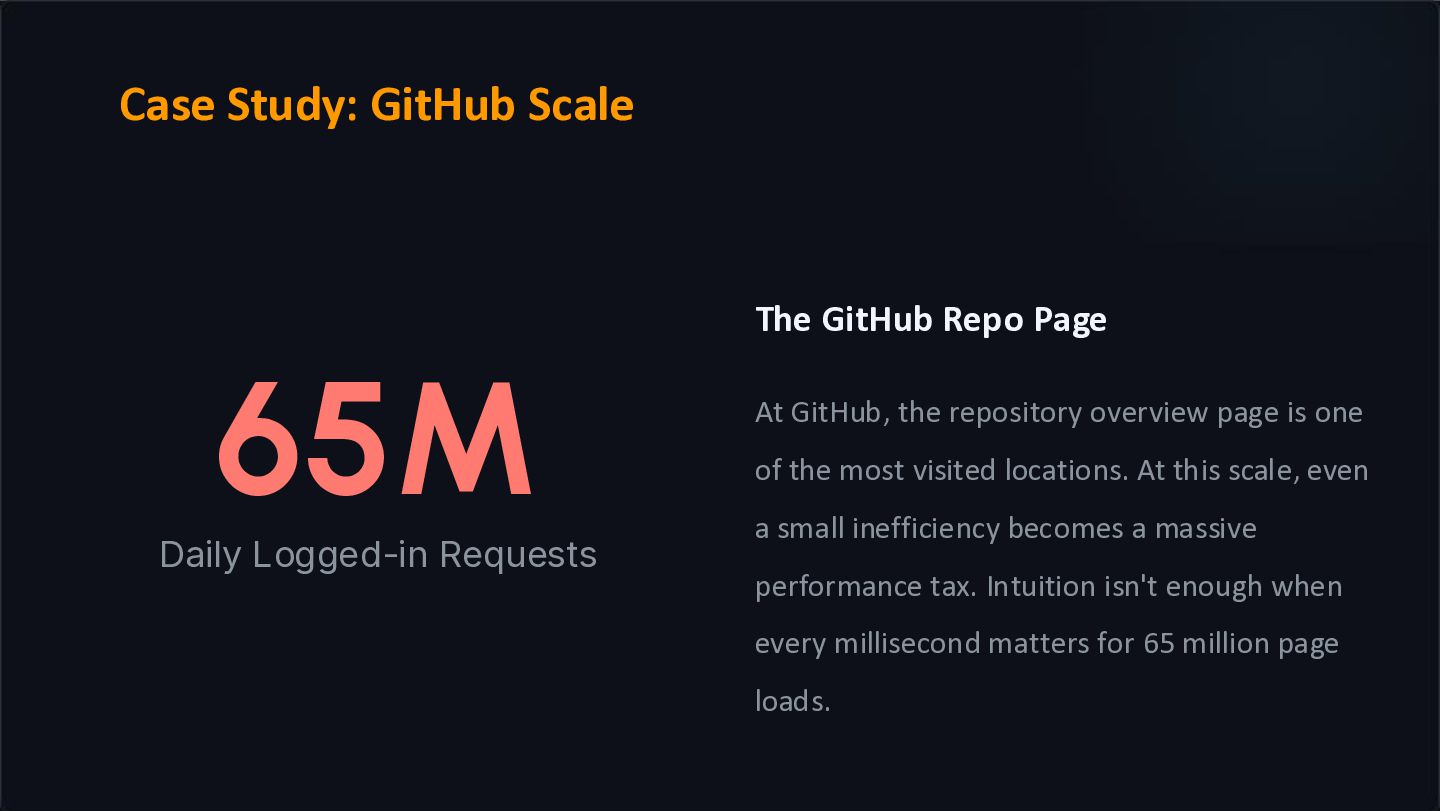
the repository overview page is one of the most visited locations. At this scale, even a small inefficiency becomes a massive performance tax. Intuition isn't enough when every millisecond matters for 65 million page loads. Case Study: GitHub Scale
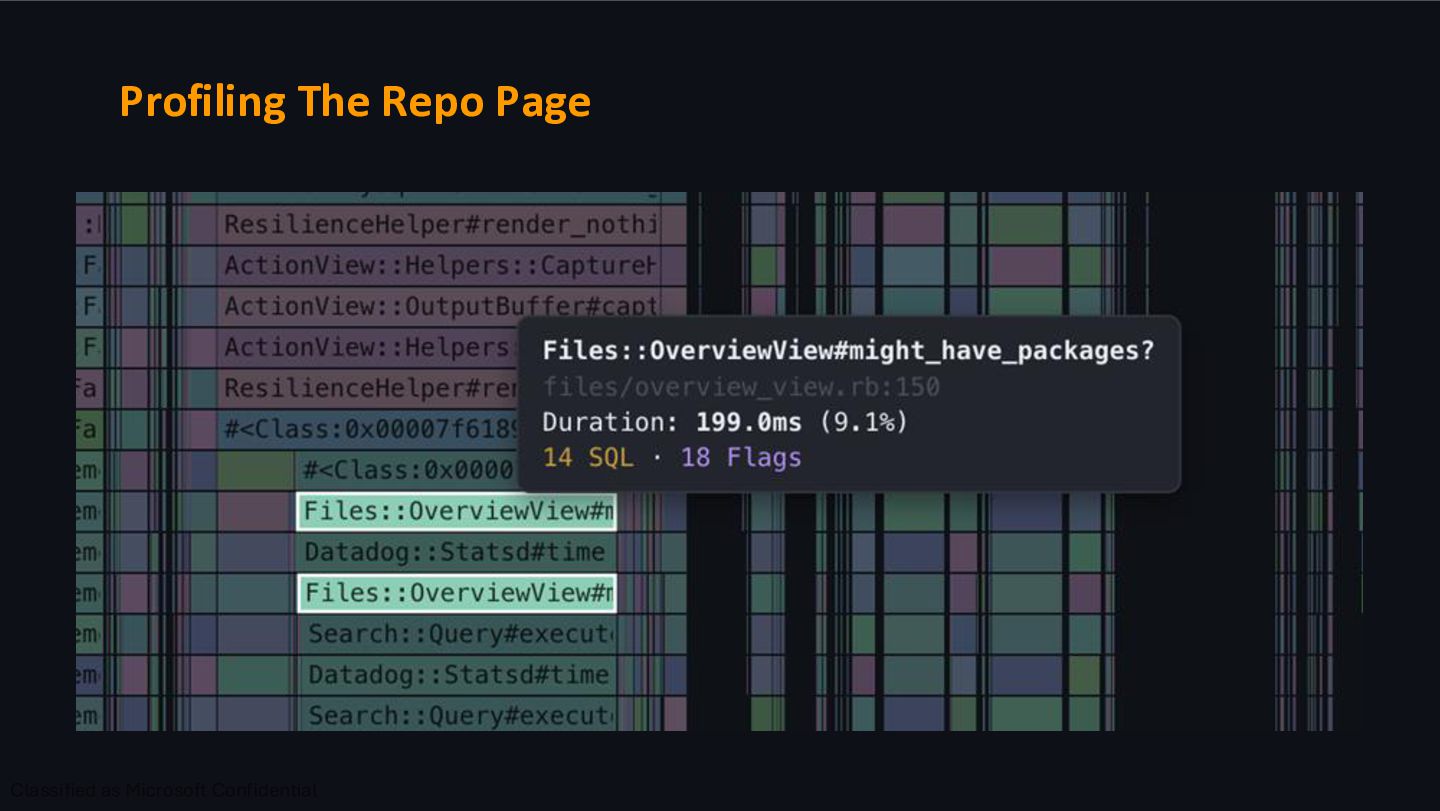
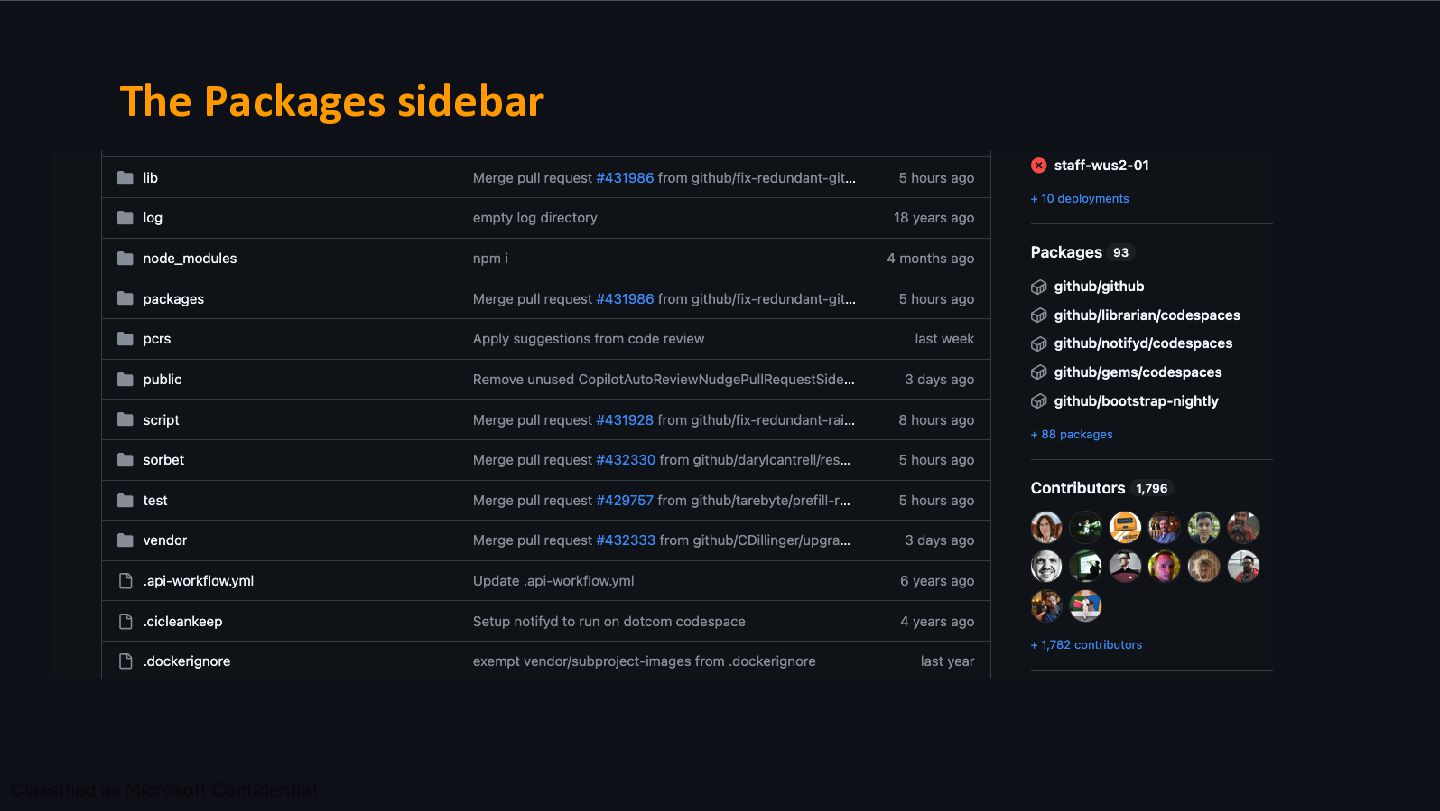
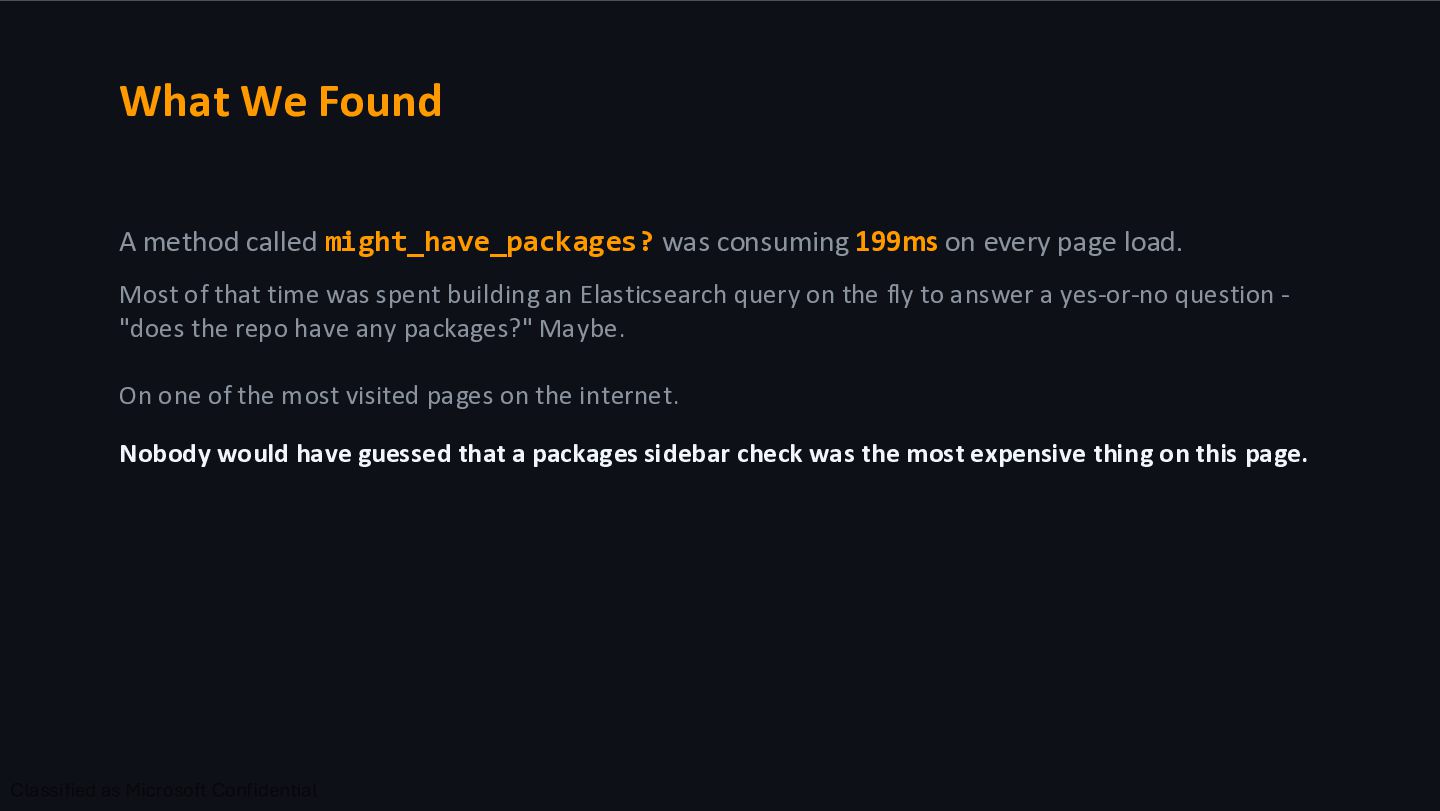
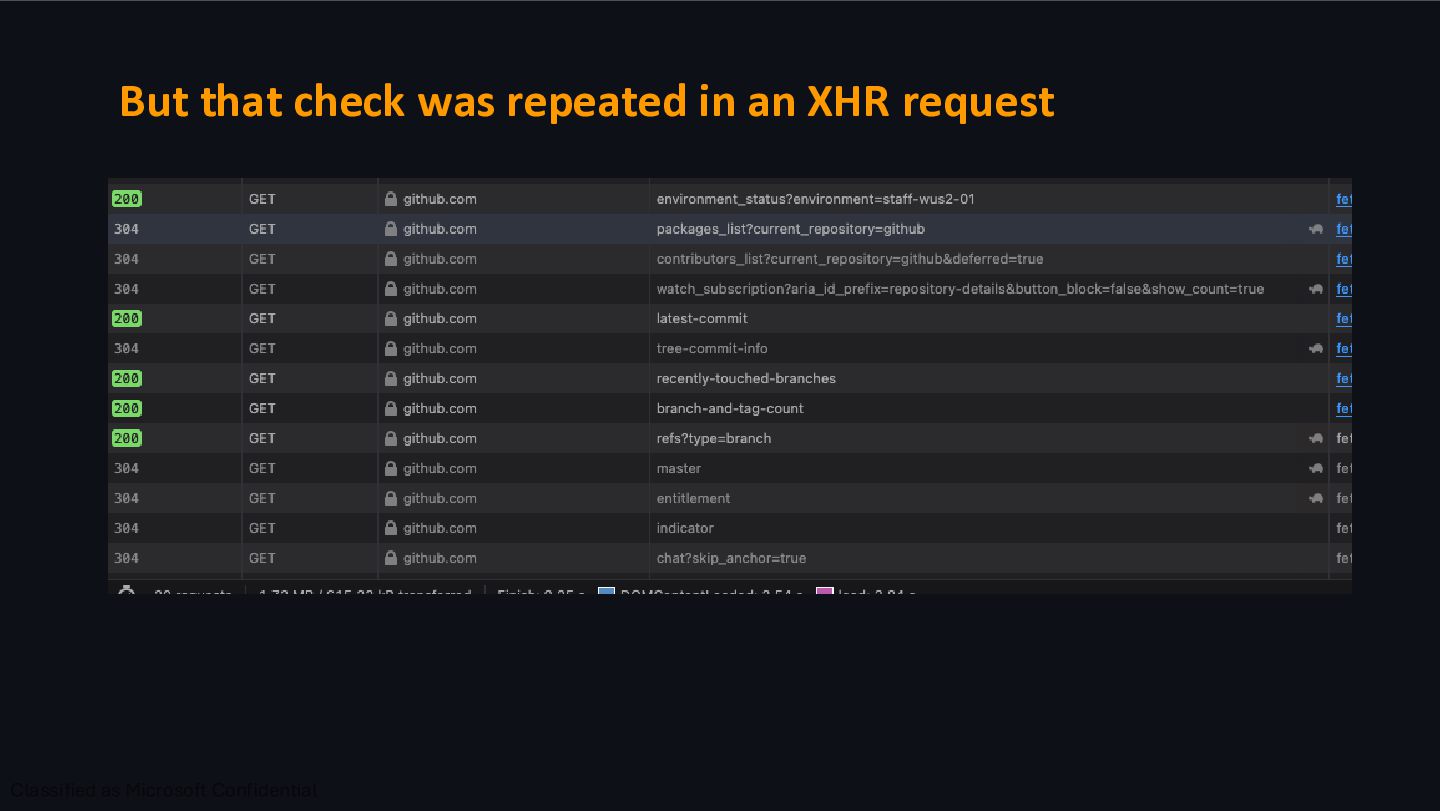
on every page load. Most of that time was spent building an Elasticsearch query on the fly to answer a yes-or-no question - "does the repo have any packages?" Maybe. On one of the most visited pages on the internet. Nobody would have guessed that a packages sidebar check was the most expensive thing on this page.
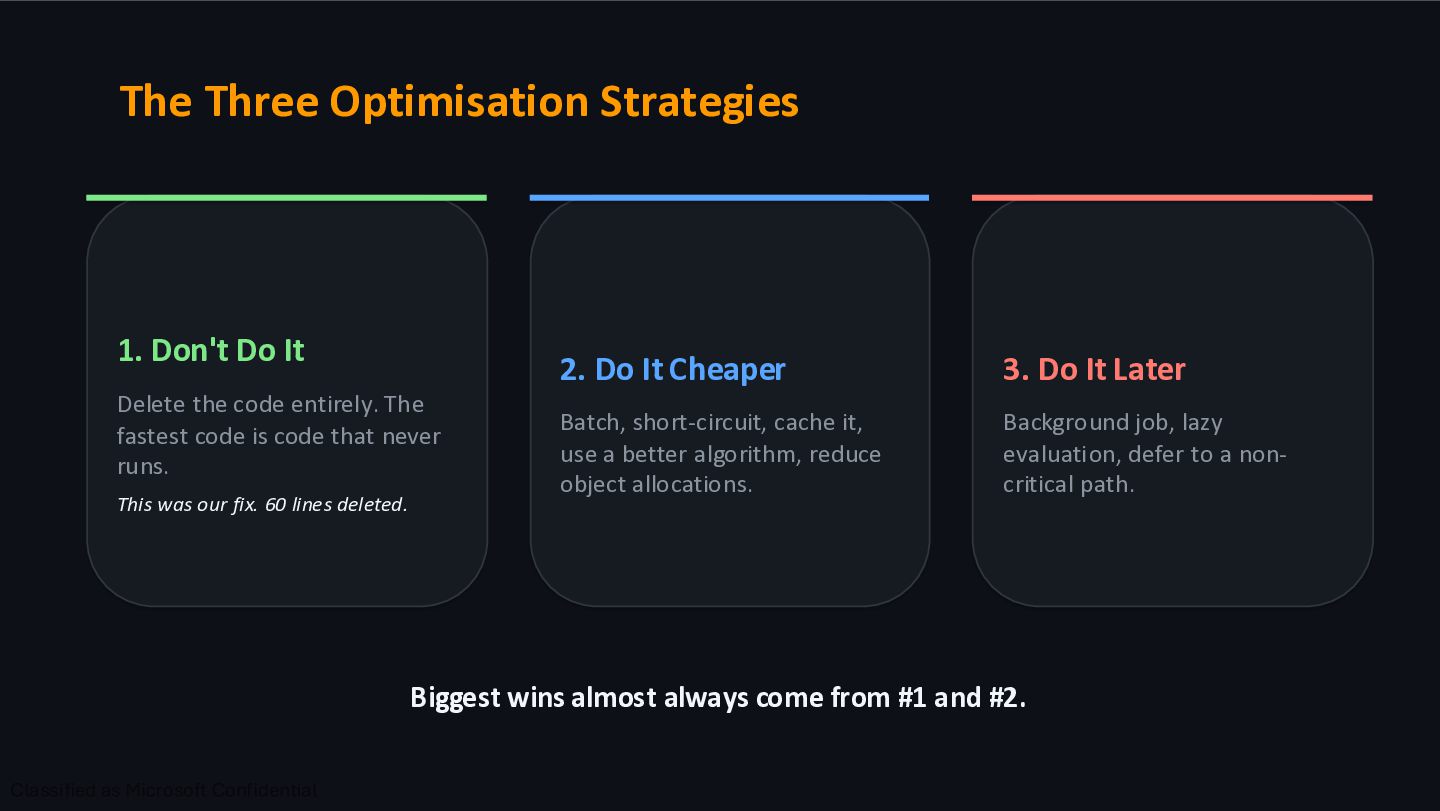
code entirely. The fastest code is code that never runs. This was our fix. 60 lines deleted. 2. Do It Cheaper Batch, short-circuit, cache it, use a better algorithm, reduce object allocations. 3. Do It Later Background job, lazy evaluation, defer to a non- critical path. Biggest wins almost always come from #1 and #2.
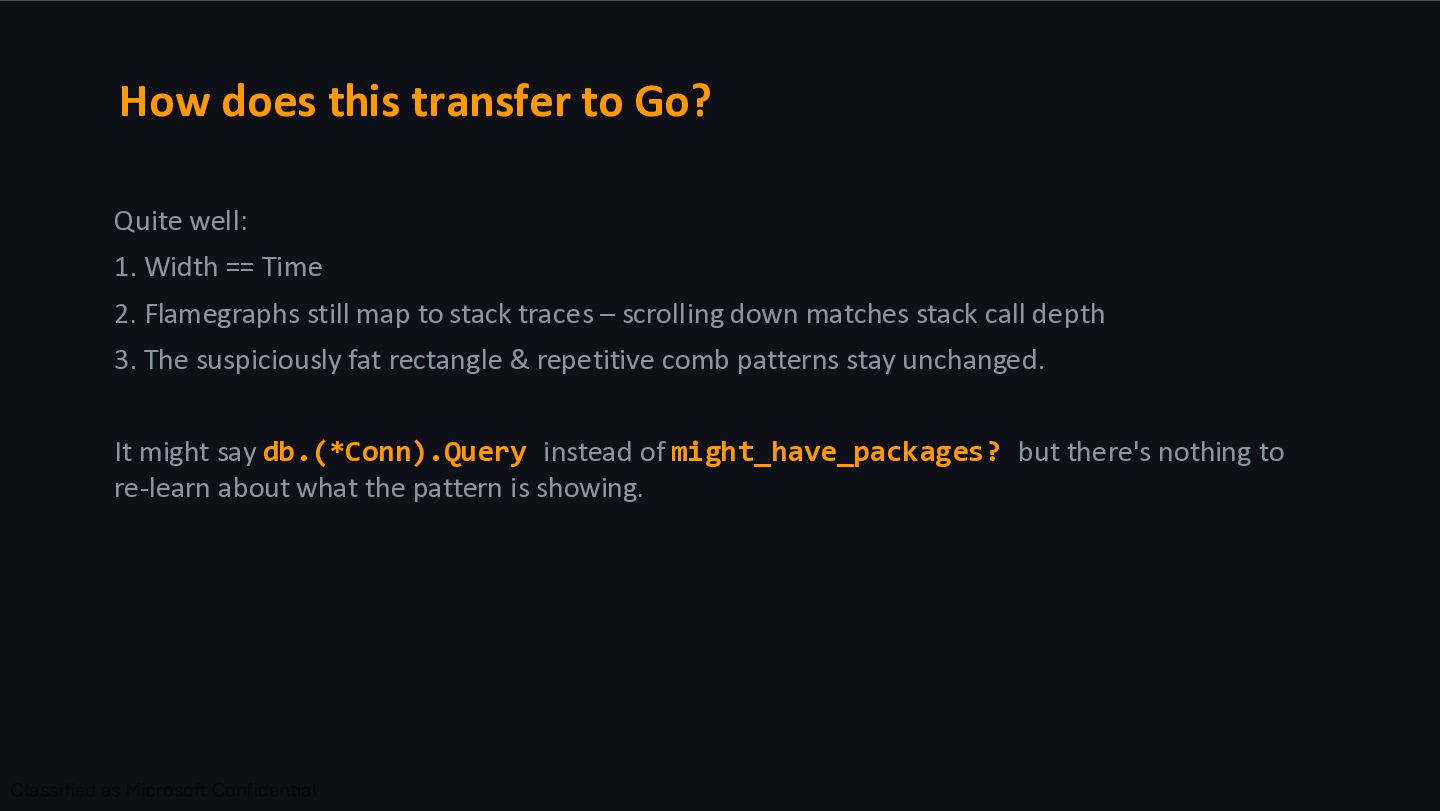
== Time 2. Flamegraphs still map to stack traces – scrolling down matches stack call depth 3. The suspiciously fat rectangle & repetitive comb patterns stay unchanged. It might say db.(*Conn).Query instead of might_have_packages? but there's nothing to re-learn about what the pattern is showing.
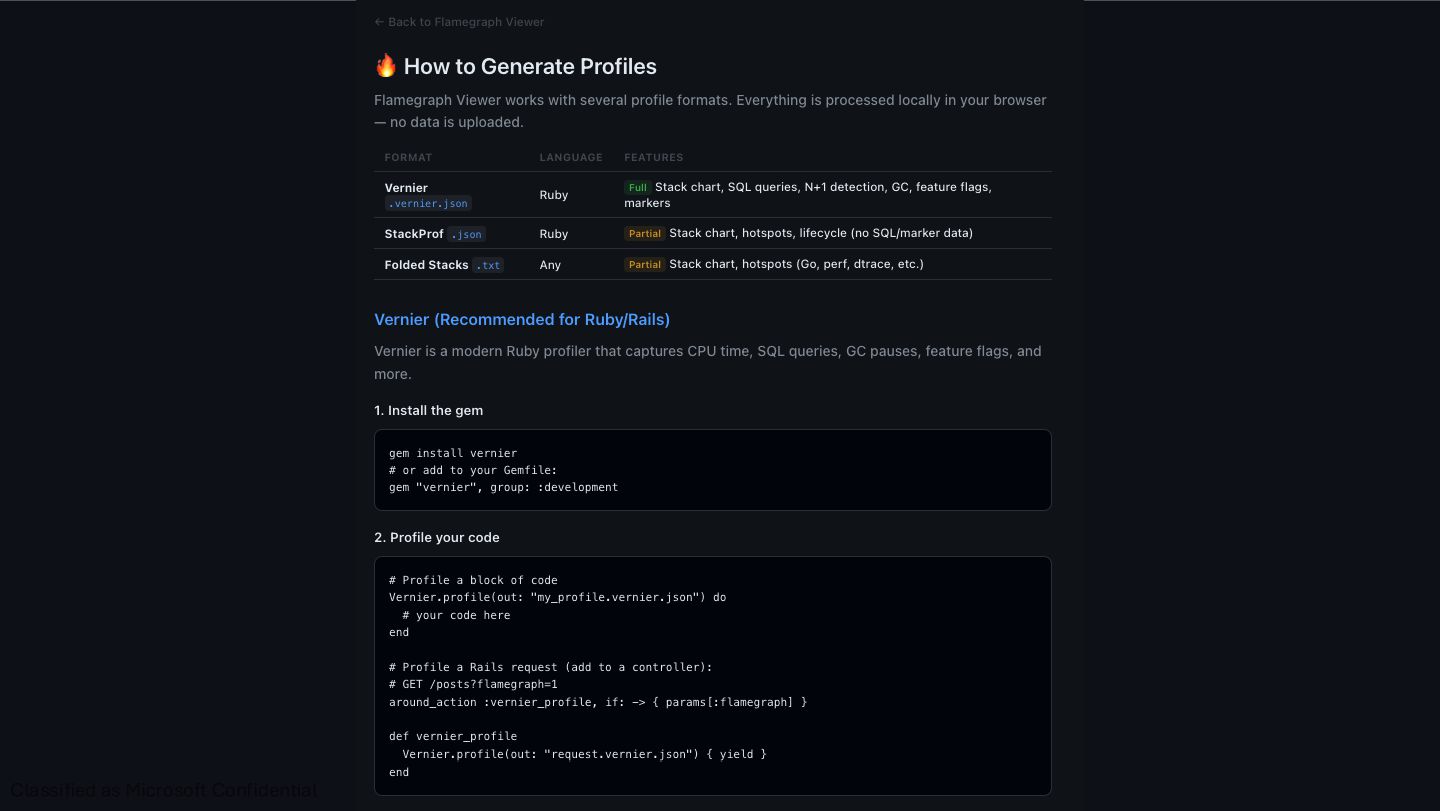
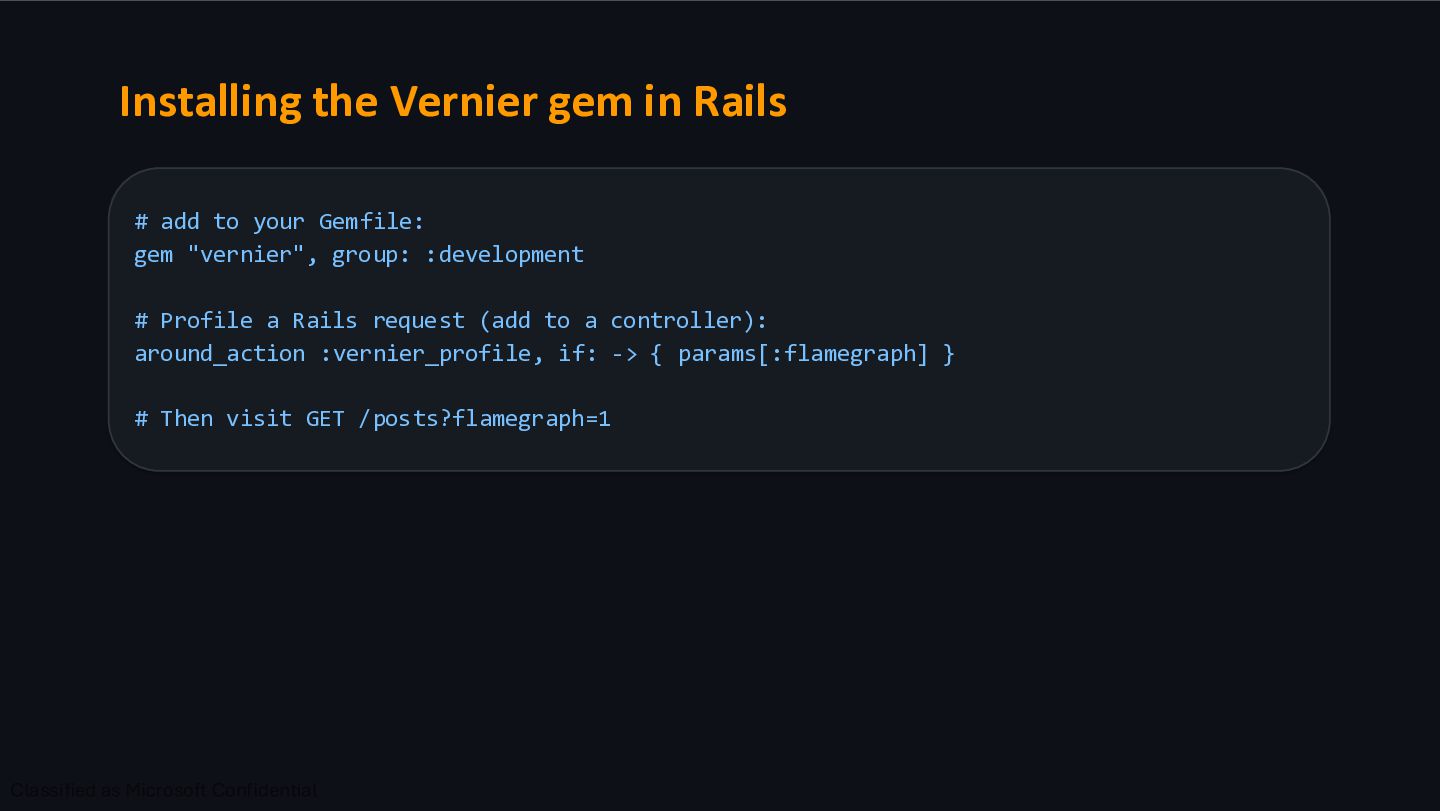
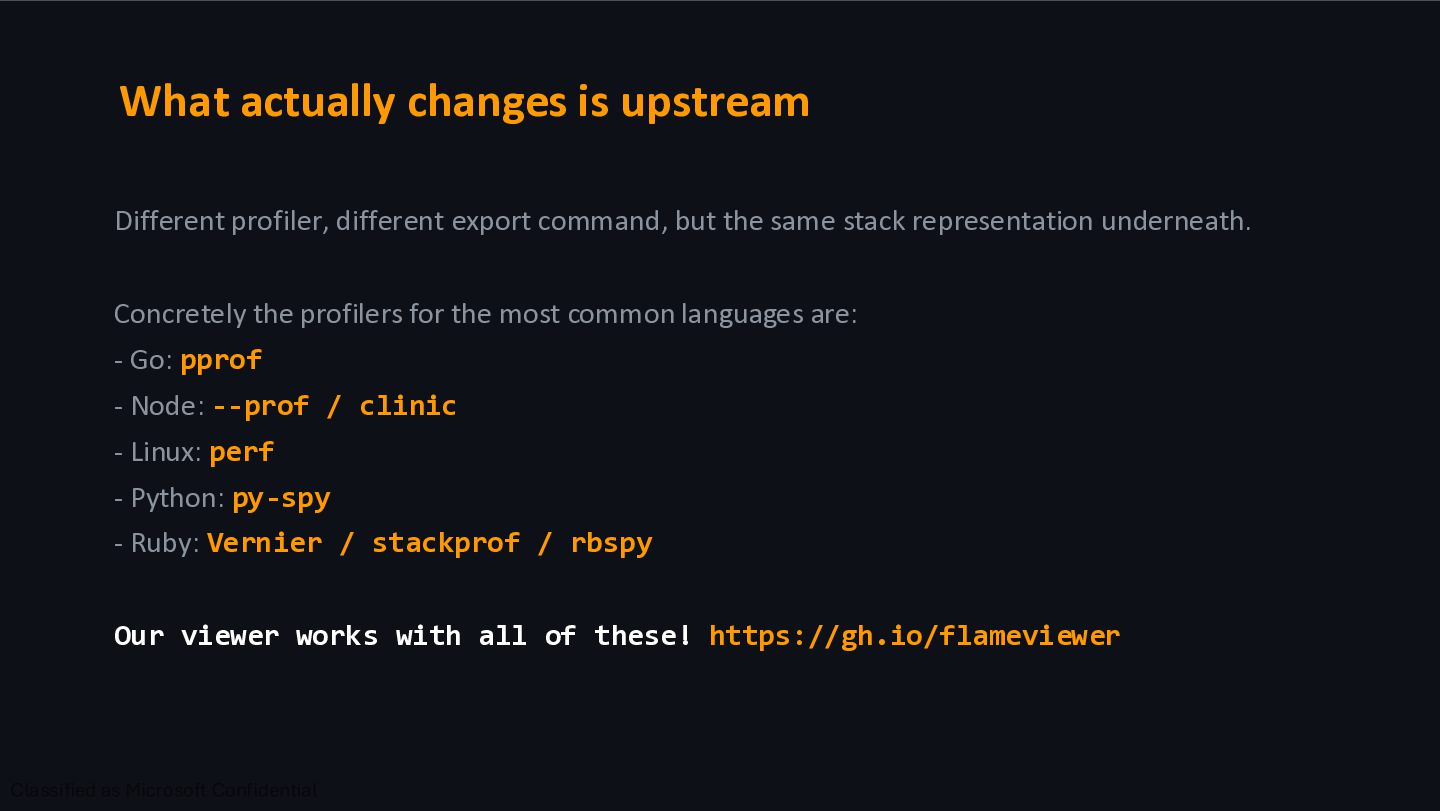
but the same stack representation underneath. Concretely the profilers for the most common languages are: - Go: pprof - Node: --prof / clinic - Linux: perf - Python: py-spy - Ruby: Vernier / stackprof / rbspy Our viewer works with all of these! https://gh.io/flameviewer
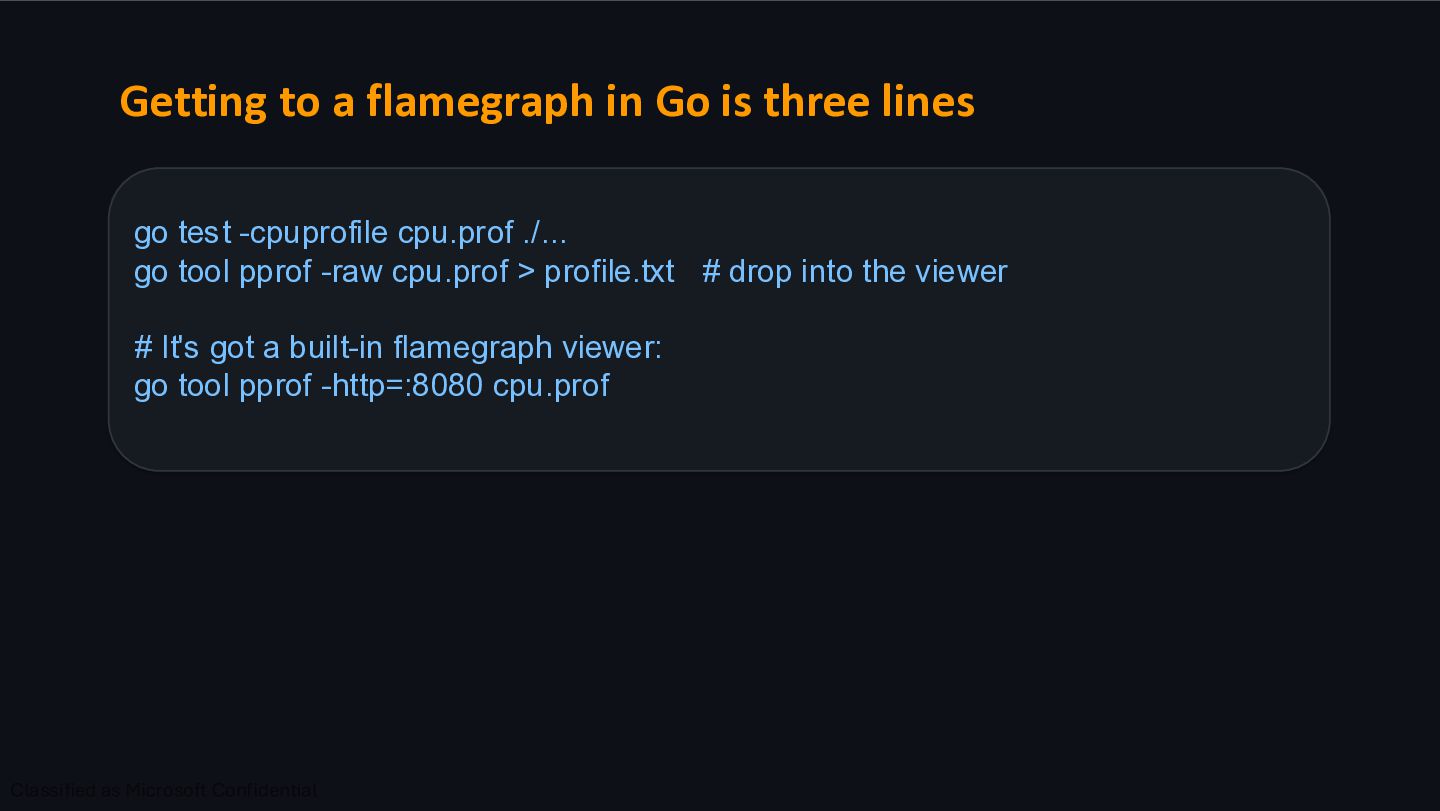
test -cpuprofile cpu.prof ./... go tool pprof -raw cpu.prof > profile.txt # drop into the viewer # It's got a built-in flamegraph viewer: go tool pprof -http=:8080 cpu.prof
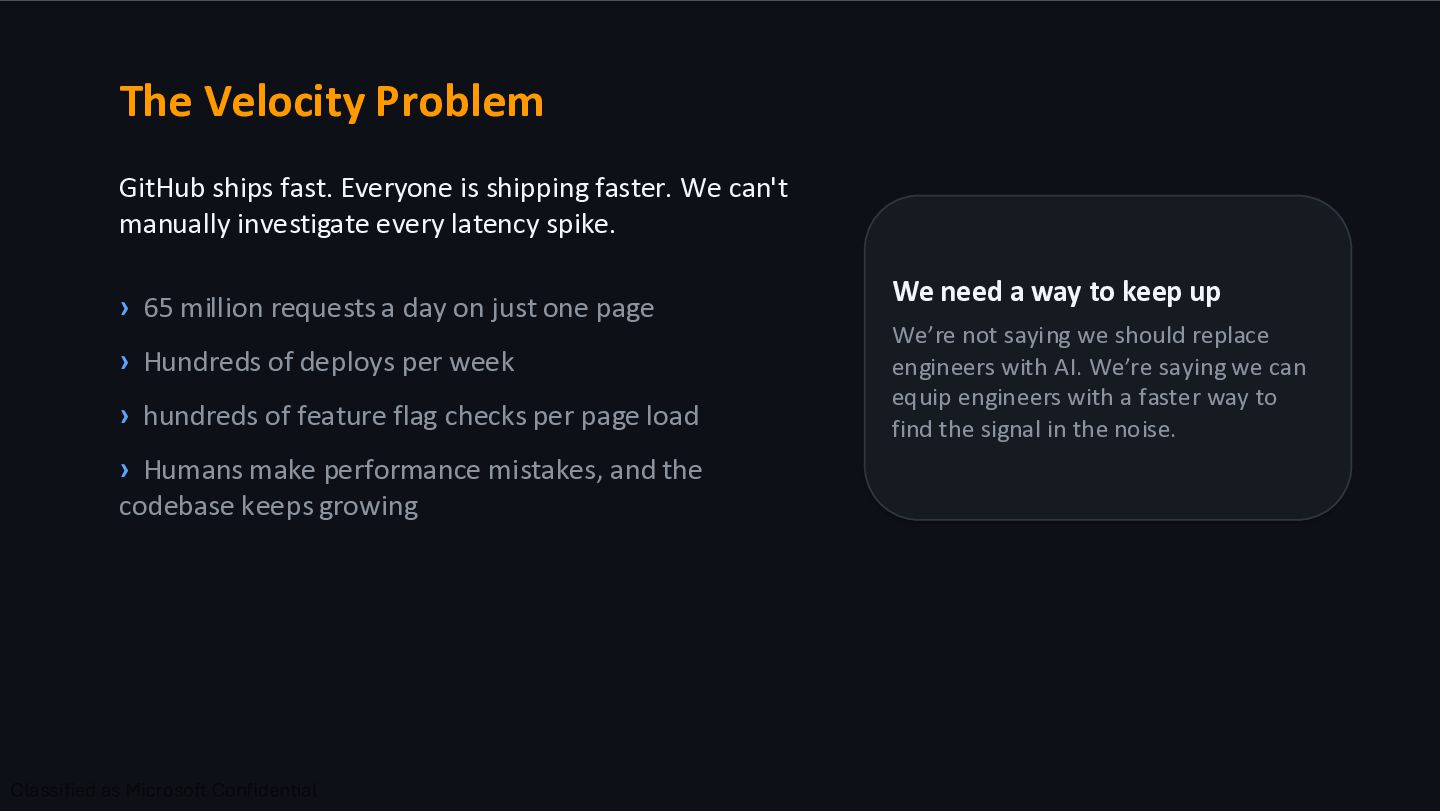
We can't manually investigate every latency spike. › 65 million requests a day on just one page › Hundreds of deploys per week › hundreds of feature flag checks per page load › Humans make performance mistakes, and the codebase keeps growing We need a way to keep up We’re not saying we should replace engineers with AI. We’re saying we can equip engineers with a faster way to find the signal in the noise.
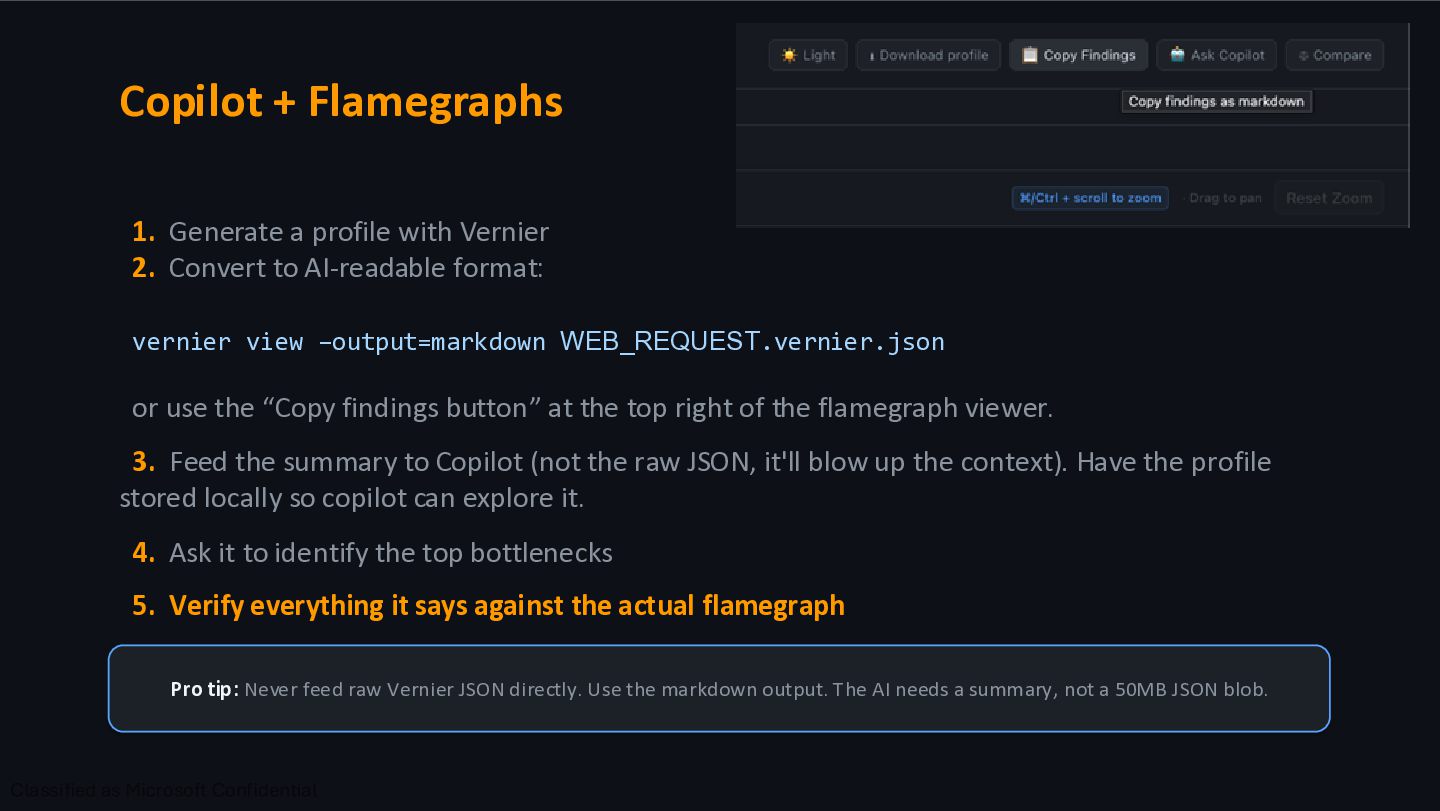
Convert to AI-readable format: vernier view –output=markdown WEB_REQUEST.vernier.json or use the “Copy findings button” at the top right of the flamegraph viewer. 3. Feed the summary to Copilot (not the raw JSON, it'll blow up the context). Have the profile stored locally so copilot can explore it. 4. Ask it to identify the top bottlenecks 5. Verify everything it says against the actual flamegraph Pro tip: Never feed raw Vernier JSON directly. Use the markdown output. The AI needs a summary, not a 50MB JSON blob.
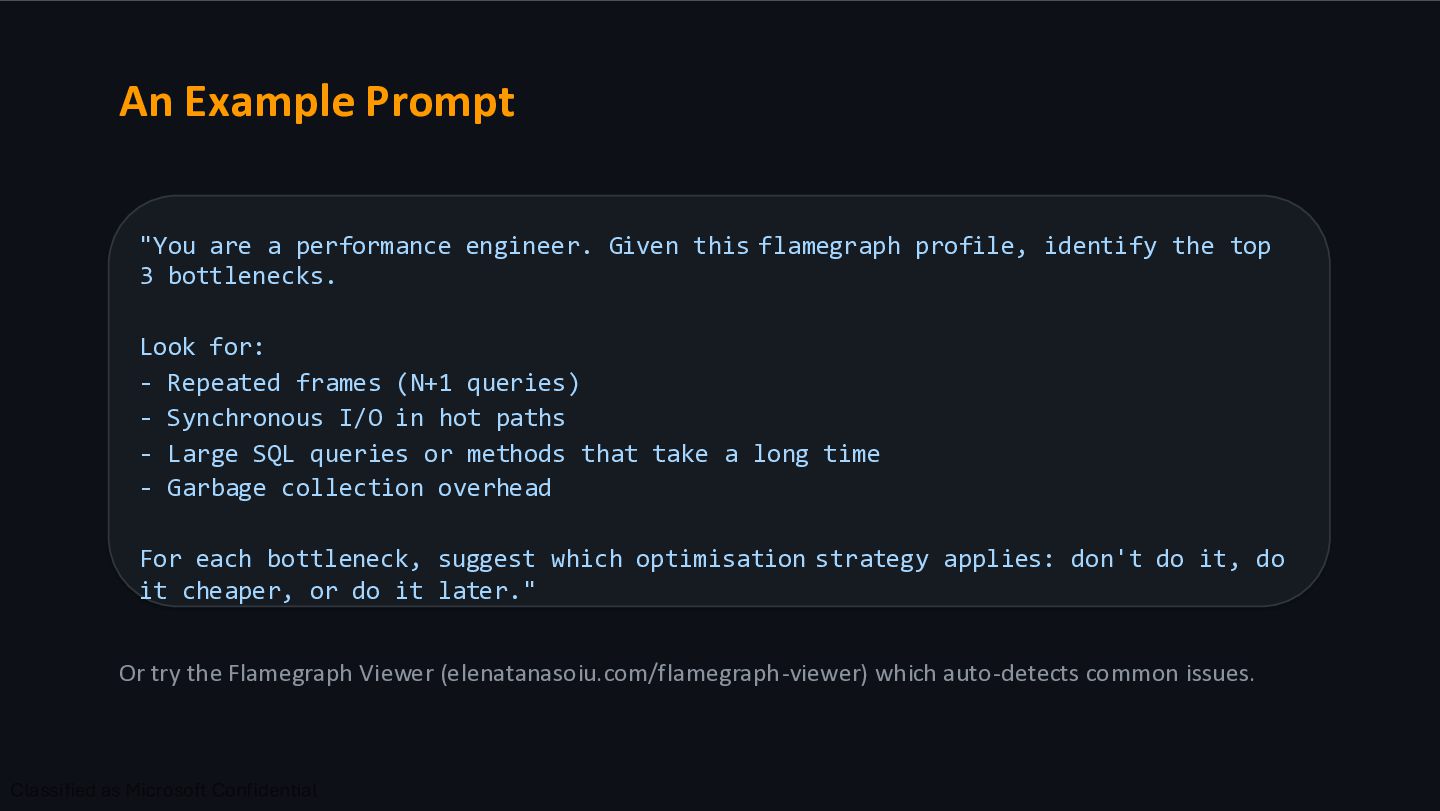
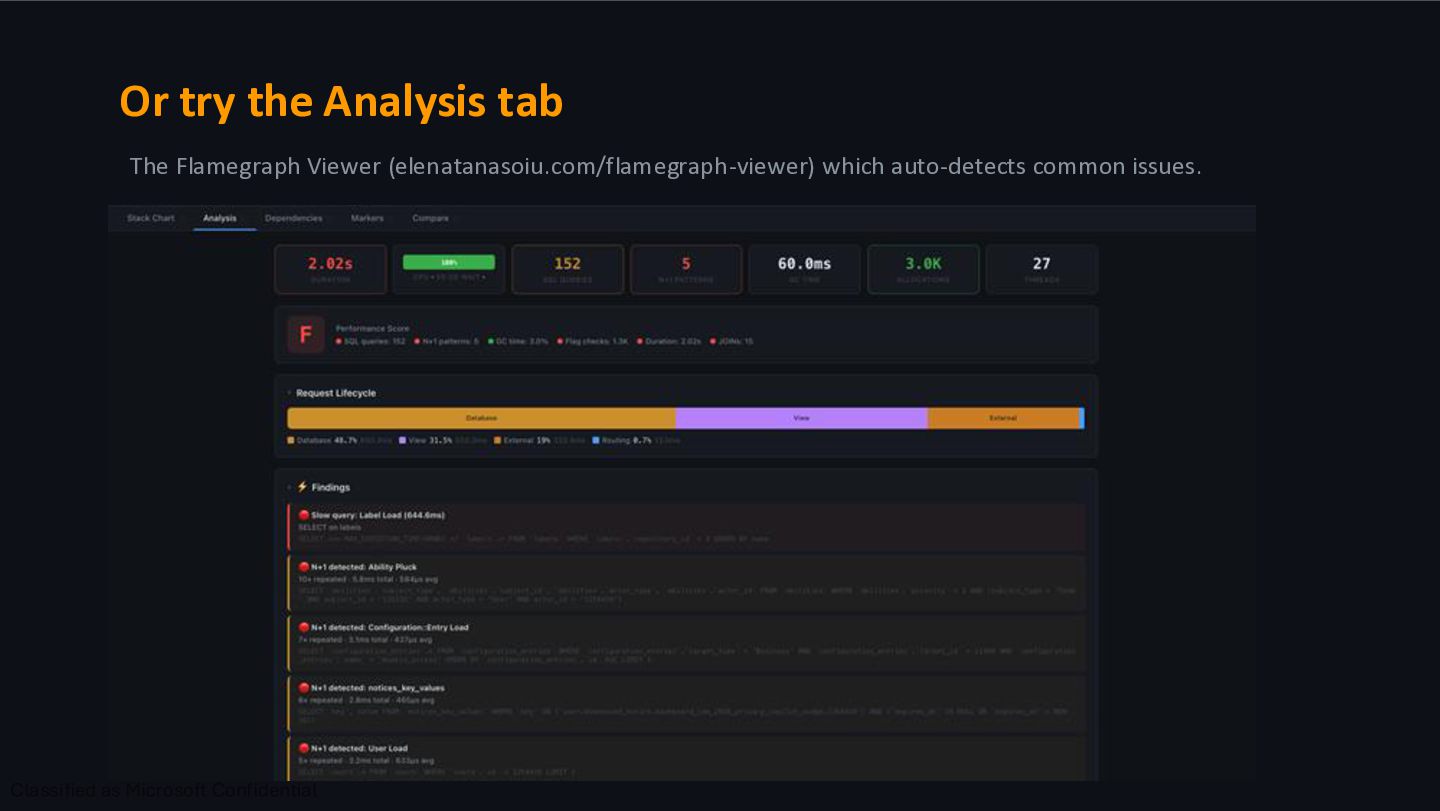
flamegraph profile, identify the top 3 bottlenecks. Look for: - Repeated frames (N+1 queries) - Synchronous I/O in hot paths - Large SQL queries or methods that take a long time - Garbage collection overhead For each bottleneck, suggest which optimisation strategy applies: don't do it, do it cheaper, or do it later." Or try the Flamegraph Viewer (elenatanasoiu.com/flamegraph-viewer) which auto-detects common issues.
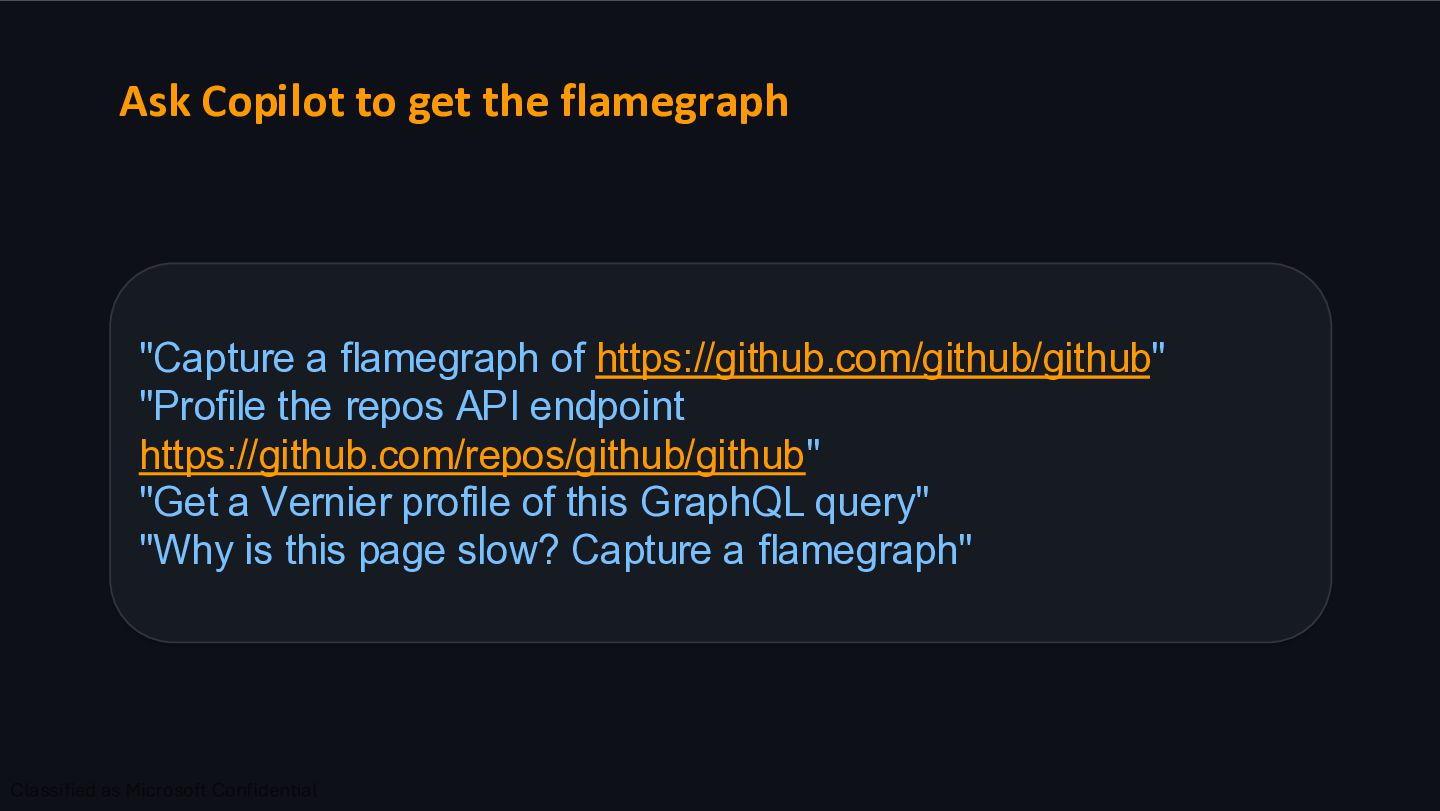
https://github.com/github/github" "Profile the repos API endpoint https://github.com/repos/github/github" "Get a Vernier profile of this GraphQL query" "Why is this page slow? Capture a flamegraph"
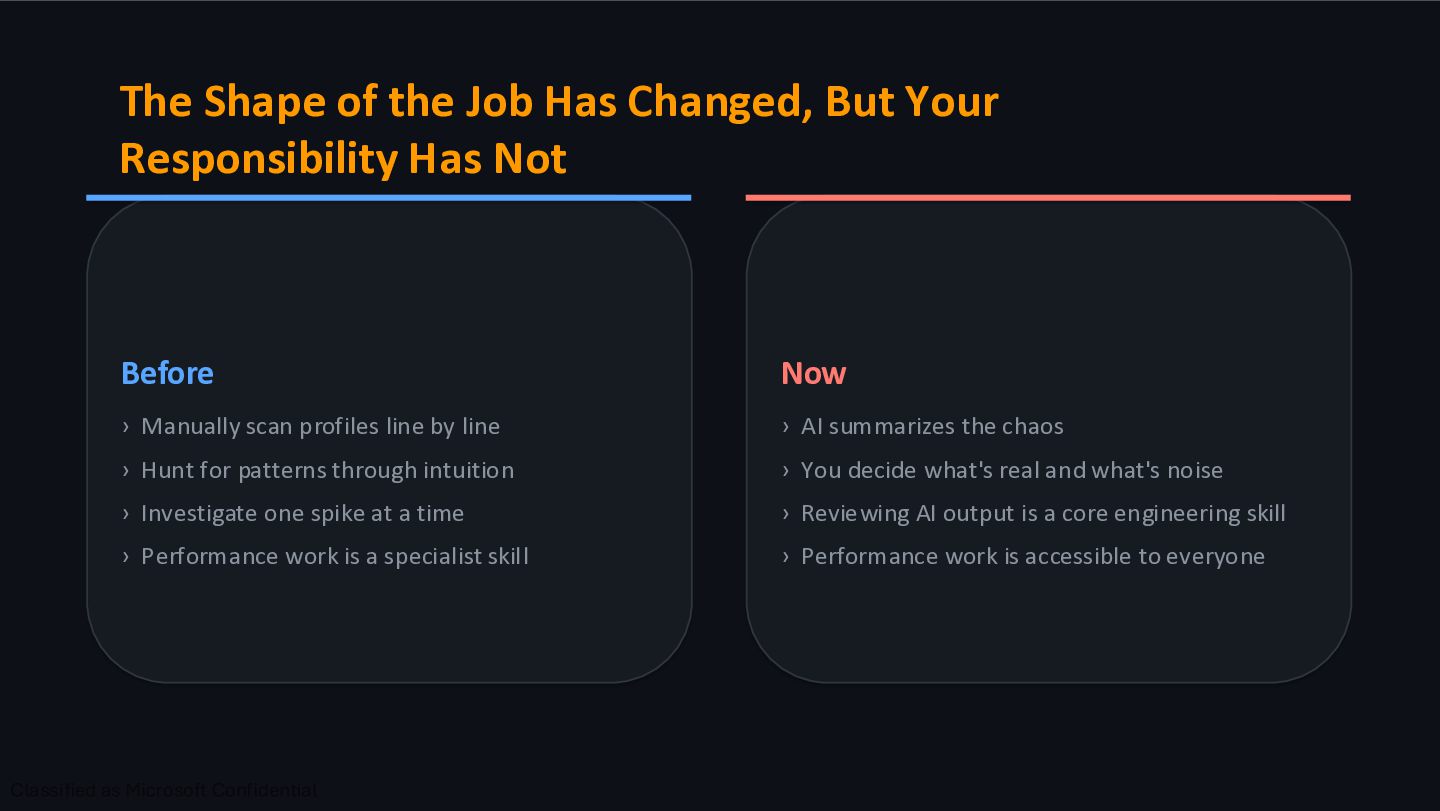
Has Not Before › Manually scan profiles line by line › Hunt for patterns through intuition › Investigate one spike at a time › Performance work is a specialist skill Now › AI summarizes the chaos › You decide what's real and what's noise › Reviewing AI output is a core engineering skill › Performance work is accessible to everyone
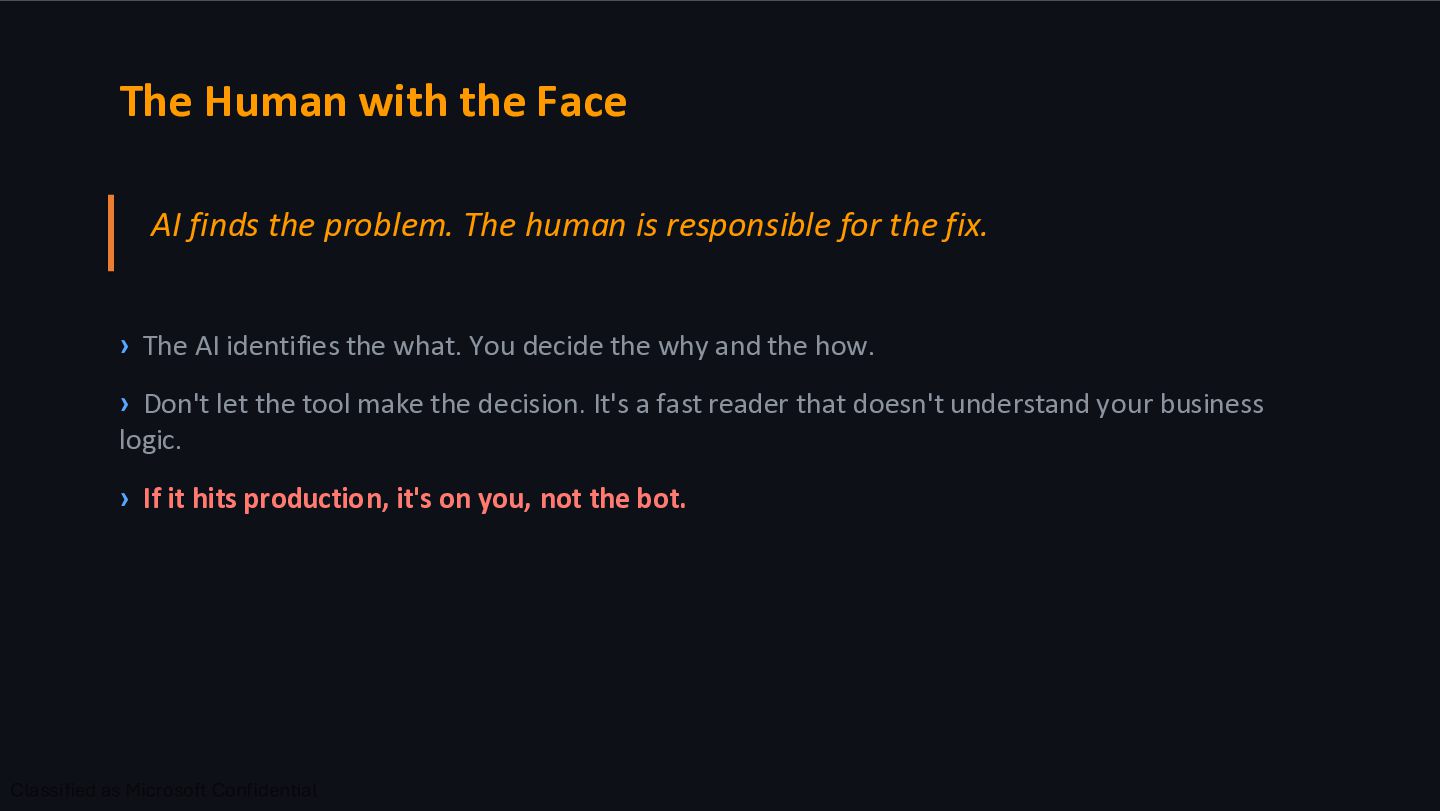
human is responsible for the fix. › The AI identifies the what. You decide the why and the how. › Don't let the tool make the decision. It's a fast reader that doesn't understand your business logic. › If it hits production, it's on you, not the bot.
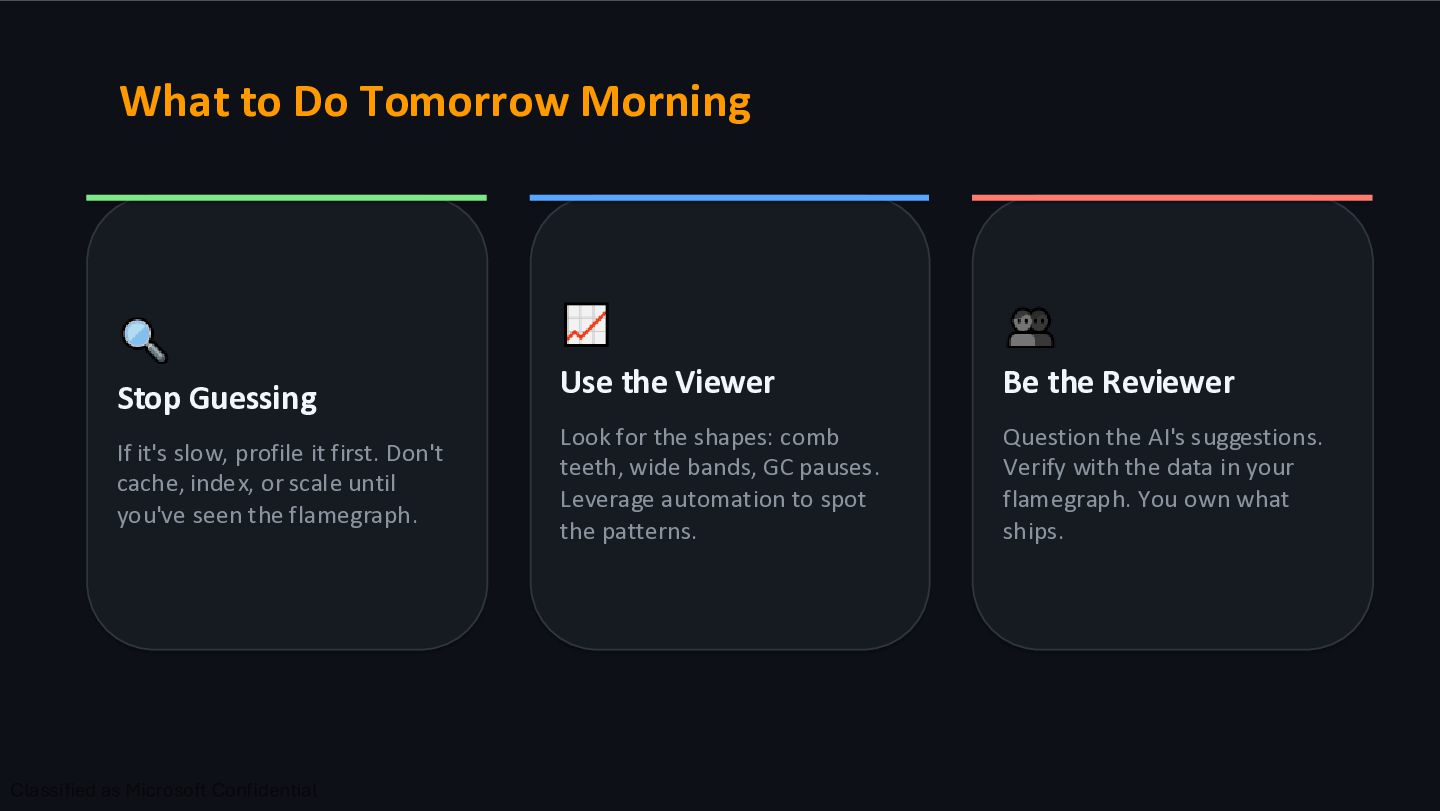
profile it first. Don't cache, index, or scale until you've seen the flamegraph. Use the Viewer Look for the shapes: comb teeth, wide bands, GC pauses. Leverage automation to spot the patterns. Be the Reviewer Question the AI's suggestions. Verify with the data in your flamegraph. You own what ships.