Share
Assisted reorganization of data structures
Assisted reorganization of data structures.
The kernel git history is littered with patches moving struct members around to improve performance by grouping together related fields and moving apart unrelated ones that cause false sharing.
All this to improve the use of the cache hierarchy, which can lead to great performance improvements.
This is done by careful inspection, painstakingly looking at profiles, can we do better?
Recent additions to processors help and recent improvements in perf to use these hardware facilities to do data-type profiling gets us closer to that.
This talk will look at what we can do to further improve our current toolset to find groups of related fields to automate both finding better struct layouts and to have it in regression testing to avoid messing with good struct layouts when adding new fields.
Arnaldo CARVALHO DE MELO

Kernel Recipes PRO
Transcript
59 slides
-
ASSISTED REORGANIZATION OF DATA STRUCTURES Arnaldo Carvalho de Melo [email protected]
Red Hat Kernel Recipes, Paris, 2024 -
WHAT IS THIS ABOUT? Data structures Computer architectures Cache lines
A hierarchy Slower as you go -
Do I have to care? The compiler should do it!
Programmers surely pick the right data structures And algorithms? -
What prevents me from changing those layouts? ABI: Aplication Binary
Interface Kernel/Userspace: syscalls, tracepoints Programs/Libraries Who can help me noticing these details? -
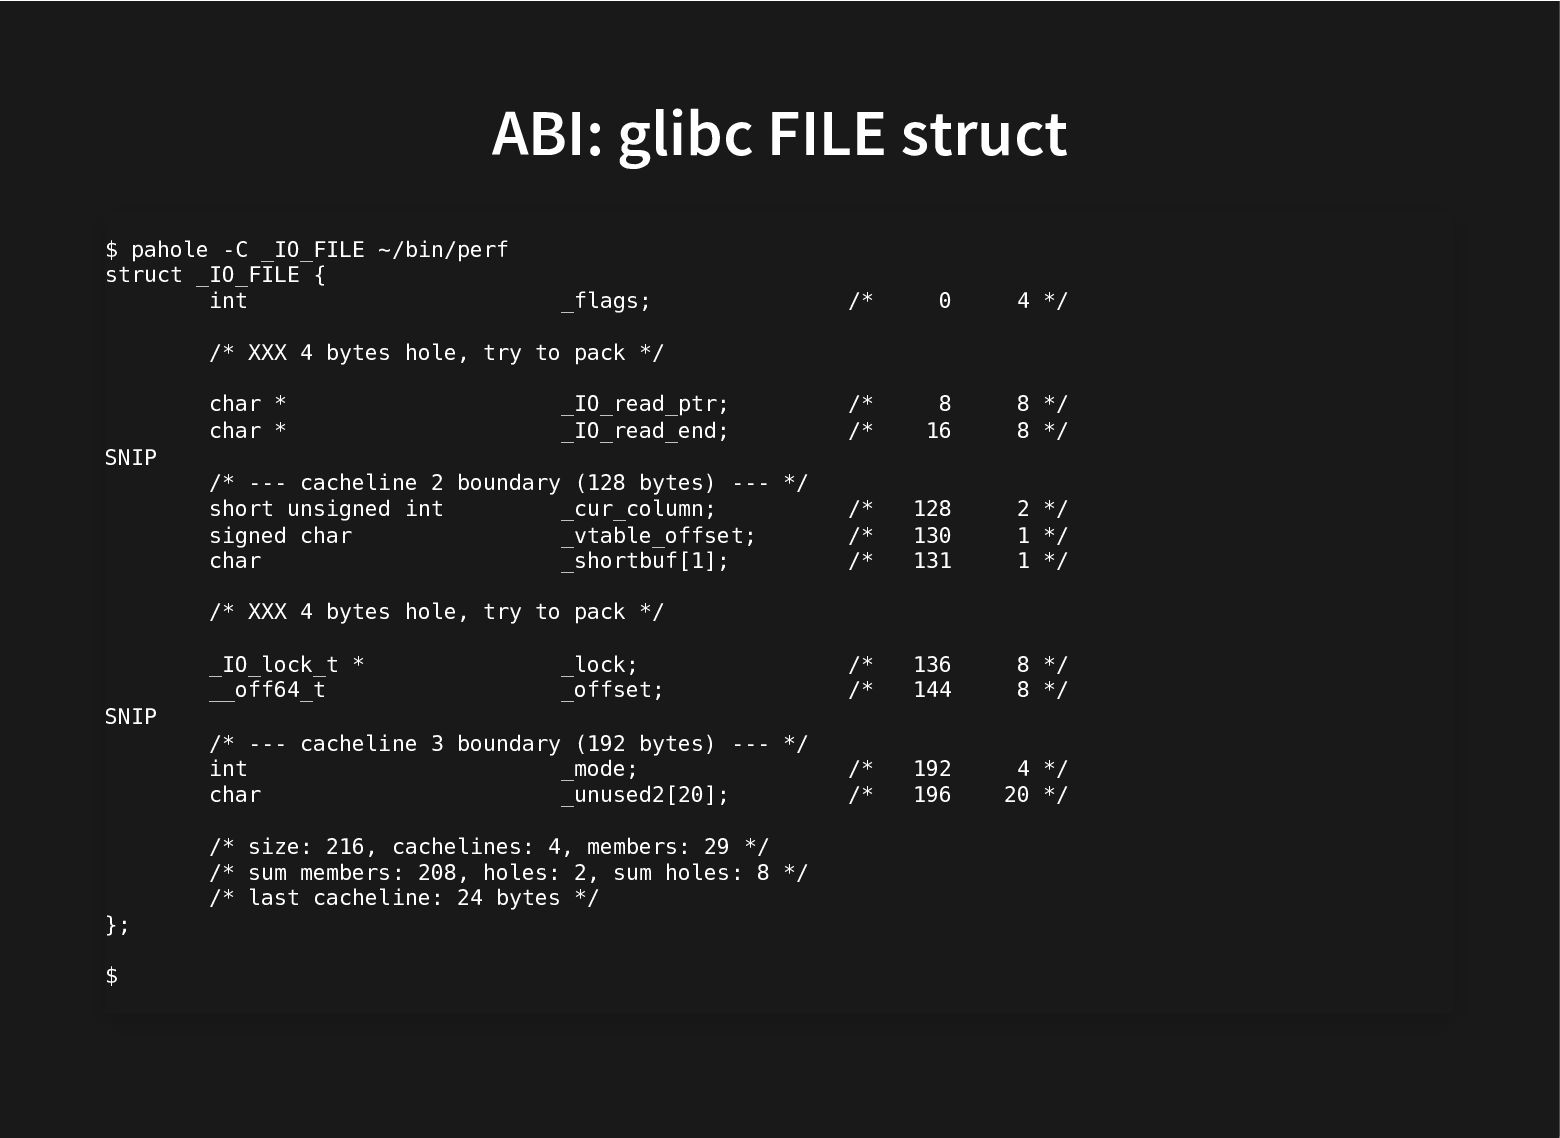
ABI: glibc FILE struct $ pahole -C _IO_FILE ~/bin/perf struct
_IO_FILE { int _flags; /* 0 4 */ /* XXX 4 bytes hole, try to pack */ char * _IO_read_ptr; /* 8 8 */ char * _IO_read_end; /* 16 8 */ SNIP /* --- cacheline 2 boundary (128 bytes) --- */ short unsigned int _cur_column; /* 128 2 */ signed char _vtable_offset; /* 130 1 */ char _shortbuf[1]; /* 131 1 */ /* XXX 4 bytes hole, try to pack */ _IO_lock_t * _lock; /* 136 8 */ __off64_t _offset; /* 144 8 */ SNIP /* --- cacheline 3 boundary (192 bytes) --- */ int _mode; /* 192 4 */ char _unused2[20]; /* 196 20 */ /* size: 216, cachelines: 4, members: 29 */ /* sum members: 208, holes: 2, sum holes: 8 */ /* last cacheline: 24 bytes */ }; $ -
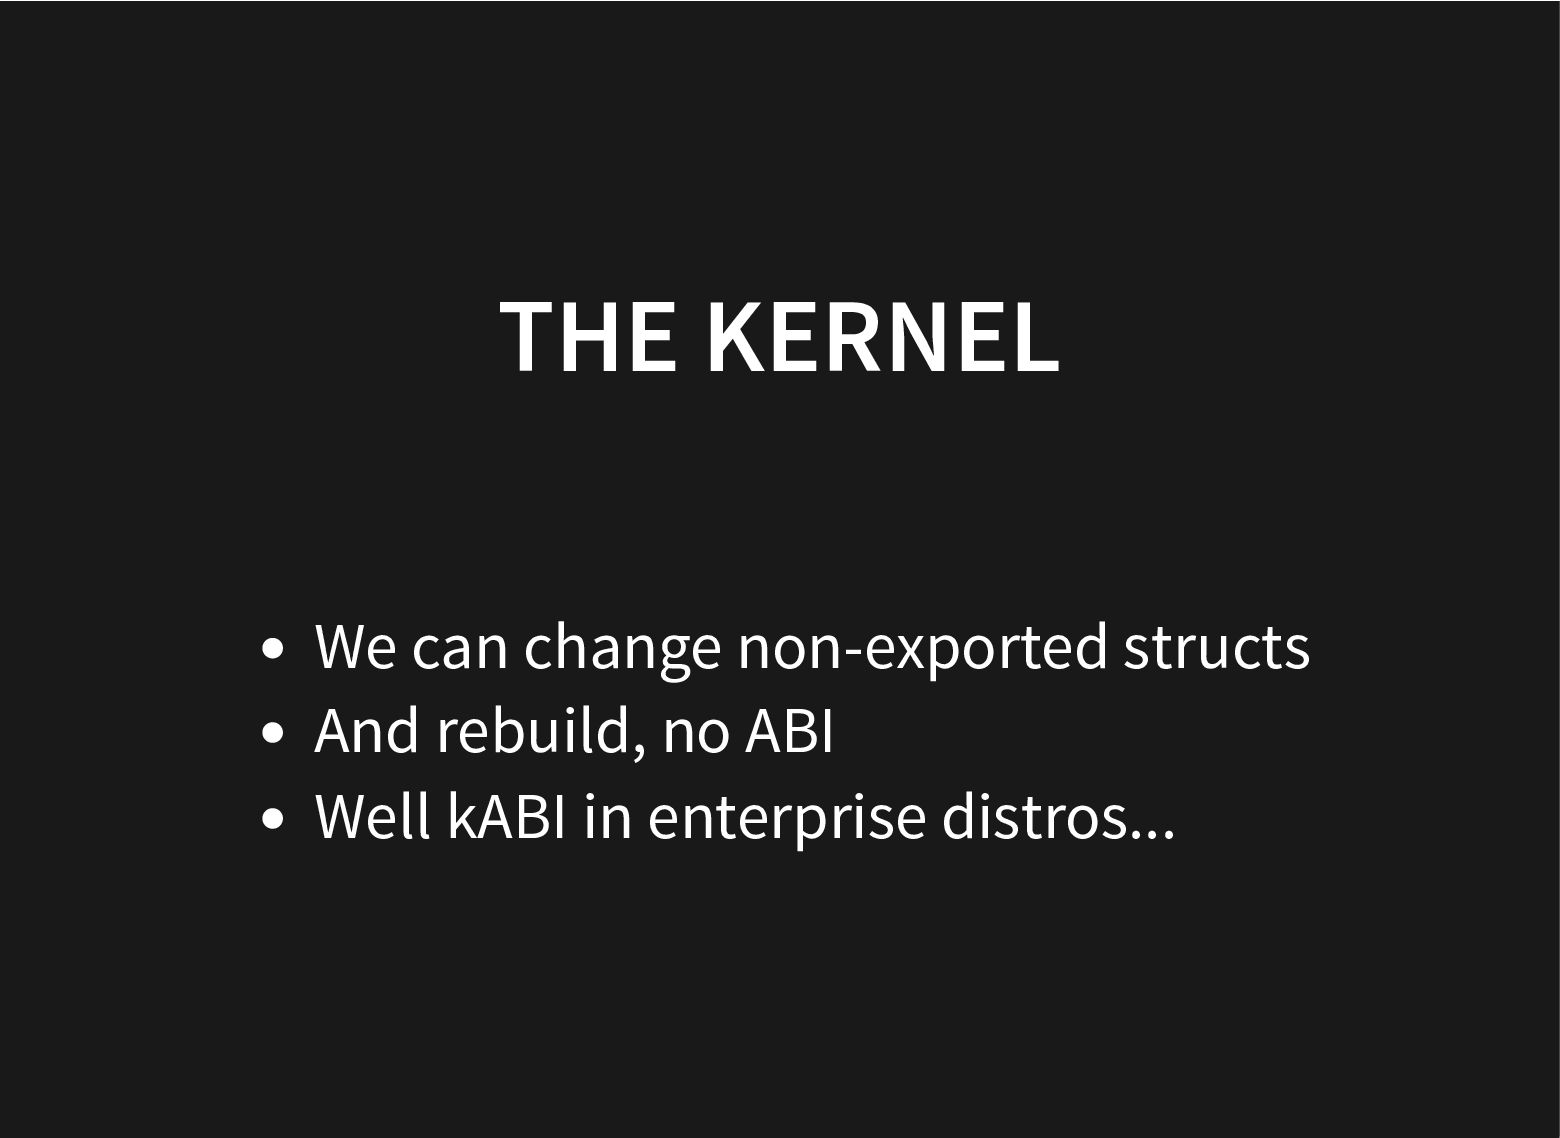
THE KERNEL We can change non-exported structs And rebuild, no
ABI Well kABI in enterprise distros... -
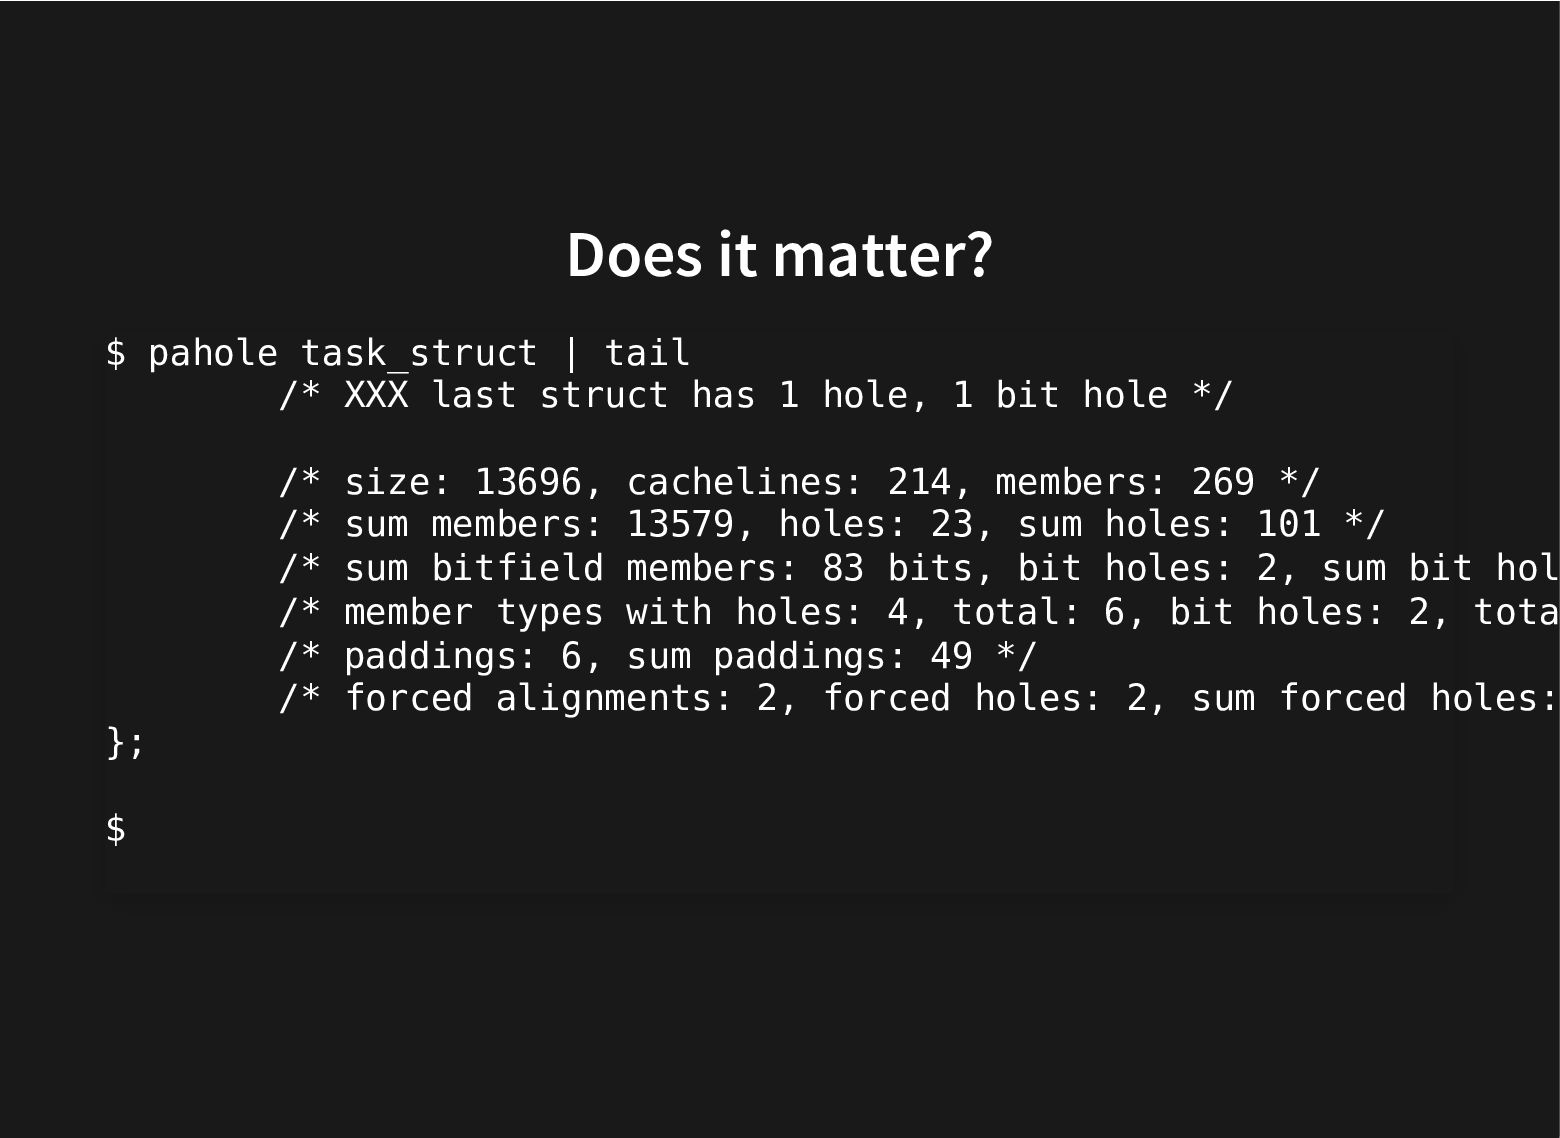
Does it matter? $ pahole task_struct | tail /* XXX
last struct has 1 hole, 1 bit hole */ /* size: 13696, cachelines: 214, members: 269 */ /* sum members: 13579, holes: 23, sum holes: 101 */ /* sum bitfield members: 83 bits, bit holes: 2, sum bit hol /* member types with holes: 4, total: 6, bit holes: 2, tota /* paddings: 6, sum paddings: 49 */ /* forced alignments: 2, forced holes: 2, sum forced holes: }; $ -
LOTS OF CACHELINES Carefully crafted Related fields put together Bring
a field plus the ones that will be used next Mostly written fields in separate cachelines To avoid cache trashing/false sharing -
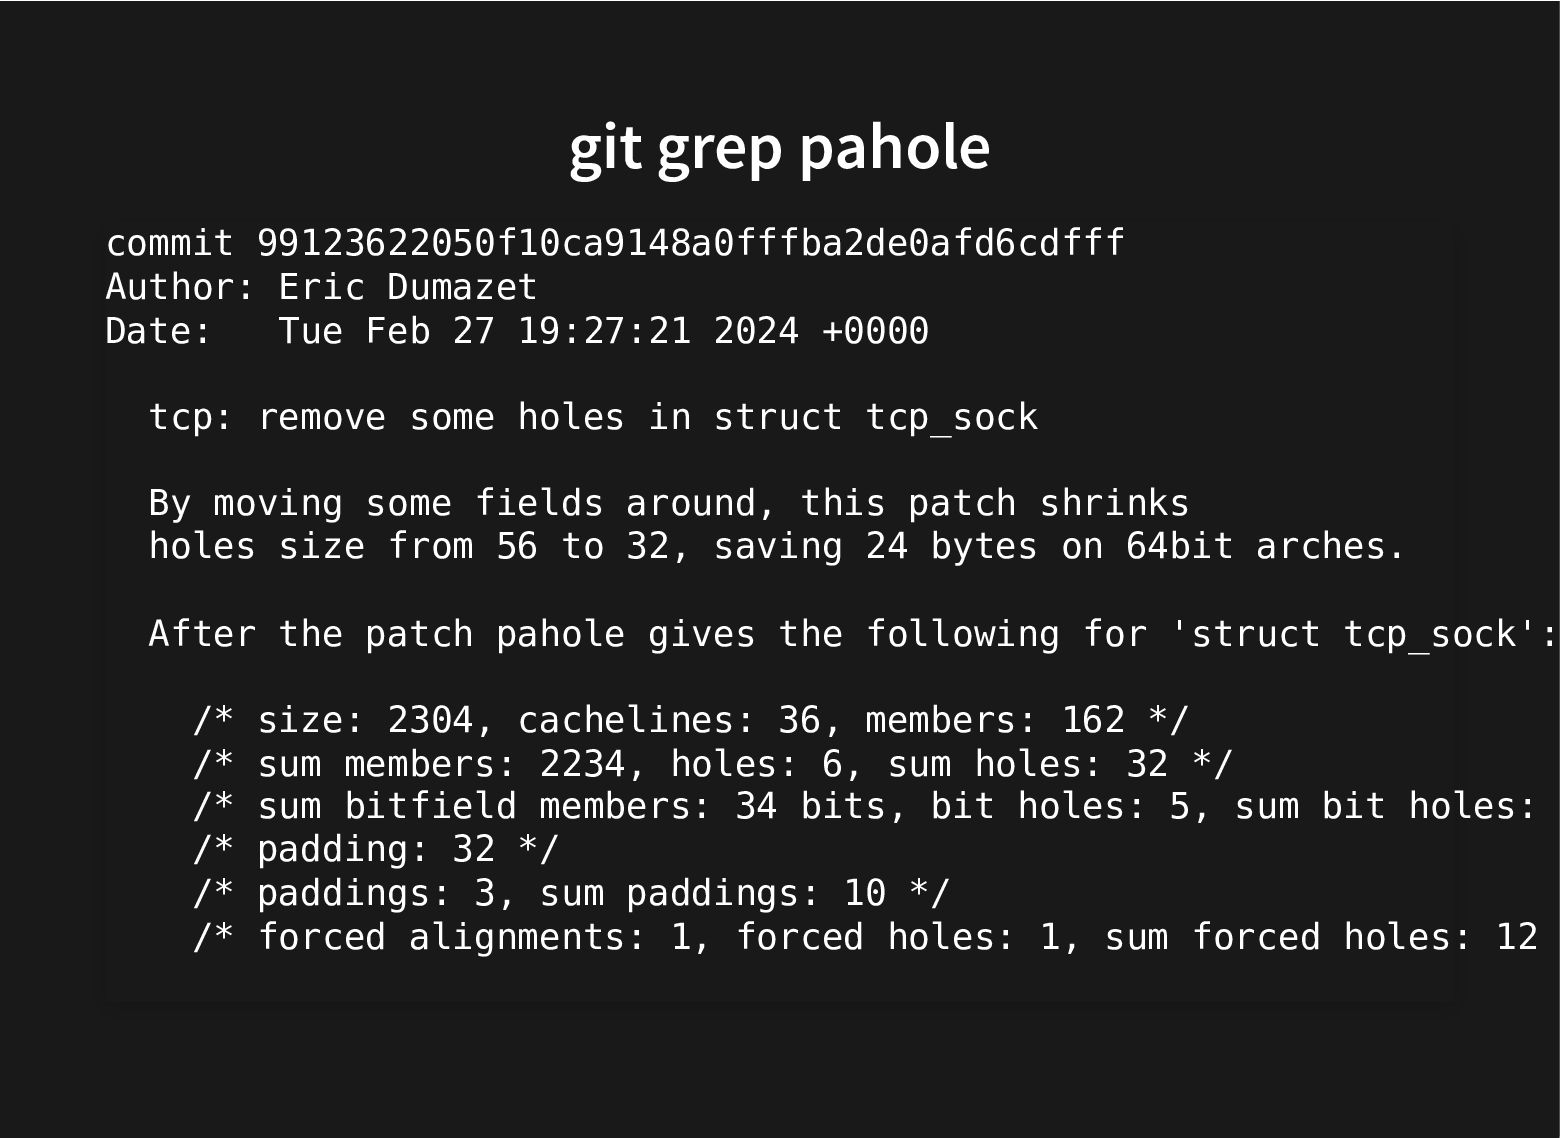
git grep pahole commit 99123622050f10ca9148a0fffba2de0afd6cdfff Author: Eric Dumazet Date: Tue
Feb 27 19:27:21 2024 +0000 tcp: remove some holes in struct tcp_sock By moving some fields around, this patch shrinks holes size from 56 to 32, saving 24 bytes on 64bit arches. After the patch pahole gives the following for 'struct tcp_sock': /* size: 2304, cachelines: 36, members: 162 */ /* sum members: 2234, holes: 6, sum holes: 32 */ /* sum bitfield members: 34 bits, bit holes: 5, sum bit holes: /* padding: 32 */ /* paddings: 3, sum paddings: 10 */ /* forced alignments: 1, forced holes: 1, sum forced holes: 12 -
DOES IT MATTER? The networking guys do think so Recent
work on grouping related struct fields And on making sure they stay related -
cacheline groups $ pahole tcp_sock | grep cacheline_group __u8 __cacheline_group_begin__tcp_sock_read_tx[0];
/* __u8 __cacheline_group_end__tcp_sock_read_tx[0]; /* __u8 __cacheline_group_begin__tcp_sock_read_txrx[0]; /* __u8 __cacheline_group_end__tcp_sock_read_txrx[0]; /* __u8 __cacheline_group_begin__tcp_sock_read_rx[0]; /* __u8 __cacheline_group_end__tcp_sock_read_rx[0]; /* __u8 __cacheline_group_begin__tcp_sock_write_tx[0]; /* __u8 __cacheline_group_end__tcp_sock_write_tx[0]; /* __u8 __cacheline_group_begin__tcp_sock_write_txrx[0]; /* __u8 __cacheline_group_end__tcp_sock_write_txrx[0]; /* __u8 __cacheline_group_begin__tcp_sock_write_rx[0]; /* __u8 __cacheline_group_end__tcp_sock_write_rx[0]; /* $ -
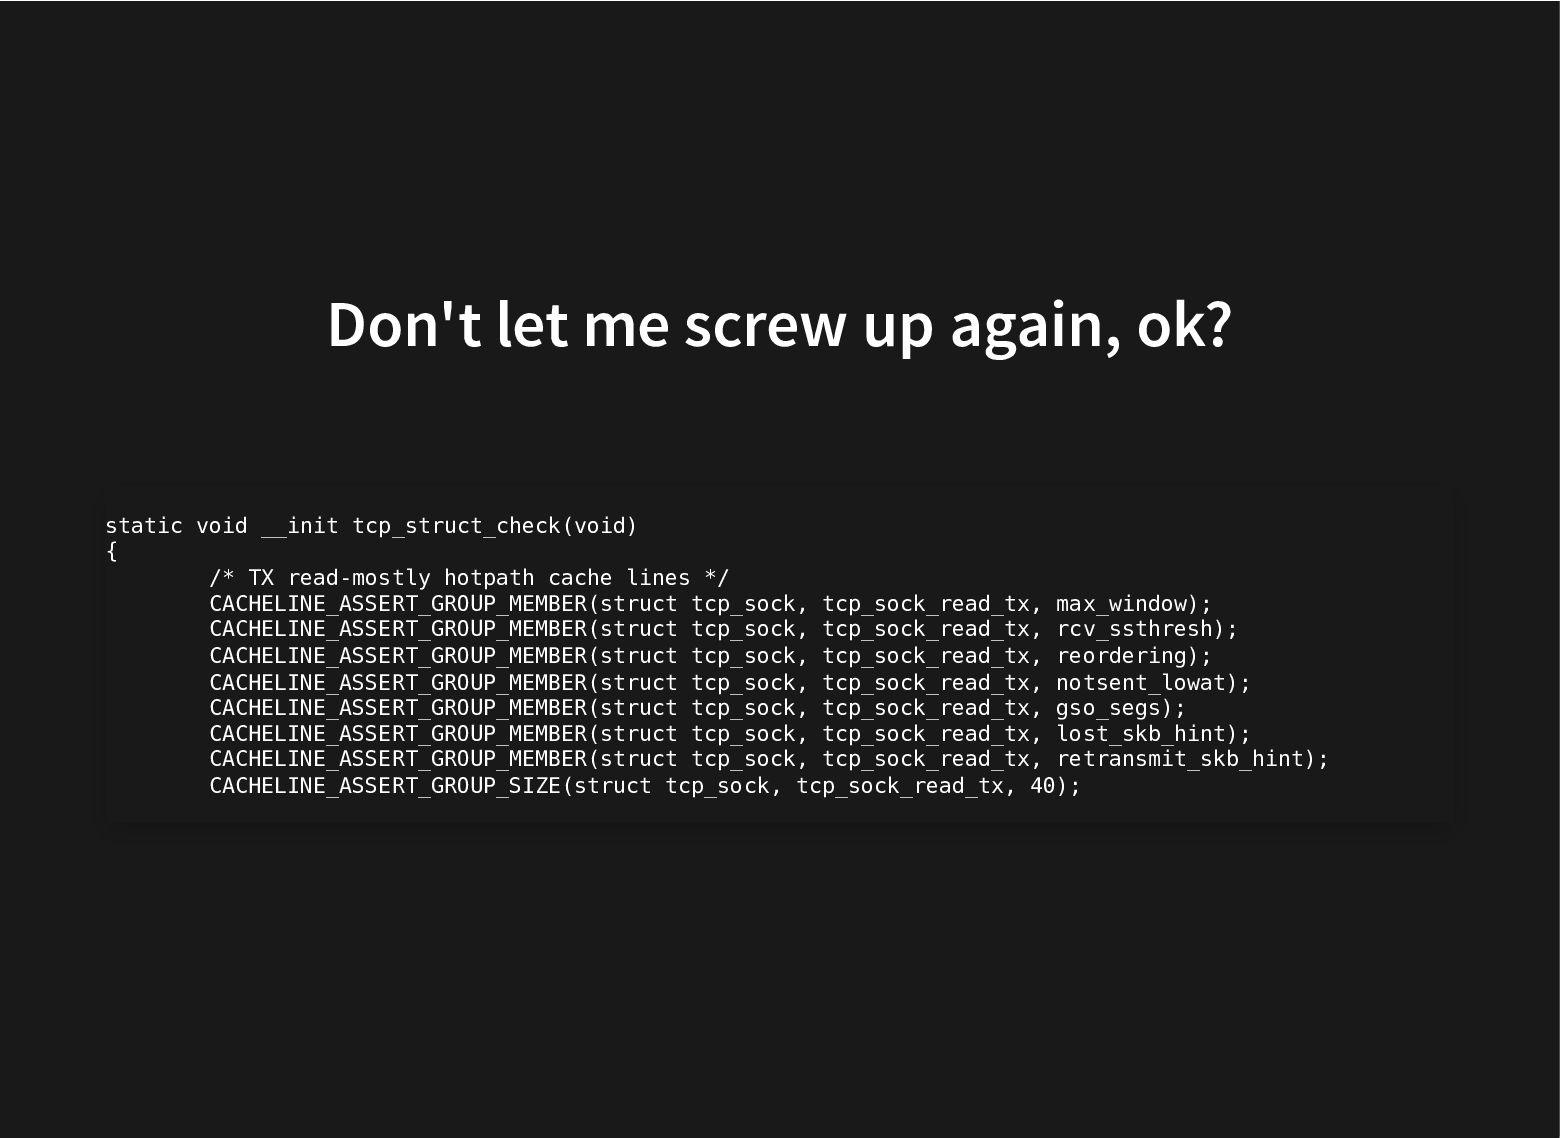
Don't let me screw up again, ok? static void __init
tcp_struct_check(void) { /* TX read-mostly hotpath cache lines */ CACHELINE_ASSERT_GROUP_MEMBER(struct tcp_sock, tcp_sock_read_tx, max_window); CACHELINE_ASSERT_GROUP_MEMBER(struct tcp_sock, tcp_sock_read_tx, rcv_ssthresh); CACHELINE_ASSERT_GROUP_MEMBER(struct tcp_sock, tcp_sock_read_tx, reordering); CACHELINE_ASSERT_GROUP_MEMBER(struct tcp_sock, tcp_sock_read_tx, notsent_lowat); CACHELINE_ASSERT_GROUP_MEMBER(struct tcp_sock, tcp_sock_read_tx, gso_segs); CACHELINE_ASSERT_GROUP_MEMBER(struct tcp_sock, tcp_sock_read_tx, lost_skb_hint); CACHELINE_ASSERT_GROUP_MEMBER(struct tcp_sock, tcp_sock_read_tx, retransmit_skb_hint); CACHELINE_ASSERT_GROUP_SIZE(struct tcp_sock, tcp_sock_read_tx, 40); -
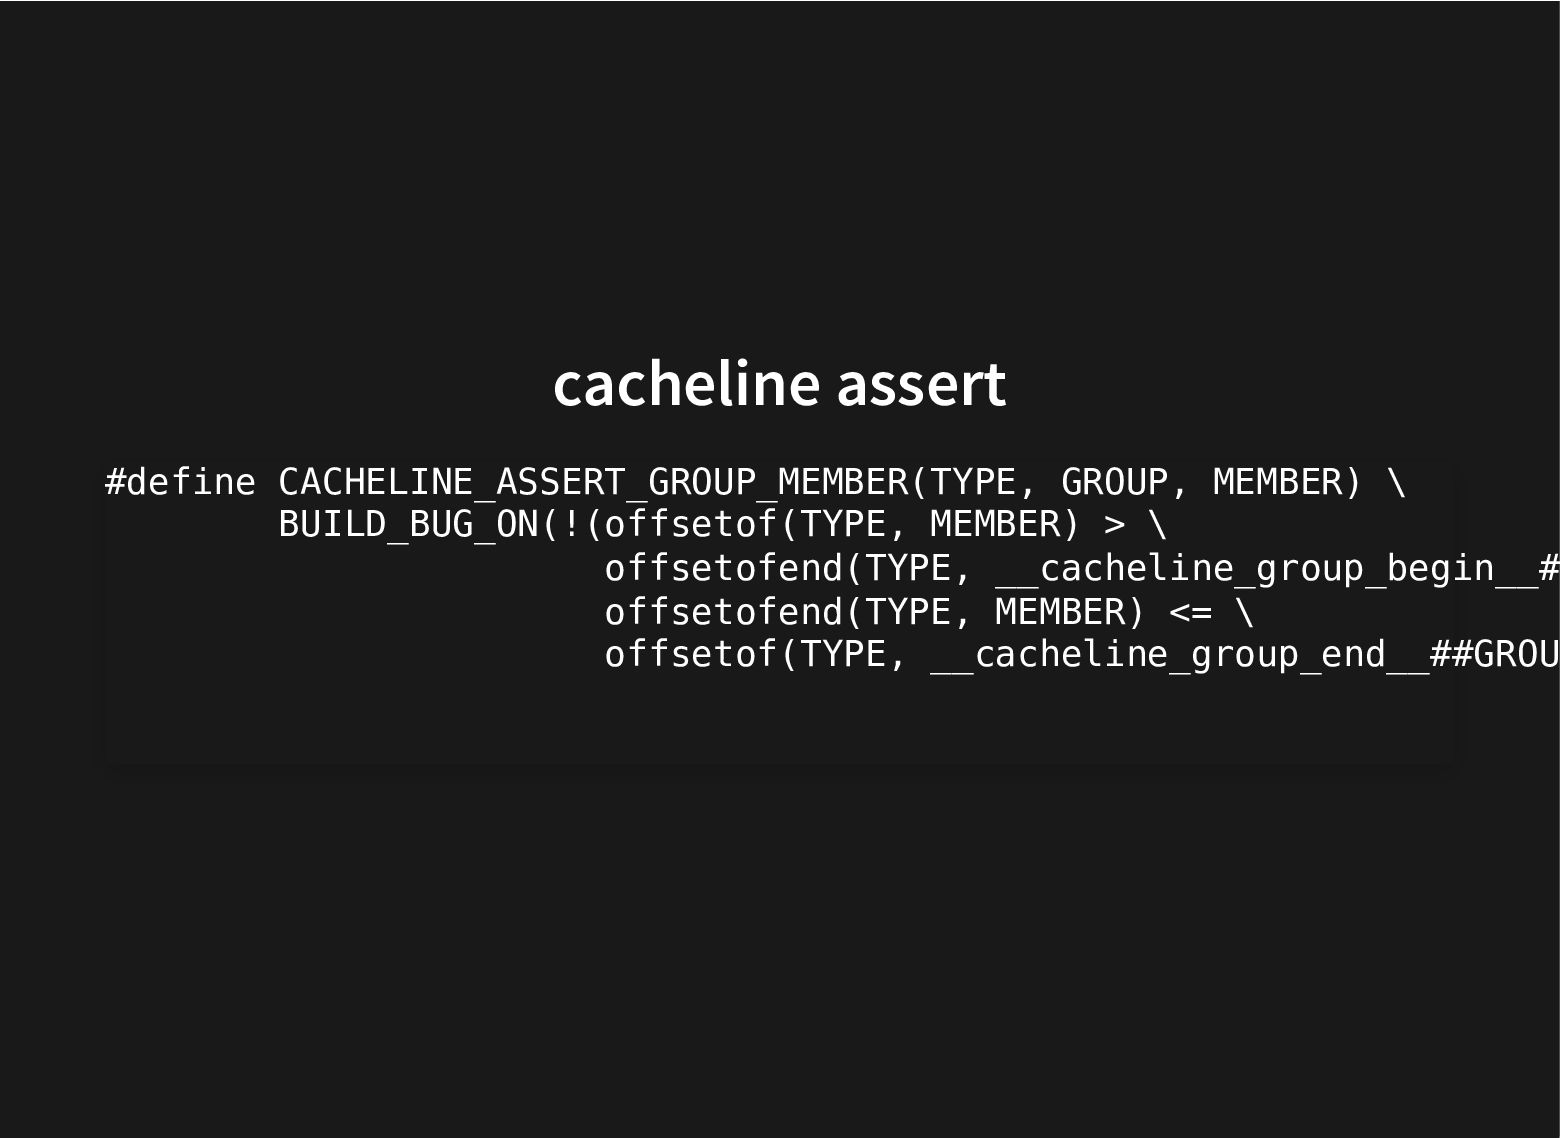
cacheline assert #define CACHELINE_ASSERT_GROUP_MEMBER(TYPE, GROUP, MEMBER) \ BUILD_BUG_ON(!(offsetof(TYPE, MEMBER) >
\ offsetofend(TYPE, __cacheline_group_begin__# offsetofend(TYPE, MEMBER) <= \ offsetof(TYPE, __cacheline_group_end__##GROU -
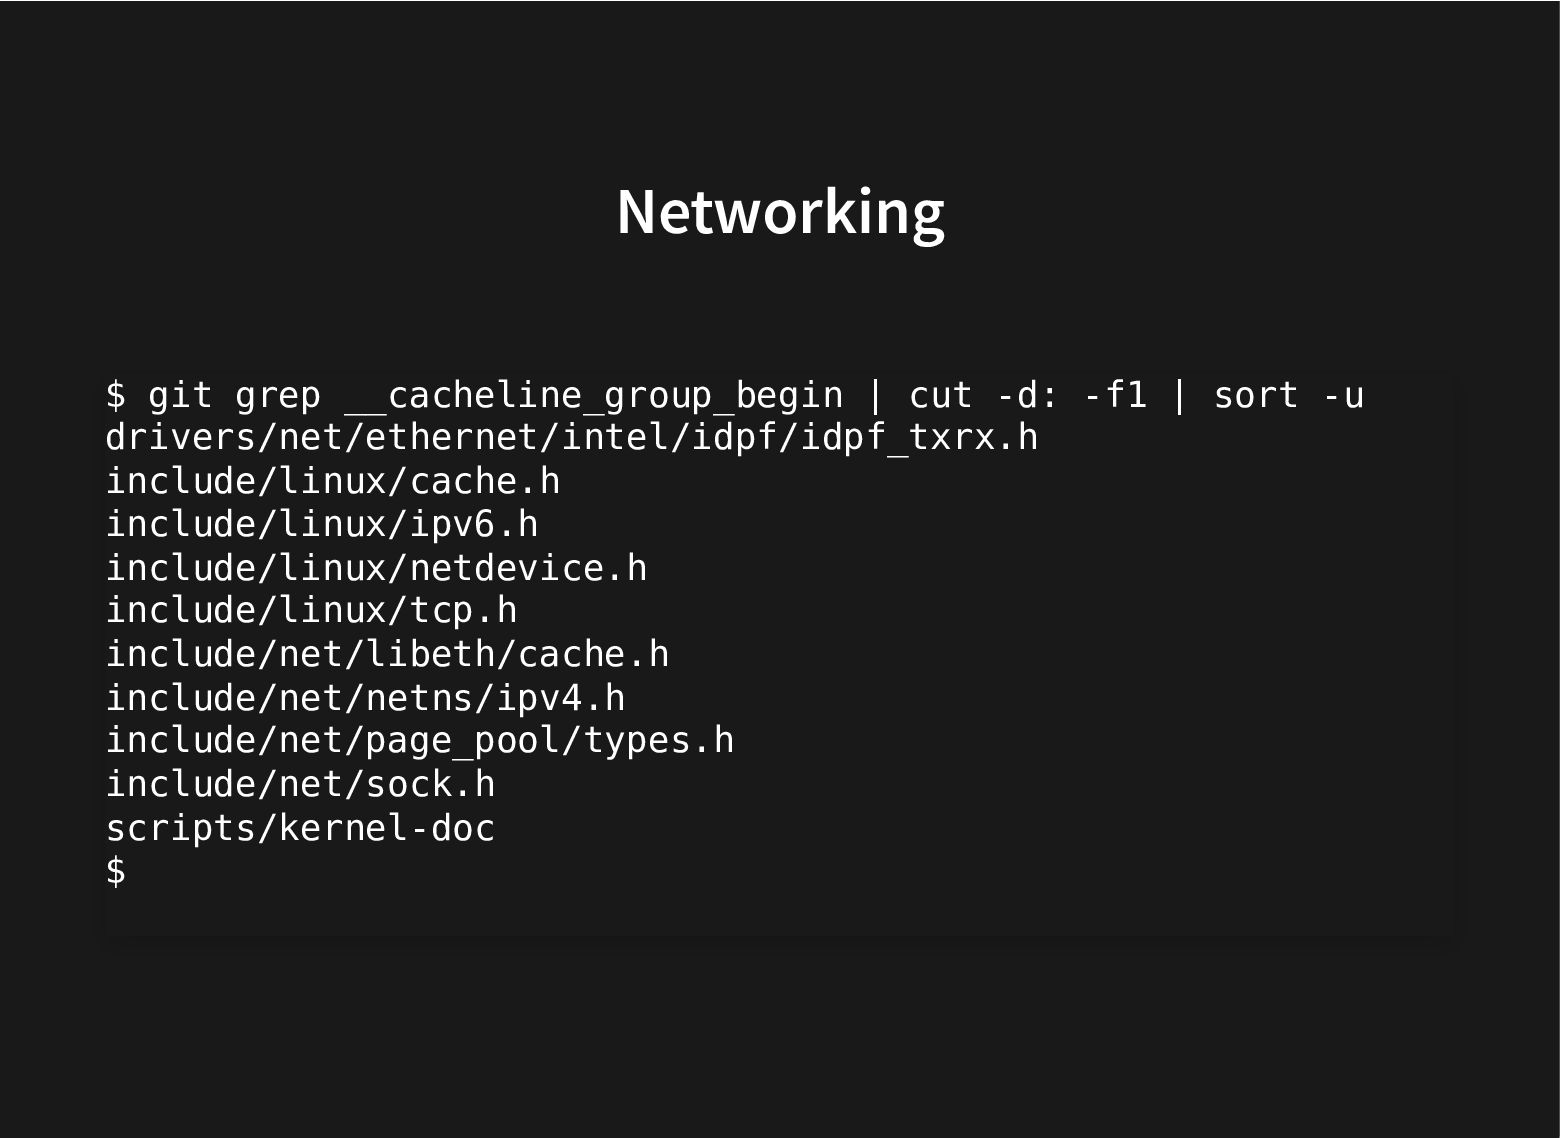
Networking $ git grep __cacheline_group_begin | cut -d: -f1 |
sort -u drivers/net/ethernet/intel/idpf/idpf_txrx.h include/linux/cache.h include/linux/ipv6.h include/linux/netdevice.h include/linux/tcp.h include/net/libeth/cache.h include/net/netns/ipv4.h include/net/page_pool/types.h include/net/sock.h scripts/kernel-doc $ -
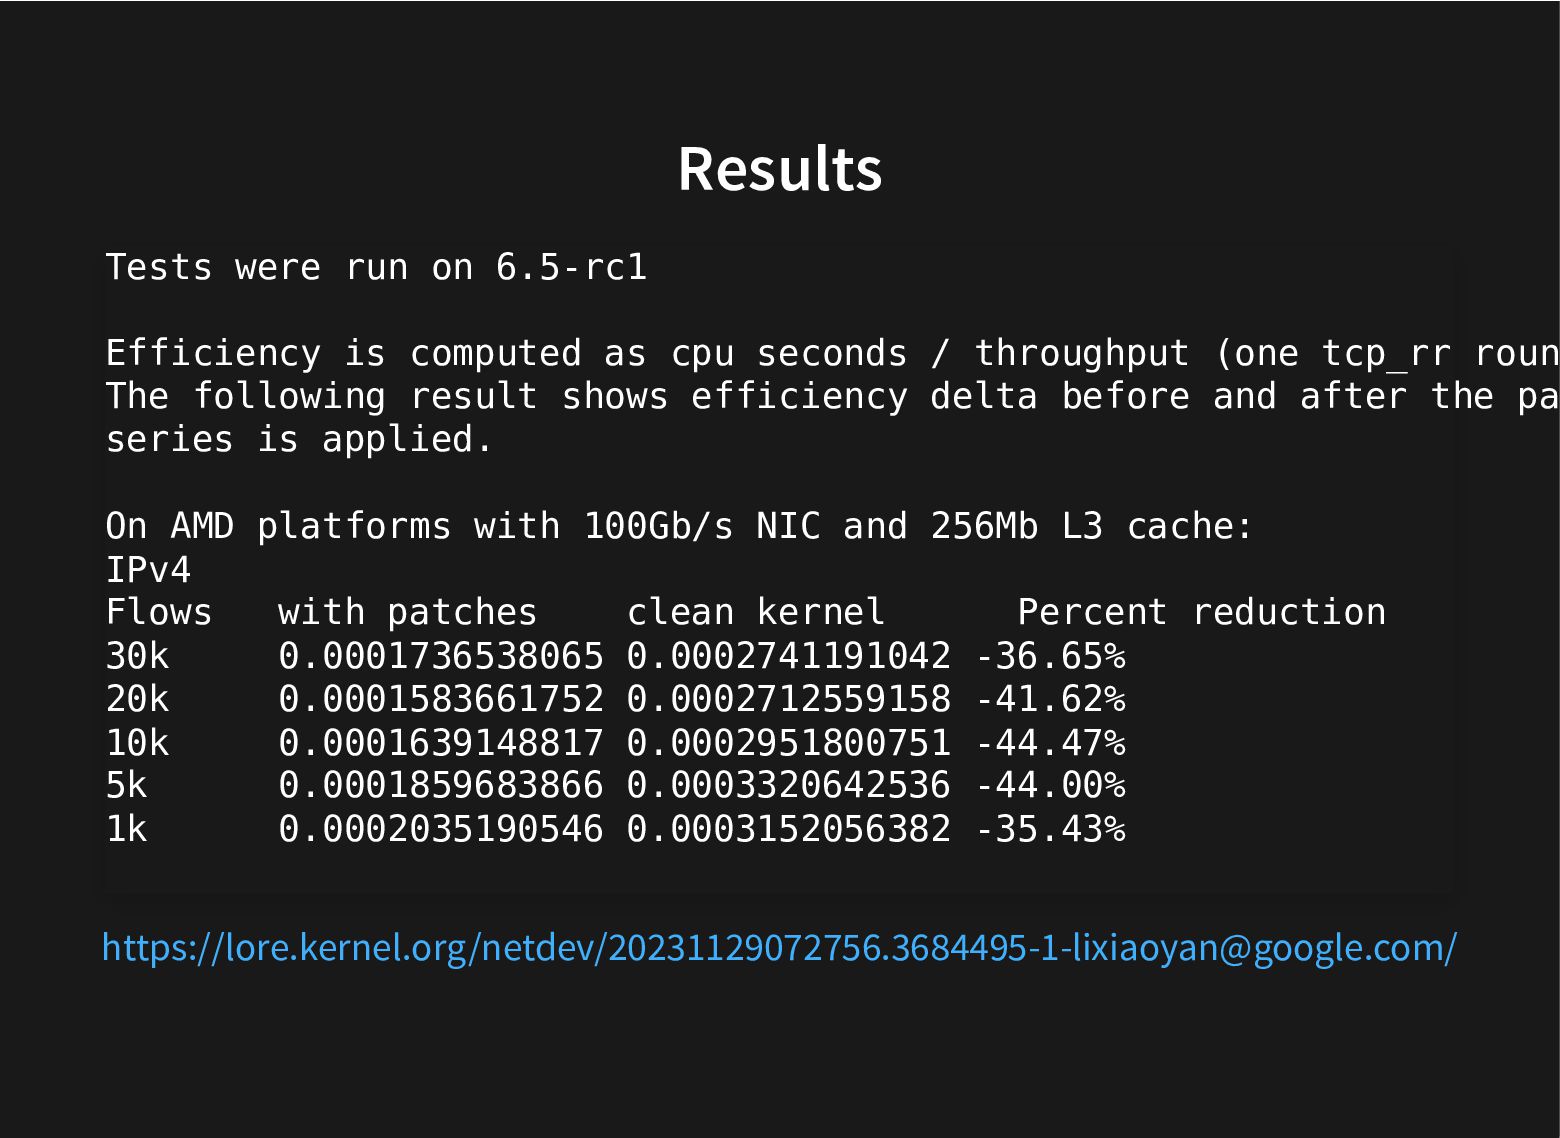
Results Tests were run on 6.5-rc1 Efficiency is computed as
cpu seconds / throughput (one tcp_rr roun The following result shows efficiency delta before and after the pa series is applied. On AMD platforms with 100Gb/s NIC and 256Mb L3 cache: IPv4 Flows with patches clean kernel Percent reduction 30k 0.0001736538065 0.0002741191042 -36.65% 20k 0.0001583661752 0.0002712559158 -41.62% 10k 0.0001639148817 0.0002951800751 -44.47% 5k 0.0001859683866 0.0003320642536 -44.00% 1k 0.0002035190546 0.0003152056382 -35.43% https://lore.kernel.org/netdev/[email protected]/ -
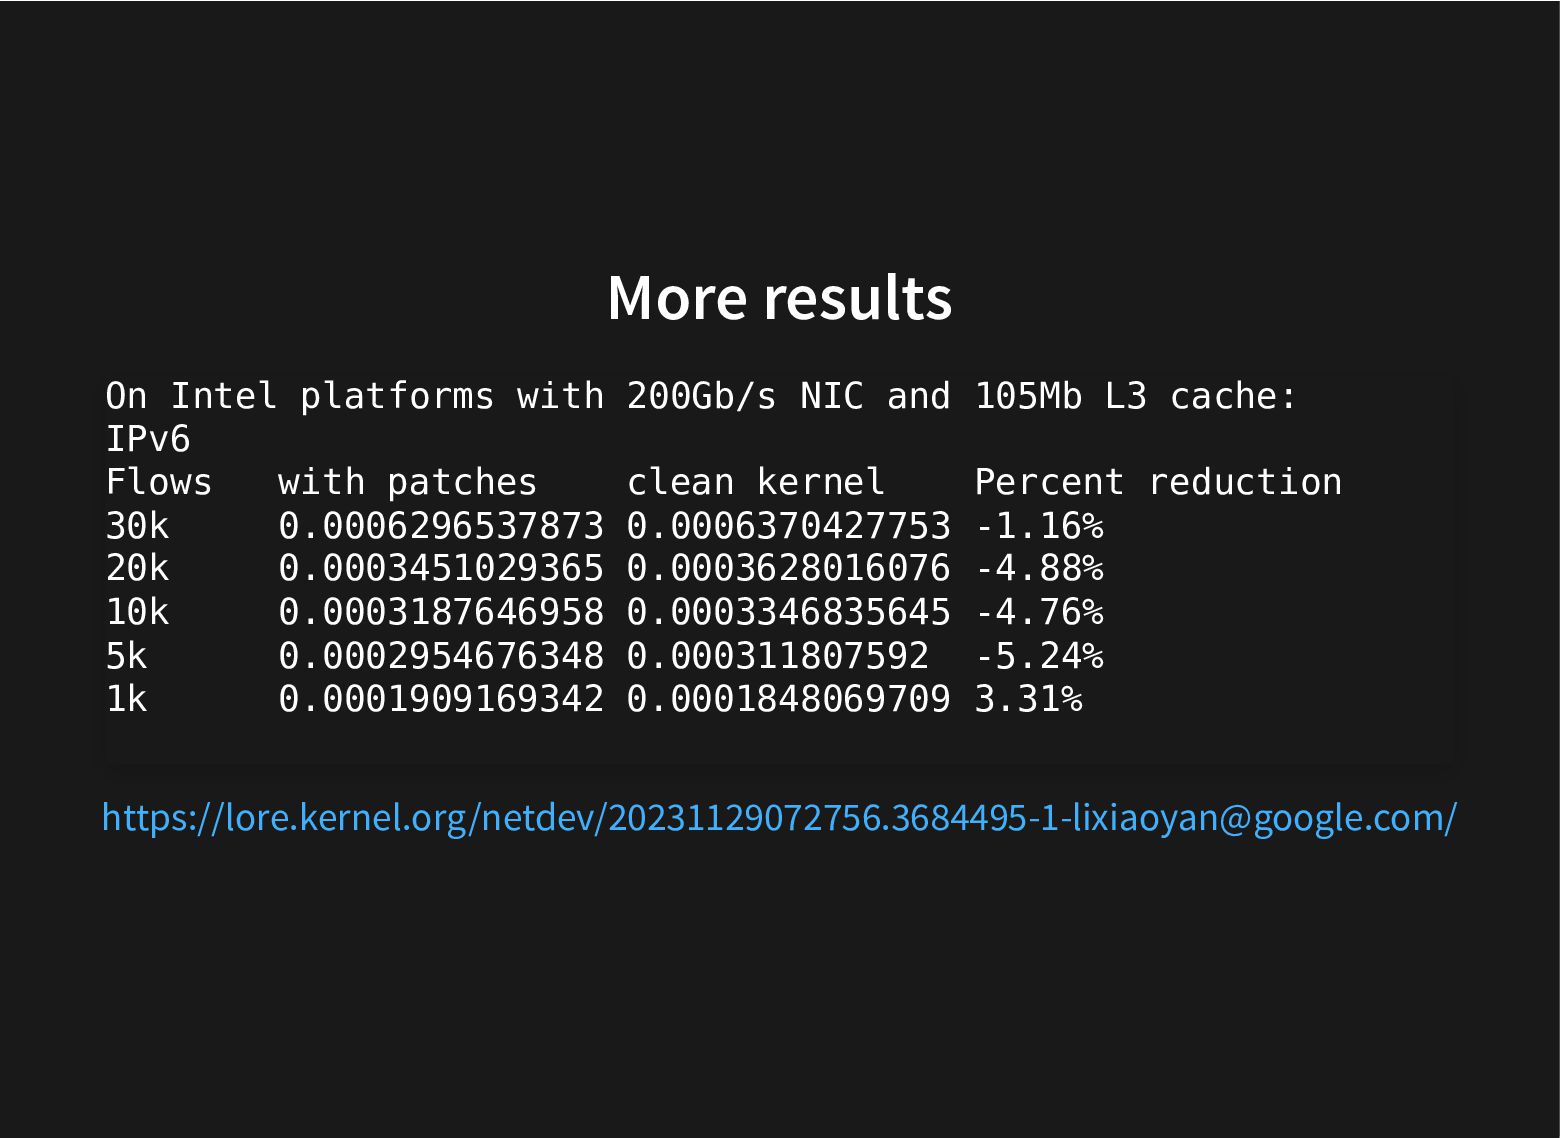
More results On Intel platforms with 200Gb/s NIC and 105Mb
L3 cache: IPv6 Flows with patches clean kernel Percent reduction 30k 0.0006296537873 0.0006370427753 -1.16% 20k 0.0003451029365 0.0003628016076 -4.88% 10k 0.0003187646958 0.0003346835645 -4.76% 5k 0.0002954676348 0.000311807592 -5.24% 1k 0.0001909169342 0.0001848069709 3.31% https://lore.kernel.org/netdev/[email protected]/ -
PROBLEM SOLVED? Lots of expertise needed In setting up those
groups And in keeping it sane Where should a new field go? Can I get some help from tooling? -
Motivation From: Coco Li <[email protected]> Subject: [PATCH v8 0/5] Analyze
and Reorganize core Networking Stru to optimize cacheline consumption Currently, variable-heavy structs in the networking stack is organi chronologically, logically and sometimes by cacheline access. This patch series attempts to reorganize the core networking stack variables to minimize cacheline consumption during the phase of dat transfer. Specifically, we looked at the TCP/IP stack and the fast path definition in TCP. For documentation purposes, we also added new files for each core d structure we considered, although not all ended up being modified d to the amount of existing cacheline they span in the fast path. In the documentation, we recorded all variables we identified on the fast path and the reasons. We also hope that in the future when variables are added/modified, the document can be referred to and updated accordingly to reflect the latest variable organization. -
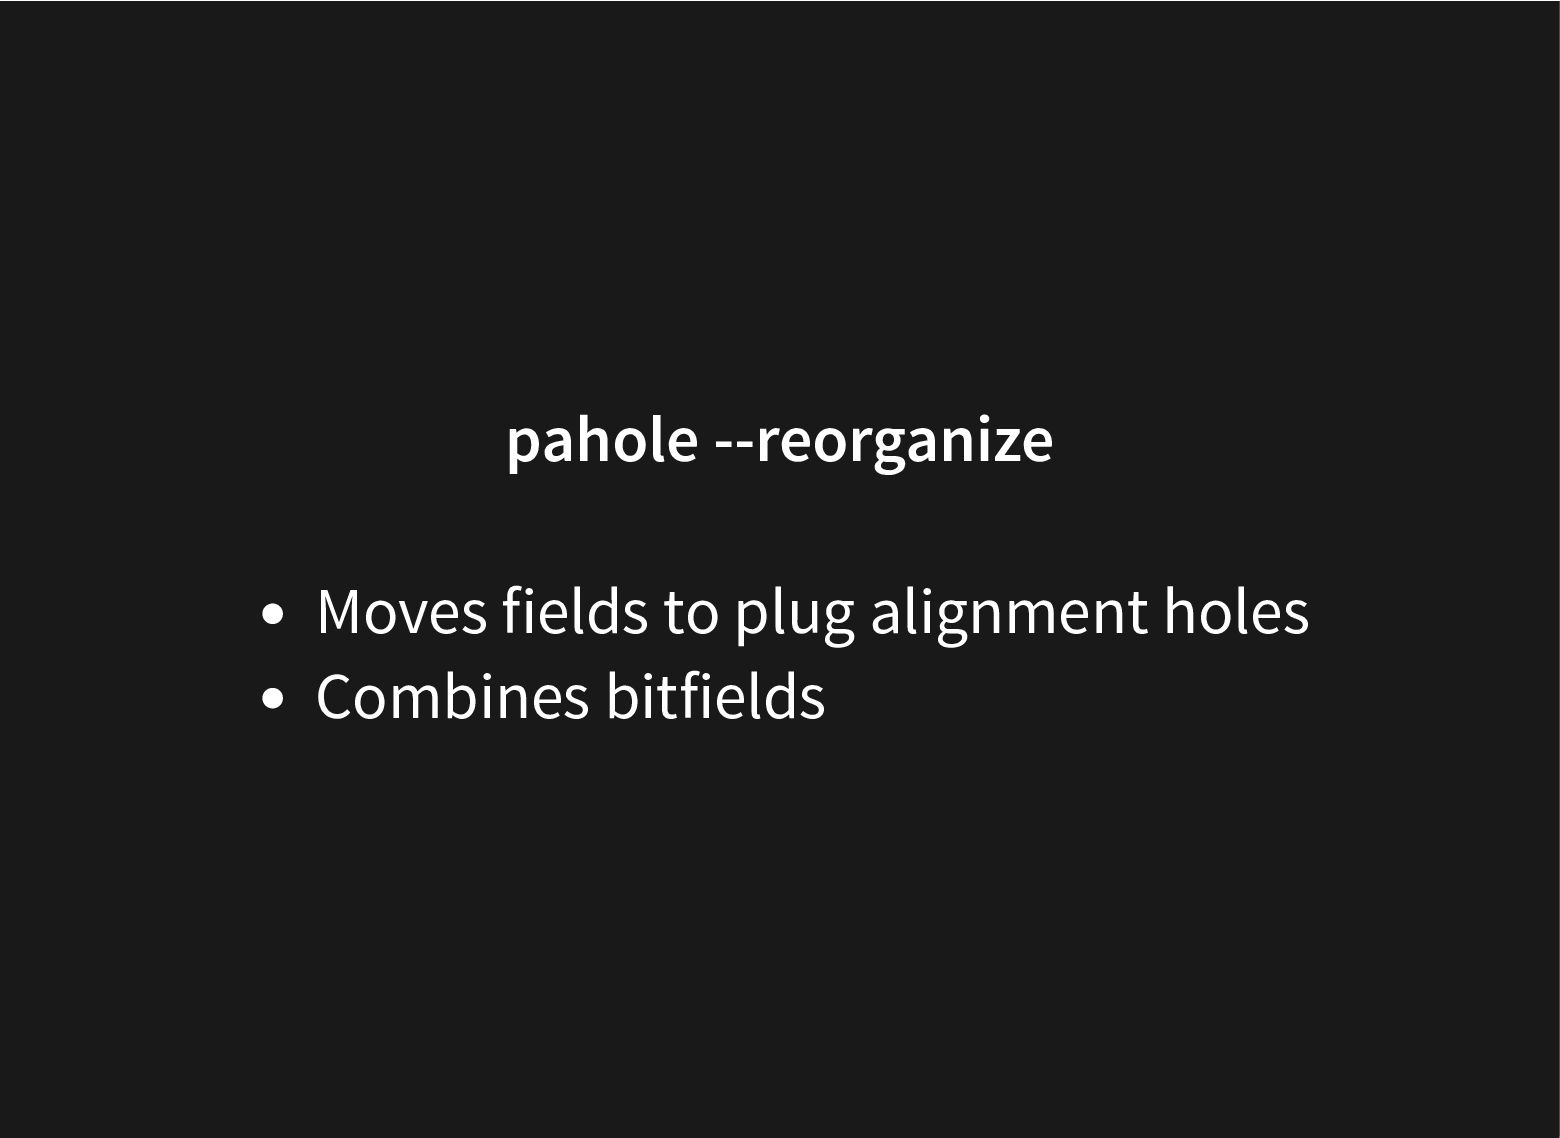
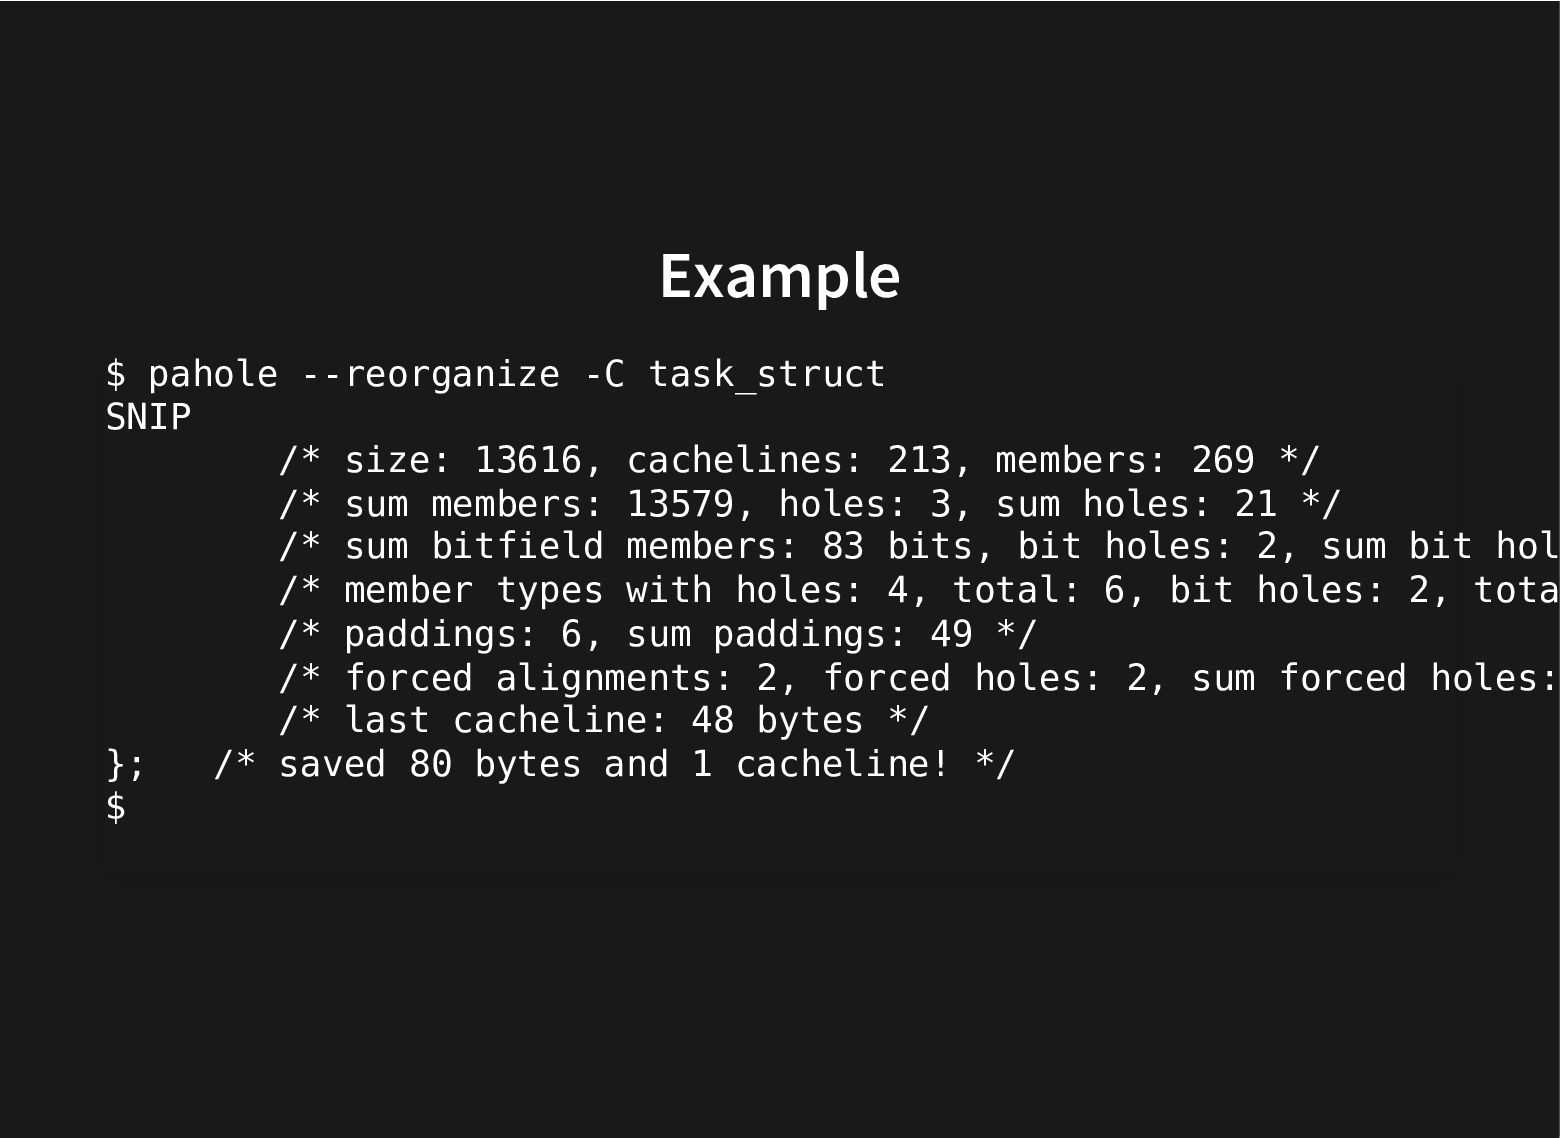
Example $ pahole --reorganize -C task_struct SNIP /* size: 13616,
cachelines: 213, members: 269 */ /* sum members: 13579, holes: 3, sum holes: 21 */ /* sum bitfield members: 83 bits, bit holes: 2, sum bit hol /* member types with holes: 4, total: 6, bit holes: 2, tota /* paddings: 6, sum paddings: 49 */ /* forced alignments: 2, forced holes: 2, sum forced holes: /* last cacheline: 48 bytes */ }; /* saved 80 bytes and 1 cacheline! */ $ -
NAÏVE Moves fields around To plug alignment holes Bitrotted algorithm
Doesn't honor alignment attribute May mix up read-mostly with write-mostly fields Should take into account the cacheline groups, etc -
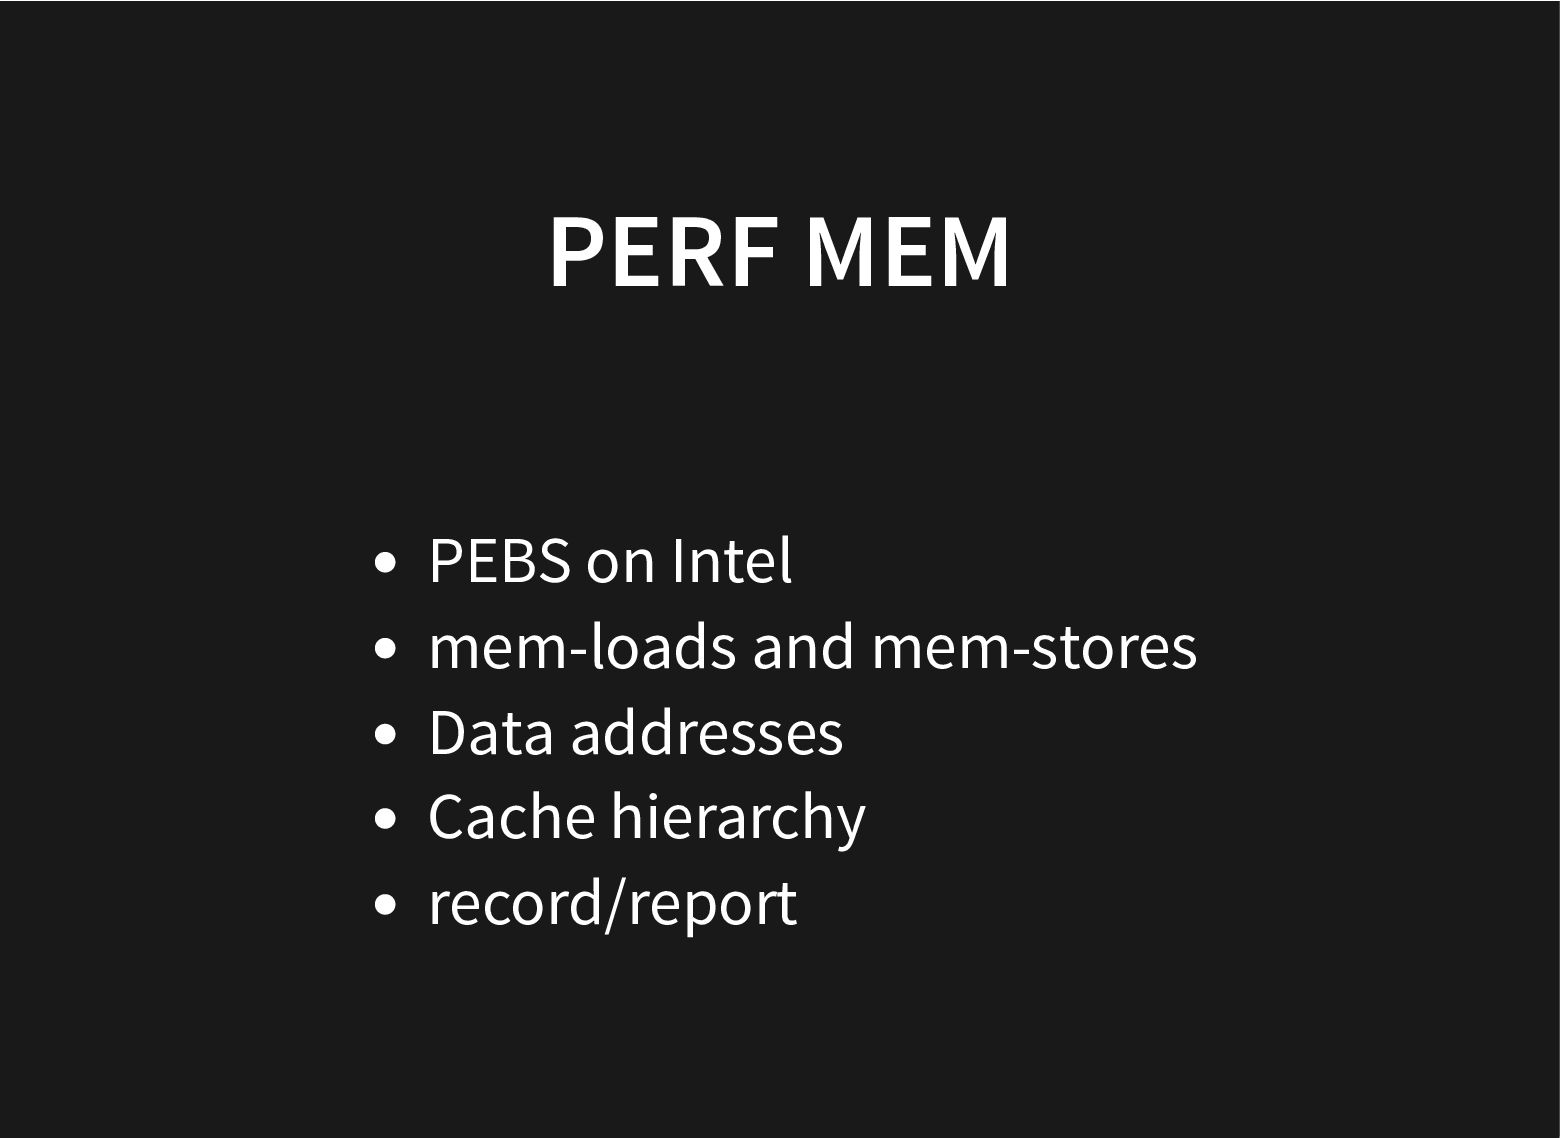
PERF MEM PEBS on Intel mem-loads and mem-stores Data addresses
Cache hierarchy record/report -
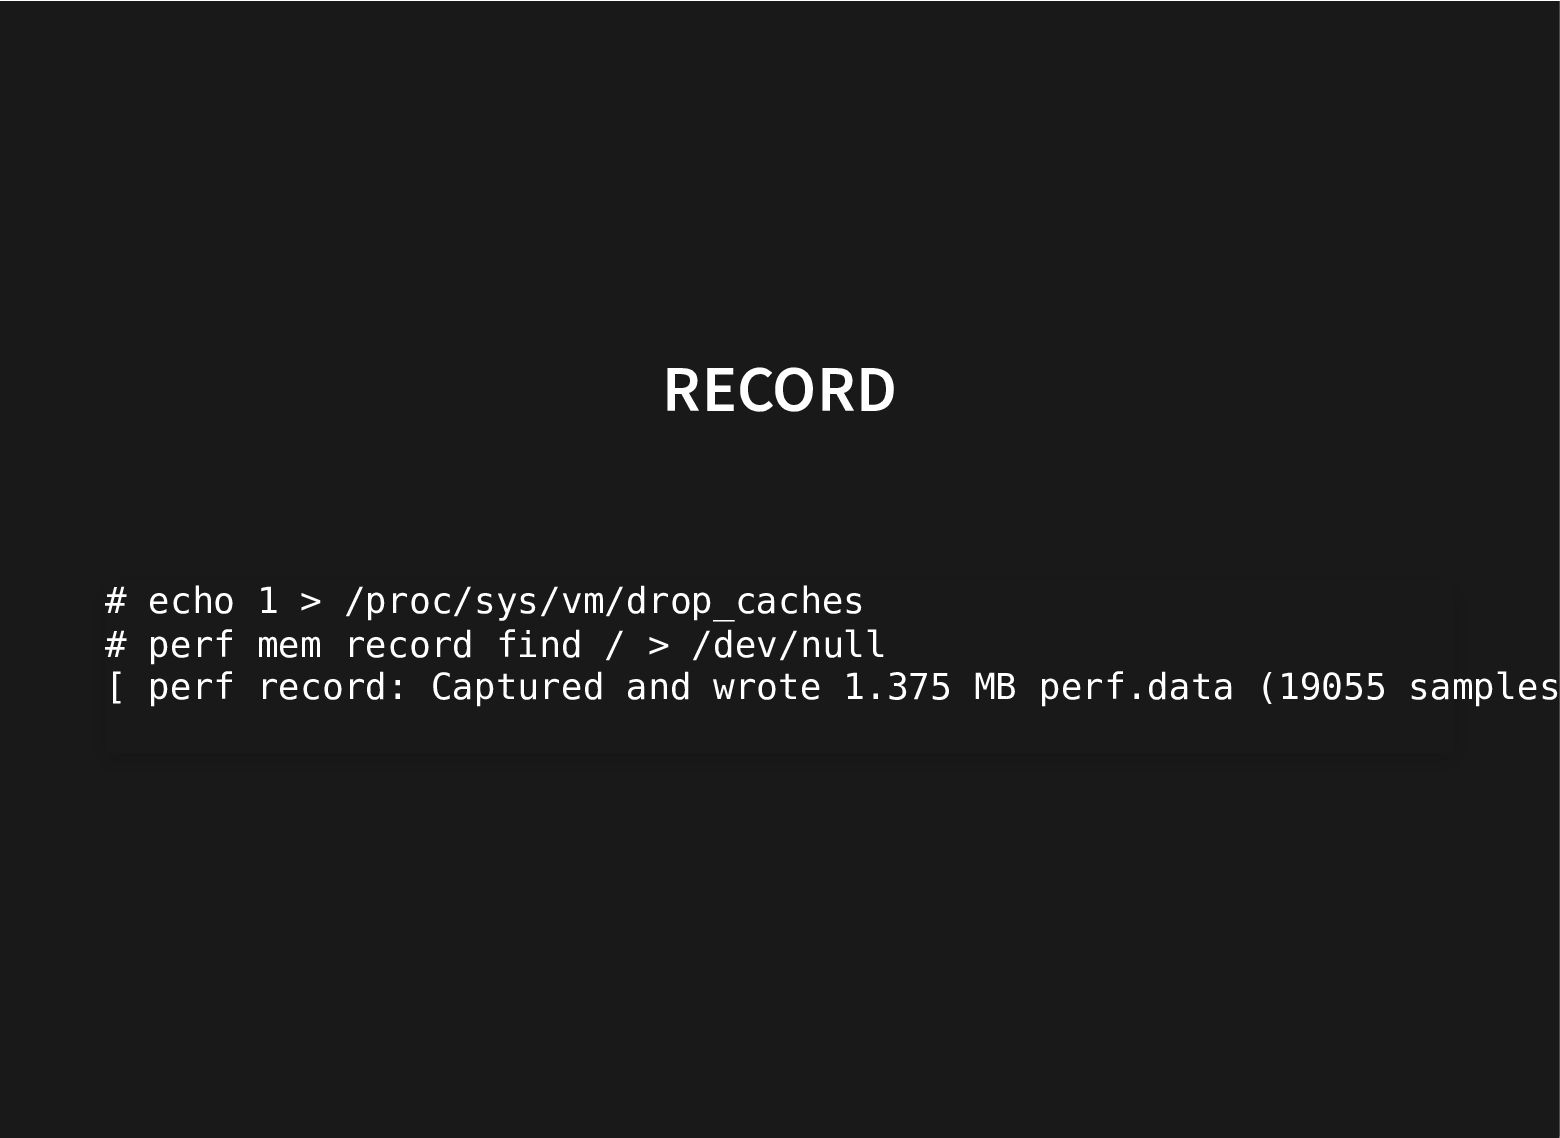
RECORD # echo 1 > /proc/sys/vm/drop_caches # perf mem record
find / > /dev/null [ perf record: Captured and wrote 1.375 MB perf.data (19055 samples -
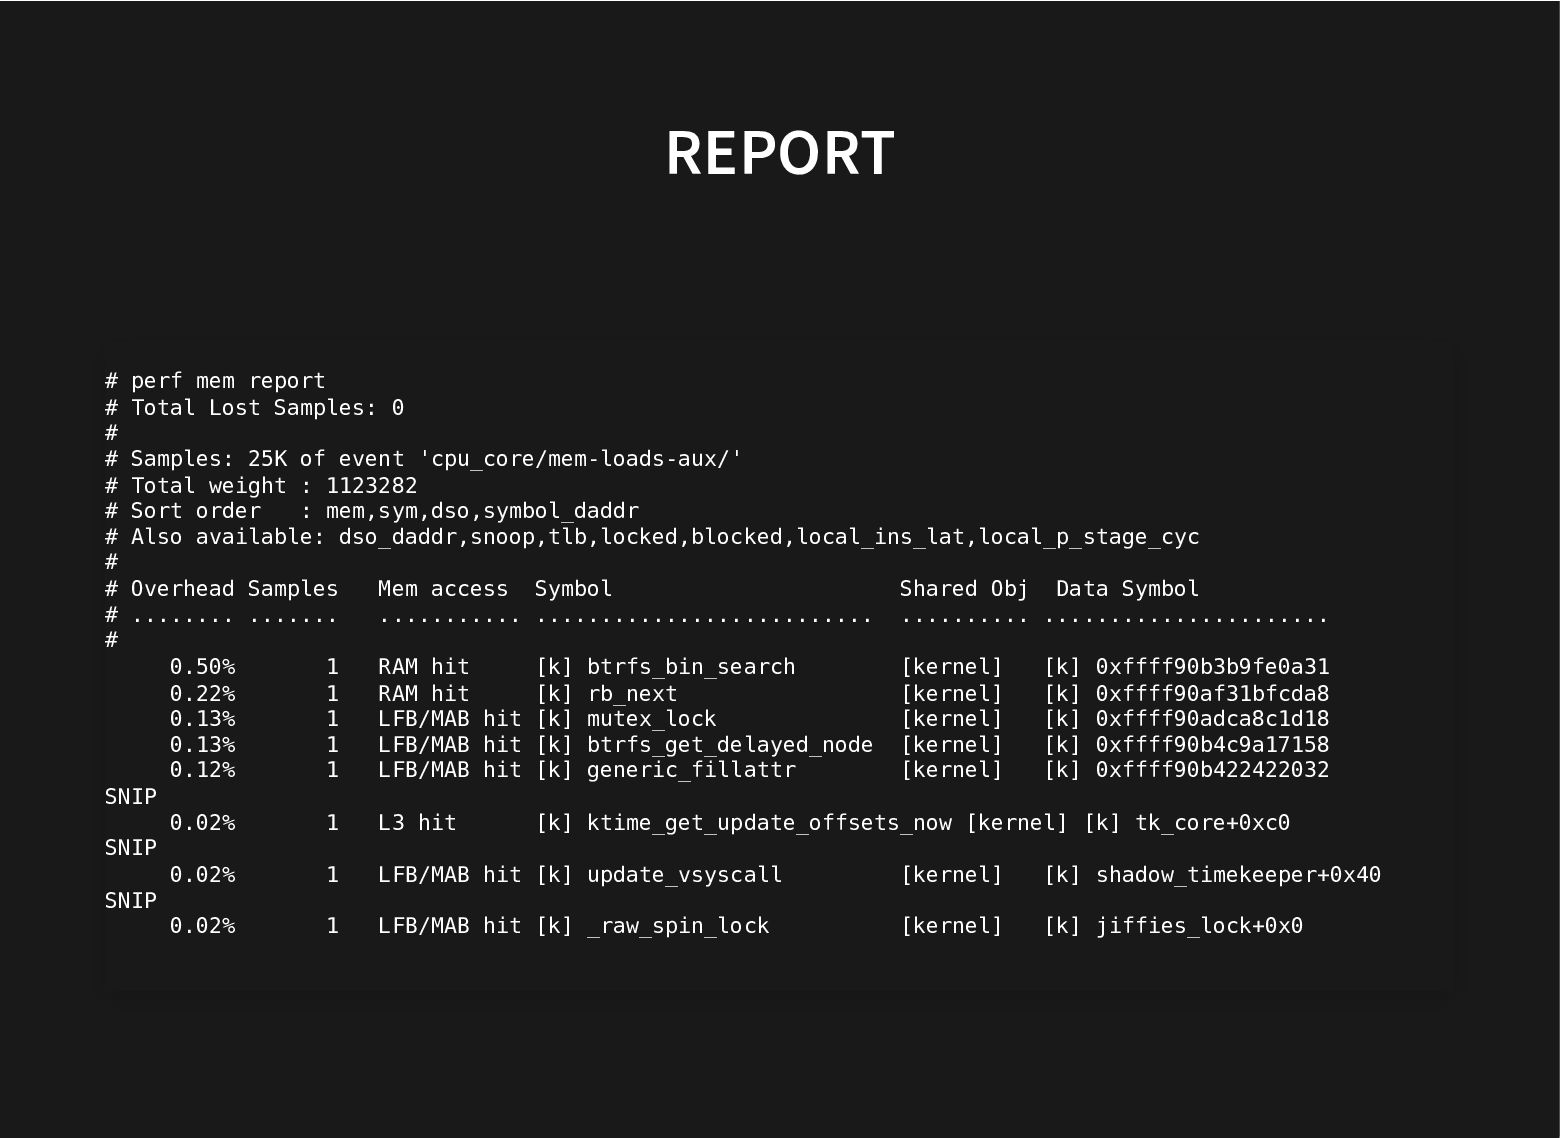
REPORT # perf mem report # Total Lost Samples: 0
# # Samples: 25K of event 'cpu_core/mem-loads-aux/' # Total weight : 1123282 # Sort order : mem,sym,dso,symbol_daddr # Also available: dso_daddr,snoop,tlb,locked,blocked,local_ins_lat,local_p_stage_cyc # # Overhead Samples Mem access Symbol Shared Obj Data Symbol # ........ ....... ........... .......................... .......... ...................... # 0.50% 1 RAM hit [k] btrfs_bin_search [kernel] [k] 0xffff90b3b9fe0a31 0.22% 1 RAM hit [k] rb_next [kernel] [k] 0xffff90af31bfcda8 0.13% 1 LFB/MAB hit [k] mutex_lock [kernel] [k] 0xffff90adca8c1d18 0.13% 1 LFB/MAB hit [k] btrfs_get_delayed_node [kernel] [k] 0xffff90b4c9a17158 0.12% 1 LFB/MAB hit [k] generic_fillattr [kernel] [k] 0xffff90b422422032 SNIP 0.02% 1 L3 hit [k] ktime_get_update_offsets_now [kernel] [k] tk_core+0xc0 SNIP 0.02% 1 LFB/MAB hit [k] update_vsyscall [kernel] [k] shadow_timekeeper+0x40 SNIP 0.02% 1 LFB/MAB hit [k] _raw_spin_lock [kernel] [k] jiffies_lock+0x0 -
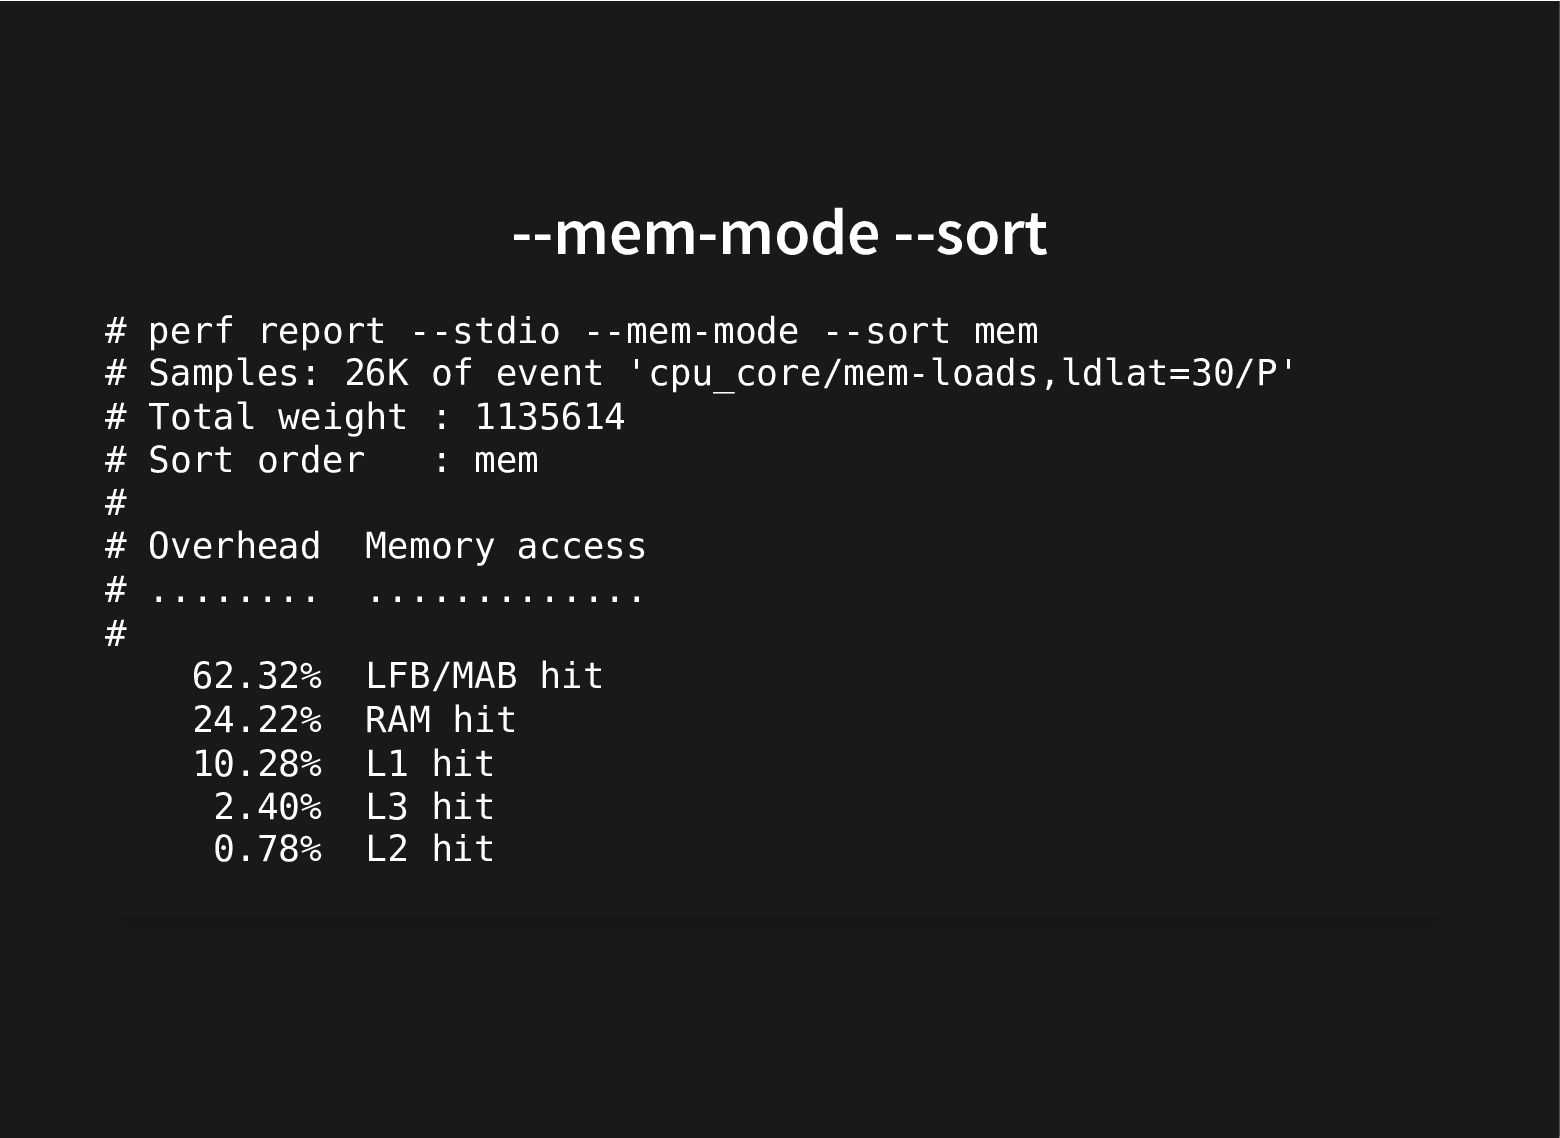
--mem-mode --sort # perf report --stdio --mem-mode --sort mem #
Samples: 26K of event 'cpu_core/mem-loads,ldlat=30/P' # Total weight : 1135614 # Sort order : mem # # Overhead Memory access # ........ ............. # 62.32% LFB/MAB hit 24.22% RAM hit 10.28% L1 hit 2.40% L3 hit 0.78% L2 hit -
kernel functions doing mem loads # perf report --dso '[kernel.kallsyms]'
--stdio \ --mem-mode --sort sym,ins_lat # Overhead Symbol INSTR Latency # ........ ............................ ............. 0.50% [k] btrfs_bin_search 5637 0.22% [k] rb_next 2507 0.18% [k] folio_mark_accessed 419 0.18% [k] __d_lookup 405 0.17% [k] __d_lookup_rcu 389 0.14% [k] down_read 41 0.14% [k] __d_lookup_rcu 390 0.13% [k] mutex_lock 1475 0.13% [k] mutex_lock 487 0.13% [k] btrfs_get_delayed_node 1441 0.12% [k] generic_fillattr 703 0.12% [k] generic_fillattr 1378 0.12% [k] folio_mark_accessed 1371 0.12% [k] _raw_spin_lock 33 0.12% [k] btrfs_get_delayed_node 444 0.11% [k] dcache_readdir 1283 0.11% [k] __d_lookup_rcu 431 0.11% [k] folio_mark_accessed 640 -
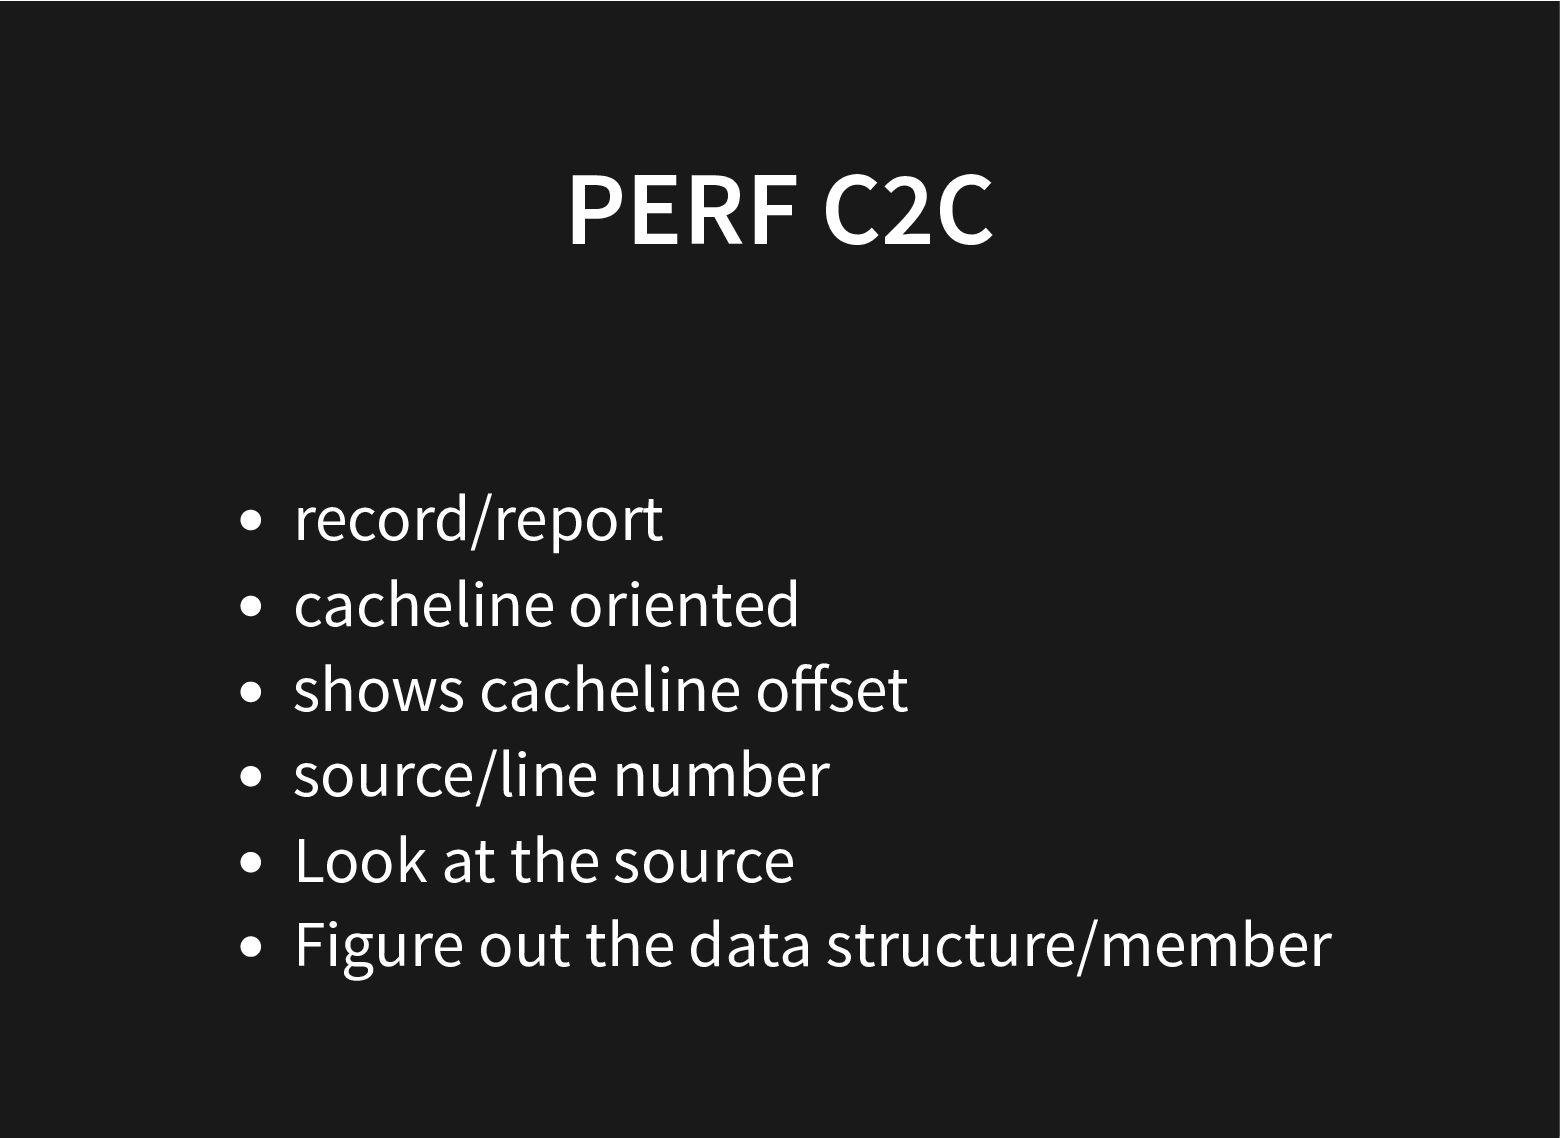
PERF C2C record/report cacheline oriented shows cacheline offset source/line number
Look at the source Figure out the data structure/member -
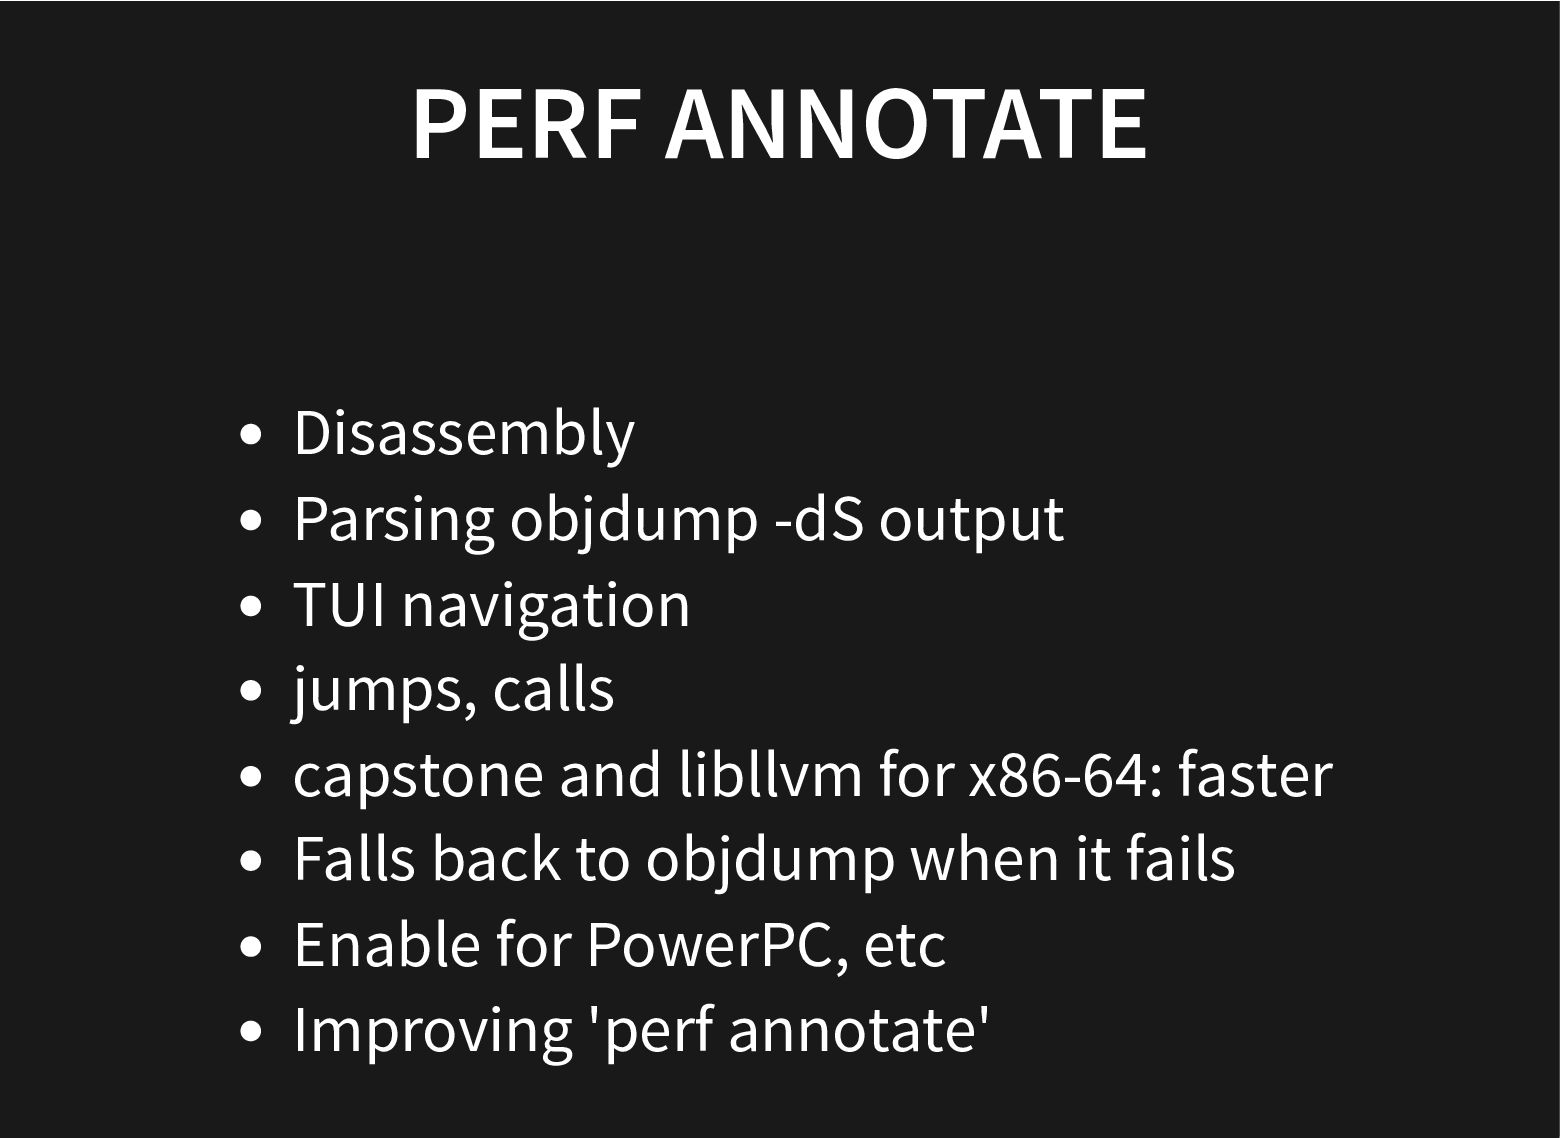
PERF ANNOTATE Disassembly Parsing objdump -dS output TUI navigation jumps,
calls capstone and libllvm for x86-64: faster Falls back to objdump when it fails Enable for PowerPC, etc Improving 'perf annotate' -
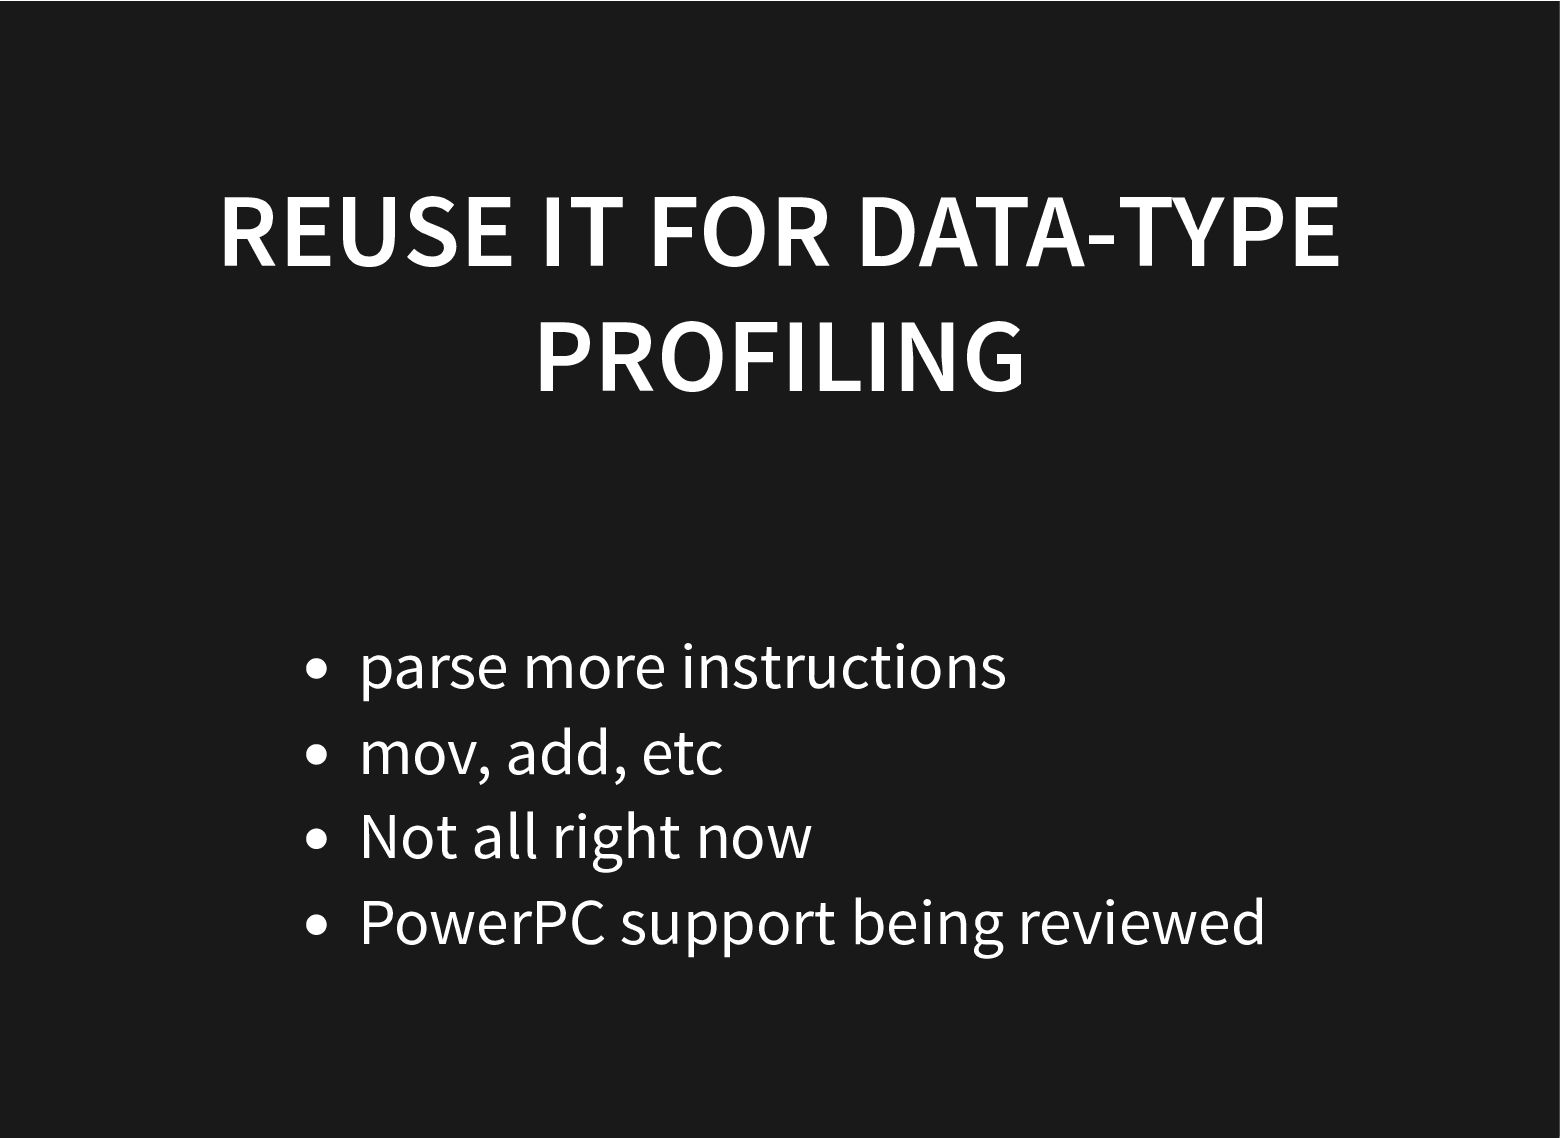
REUSE IT FOR DATA-TYPE PROFILING parse more instructions mov, add,
etc Not all right now PowerPC support being reviewed -
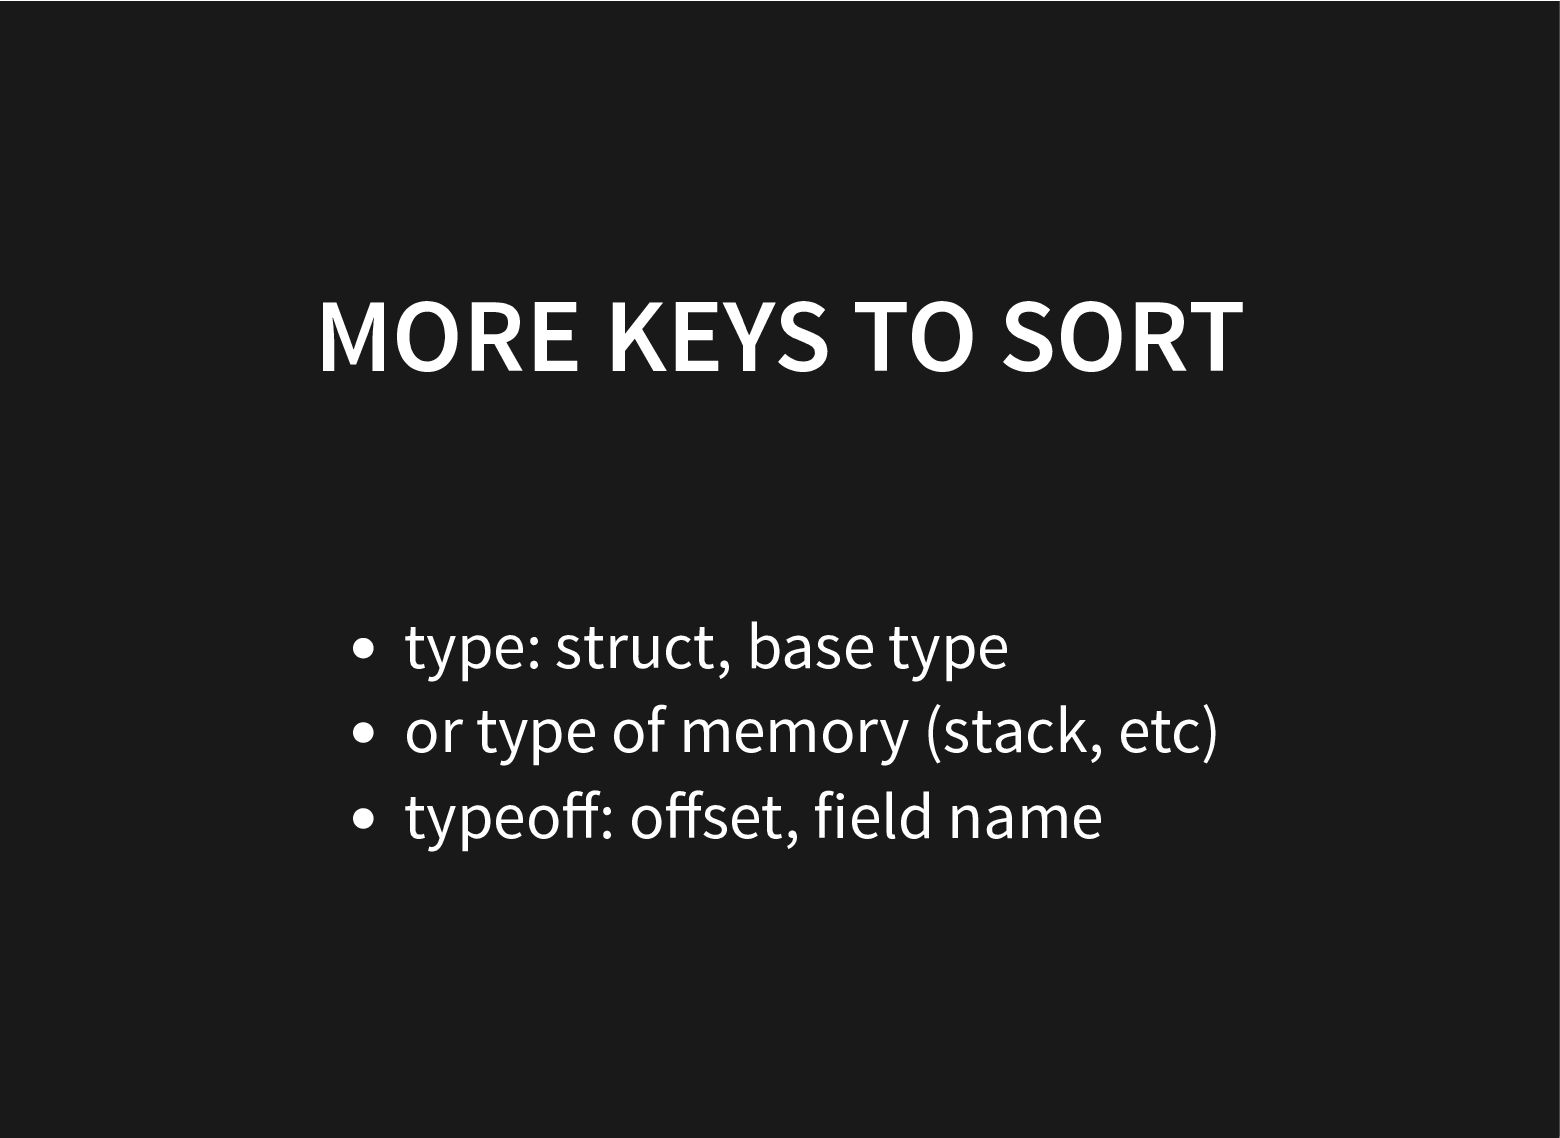
MORE KEYS TO SORT type: struct, base type or type
of memory (stack, etc) typeoff: offset, field name -
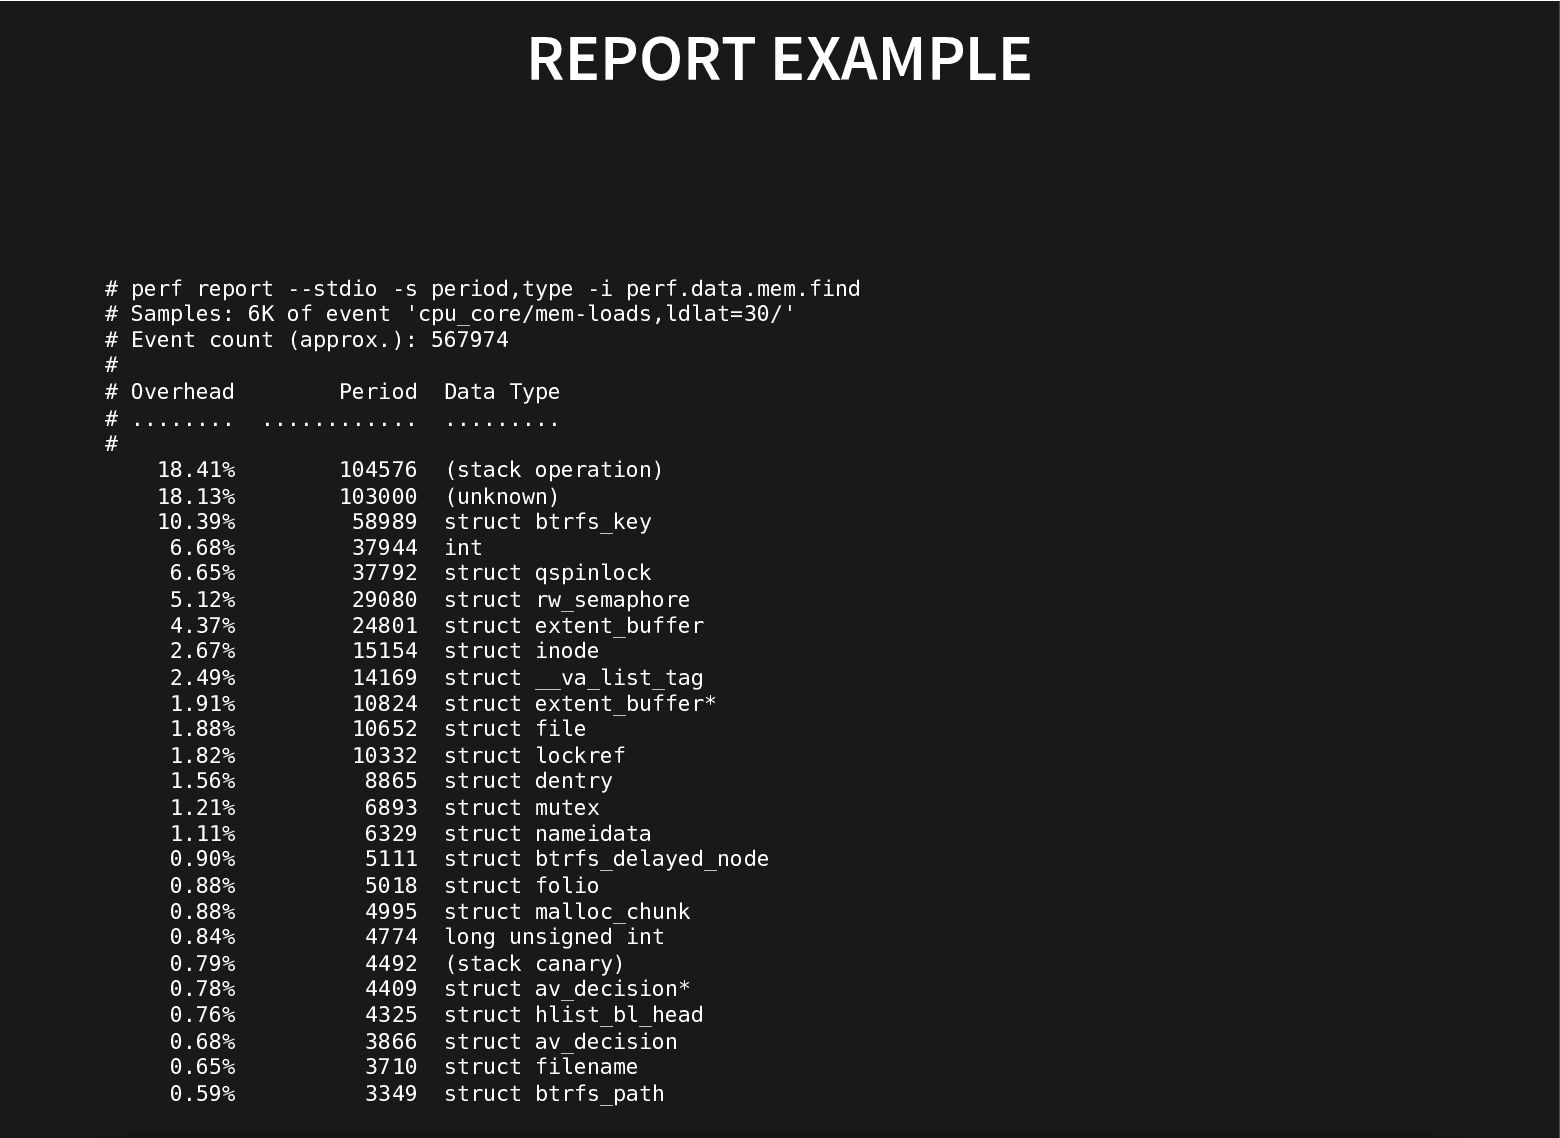
REPORT EXAMPLE # perf report --stdio -s period,type -i perf.data.mem.find
# Samples: 6K of event 'cpu_core/mem-loads,ldlat=30/' # Event count (approx.): 567974 # # Overhead Period Data Type # ........ ............ ......... # 18.41% 104576 (stack operation) 18.13% 103000 (unknown) 10.39% 58989 struct btrfs_key 6.68% 37944 int 6.65% 37792 struct qspinlock 5.12% 29080 struct rw_semaphore 4.37% 24801 struct extent_buffer 2.67% 15154 struct inode 2.49% 14169 struct __va_list_tag 1.91% 10824 struct extent_buffer* 1.88% 10652 struct file 1.82% 10332 struct lockref 1.56% 8865 struct dentry 1.21% 6893 struct mutex 1.11% 6329 struct nameidata 0.90% 5111 struct btrfs_delayed_node 0.88% 5018 struct folio 0.88% 4995 struct malloc_chunk 0.84% 4774 long unsigned int 0.79% 4492 (stack canary) 0.78% 4409 struct av_decision* 0.76% 4325 struct hlist_bl_head 0.68% 3866 struct av_decision 0.65% 3710 struct filename 0.59% 3349 struct btrfs_path -
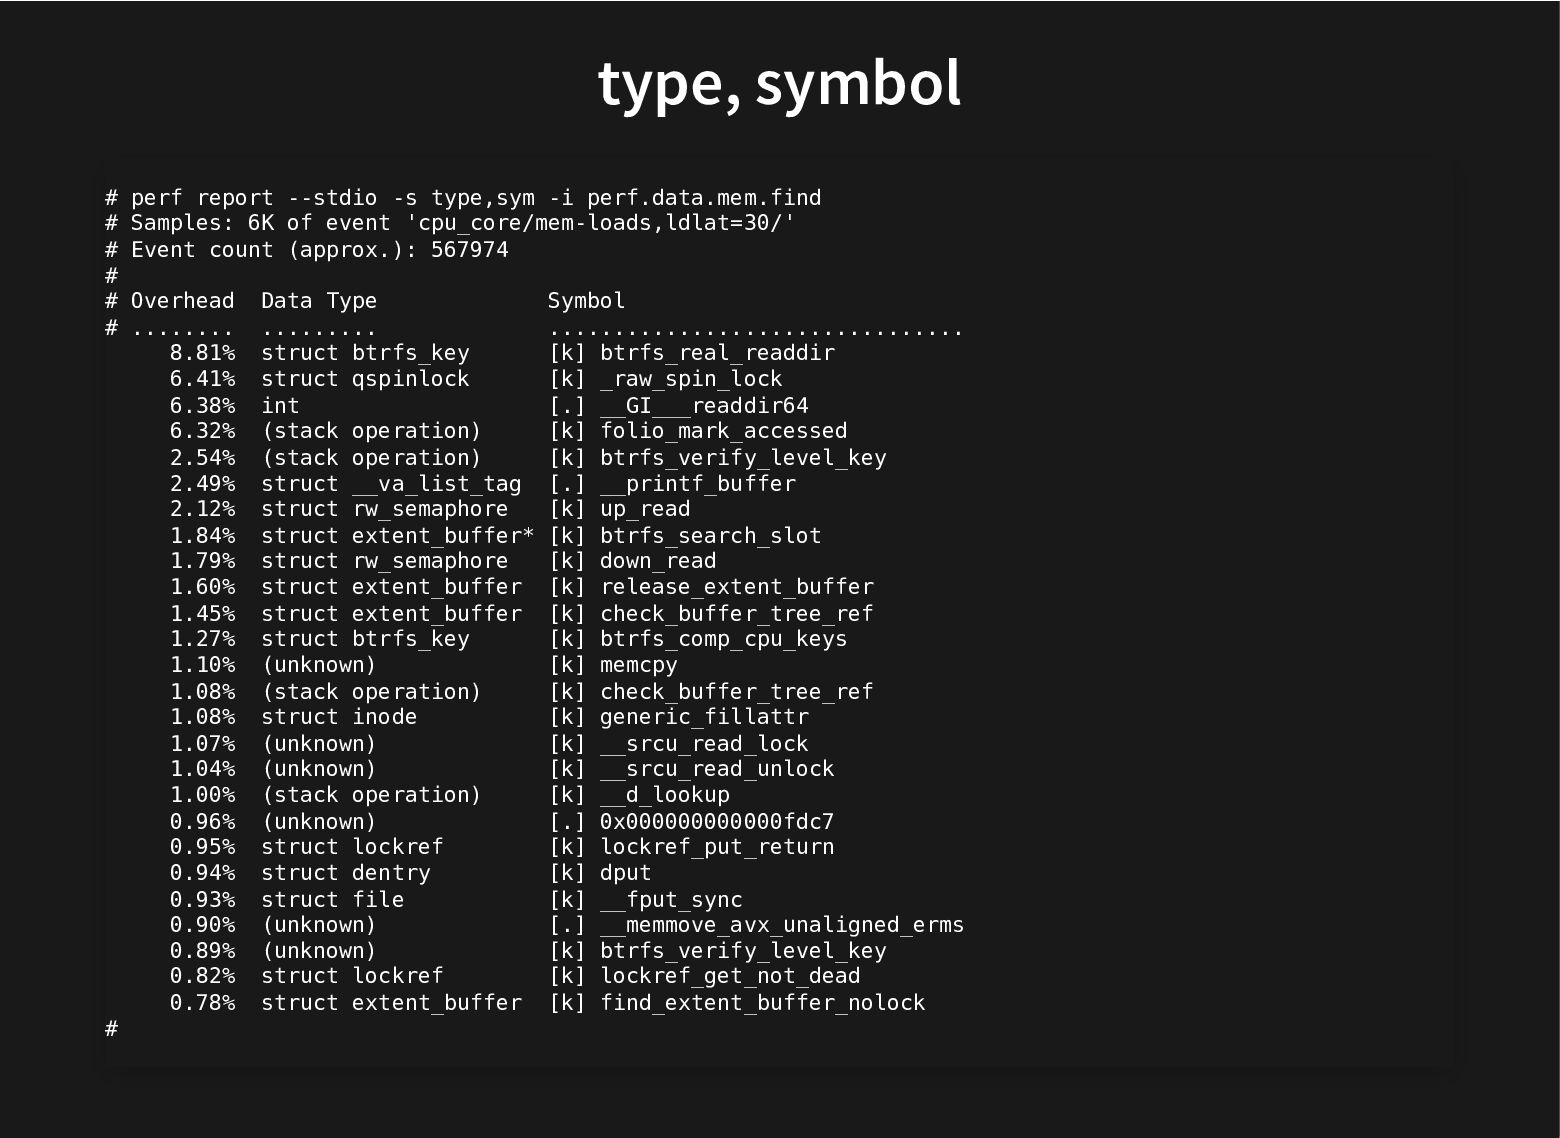
type, symbol # perf report --stdio -s type,sym -i perf.data.mem.find
# Samples: 6K of event 'cpu_core/mem-loads,ldlat=30/' # Event count (approx.): 567974 # # Overhead Data Type Symbol # ........ ......... ................................ 8.81% struct btrfs_key [k] btrfs_real_readdir 6.41% struct qspinlock [k] _raw_spin_lock 6.38% int [.] __GI___readdir64 6.32% (stack operation) [k] folio_mark_accessed 2.54% (stack operation) [k] btrfs_verify_level_key 2.49% struct __va_list_tag [.] __printf_buffer 2.12% struct rw_semaphore [k] up_read 1.84% struct extent_buffer* [k] btrfs_search_slot 1.79% struct rw_semaphore [k] down_read 1.60% struct extent_buffer [k] release_extent_buffer 1.45% struct extent_buffer [k] check_buffer_tree_ref 1.27% struct btrfs_key [k] btrfs_comp_cpu_keys 1.10% (unknown) [k] memcpy 1.08% (stack operation) [k] check_buffer_tree_ref 1.08% struct inode [k] generic_fillattr 1.07% (unknown) [k] __srcu_read_lock 1.04% (unknown) [k] __srcu_read_unlock 1.00% (stack operation) [k] __d_lookup 0.96% (unknown) [.] 0x000000000000fdc7 0.95% struct lockref [k] lockref_put_return 0.94% struct dentry [k] dput 0.93% struct file [k] __fput_sync 0.90% (unknown) [.] __memmove_avx_unaligned_erms 0.89% (unknown) [k] btrfs_verify_level_key 0.82% struct lockref [k] lockref_get_not_dead 0.78% struct extent_buffer [k] find_extent_buffer_nolock # -
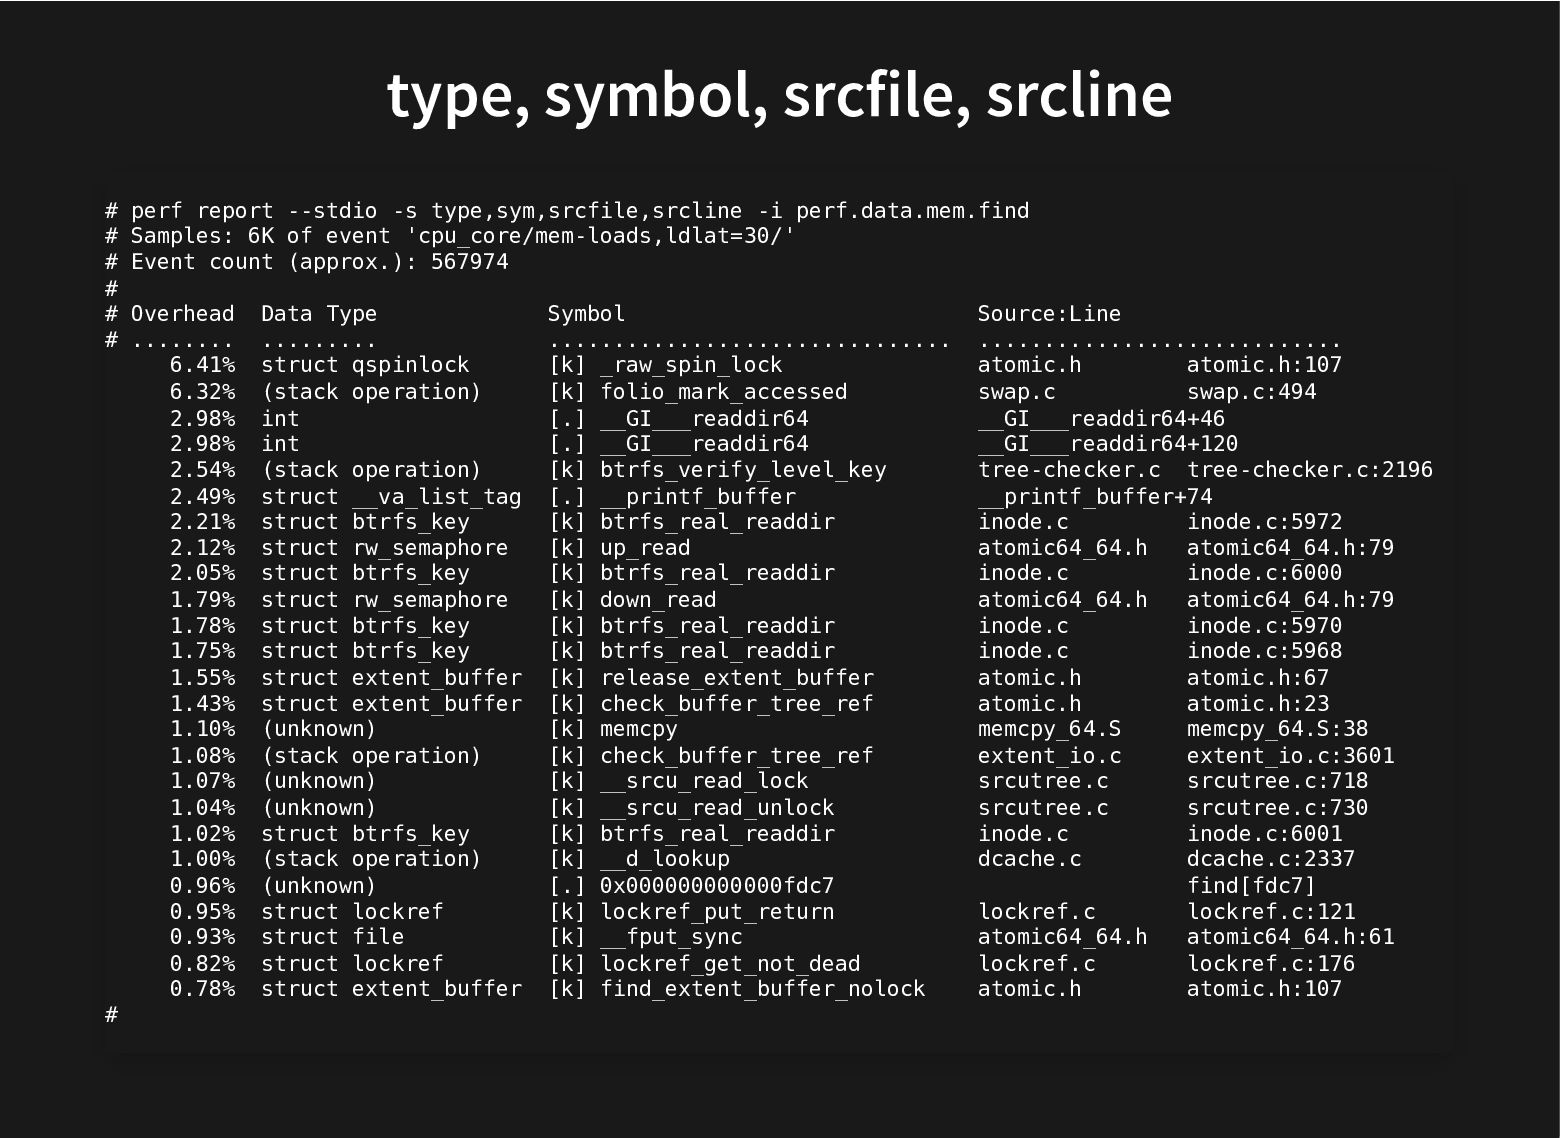
type, symbol, srcfile, srcline # perf report --stdio -s type,sym,srcfile,srcline
-i perf.data.mem.find # Samples: 6K of event 'cpu_core/mem-loads,ldlat=30/' # Event count (approx.): 567974 # # Overhead Data Type Symbol Source:Line # ........ ......... ............................... ............................ 6.41% struct qspinlock [k] _raw_spin_lock atomic.h atomic.h:107 6.32% (stack operation) [k] folio_mark_accessed swap.c swap.c:494 2.98% int [.] __GI___readdir64 __GI___readdir64+46 2.98% int [.] __GI___readdir64 __GI___readdir64+120 2.54% (stack operation) [k] btrfs_verify_level_key tree-checker.c tree-checker.c:2196 2.49% struct __va_list_tag [.] __printf_buffer __printf_buffer+74 2.21% struct btrfs_key [k] btrfs_real_readdir inode.c inode.c:5972 2.12% struct rw_semaphore [k] up_read atomic64_64.h atomic64_64.h:79 2.05% struct btrfs_key [k] btrfs_real_readdir inode.c inode.c:6000 1.79% struct rw_semaphore [k] down_read atomic64_64.h atomic64_64.h:79 1.78% struct btrfs_key [k] btrfs_real_readdir inode.c inode.c:5970 1.75% struct btrfs_key [k] btrfs_real_readdir inode.c inode.c:5968 1.55% struct extent_buffer [k] release_extent_buffer atomic.h atomic.h:67 1.43% struct extent_buffer [k] check_buffer_tree_ref atomic.h atomic.h:23 1.10% (unknown) [k] memcpy memcpy_64.S memcpy_64.S:38 1.08% (stack operation) [k] check_buffer_tree_ref extent_io.c extent_io.c:3601 1.07% (unknown) [k] __srcu_read_lock srcutree.c srcutree.c:718 1.04% (unknown) [k] __srcu_read_unlock srcutree.c srcutree.c:730 1.02% struct btrfs_key [k] btrfs_real_readdir inode.c inode.c:6001 1.00% (stack operation) [k] __d_lookup dcache.c dcache.c:2337 0.96% (unknown) [.] 0x000000000000fdc7 find[fdc7] 0.95% struct lockref [k] lockref_put_return lockref.c lockref.c:121 0.93% struct file [k] __fput_sync atomic64_64.h atomic64_64.h:61 0.82% struct lockref [k] lockref_get_not_dead lockref.c lockref.c:176 0.78% struct extent_buffer [k] find_extent_buffer_nolock atomic.h atomic.h:107 # -
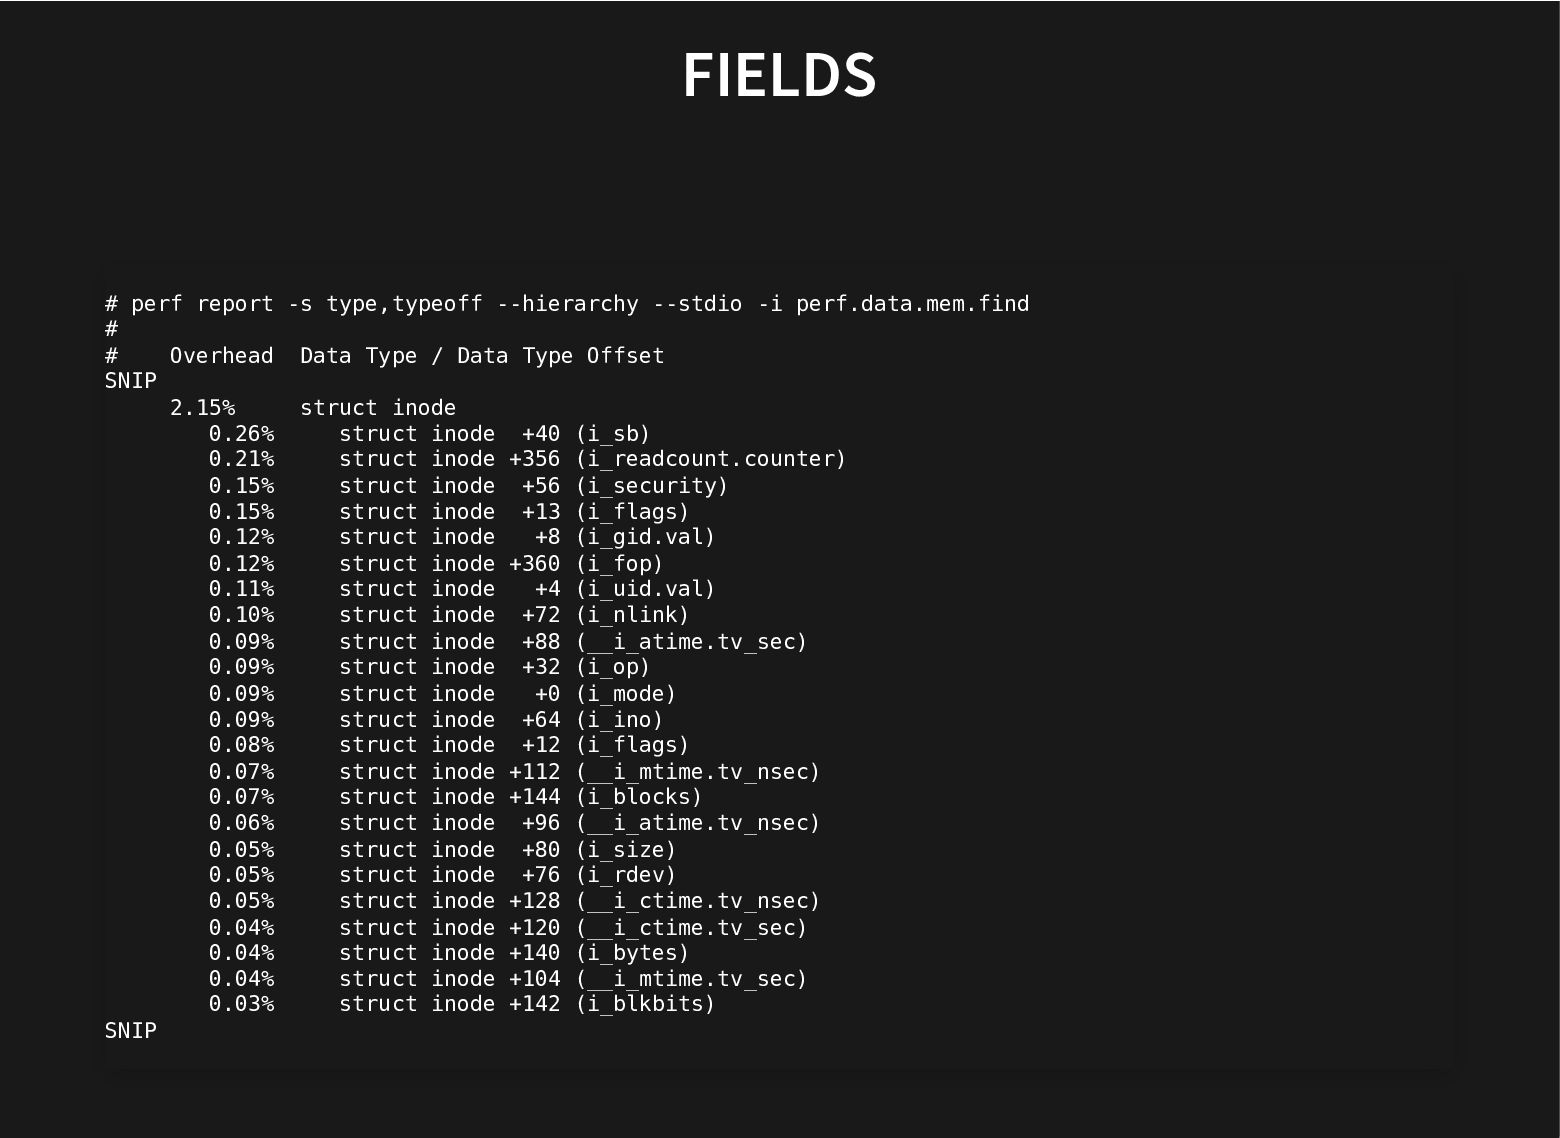
FIELDS # perf report -s type,typeoff --hierarchy --stdio -i perf.data.mem.find
# # Overhead Data Type / Data Type Offset SNIP 2.15% struct inode 0.26% struct inode +40 (i_sb) 0.21% struct inode +356 (i_readcount.counter) 0.15% struct inode +56 (i_security) 0.15% struct inode +13 (i_flags) 0.12% struct inode +8 (i_gid.val) 0.12% struct inode +360 (i_fop) 0.11% struct inode +4 (i_uid.val) 0.10% struct inode +72 (i_nlink) 0.09% struct inode +88 (__i_atime.tv_sec) 0.09% struct inode +32 (i_op) 0.09% struct inode +0 (i_mode) 0.09% struct inode +64 (i_ino) 0.08% struct inode +12 (i_flags) 0.07% struct inode +112 (__i_mtime.tv_nsec) 0.07% struct inode +144 (i_blocks) 0.06% struct inode +96 (__i_atime.tv_nsec) 0.05% struct inode +80 (i_size) 0.05% struct inode +76 (i_rdev) 0.05% struct inode +128 (__i_ctime.tv_nsec) 0.04% struct inode +120 (__i_ctime.tv_sec) 0.04% struct inode +140 (i_bytes) 0.04% struct inode +104 (__i_mtime.tv_sec) 0.03% struct inode +142 (i_blkbits) SNIP -
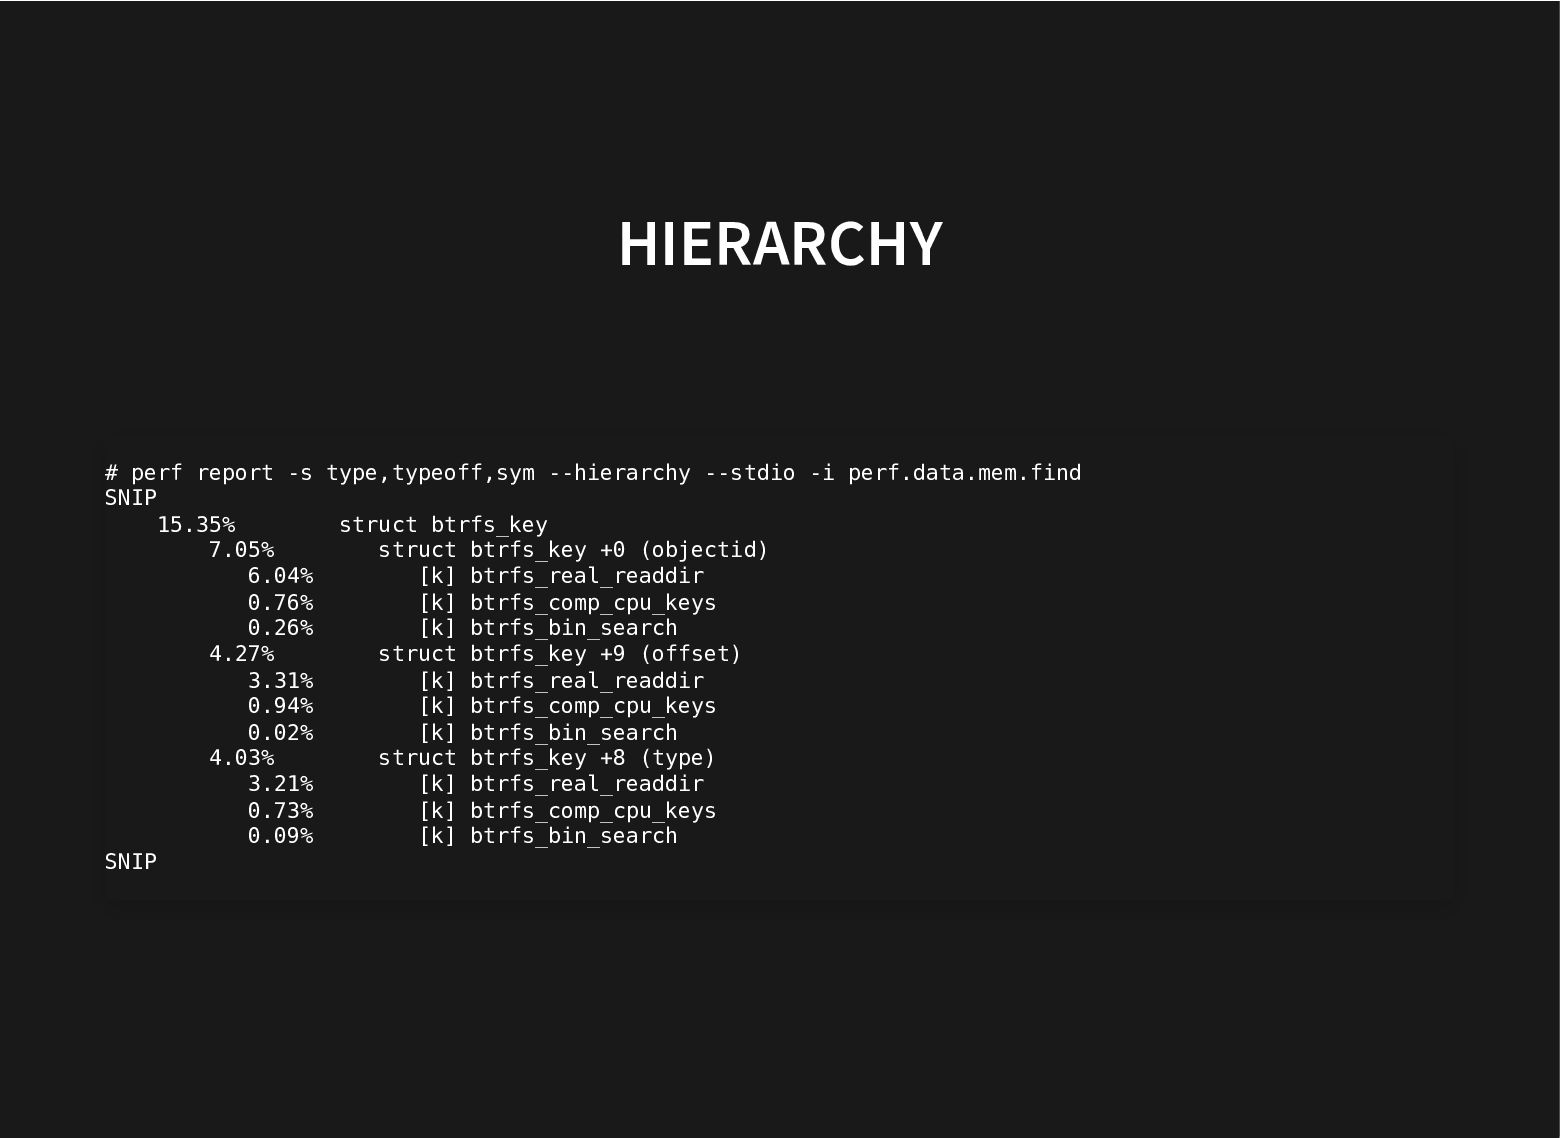
HIERARCHY # perf report -s type,typeoff,sym --hierarchy --stdio -i perf.data.mem.find
SNIP 15.35% struct btrfs_key 7.05% struct btrfs_key +0 (objectid) 6.04% [k] btrfs_real_readdir 0.76% [k] btrfs_comp_cpu_keys 0.26% [k] btrfs_bin_search 4.27% struct btrfs_key +9 (offset) 3.31% [k] btrfs_real_readdir 0.94% [k] btrfs_comp_cpu_keys 0.02% [k] btrfs_bin_search 4.03% struct btrfs_key +8 (type) 3.21% [k] btrfs_real_readdir 0.73% [k] btrfs_comp_cpu_keys 0.09% [k] btrfs_bin_search SNIP -
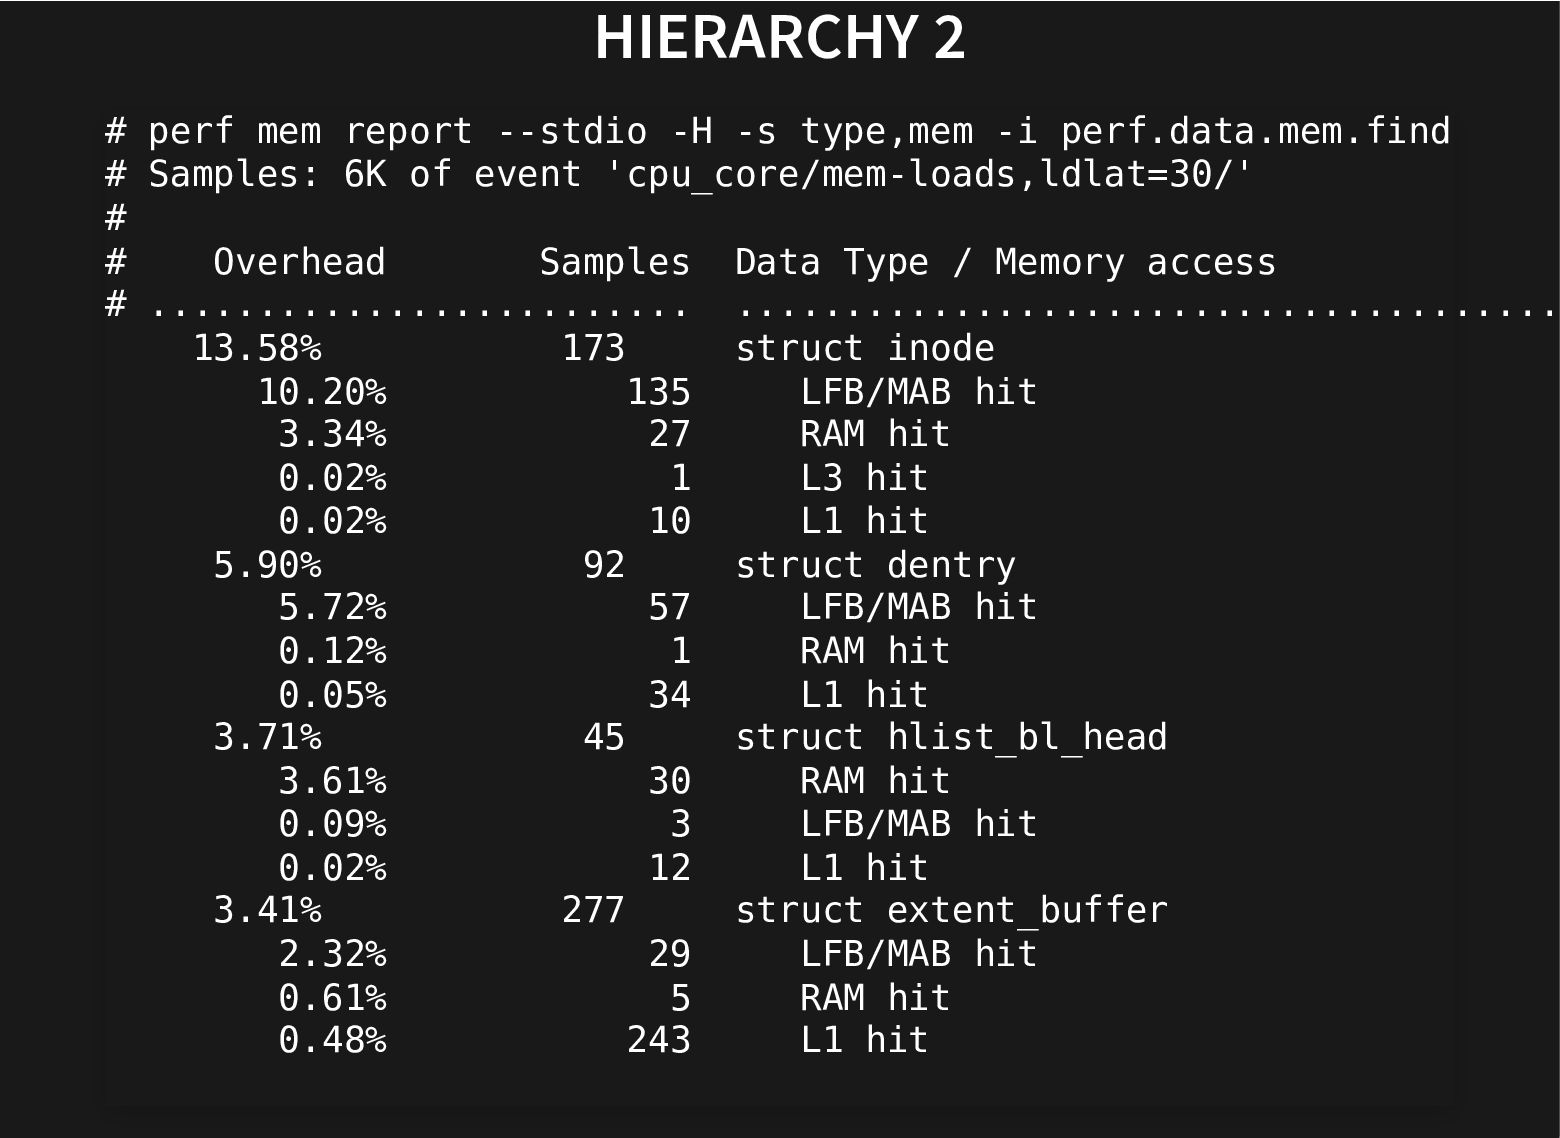
HIERARCHY 2 # perf mem report --stdio -H -s type,mem
-i perf.data.mem.find # Samples: 6K of event 'cpu_core/mem-loads,ldlat=30/' # # Overhead Samples Data Type / Memory access # ......................... ...................................... 13.58% 173 struct inode 10.20% 135 LFB/MAB hit 3.34% 27 RAM hit 0.02% 1 L3 hit 0.02% 10 L1 hit 5.90% 92 struct dentry 5.72% 57 LFB/MAB hit 0.12% 1 RAM hit 0.05% 34 L1 hit 3.71% 45 struct hlist_bl_head 3.61% 30 RAM hit 0.09% 3 LFB/MAB hit 0.02% 12 L1 hit 3.41% 277 struct extent_buffer 2.32% 29 LFB/MAB hit 0.61% 5 RAM hit 0.48% 243 L1 hit -
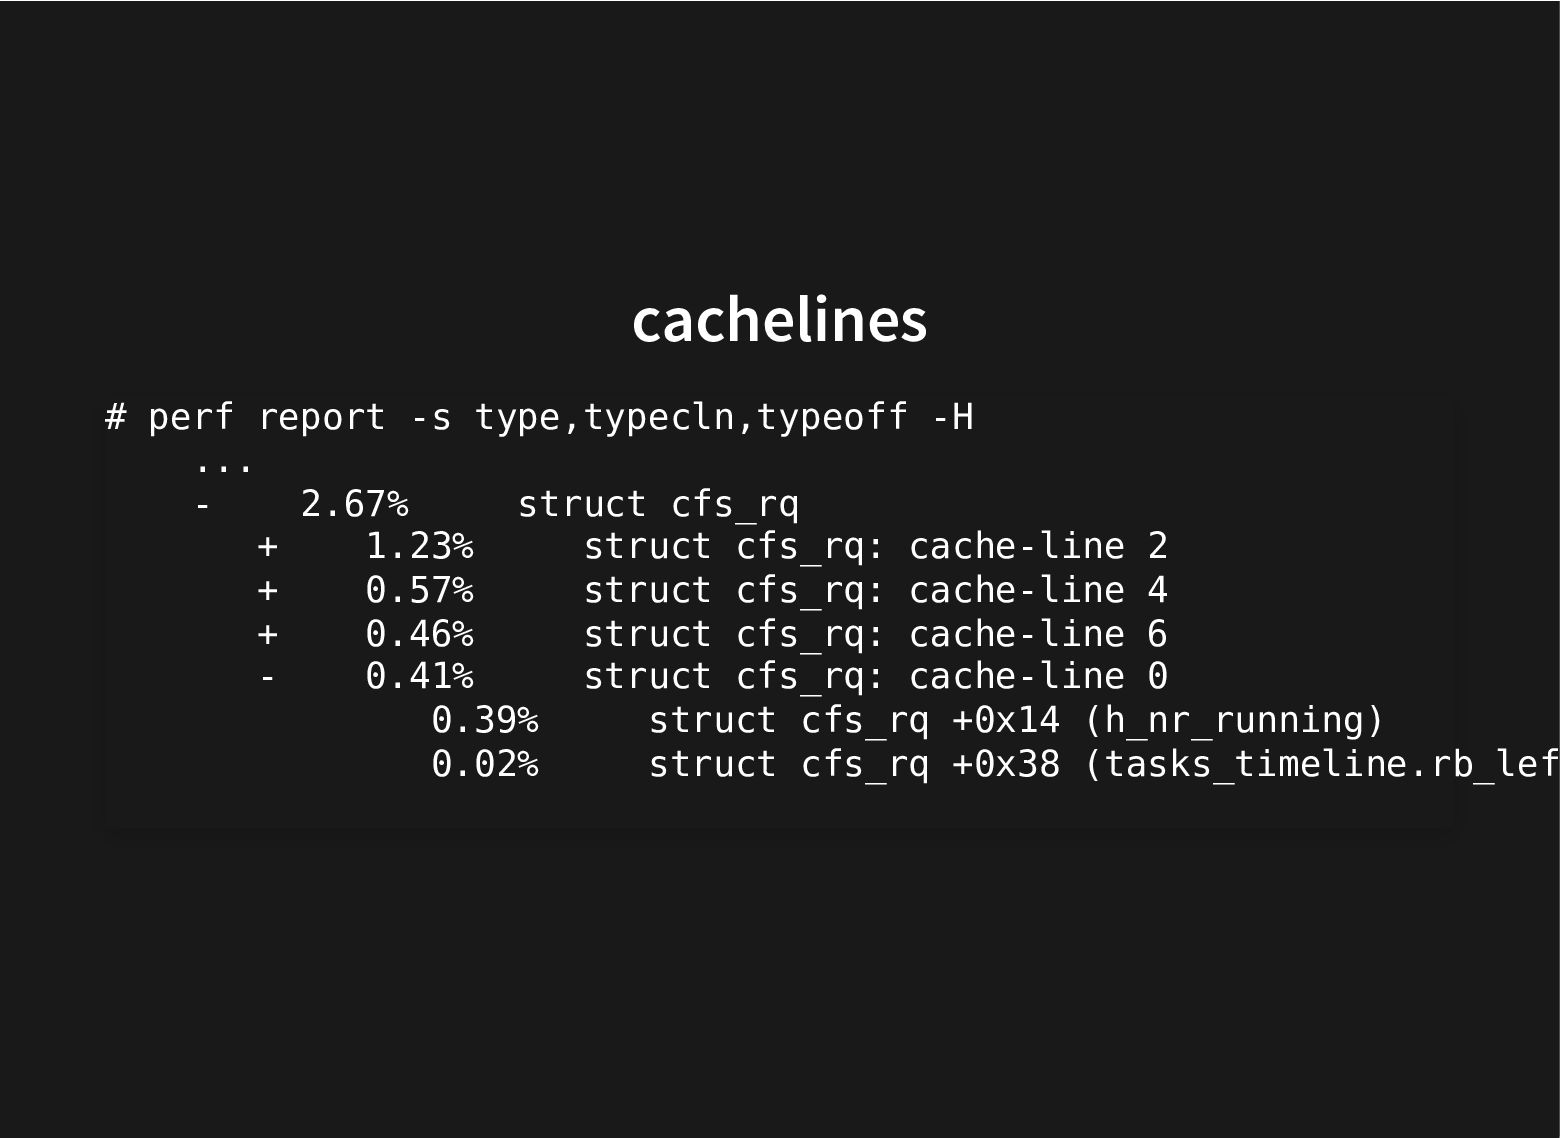
cachelines # perf report -s type,typecln,typeoff -H ... - 2.67%
struct cfs_rq + 1.23% struct cfs_rq: cache-line 2 + 0.57% struct cfs_rq: cache-line 4 + 0.46% struct cfs_rq: cache-line 6 - 0.41% struct cfs_rq: cache-line 0 0.39% struct cfs_rq +0x14 (h_nr_running) 0.02% struct cfs_rq +0x38 (tasks_timeline.rb_lef -
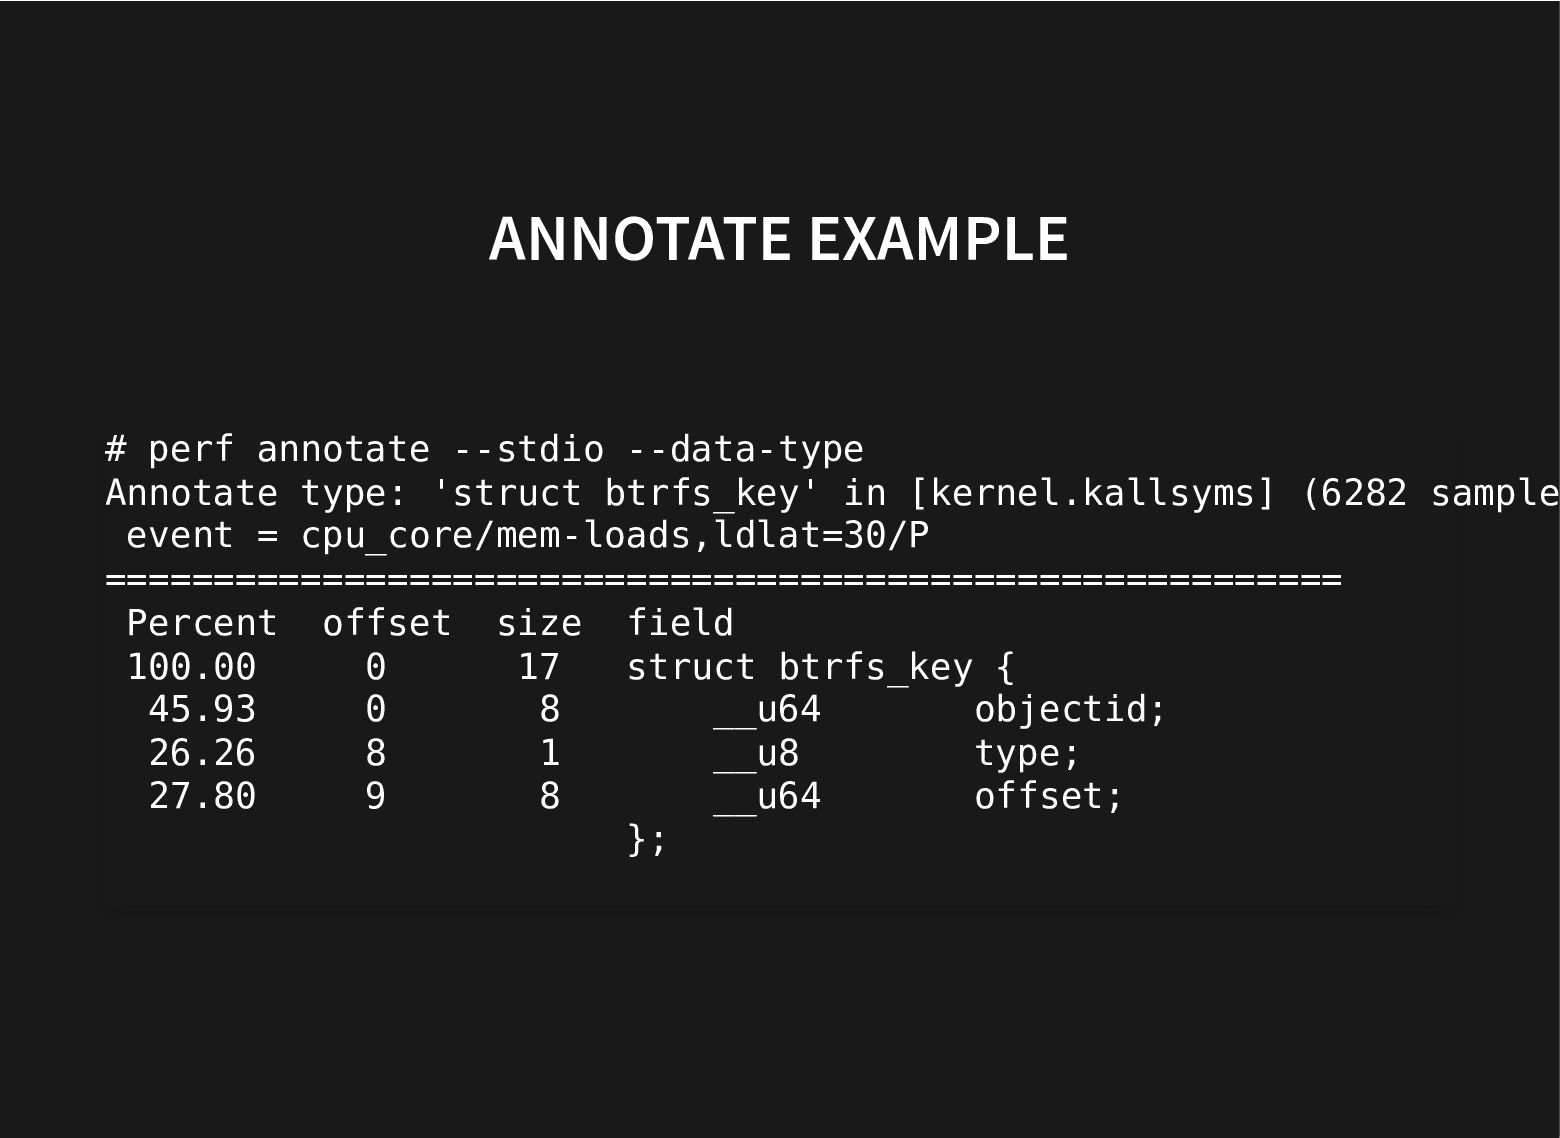
ANNOTATE EXAMPLE # perf annotate --stdio --data-type Annotate type: 'struct
btrfs_key' in [kernel.kallsyms] (6282 sample event = cpu_core/mem-loads,ldlat=30/P ========================================================= Percent offset size field 100.00 0 17 struct btrfs_key { 45.93 0 8 __u64 objectid; 26.26 8 1 __u8 type; 27.80 9 8 __u64 offset; }; -
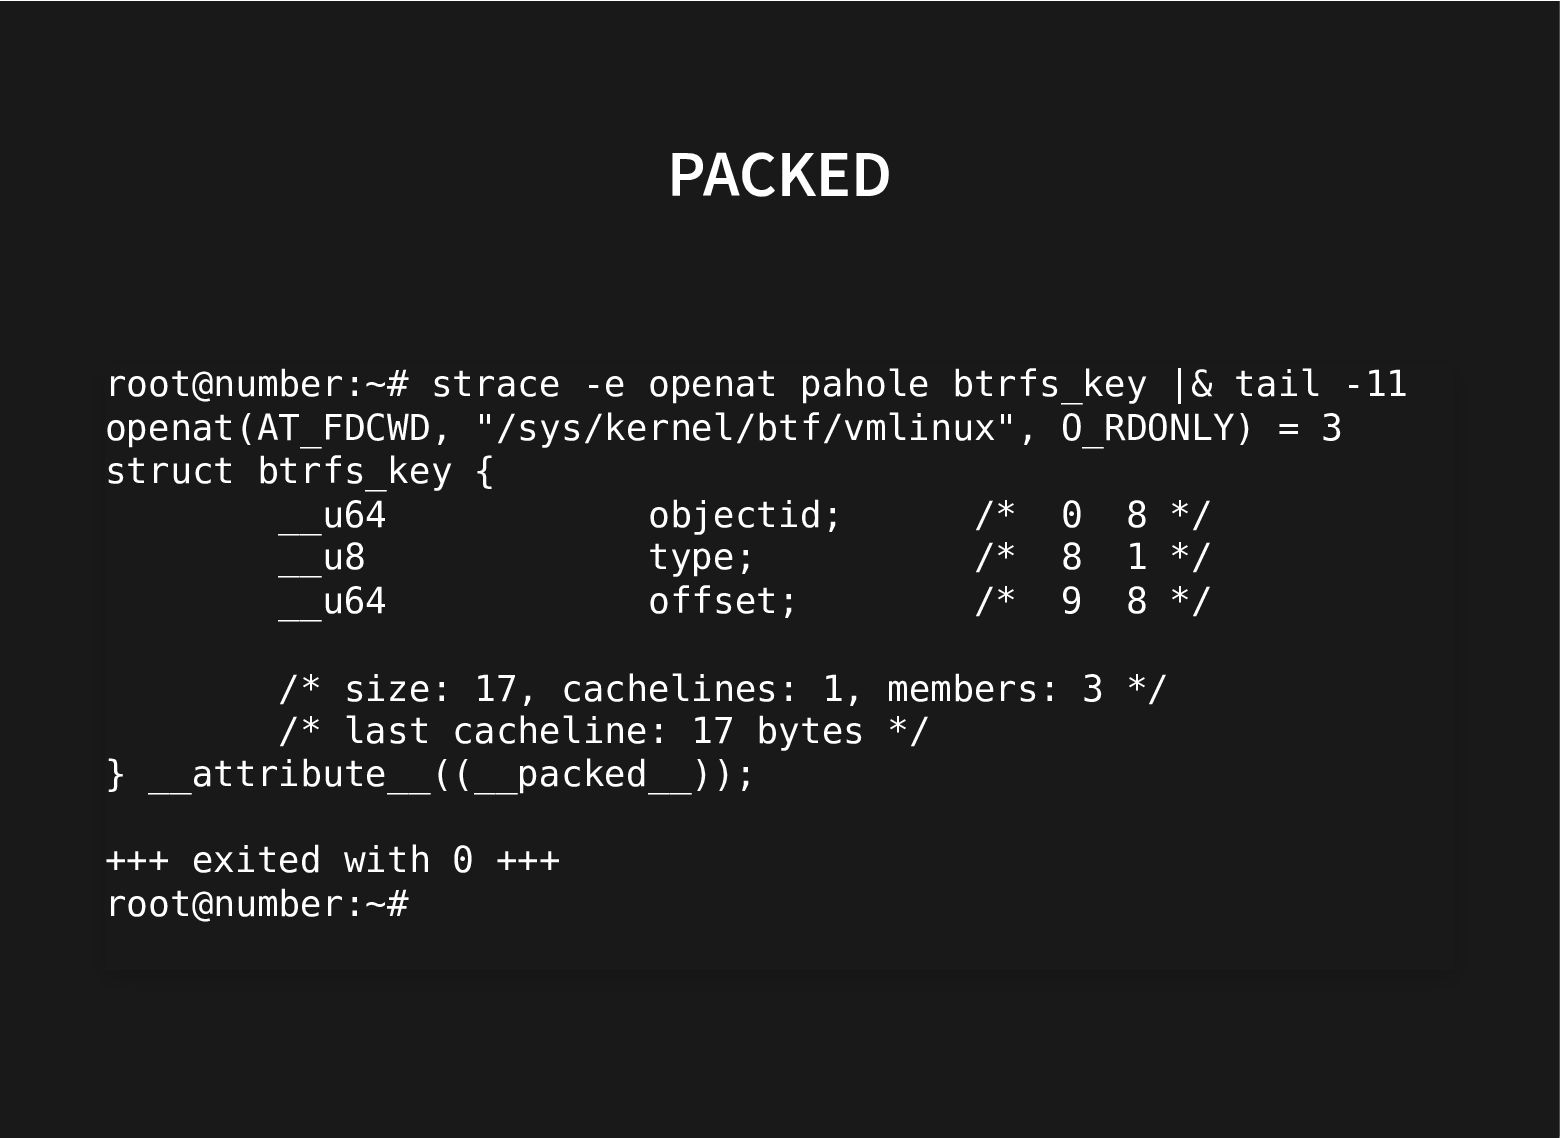
PACKED root@number:~# strace -e openat pahole btrfs_key |& tail -11
openat(AT_FDCWD, "/sys/kernel/btf/vmlinux", O_RDONLY) = 3 struct btrfs_key { __u64 objectid; /* 0 8 */ __u8 type; /* 8 1 */ __u64 offset; /* 9 8 */ /* size: 17, cachelines: 1, members: 3 */ /* last cacheline: 17 bytes */ } __attribute__((__packed__)); +++ exited with 0 +++ root@number:~# -
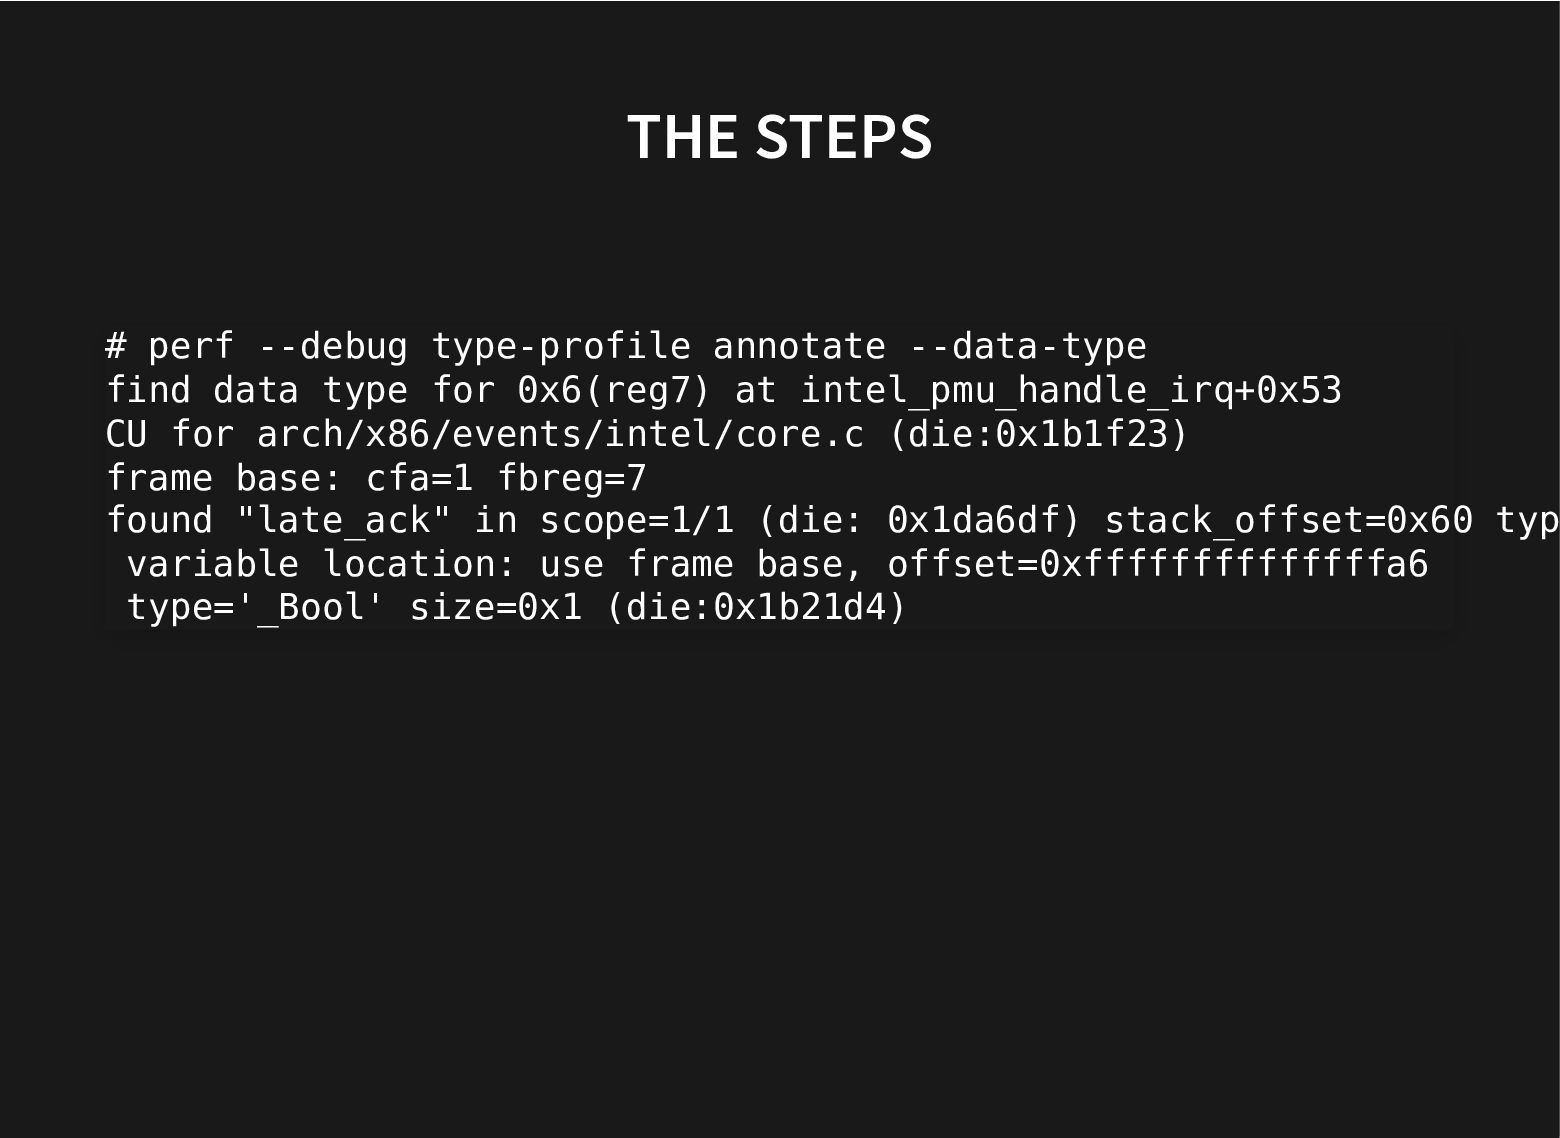
THE STEPS # perf --debug type-profile annotate --data-type find data
type for 0x6(reg7) at intel_pmu_handle_irq+0x53 CU for arch/x86/events/intel/core.c (die:0x1b1f23) frame base: cfa=1 fbreg=7 found "late_ack" in scope=1/1 (die: 0x1da6df) stack_offset=0x60 typ variable location: use frame base, offset=0xffffffffffffffa6 type='_Bool' size=0x1 (die:0x1b21d4) -
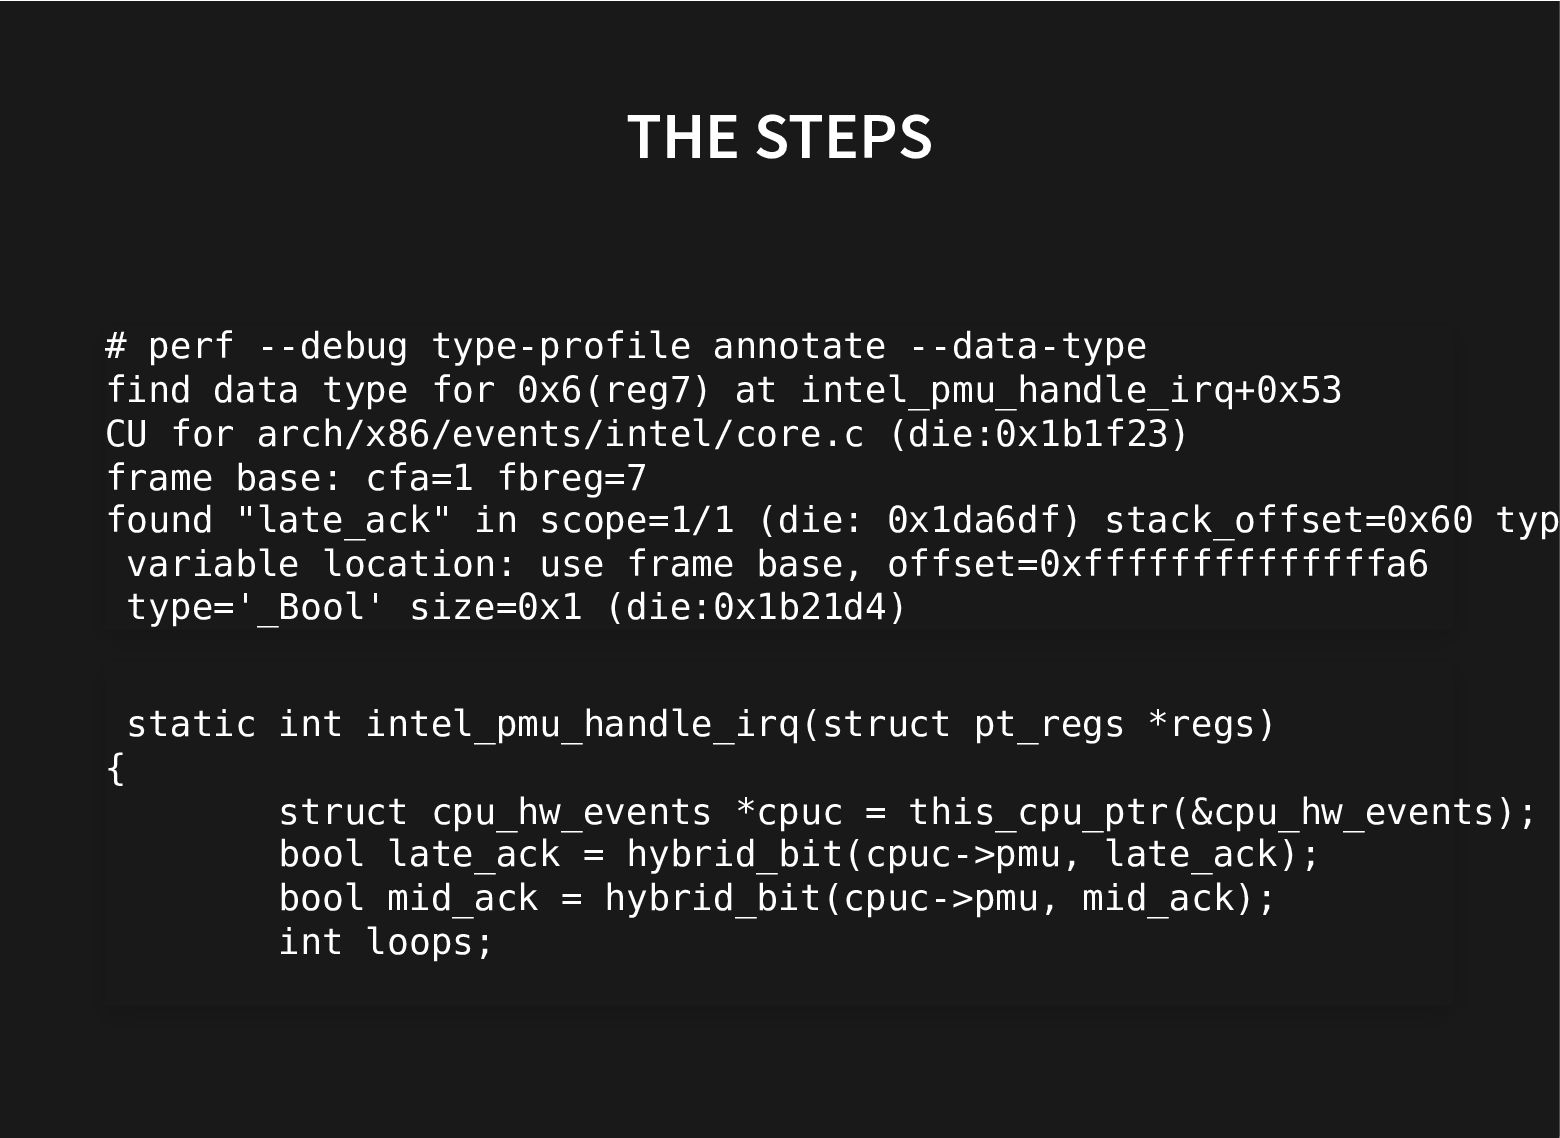
THE STEPS # perf --debug type-profile annotate --data-type find data
type for 0x6(reg7) at intel_pmu_handle_irq+0x53 CU for arch/x86/events/intel/core.c (die:0x1b1f23) frame base: cfa=1 fbreg=7 found "late_ack" in scope=1/1 (die: 0x1da6df) stack_offset=0x60 typ variable location: use frame base, offset=0xffffffffffffffa6 type='_Bool' size=0x1 (die:0x1b21d4) static int intel_pmu_handle_irq(struct pt_regs *regs) { struct cpu_hw_events *cpuc = this_cpu_ptr(&cpu_hw_events); bool late_ack = hybrid_bit(cpuc->pmu, late_ack); bool mid_ack = hybrid_bit(cpuc->pmu, mid_ack); int loops; -
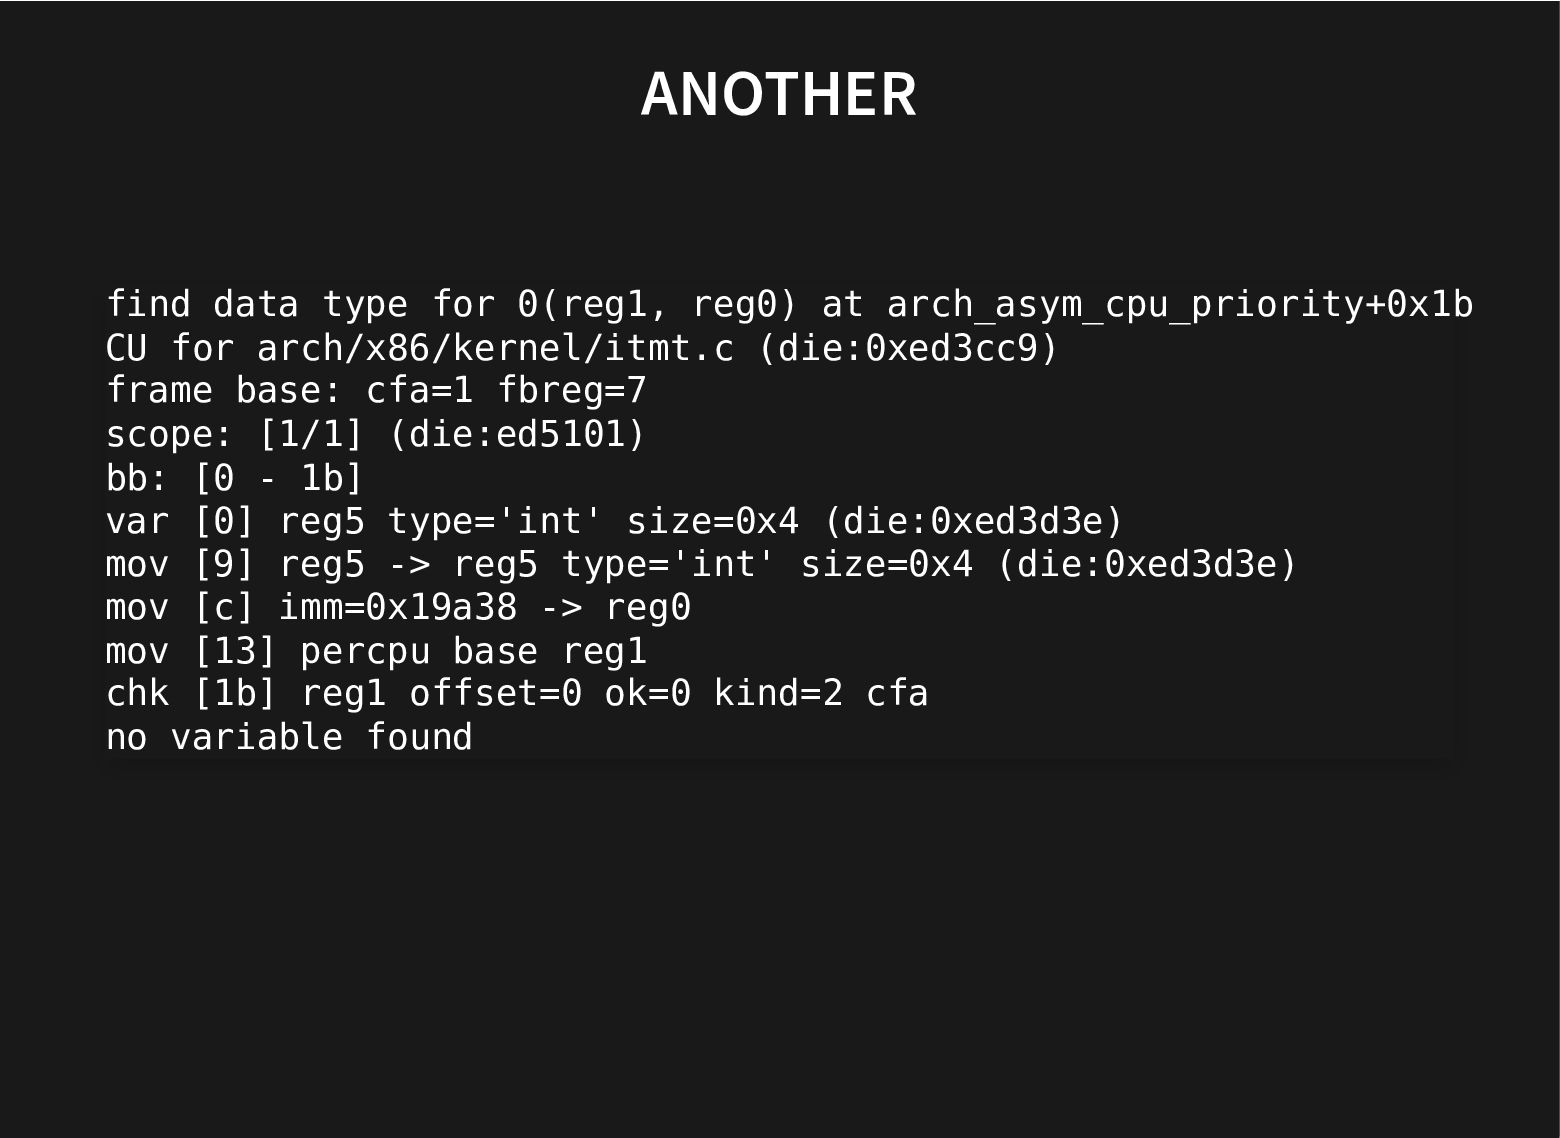
ANOTHER find data type for 0(reg1, reg0) at arch_asym_cpu_priority+0x1b CU
for arch/x86/kernel/itmt.c (die:0xed3cc9) frame base: cfa=1 fbreg=7 scope: [1/1] (die:ed5101) bb: [0 - 1b] var [0] reg5 type='int' size=0x4 (die:0xed3d3e) mov [9] reg5 -> reg5 type='int' size=0x4 (die:0xed3d3e) mov [c] imm=0x19a38 -> reg0 mov [13] percpu base reg1 chk [1b] reg1 offset=0 ok=0 kind=2 cfa no variable found -
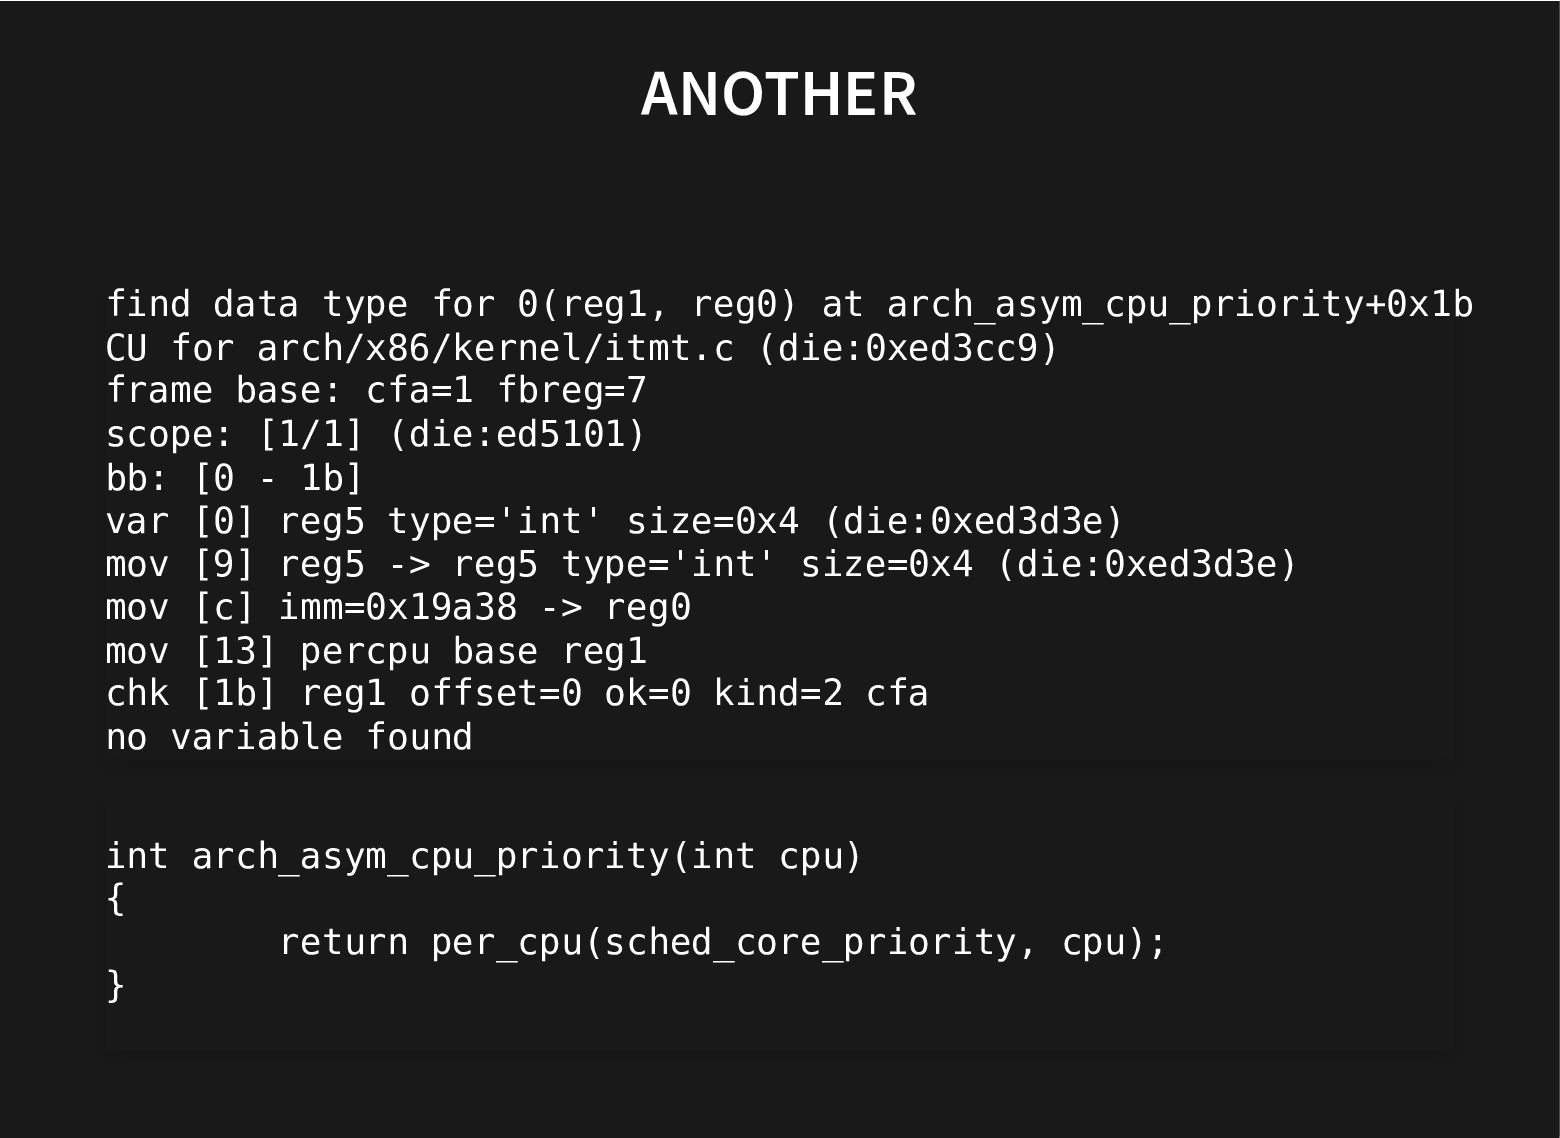
ANOTHER find data type for 0(reg1, reg0) at arch_asym_cpu_priority+0x1b CU
for arch/x86/kernel/itmt.c (die:0xed3cc9) frame base: cfa=1 fbreg=7 scope: [1/1] (die:ed5101) bb: [0 - 1b] var [0] reg5 type='int' size=0x4 (die:0xed3d3e) mov [9] reg5 -> reg5 type='int' size=0x4 (die:0xed3d3e) mov [c] imm=0x19a38 -> reg0 mov [13] percpu base reg1 chk [1b] reg1 offset=0 ok=0 kind=2 cfa no variable found int arch_asym_cpu_priority(int cpu) { return per_cpu(sched_core_priority, cpu); } -
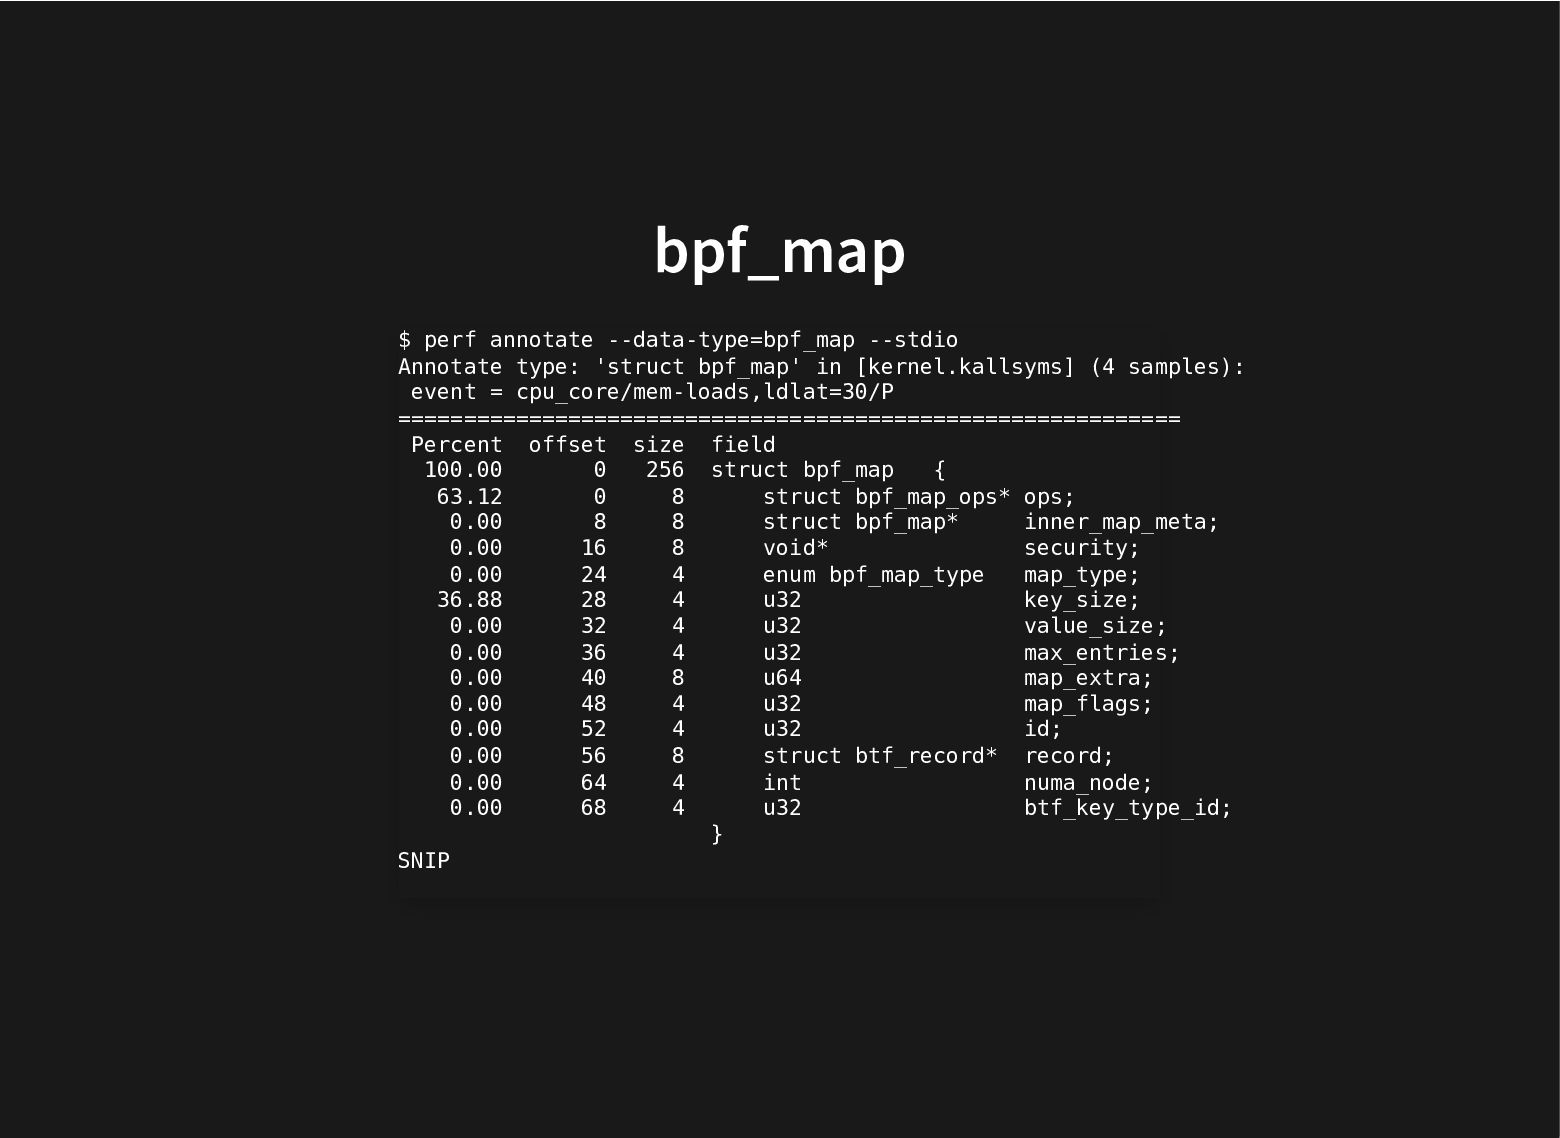
bpf_map $ perf annotate --data-type=bpf_map --stdio Annotate type: 'struct bpf_map'
in [kernel.kallsyms] (4 samples): event = cpu_core/mem-loads,ldlat=30/P ============================================================ Percent offset size field 100.00 0 256 struct bpf_map { 63.12 0 8 struct bpf_map_ops* ops; 0.00 8 8 struct bpf_map* inner_map_meta; 0.00 16 8 void* security; 0.00 24 4 enum bpf_map_type map_type; 36.88 28 4 u32 key_size; 0.00 32 4 u32 value_size; 0.00 36 4 u32 max_entries; 0.00 40 8 u64 map_extra; 0.00 48 4 u32 map_flags; 0.00 52 4 u32 id; 0.00 56 8 struct btf_record* record; 0.00 64 4 int numa_node; 0.00 68 4 u32 btf_key_type_id; } SNIP -
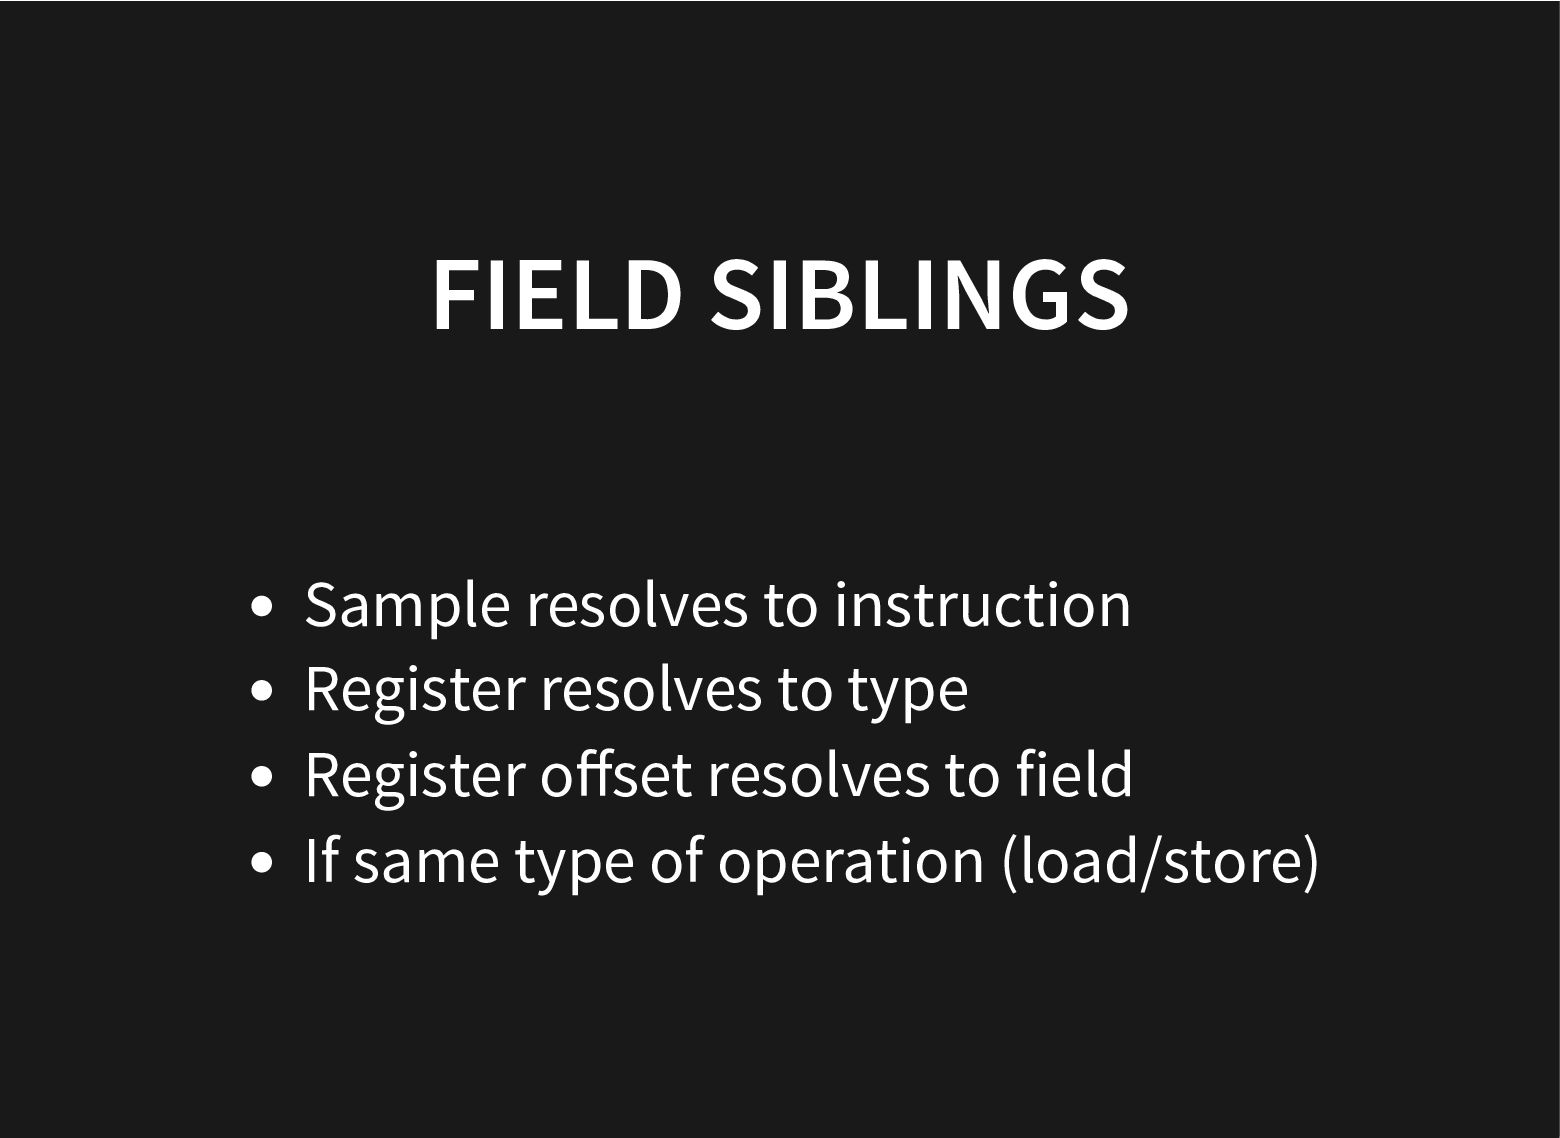
FIELD SIBLINGS Sample resolves to instruction Register resolves to type
Register offset resolves to field If same type of operation (load/store) -
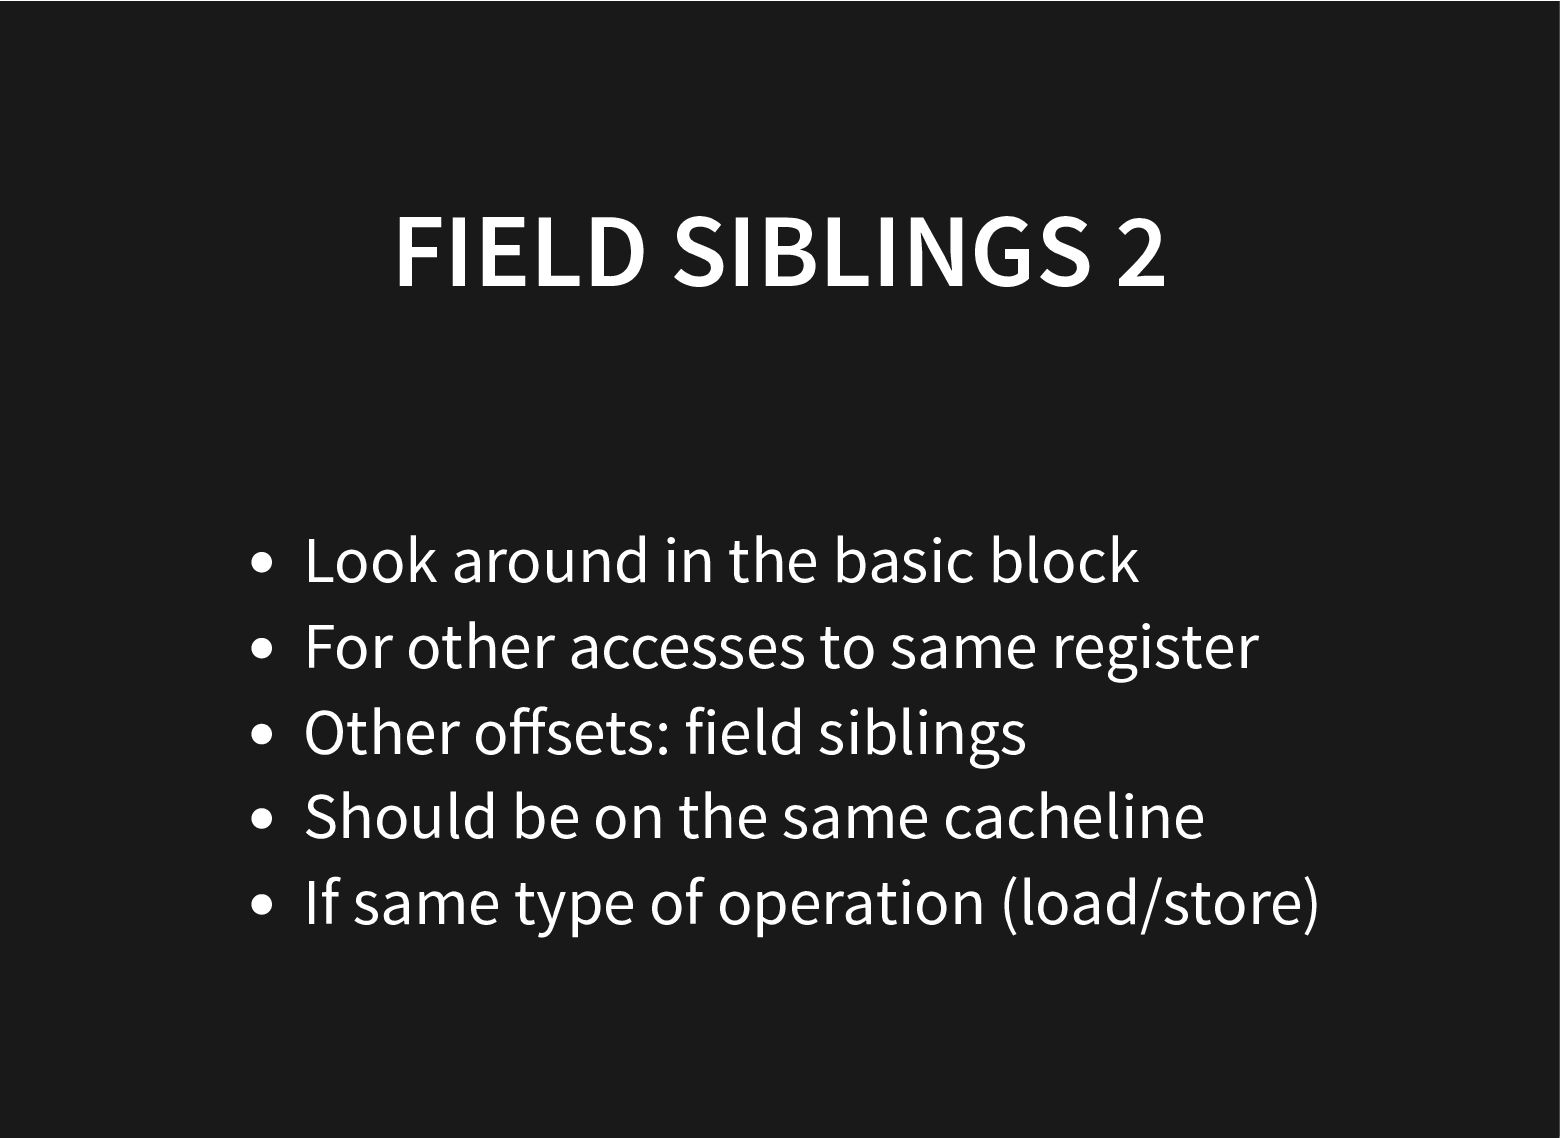
FIELD SIBLINGS 2 Look around in the basic block For
other accesses to same register Other offsets: field siblings Should be on the same cacheline If same type of operation (load/store) -
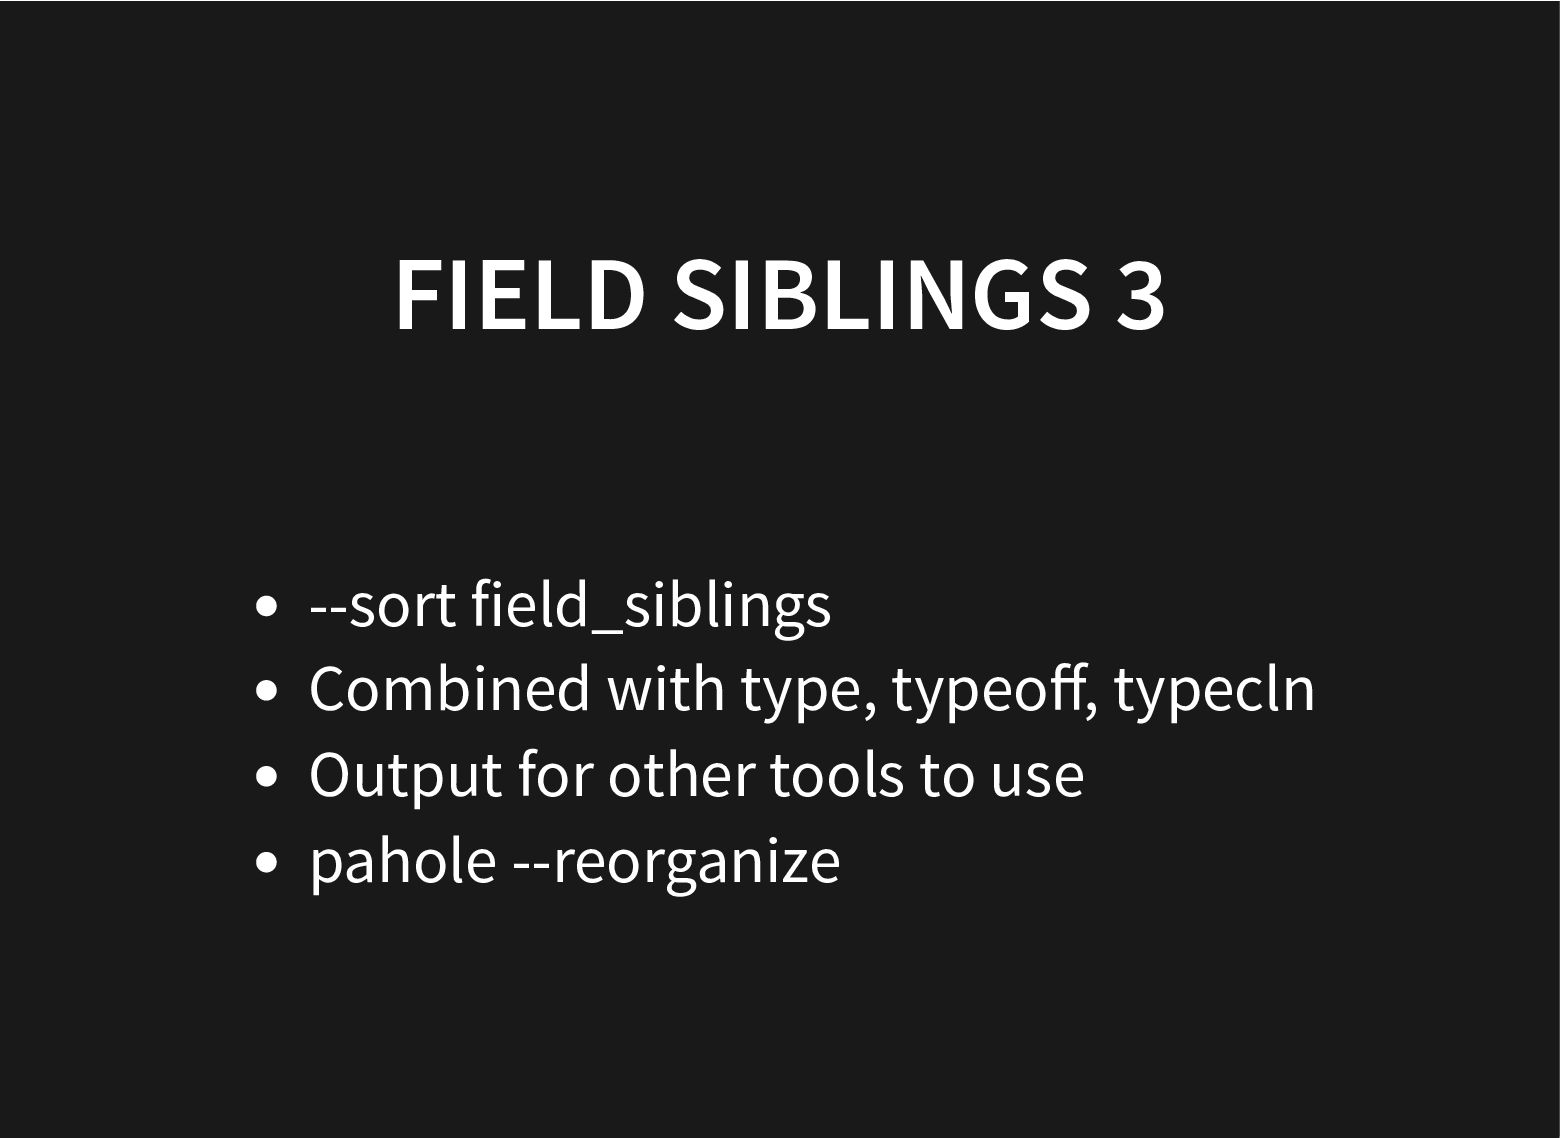
FIELD SIBLINGS 3 --sort field_siblings Combined with type, typeoff, typecln
Output for other tools to use pahole --reorganize -
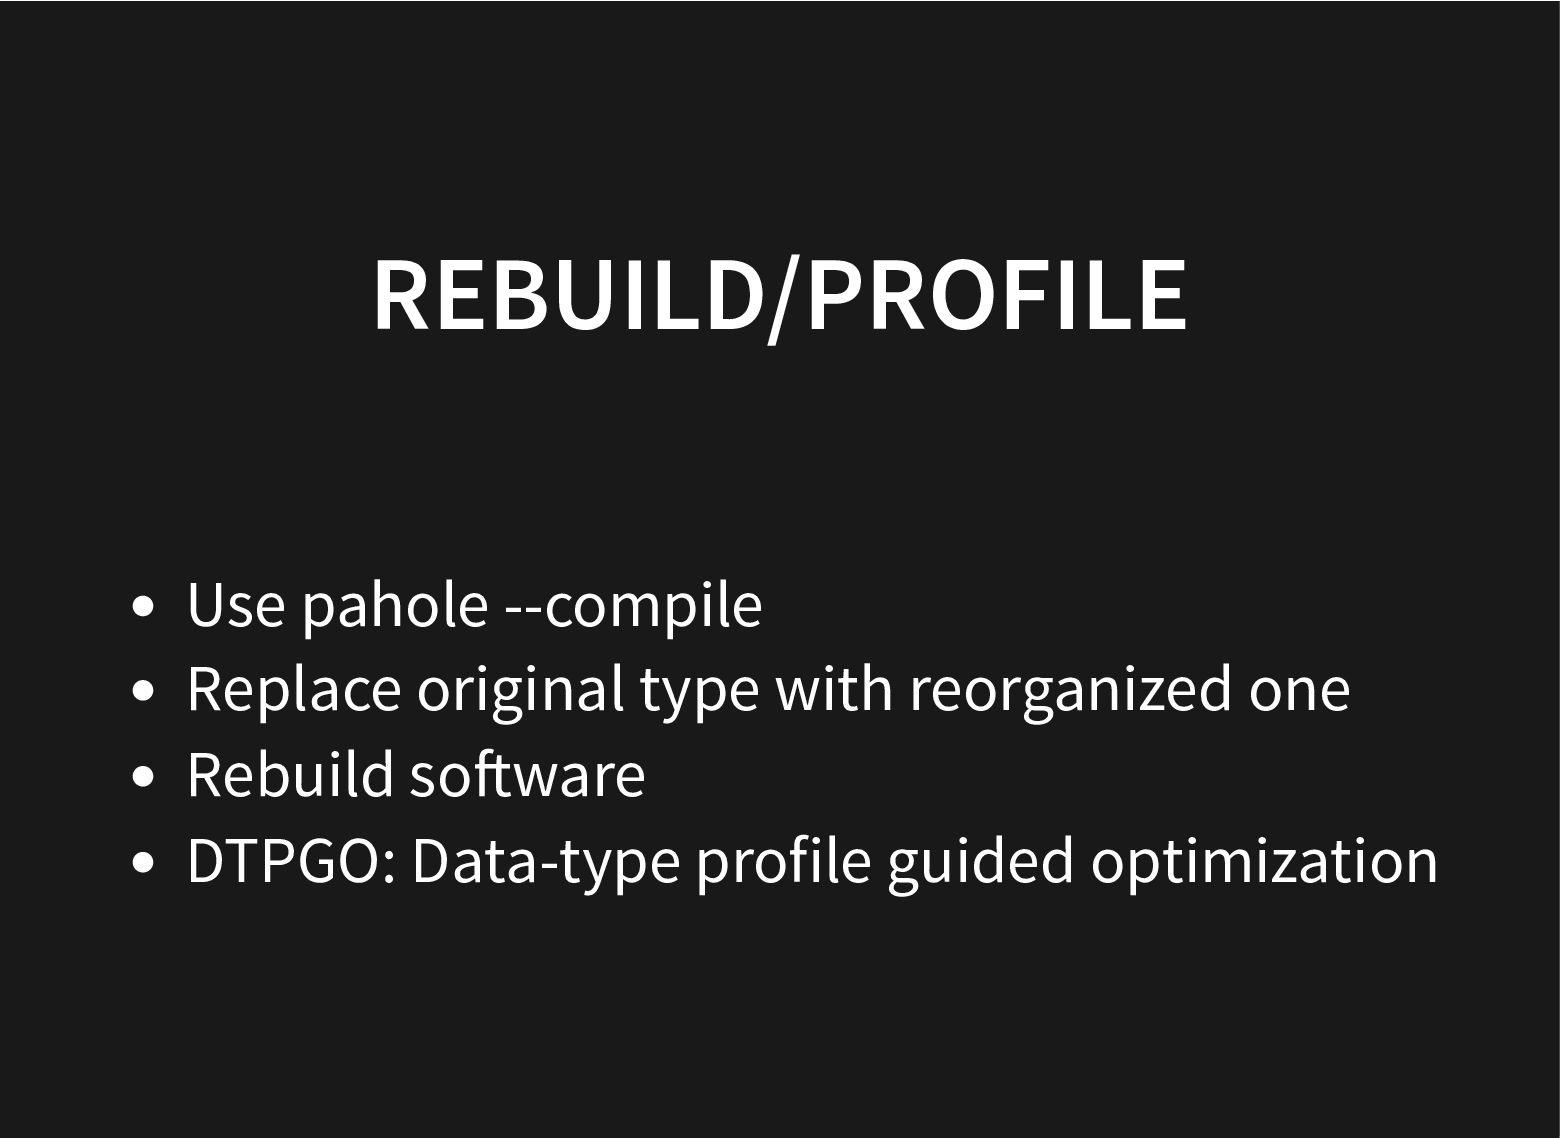
REBUILD/PROFILE Use pahole --compile Replace original type with reorganized one
Rebuild software DTPGO: Data-type profile guided optimization -
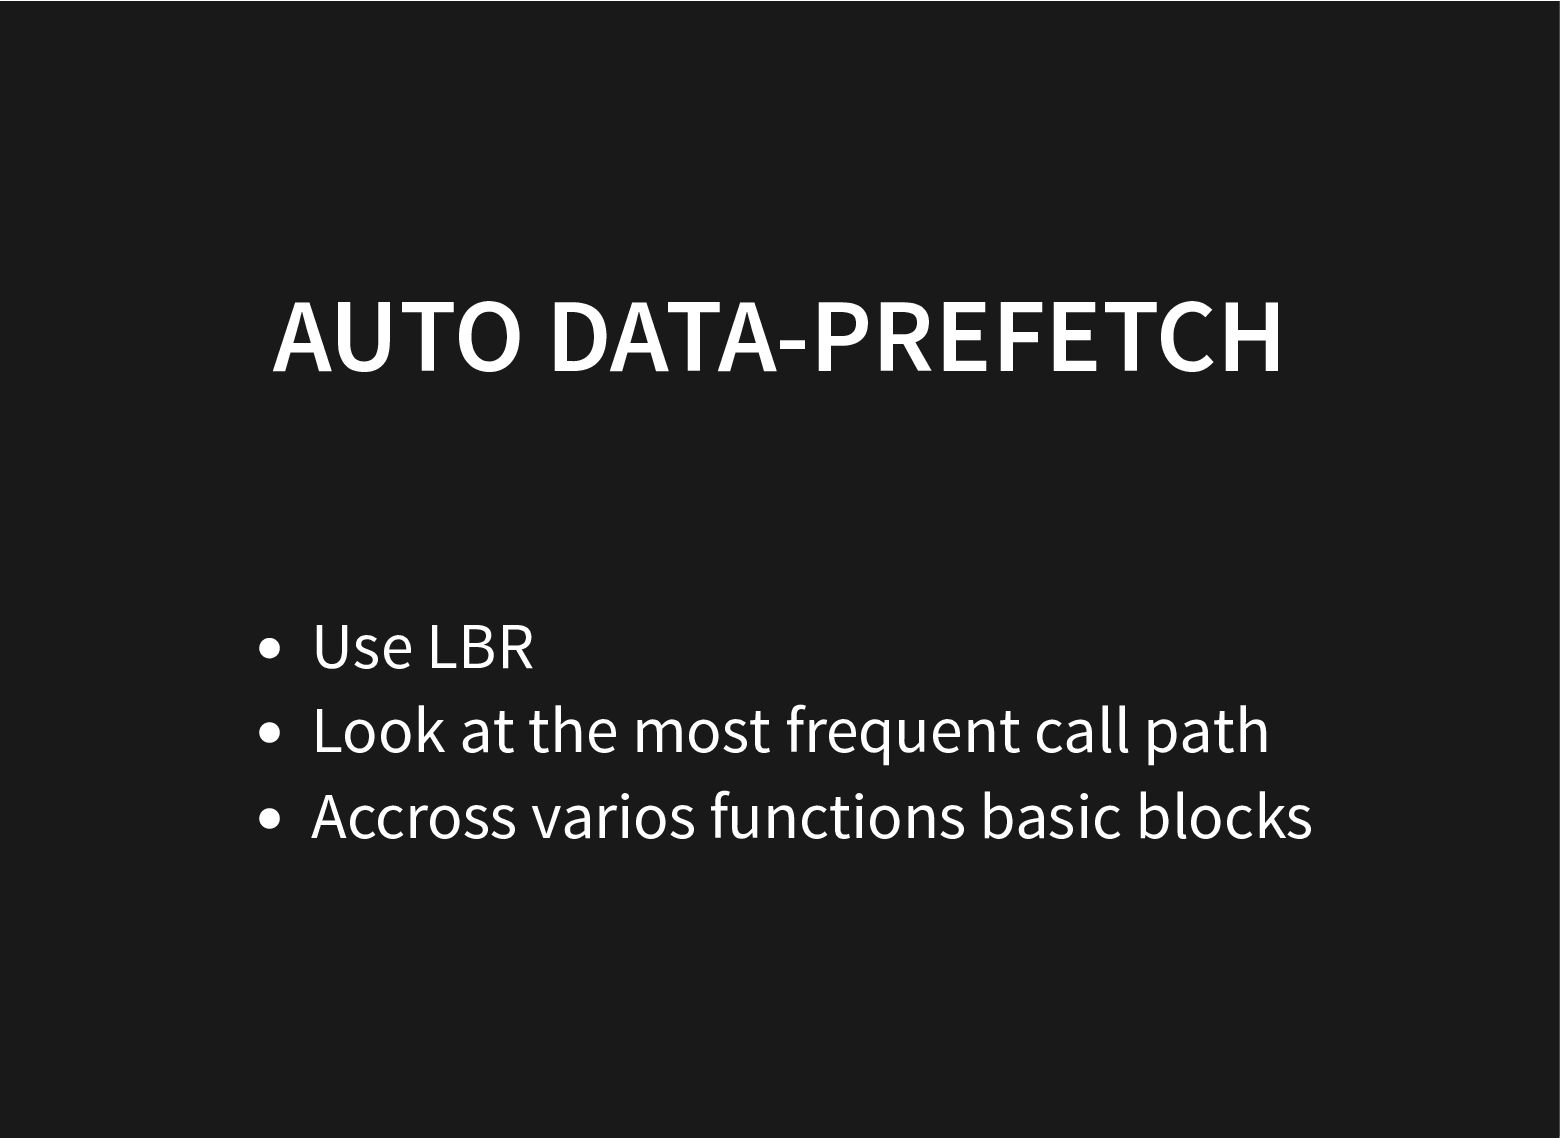
AUTO DATA-PREFETCH Use LBR Look at the most frequent call
path Accross varios functions basic blocks -
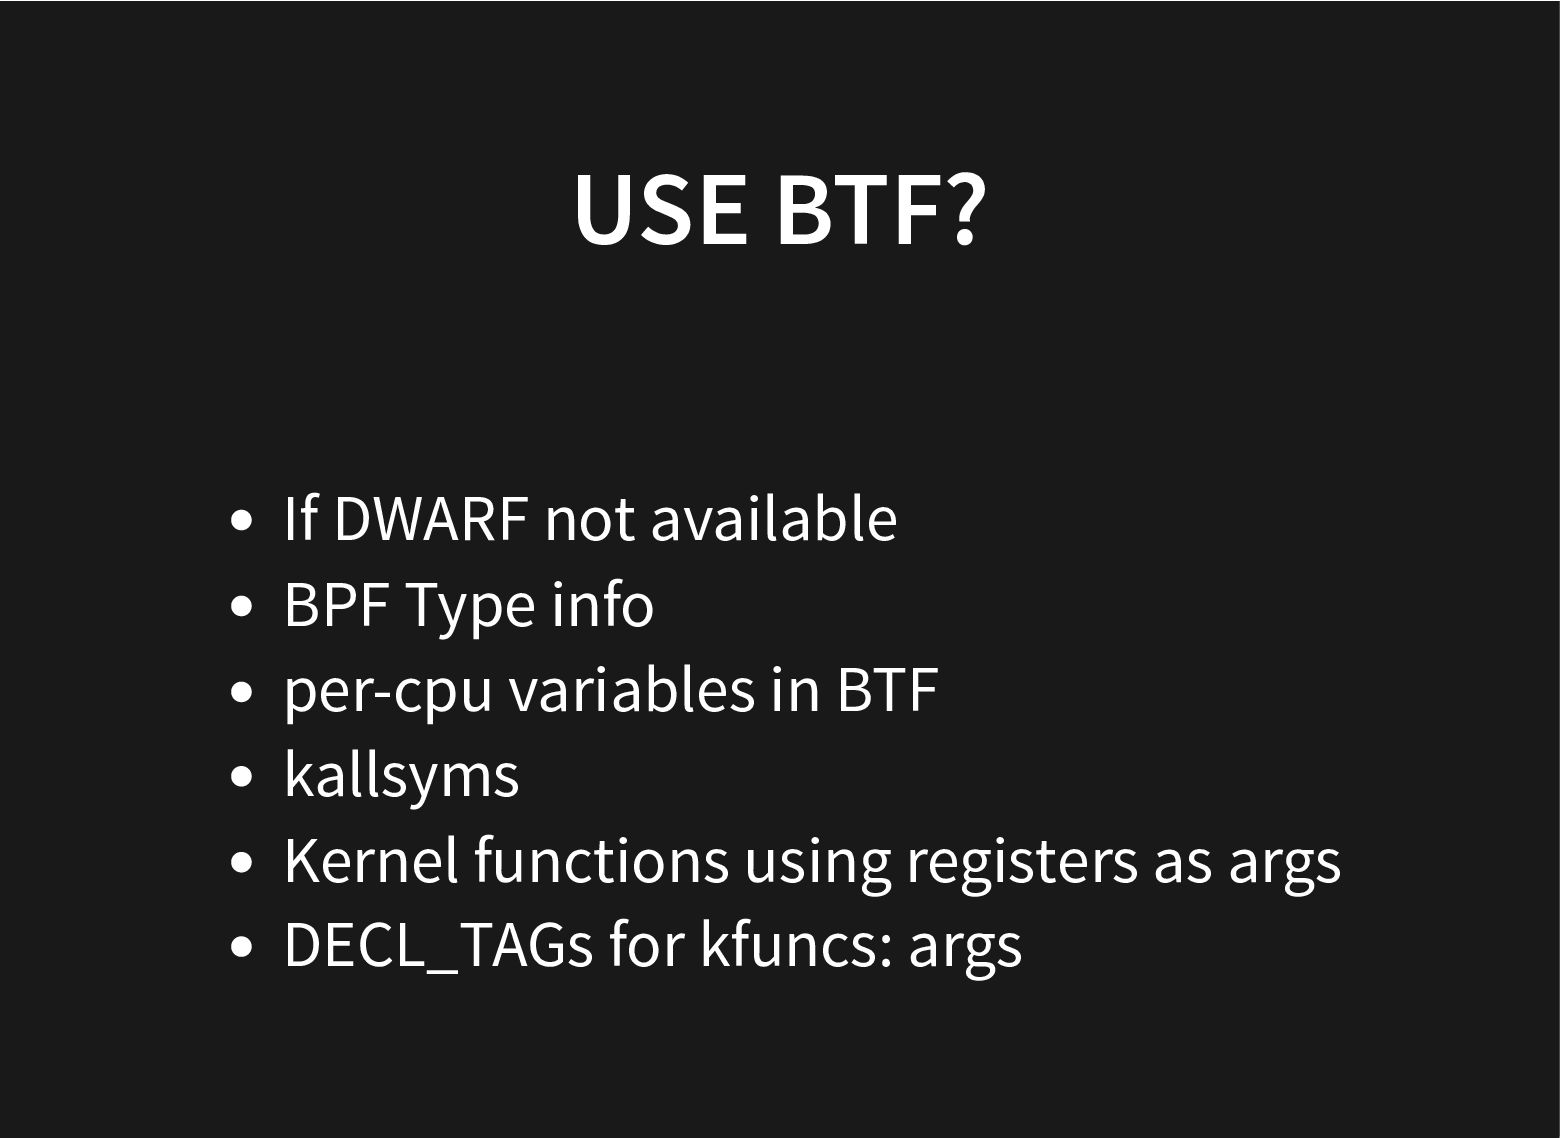
USE BTF? If DWARF not available BPF Type info per-cpu
variables in BTF kallsyms Kernel functions using registers as args DECL_TAGs for kfuncs: args -
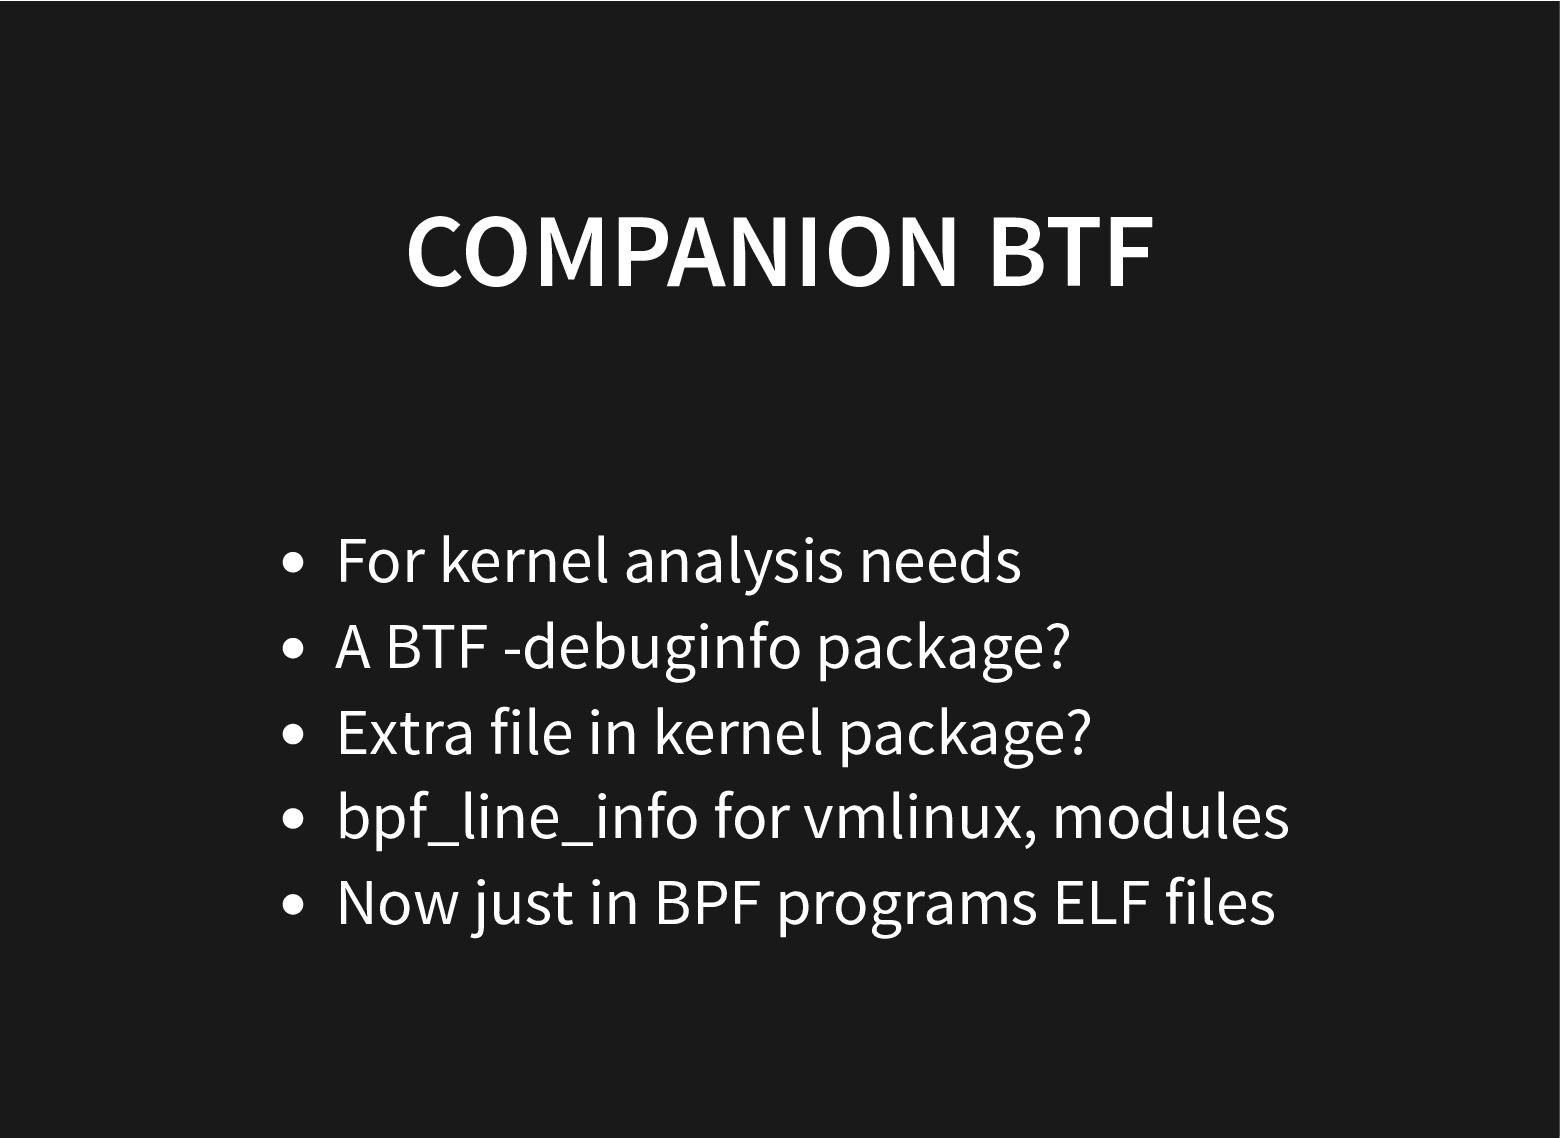
COMPANION BTF For kernel analysis needs A BTF -debuginfo package?
Extra file in kernel package? bpf_line_info for vmlinux, modules Now just in BPF programs ELF files
 ennael
 junya_okura
 bengo4com
 oidfj
 jcabot
 nsatoh
 tomoki10
 mikanichinose
 miriamschwab
 ota1022
 _awache
 ykimi
 sat
 inesmontani
 aleyda
 cassininazir
 gurzu
 tomoyanonymous
 lara
 addyosmani
 thirion
 katarinadahlin