Upgrade to Pro
— share decks privately, control downloads, hide ads and more …
Speaker Deck
Features
Speaker Deck
PRO
Sign in
Sign up for free
Search
Search
Fixing Performance and Memory Problems (RubyWine)
Search
Frederick Cheung
April 04, 2020
Technology
92
0
Share
Embed
Copy iframe code
Copy JS code
Copy link
Start on current slide
Fixing Performance and Memory Problems (RubyWine)
Frederick Cheung
April 04, 2020
More Decks by Frederick Cheung
See All by Frederick Cheung
how_to_ab_test_with_confidence_railsconf.pdf
fcheung
0
76
Fixing Performance and Memory Problems
fcheung
2
560
Asking questions
fcheung
0
83
Extending Ruby
fcheung
1
520
Introduction to Version Control
fcheung
0
100
Other Decks in Technology
See All in Technology
勉強会企画をアプリで構造化してみた 〜そこで見えた、AIとの付き合い方〜 / I've structured a study group plan using an app.
pauli
0
330
“ID沼入口” - 基本とセキュリティから始める、考え続けるためのID管理技術勉強会 告知&イントロ
ritou
0
450
最適な自走を最小限の支援で — M&Aで拡大する組織で少人数SREが挑んだ1年 / SRE NEXT 2026
genda
0
510
AIに「使われる」時代のSaaS戦略 〜既存WebAPIのMCPサーバー化における開発ノウハウ〜
ekispert_api
0
300
Claude Codeとハーネスについて考えてみる
oikon48
18
8.8k
攻撃者がいなくてもAIエージェントはインシデントを起こす
nomizone
0
210
知見・人・API・DB・予算 ─ ナイナイ尽くしだった人事データ整備 with dbt、5年間の学び
ken6377
1
170
“全部コピーしない”ファイルデータの活用 : — FSx for ONTAP × S3 Tables × Icebergで作るメタデータカタログ
yoshiki0705
0
580
AI時代における最適なQA組織の作り方
ymty
3
470
End-to-Endで考える信頼性 — LINEアプリにおける クライアント開発×SRE連携の実践
maruloop
4
3.3k
Why is RC4 still being used?
tamaiyutaro
0
310
ローカルLLMとLINE Botの組み合わせ その3 / LINE DC Generative AI Meetup #8
you
PRO
0
130
Featured
See All Featured
Mozcon NYC 2025: Stop Losing SEO Traffic
samtorres
1
270
The MySQL Ecosystem @ GitHub 2015
samlambert
251
13k
Marketing to machines
jonoalderson
1
5.6k
The SEO identity crisis: Don't let AI make you average
varn
0
510
sira's awesome portfolio website redesign presentation
elsirapls
0
300
Are puppies a ranking factor?
jonoalderson
1
3.7k
GraphQLとの向き合い方2022年版
quramy
50
15k
Dominate Local Search Results - an insider guide to GBP, reviews, and Local SEO
greggifford
PRO
0
200
Making Projects Easy
brettharned
120
6.7k
A better future with KSS
kneath
240
18k
AI: The stuff that nobody shows you
jnunemaker
PRO
8
770
Build your cross-platform service in a week with App Engine
jlugia
234
18k
Transcript
Fixing performance & Memory problems @fglc2 / dressipi
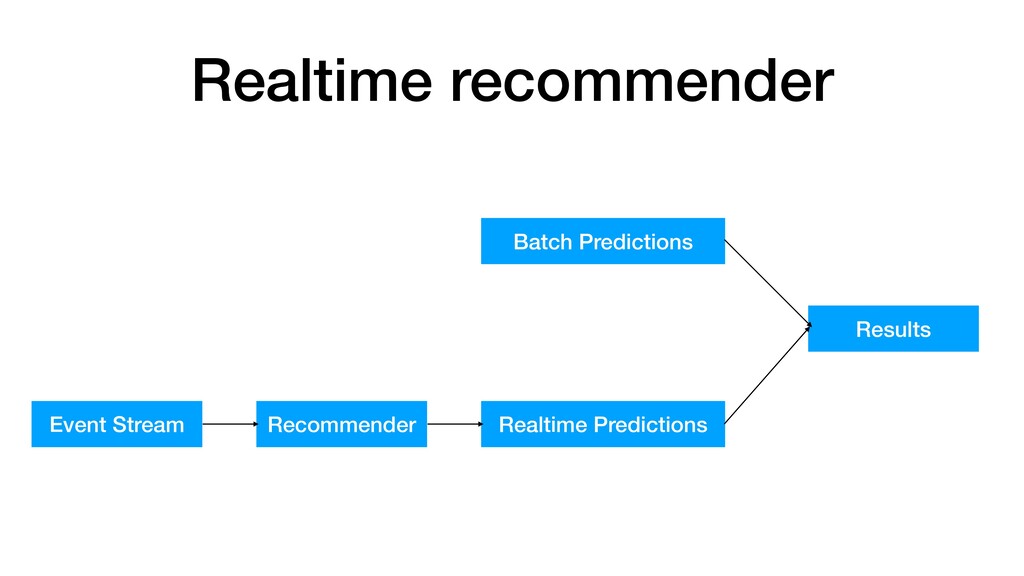
Part 1: The follow events happen in real-time
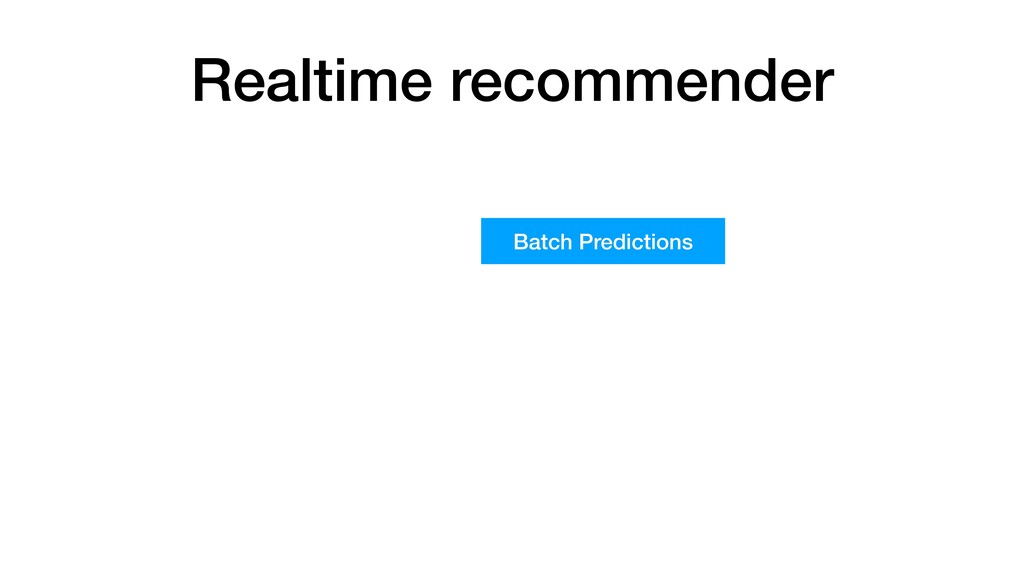
Realtime recommender
Realtime recommender Batch Predictions
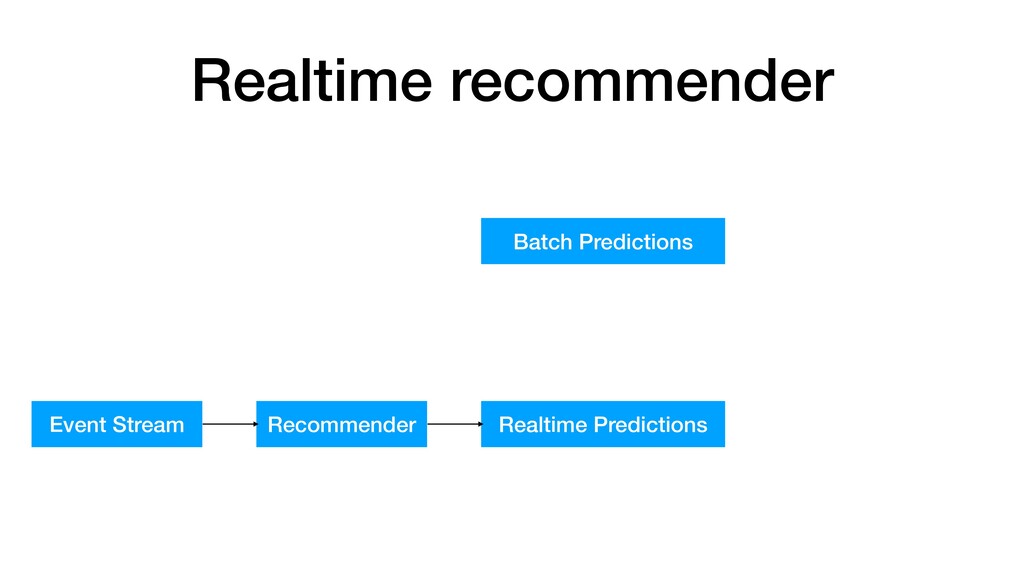
Realtime recommender Batch Predictions Event Stream Recommender Realtime Predictions
Realtime recommender Batch Predictions Event Stream Recommender Realtime Predictions Results
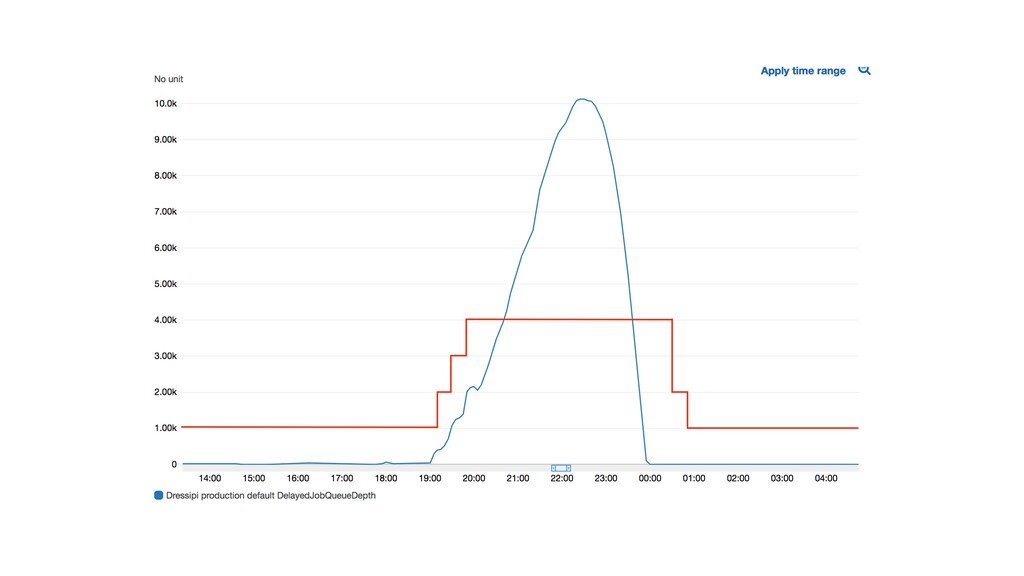
We deployed to production
None
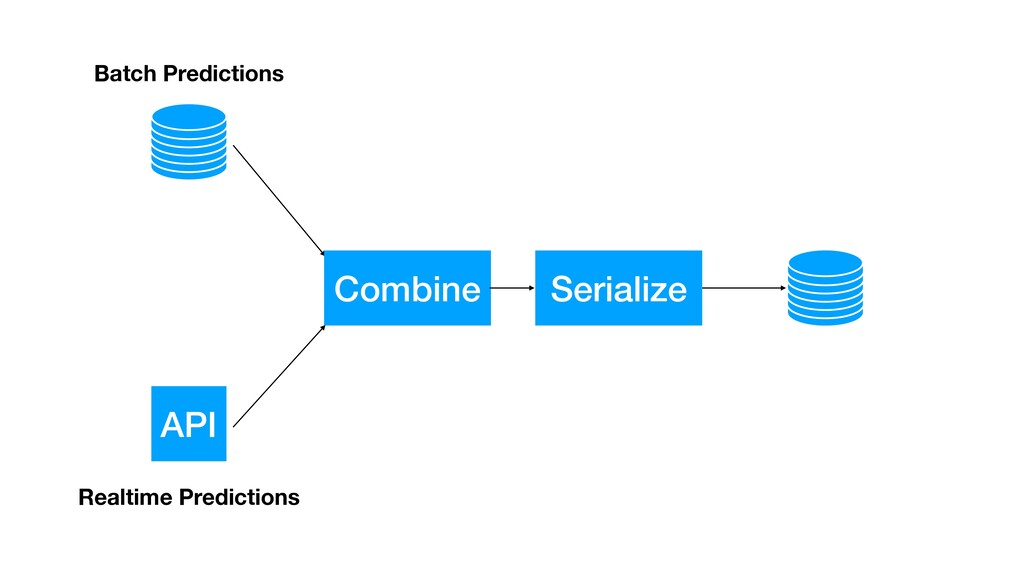
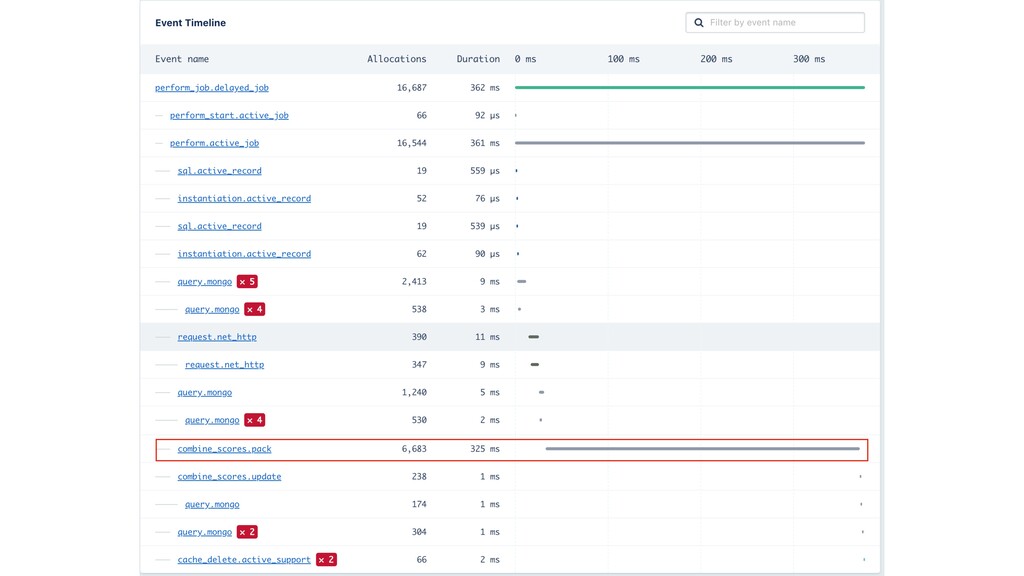
API Combine Serialize Batch Predictions Realtime Predictions
None
None
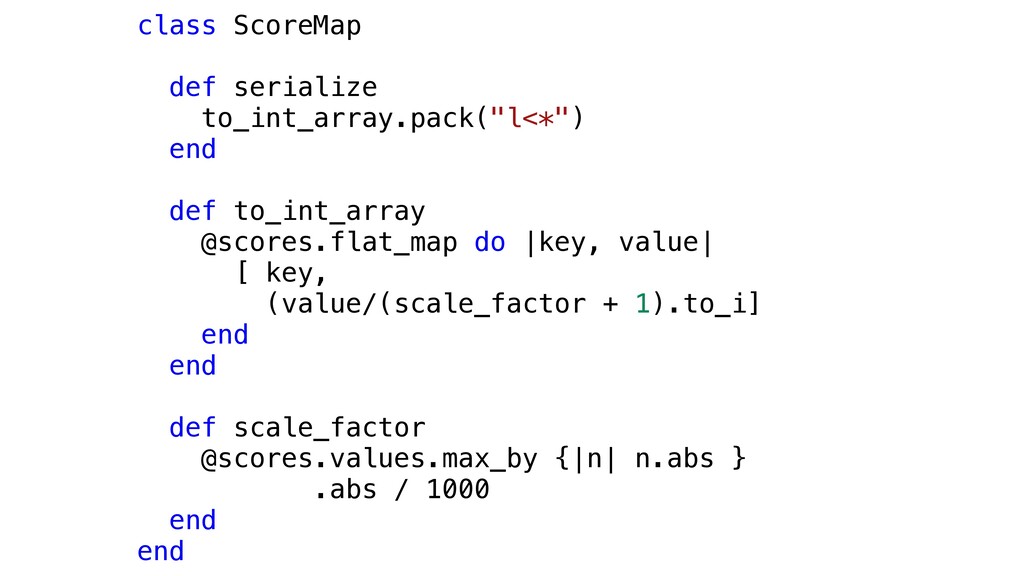
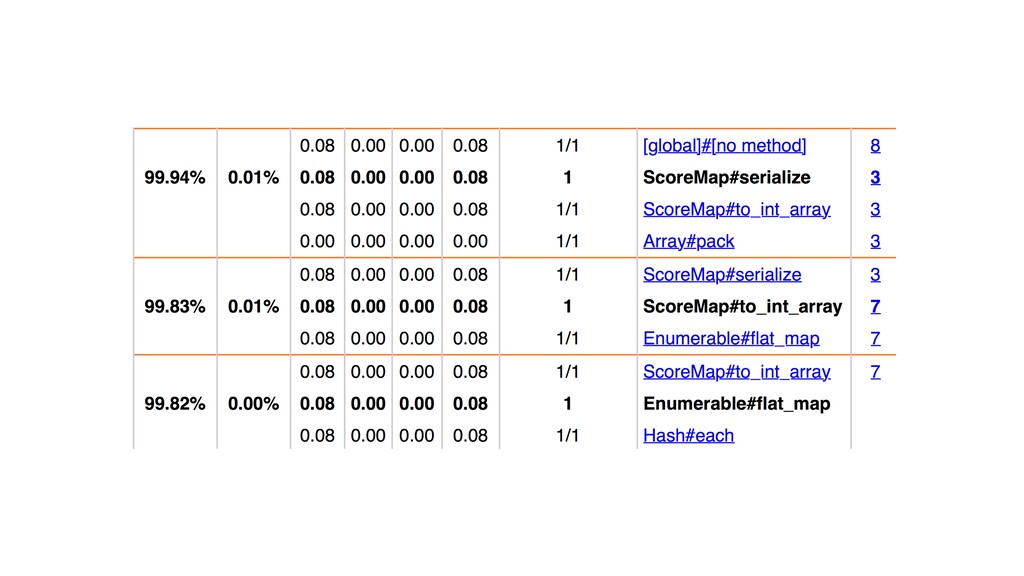
class ScoreMap def serialize to_int_array.pack("l<*") end def to_int_array @scores.flat_map do
|key, value| [ key, (value/(scale_factor + 1).to_i] end end def scale_factor @scores.values.max_by {|n| n.abs } .abs / 1000 end end
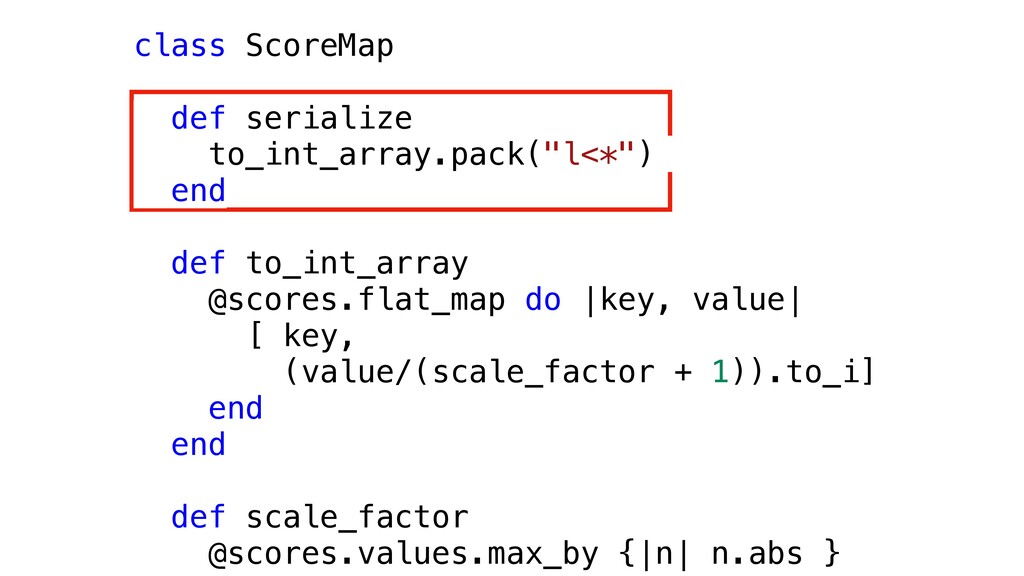
class ScoreMap def serialize to_int_array.pack("l<*") end def to_int_array @scores.flat_map do
|key, value| [ key, (value/(scale_factor + 1)).to_i] end end def scale_factor @scores.values.max_by {|n| n.abs }
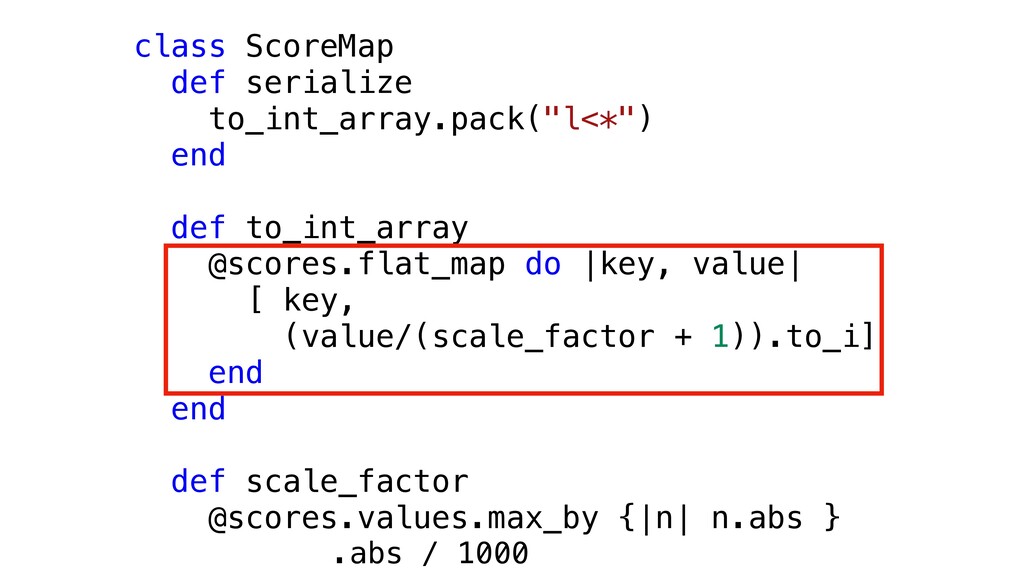
class ScoreMap def serialize to_int_array.pack("l<*") end def to_int_array @scores.flat_map do
|key, value| [ key, (value/(scale_factor + 1)).to_i] end end def scale_factor @scores.values.max_by {|n| n.abs } .abs / 1000
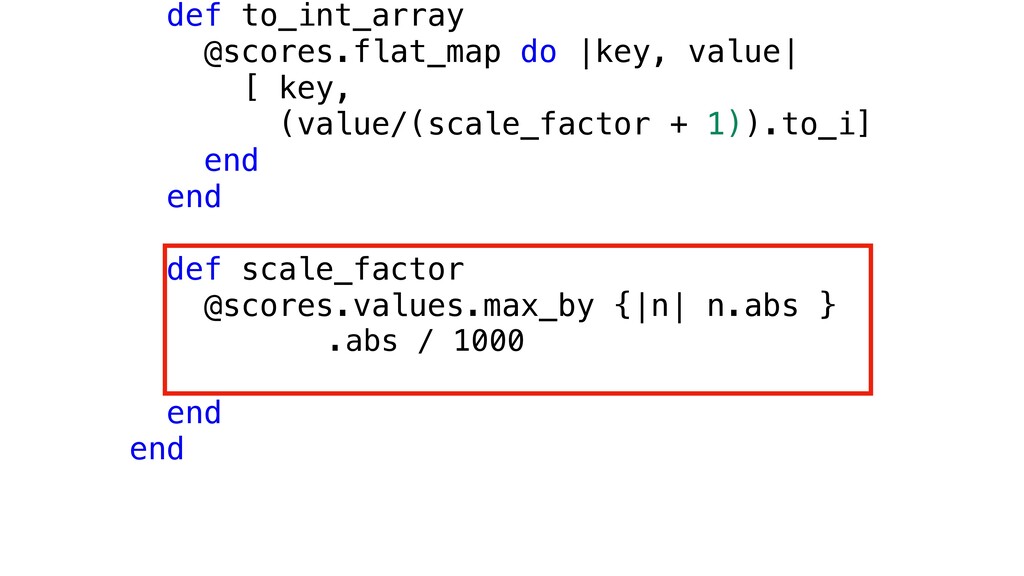
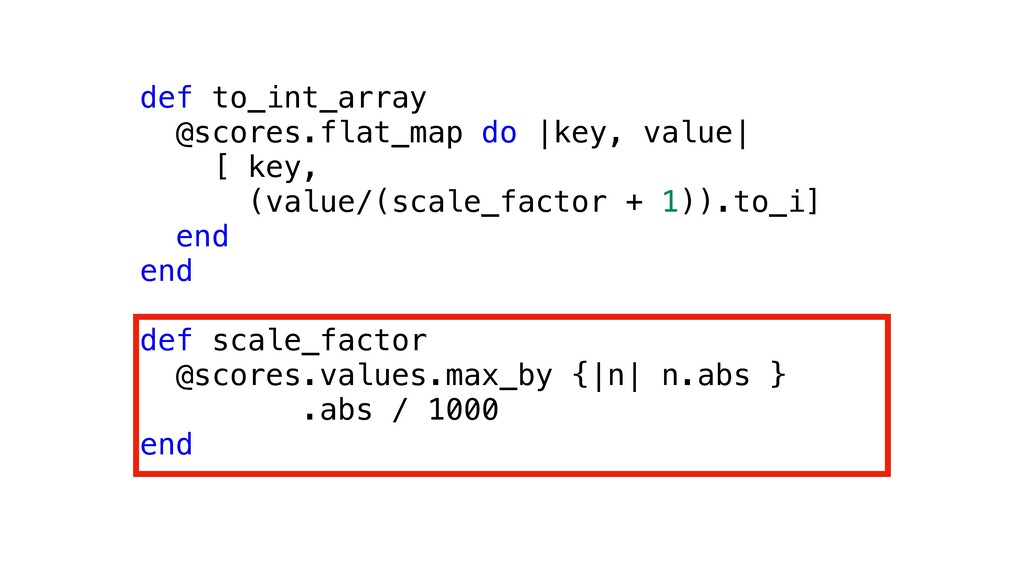
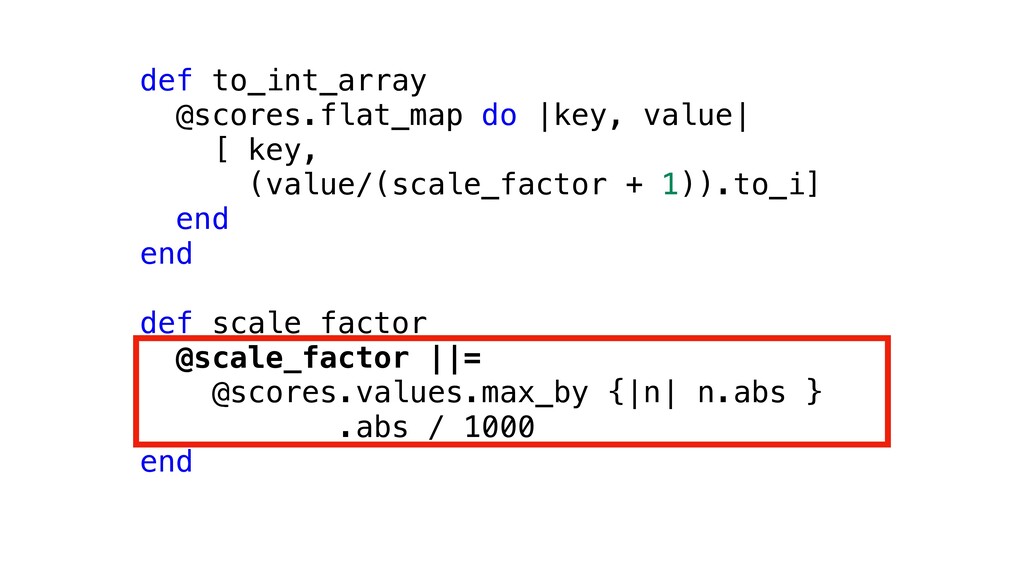
def to_int_array @scores.flat_map do |key, value| [ key, (value/(scale_factor +
1)).to_i] end end def scale_factor @scores.values.max_by {|n| n.abs } .abs / 1000 end end
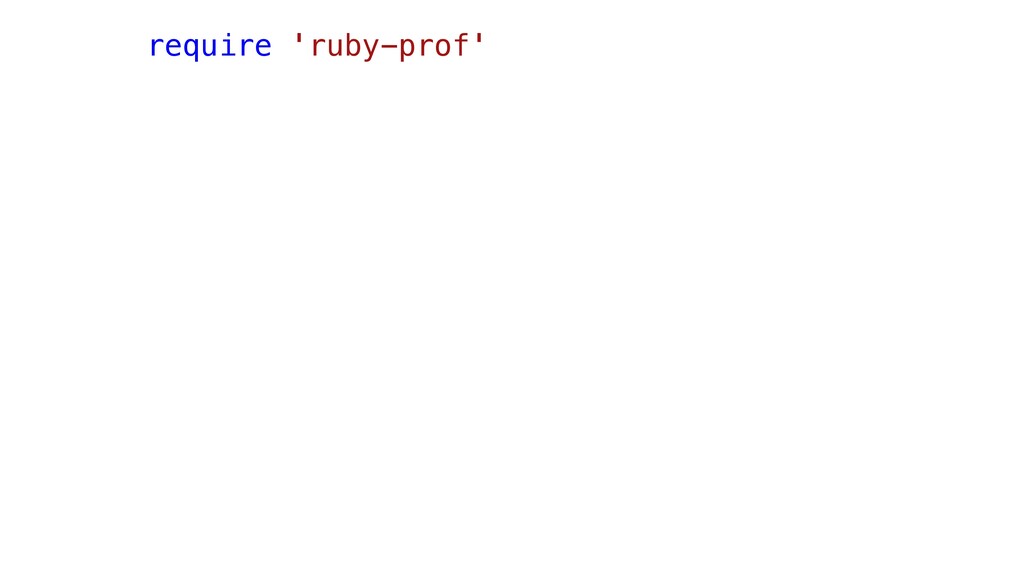
Ruby-Prof is a profiler • Records behaviour of your code
• Produces reports on where your code spends time • Use to analyse problems not detect them
None
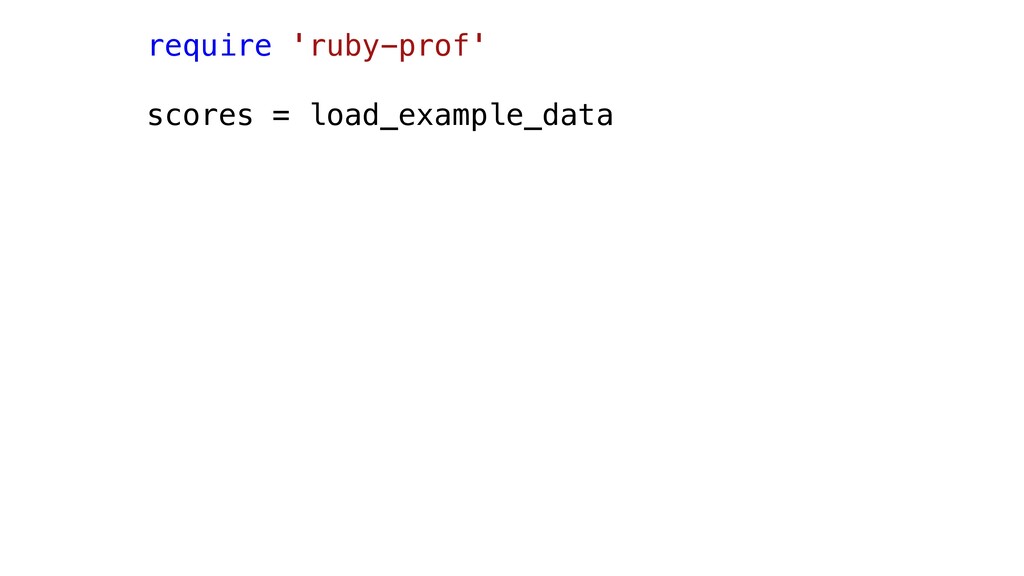
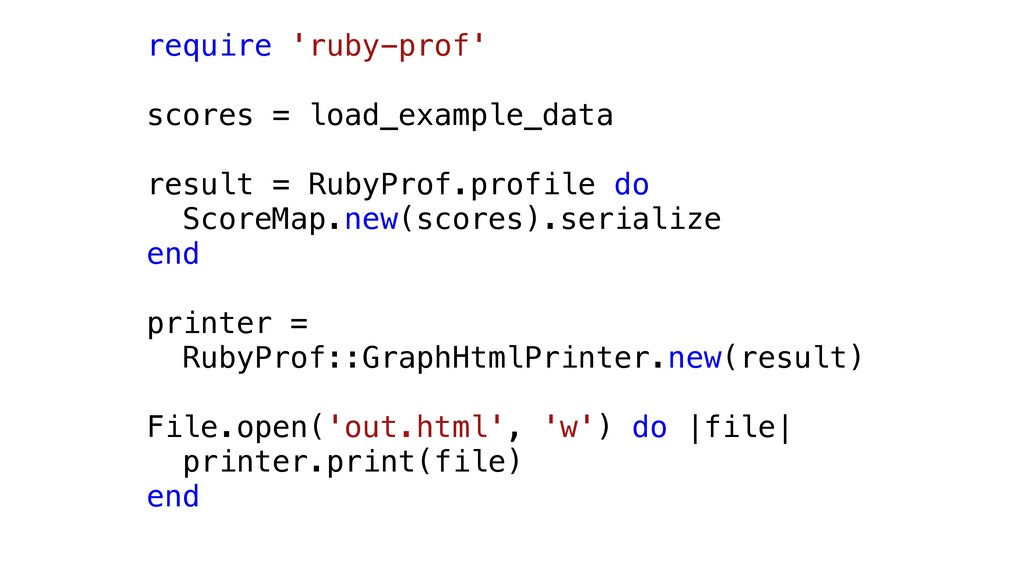
require 'ruby-prof'
require 'ruby-prof' scores = load_example_data
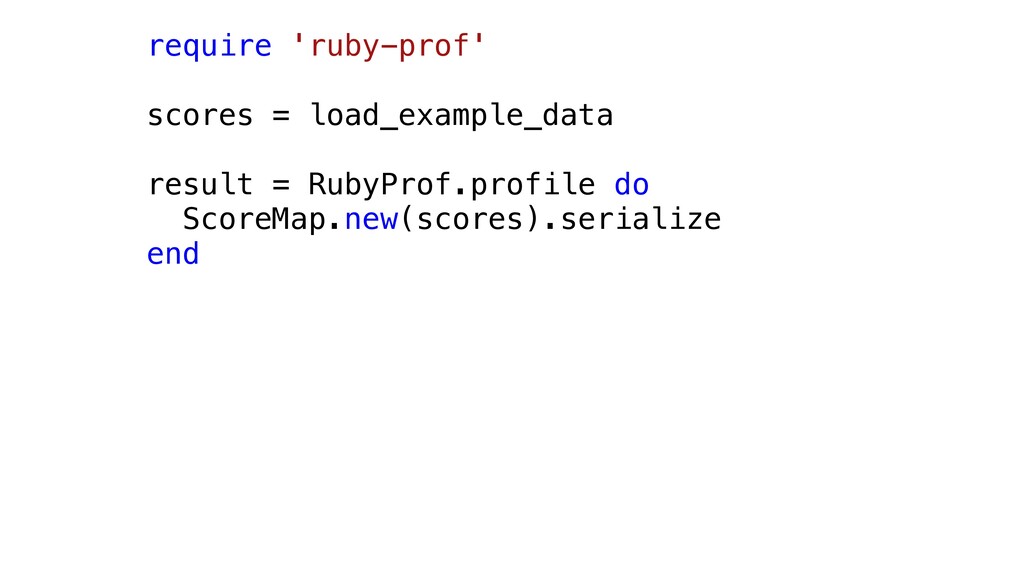
require 'ruby-prof' scores = load_example_data result = RubyProf.profile do ScoreMap.new(scores).serialize
end
require 'ruby-prof' scores = load_example_data result = RubyProf.profile do ScoreMap.new(scores).serialize
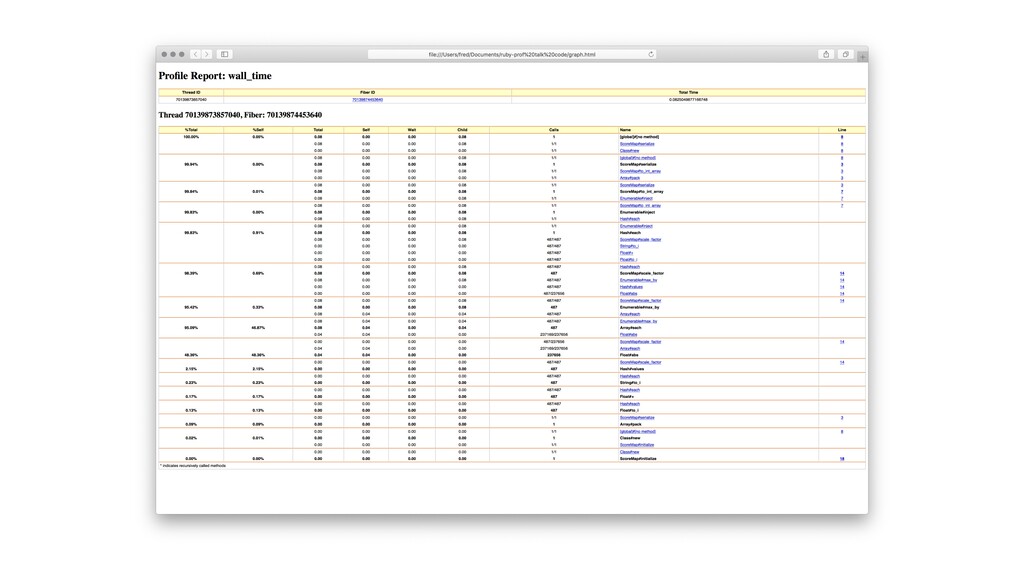
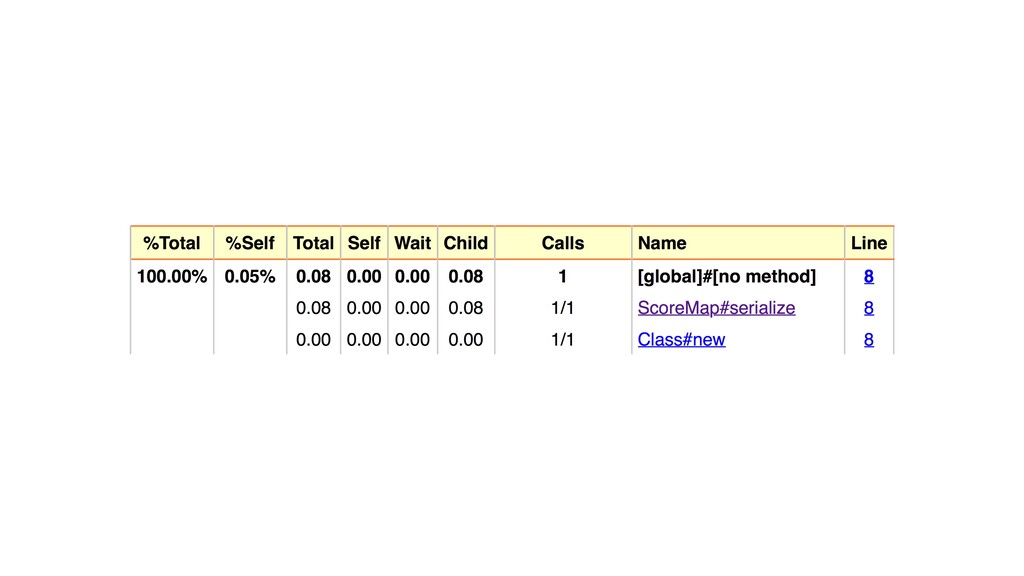
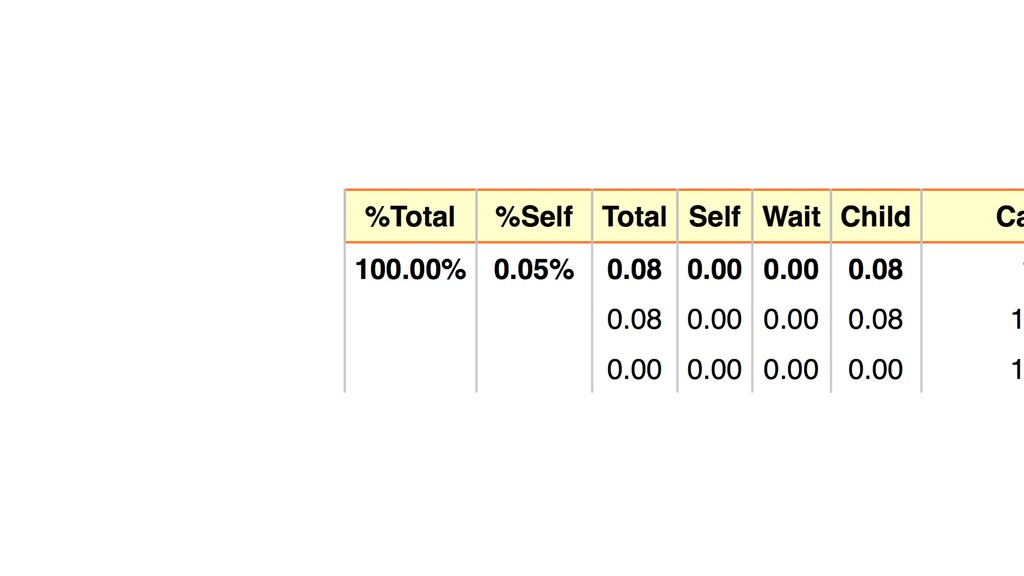
end printer = RubyProf::GraphHtmlPrinter.new(result) File.open('out.html', 'w') do |file| printer.print(file) end
None
None
None
None
None
None
None
def to_int_array @scores.flat_map do |key, value| [ key, (value/(scale_factor +
1)).to_i] end end def scale_factor @scores.values.max_by {|n| n.abs } .abs / 1000 end
def to_int_array @scores.flat_map do |key, value| [ key, (value/(scale_factor +
1)).to_i] end end def scale_factor @scale_factor ||= @scores.values.max_by {|n| n.abs } .abs / 1000 end
None
Slows down your code
Can distort things
ruby-prof is exact
Sampling profilers
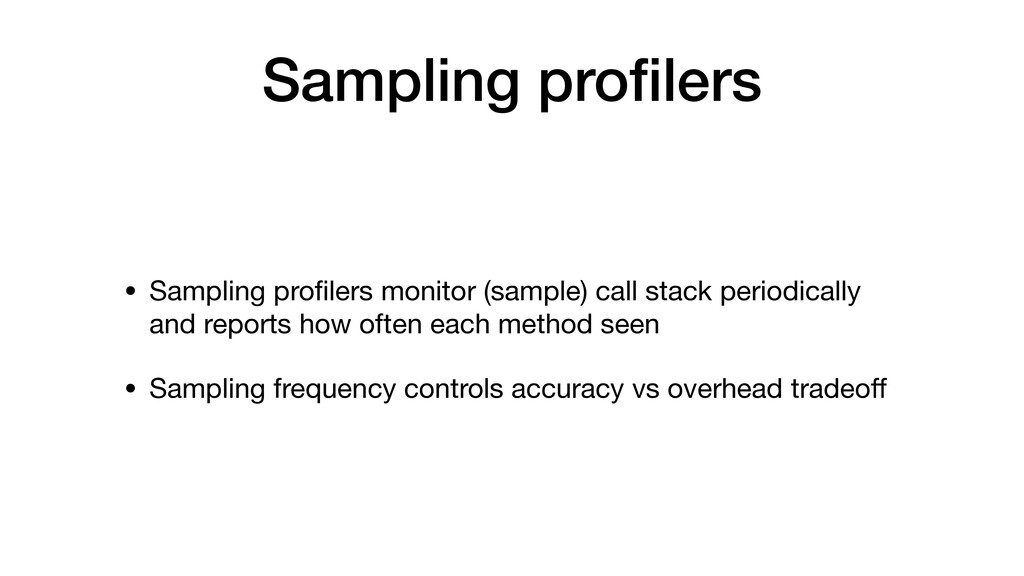
Sampling profilers • Sampling profilers monitor (sample) call stack periodically
and reports how often each method seen
Sampling profilers • Sampling profilers monitor (sample) call stack periodically
and reports how often each method seen • Sampling frequency controls accuracy vs overhead tradeoff
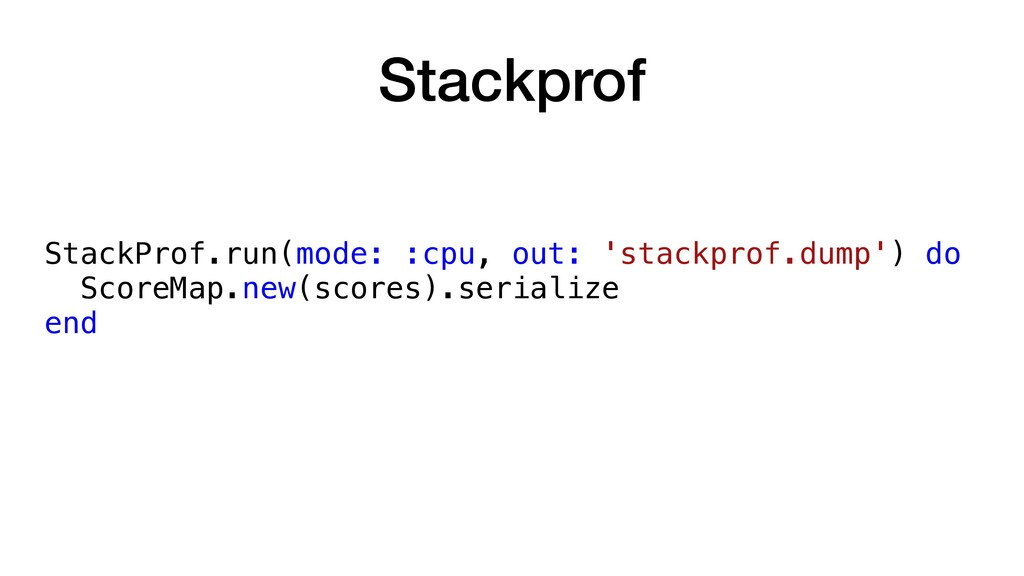
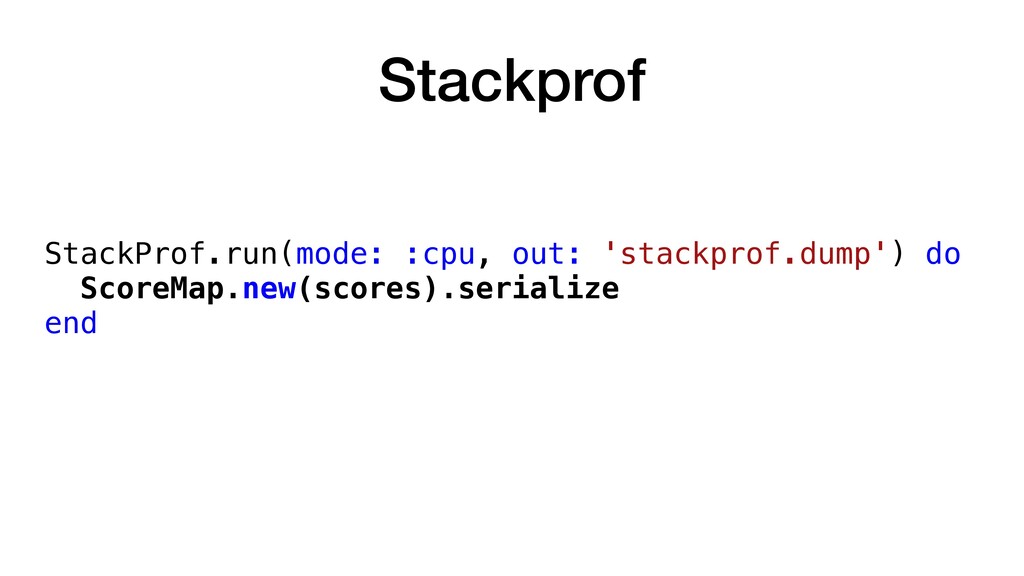
Stackprof StackProf.run(mode: :cpu, out: 'stackprof.dump') do ScoreMap.new(scores).serialize end
Stackprof StackProf.run(mode: :cpu, out: 'stackprof.dump') do ScoreMap.new(scores).serialize end
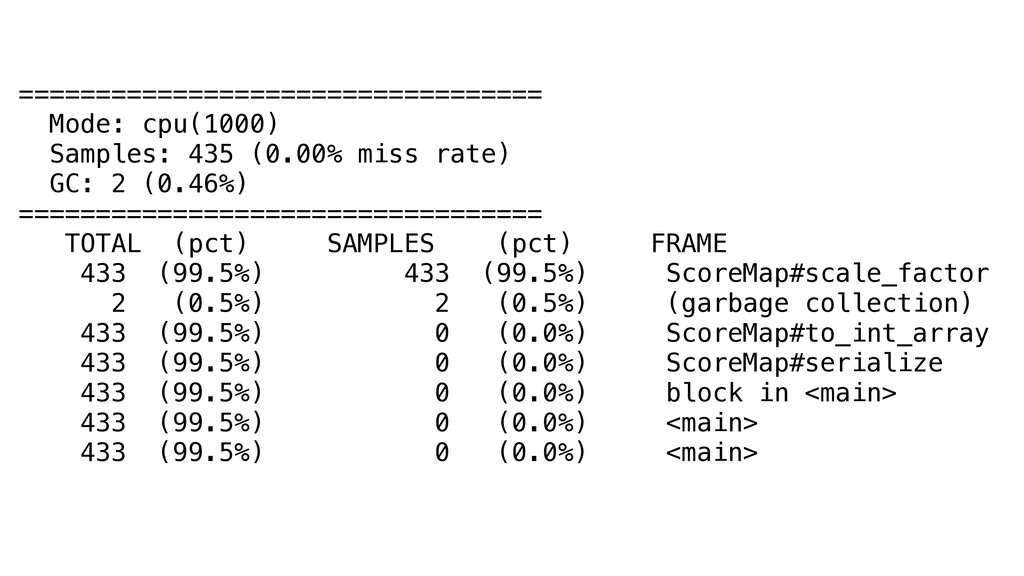
================================== Mode: cpu(1000) Samples: 435 (0.00% miss rate) GC: 2
(0.46%) ================================== TOTAL (pct) SAMPLES (pct) FRAME 433 (99.5%) 433 (99.5%) ScoreMap#scale_factor 2 (0.5%) 2 (0.5%) (garbage collection) 433 (99.5%) 0 (0.0%) ScoreMap#to_int_array 433 (99.5%) 0 (0.0%) ScoreMap#serialize 433 (99.5%) 0 (0.0%) block in <main> 433 (99.5%) 0 (0.0%) <main> 433 (99.5%) 0 (0.0%) <main>
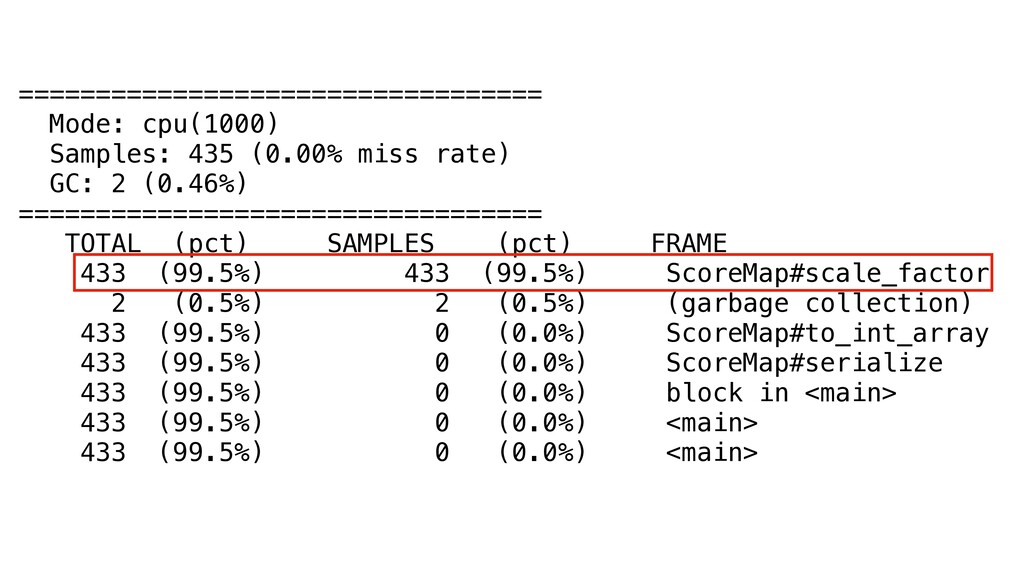
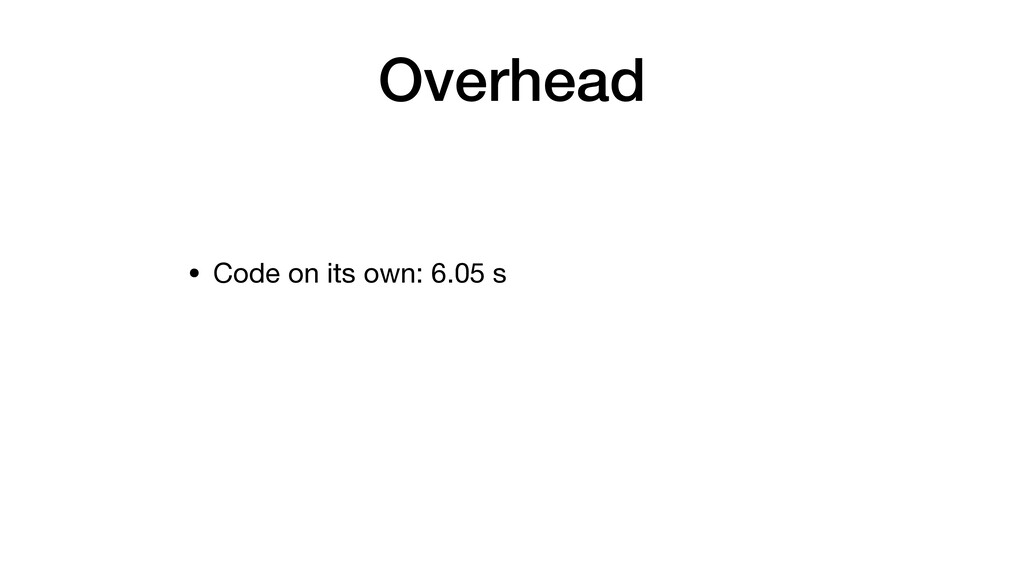
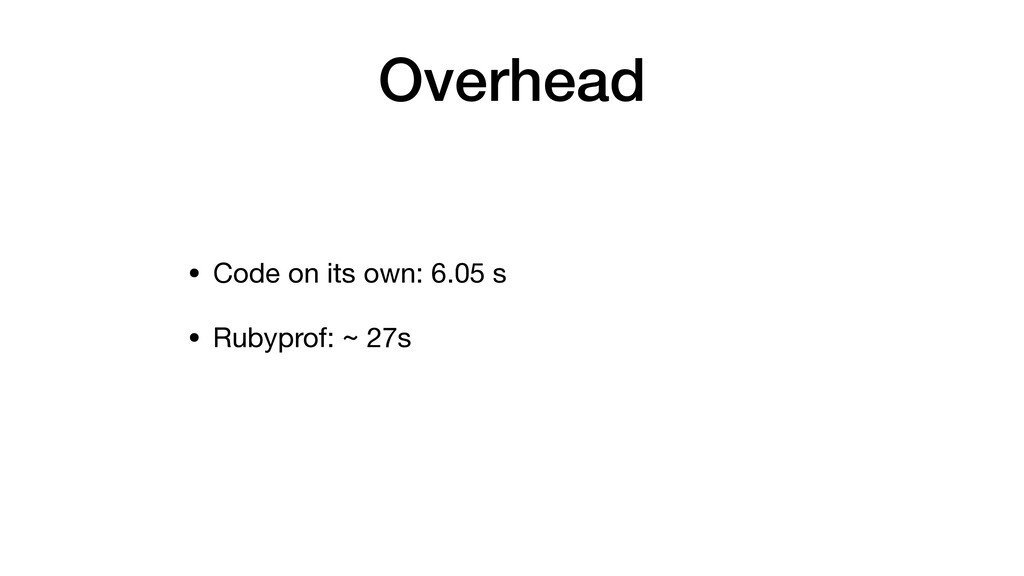
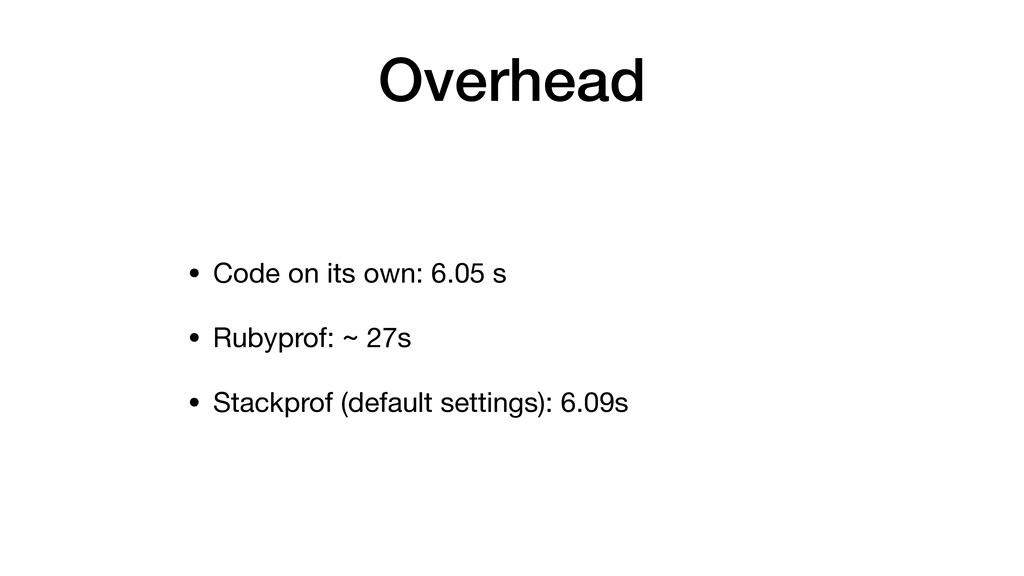
Overhead
Overhead • Code on its own: 6.05 s
Overhead • Code on its own: 6.05 s • Rubyprof:
~ 27s
Overhead • Code on its own: 6.05 s • Rubyprof:
~ 27s • Stackprof (default settings): 6.09s
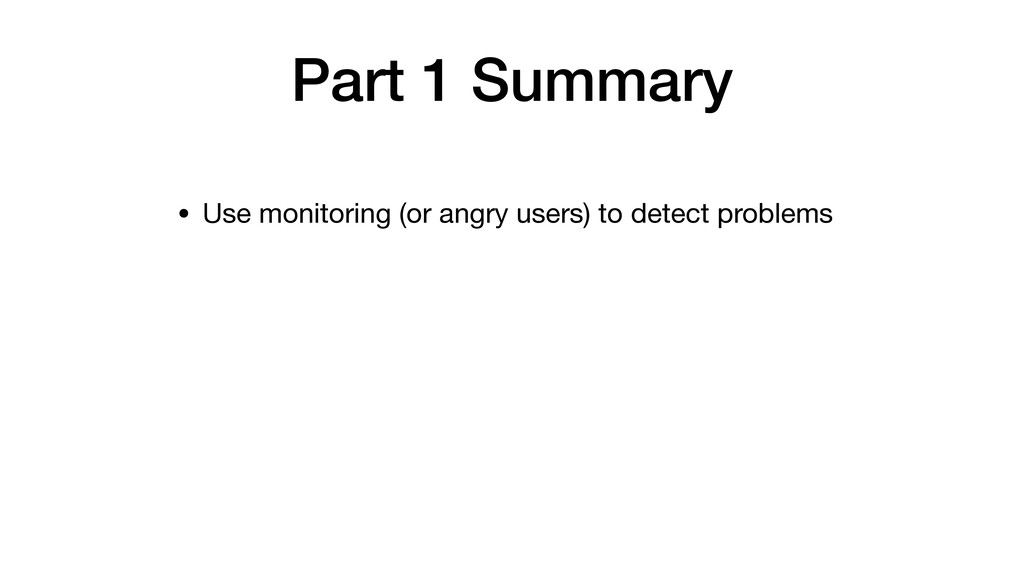
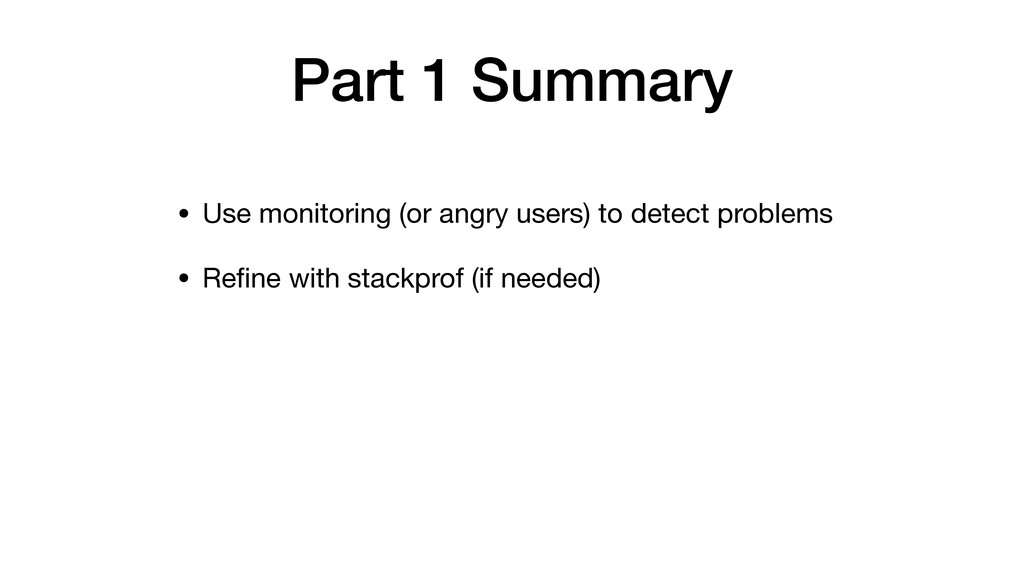
Part 1 Summary
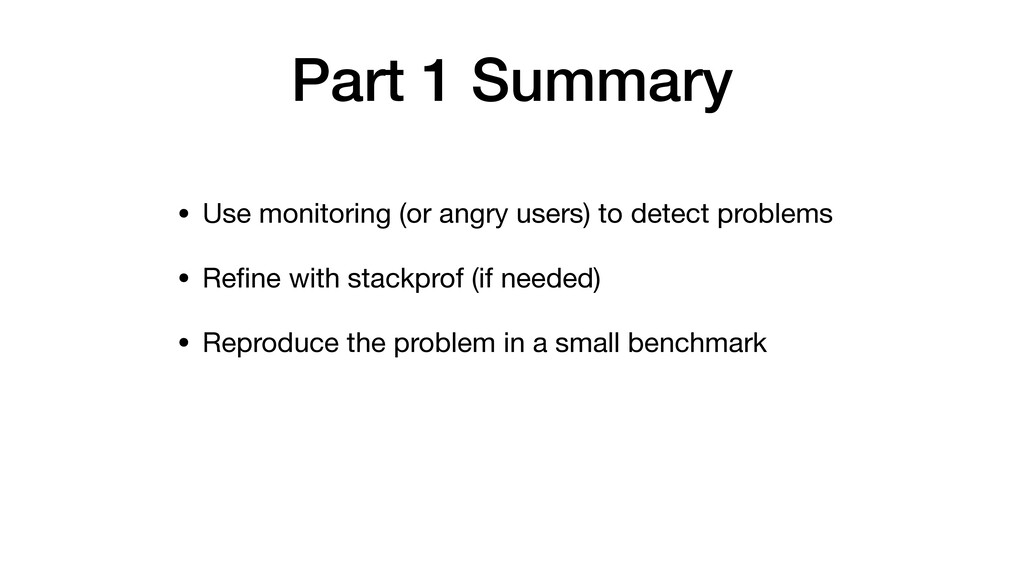
Part 1 Summary • Use monitoring (or angry users) to
detect problems
Part 1 Summary • Use monitoring (or angry users) to
detect problems • Refine with stackprof (if needed)
Part 1 Summary • Use monitoring (or angry users) to
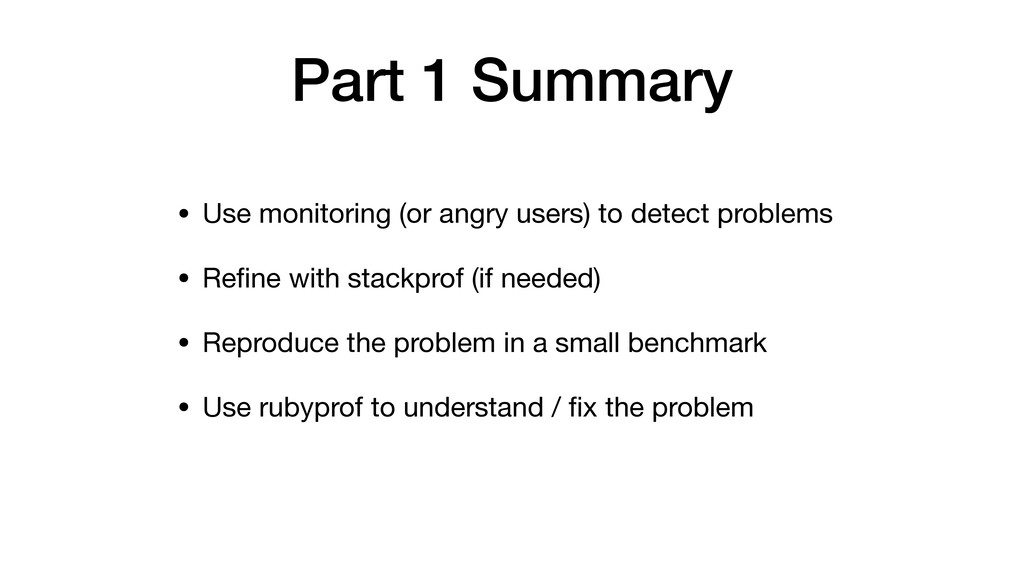
detect problems • Refine with stackprof (if needed) • Reproduce the problem in a small benchmark
Part 1 Summary • Use monitoring (or angry users) to
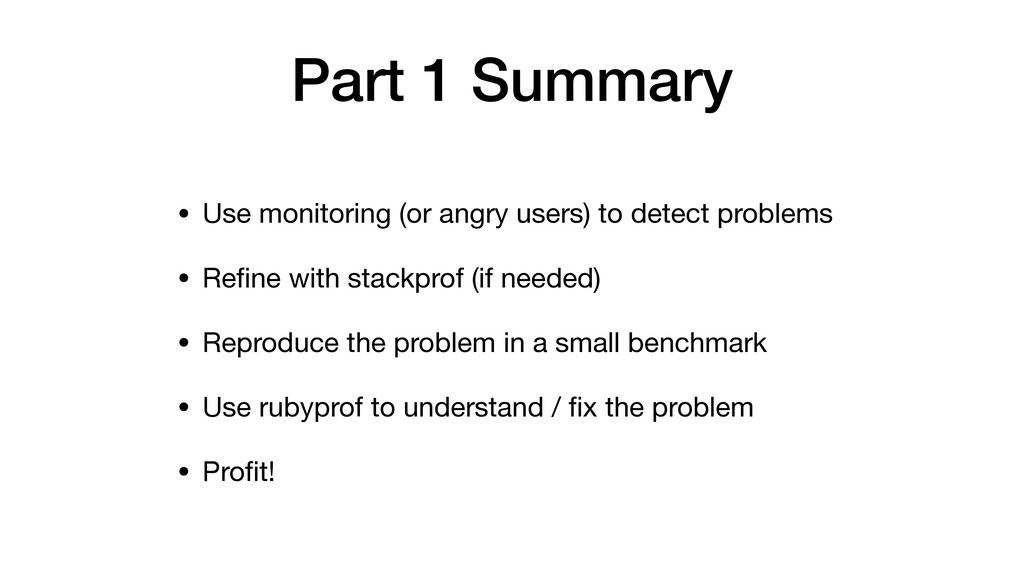
detect problems • Refine with stackprof (if needed) • Reproduce the problem in a small benchmark • Use rubyprof to understand / fix the problem
Part 1 Summary • Use monitoring (or angry users) to
detect problems • Refine with stackprof (if needed) • Reproduce the problem in a small benchmark • Use rubyprof to understand / fix the problem • Profit!
Part 2: Memory
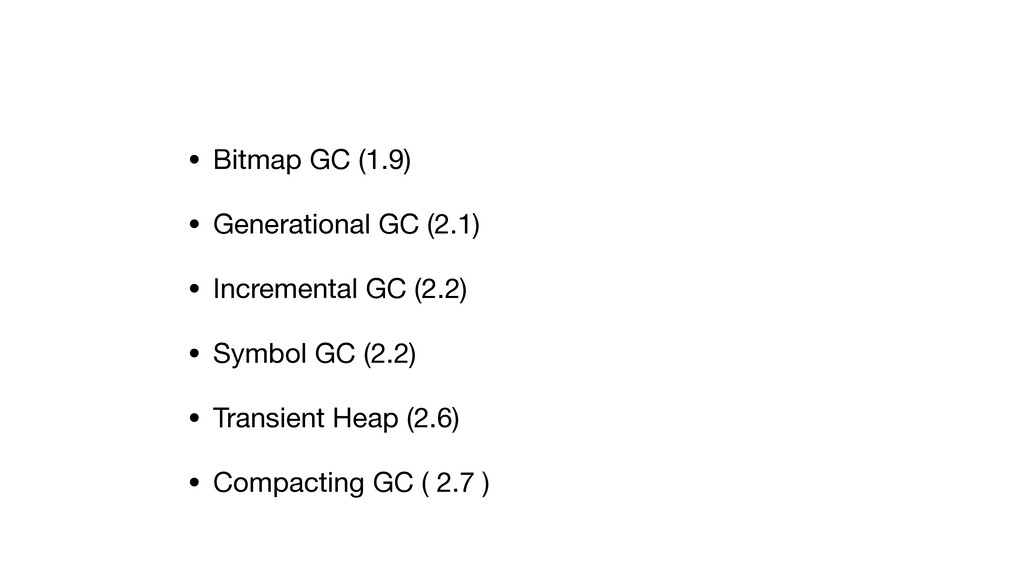
• Bitmap GC (1.9) • Generational GC (2.1) • Incremental
GC (2.2) • Symbol GC (2.2) • Transient Heap (2.6) • Compacting GC ( 2.7 )
You still have to worry about memory
NoMemoryError: failed to allocate
None
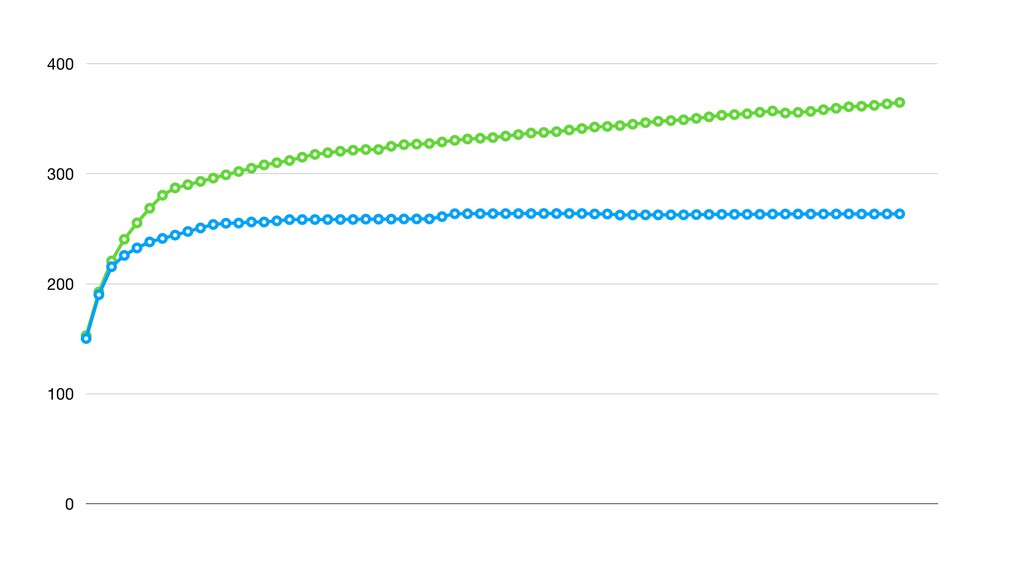
0 100 200 300 400
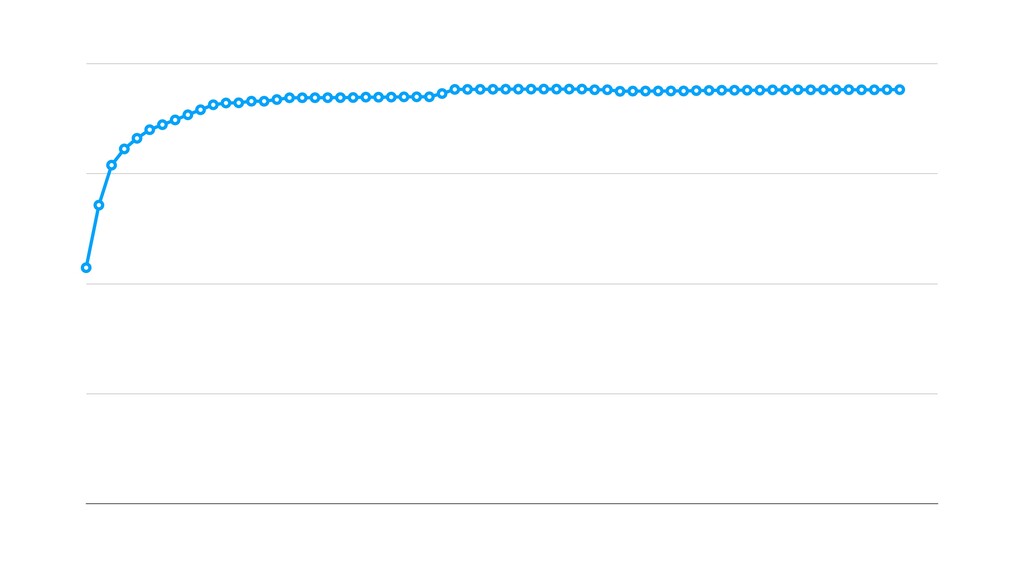
Memory leak
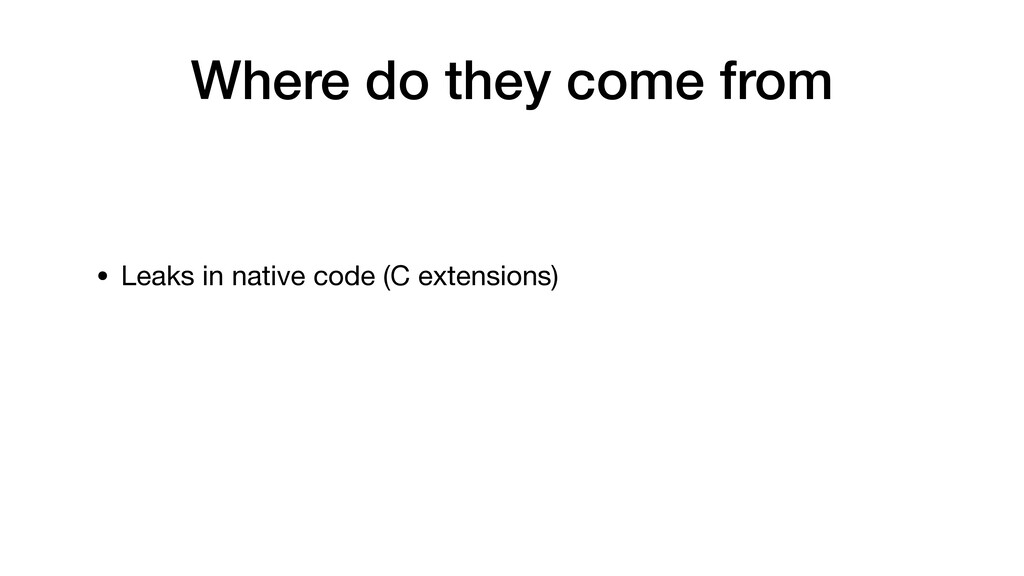
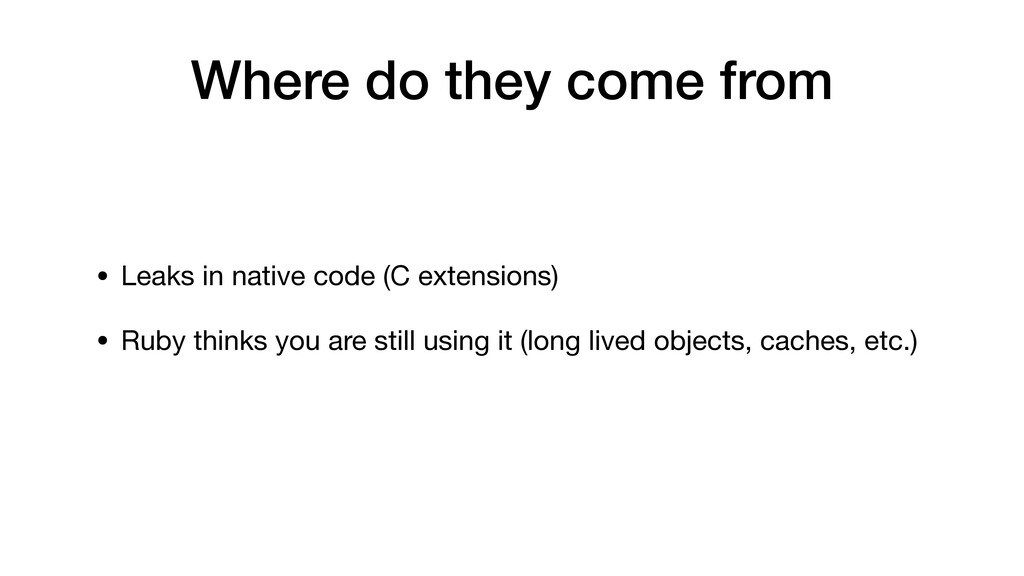
Where do they come from
Where do they come from • Leaks in native code
(C extensions)
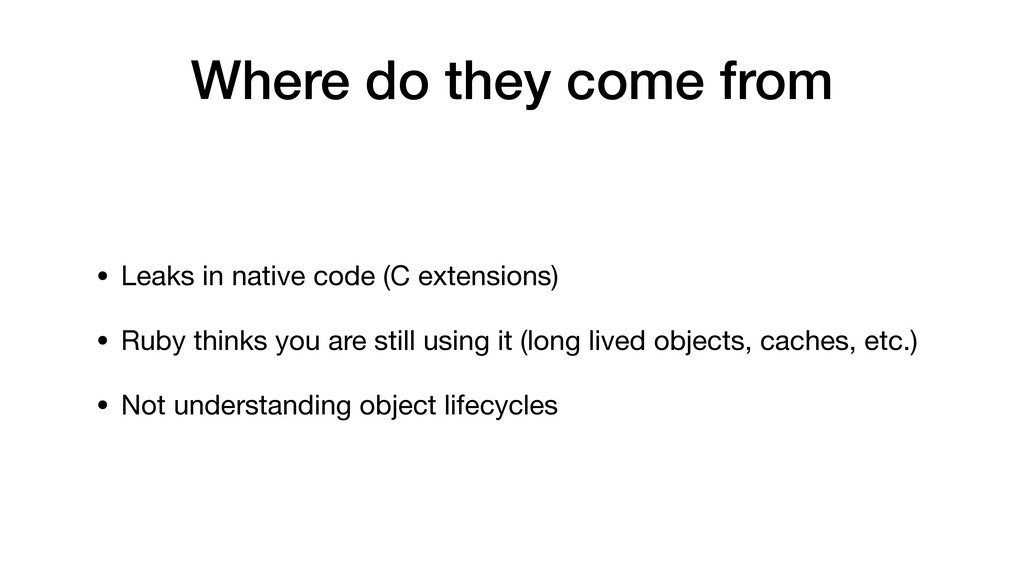
Where do they come from • Leaks in native code
(C extensions) • Ruby thinks you are still using it (long lived objects, caches, etc.)
Where do they come from • Leaks in native code
(C extensions) • Ruby thinks you are still using it (long lived objects, caches, etc.) • Not understanding object lifecycles
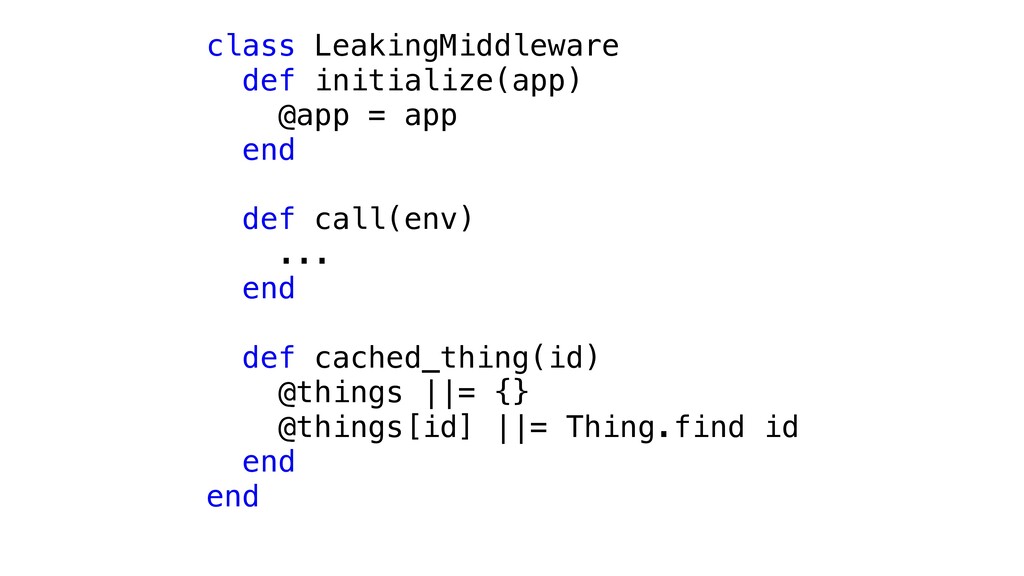
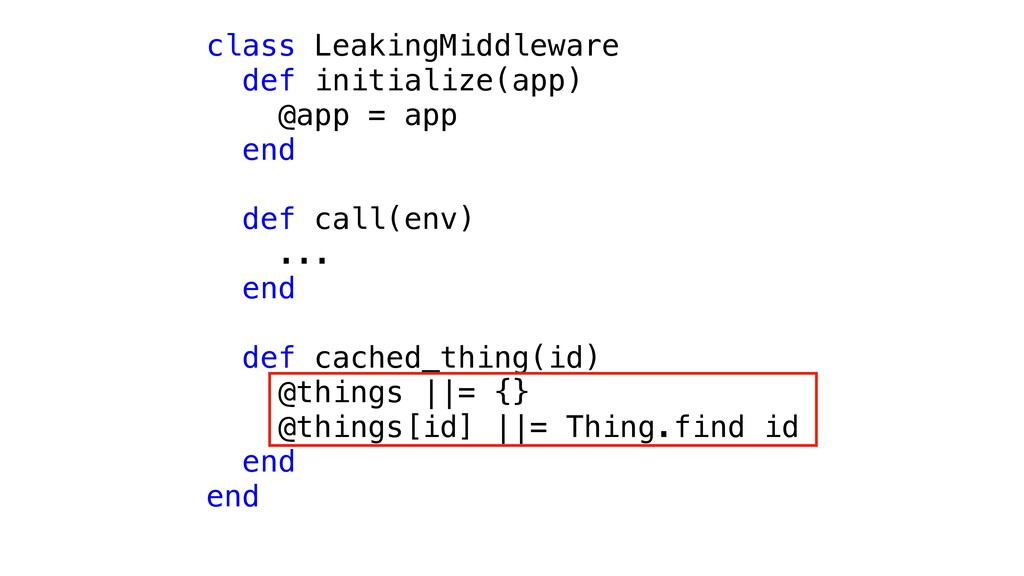
class LeakingMiddleware def initialize(app) @app = app end def call(env)
... end def cached_thing(id) @things ||= {} @things[id] ||= Thing.find id end end
class LeakingMiddleware def initialize(app) @app = app end def call(env)
... end def cached_thing(id) @things ||= {} @things[id] ||= Thing.find id end end
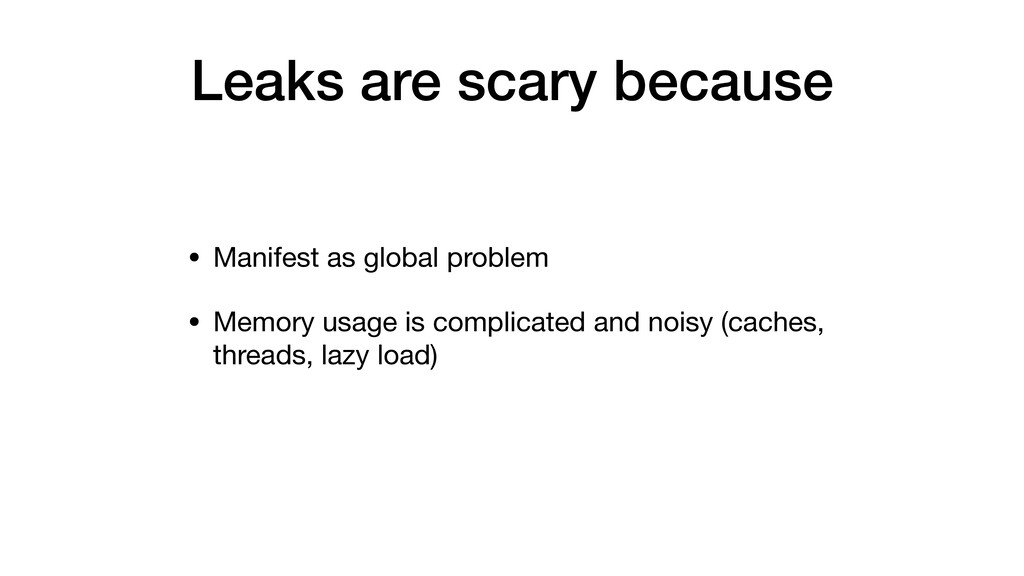
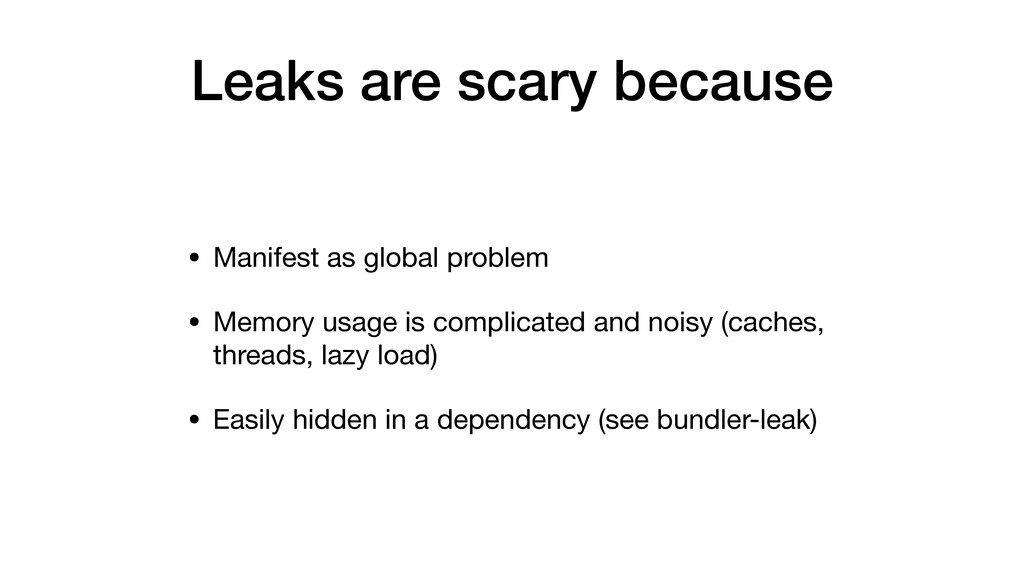
Leaks are scary because
Leaks are scary because • Manifest as global problem
Leaks are scary because • Manifest as global problem •
Memory usage is complicated and noisy (caches, threads, lazy load)
Leaks are scary because • Manifest as global problem •
Memory usage is complicated and noisy (caches, threads, lazy load) • Easily hidden in a dependency (see bundler-leak)
Back to the problem
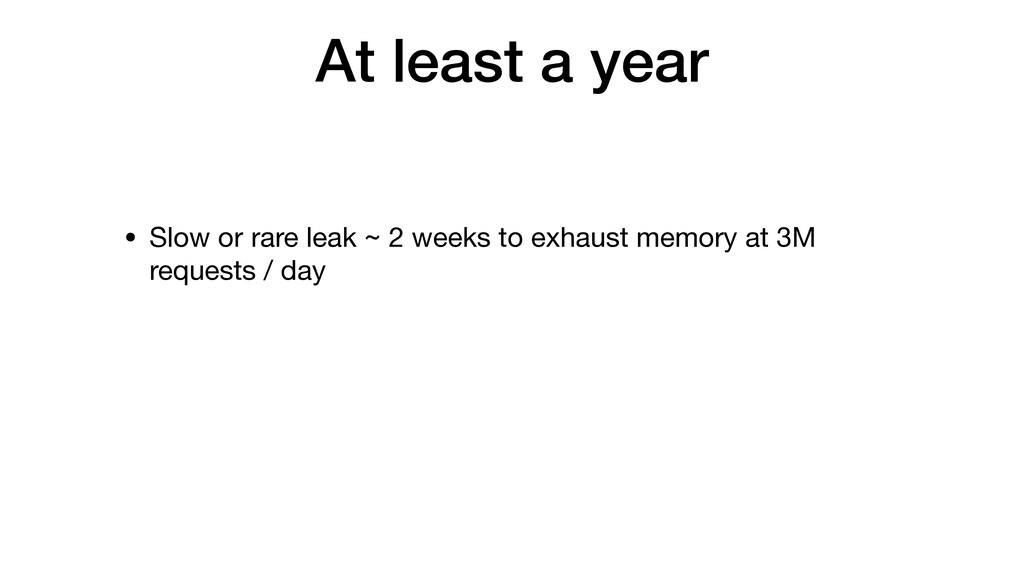
At least a year
At least a year • Slow or rare leak ~
2 weeks to exhaust memory at 3M requests / day
At least a year • Slow or rare leak ~
2 weeks to exhaust memory at 3M requests / day • App usually restarted often enough (deploys, autoscaling)
At least a year • Slow or rare leak ~
2 weeks to exhaust memory at 3M requests / day • App usually restarted often enough (deploys, autoscaling) • Failed instances automatically detected as unhealthy and replaced
None
But seriously
I couldn't reproduce the leak
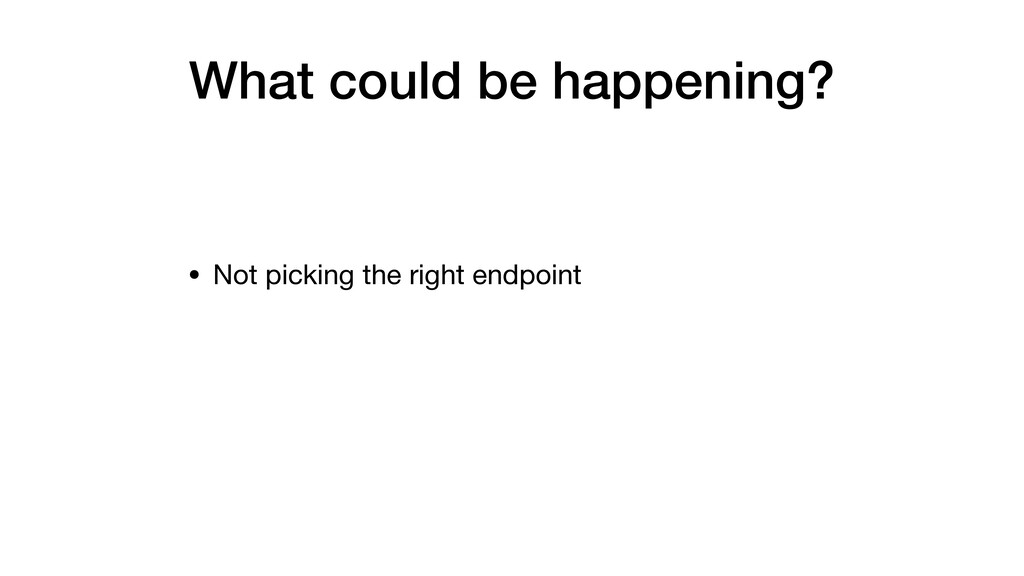
What could be happening?
What could be happening? • Not picking the right endpoint
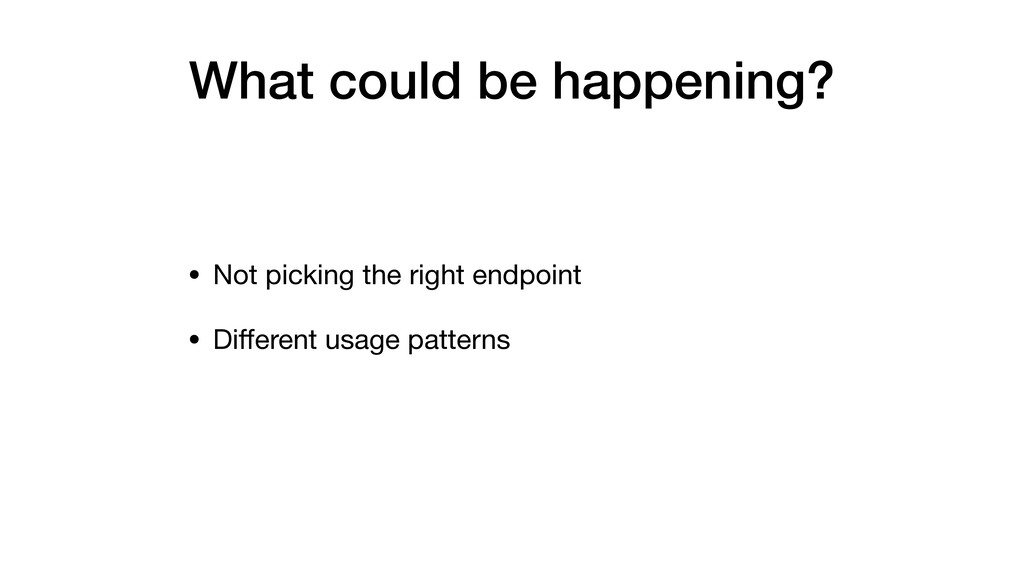
What could be happening? • Not picking the right endpoint
• Different usage patterns
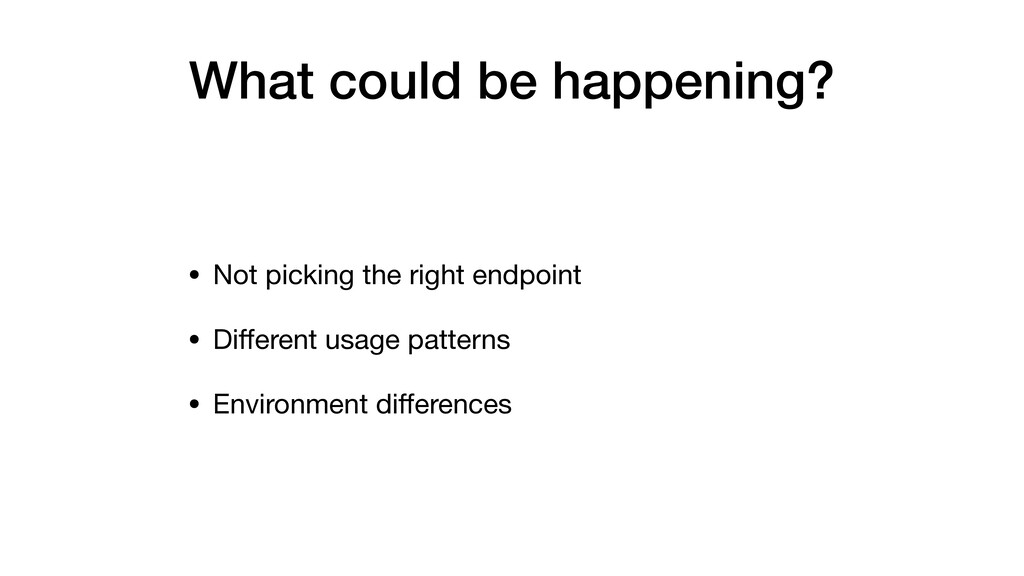
What could be happening? • Not picking the right endpoint
• Different usage patterns • Environment differences
Debugging in production
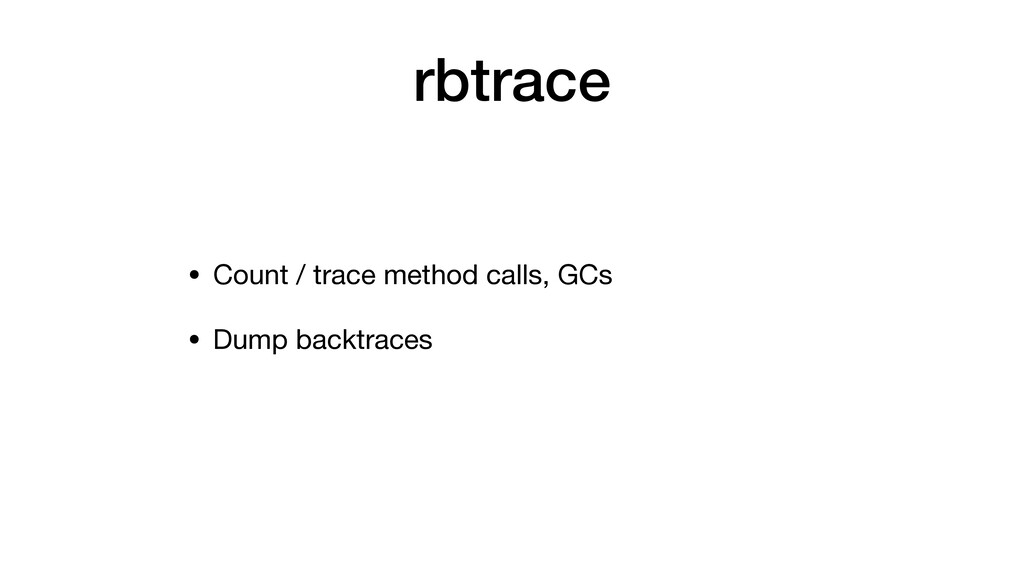
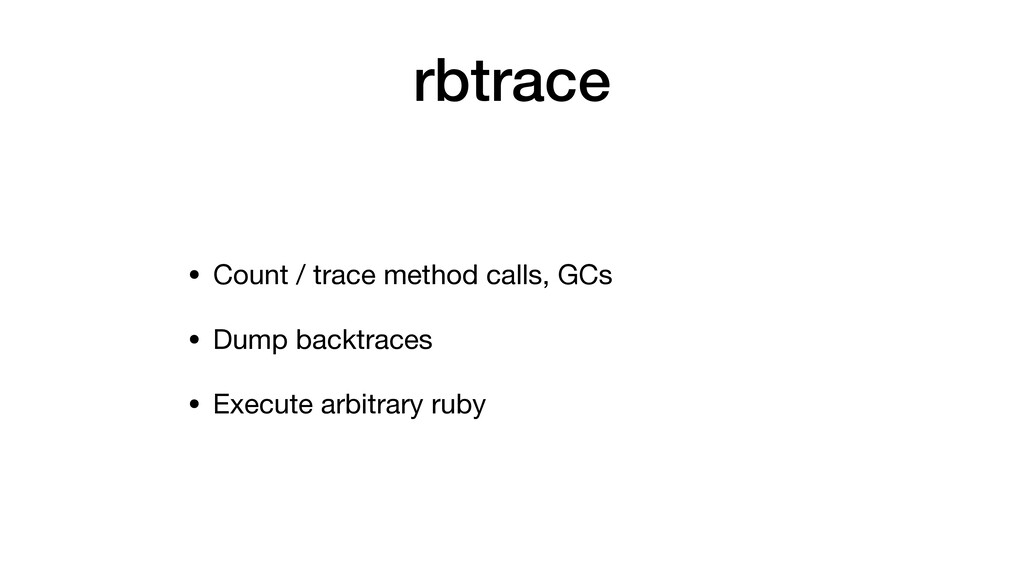
rbtrace
rbtrace • Count / trace method calls, GCs
rbtrace • Count / trace method calls, GCs • Dump
backtraces
rbtrace • Count / trace method calls, GCs • Dump
backtraces • Execute arbitrary ruby
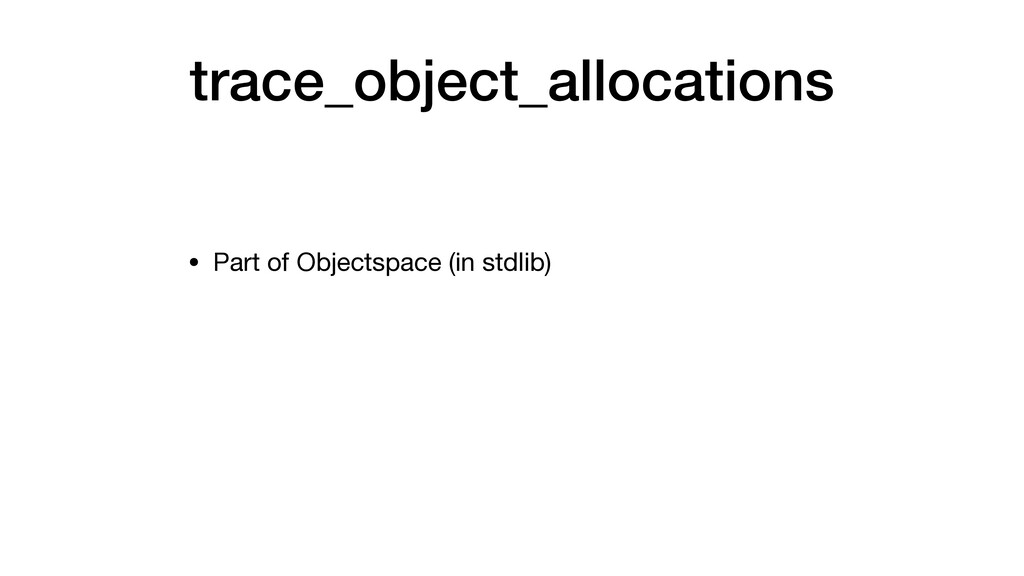
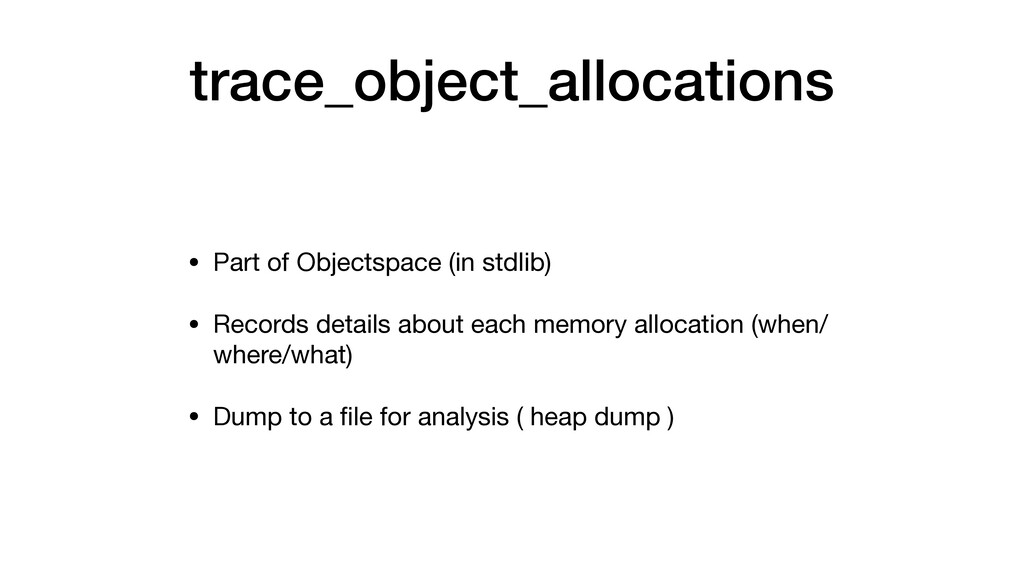
trace_object_allocations
trace_object_allocations • Part of Objectspace (in stdlib)
trace_object_allocations • Part of Objectspace (in stdlib) • Records details
about each memory allocation (when/ where/what)
trace_object_allocations • Part of Objectspace (in stdlib) • Records details
about each memory allocation (when/ where/what) • Dump to a file for analysis ( heap dump )
Note that this feature introduces a huge performance decrease and
huge memory consumption.
The plan
The plan • Only work on one instance
The plan • Only work on one instance • Use
rbtrace to dump heap from single rails process
The plan • Only work on one instance • Use
rbtrace to dump heap from single rails process • Analyse heap dump offline
I had to google this!
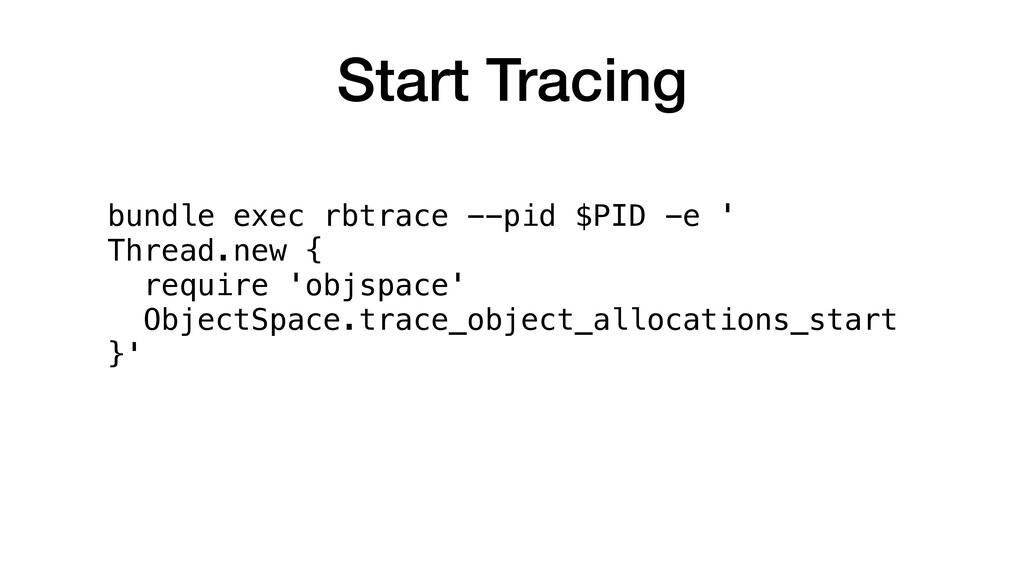
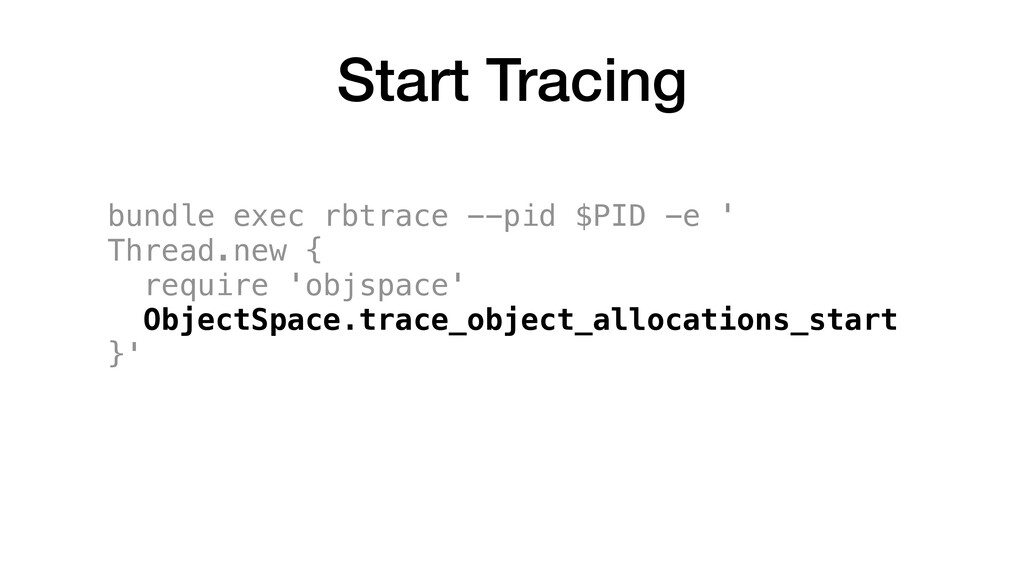
bundle exec rbtrace --pid $PID -e ' Thread.new { require
'objspace' ObjectSpace.trace_object_allocations_start }' Start Tracing
bundle exec rbtrace --pid $PID -e ' Thread.new { require
'objspace' ObjectSpace.trace_object_allocations_start }' Start Tracing
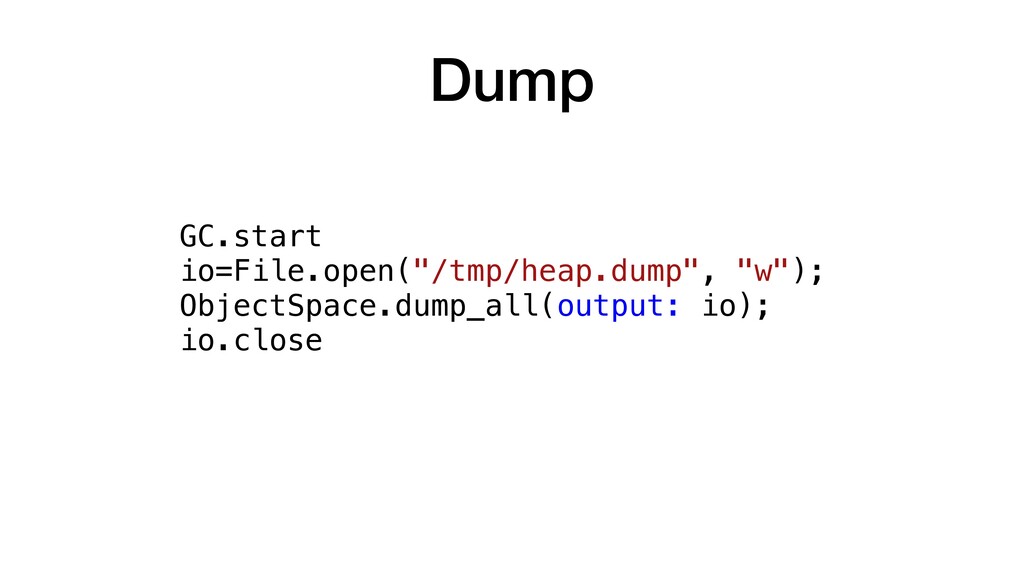
Dump GC.start io=File.open("/tmp/heap.dump", "w"); ObjectSpace.dump_all(output: io); io.close
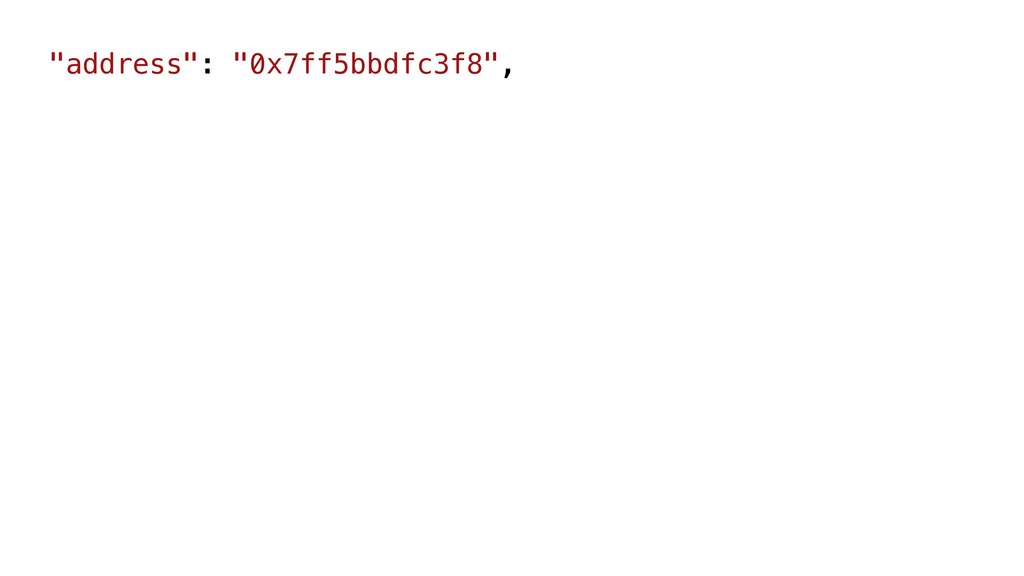
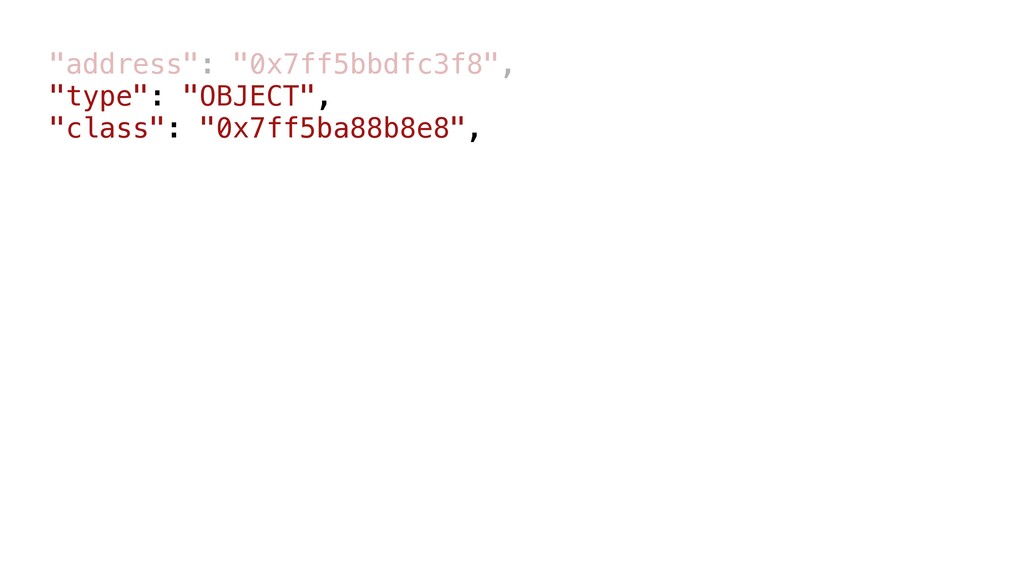
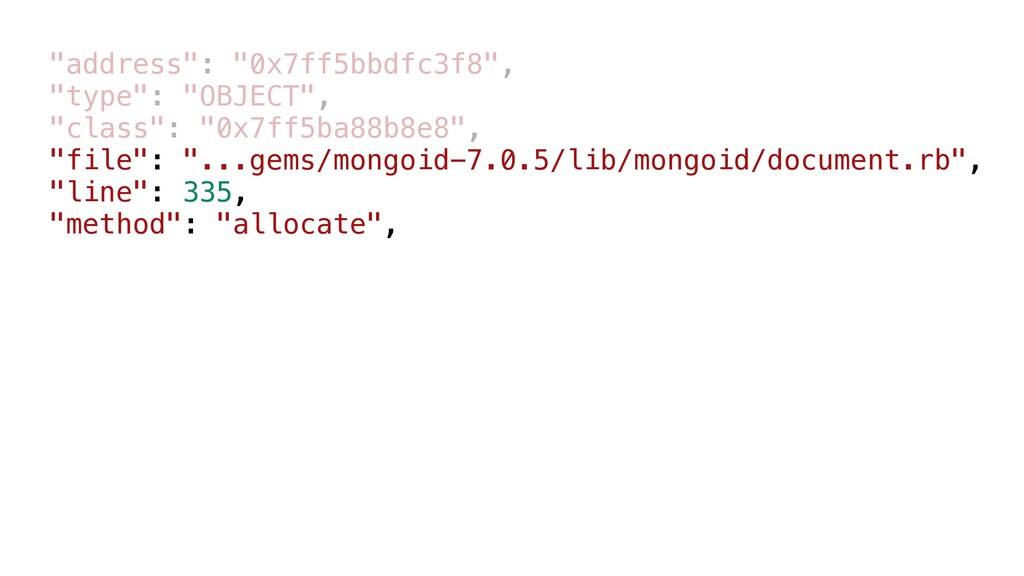
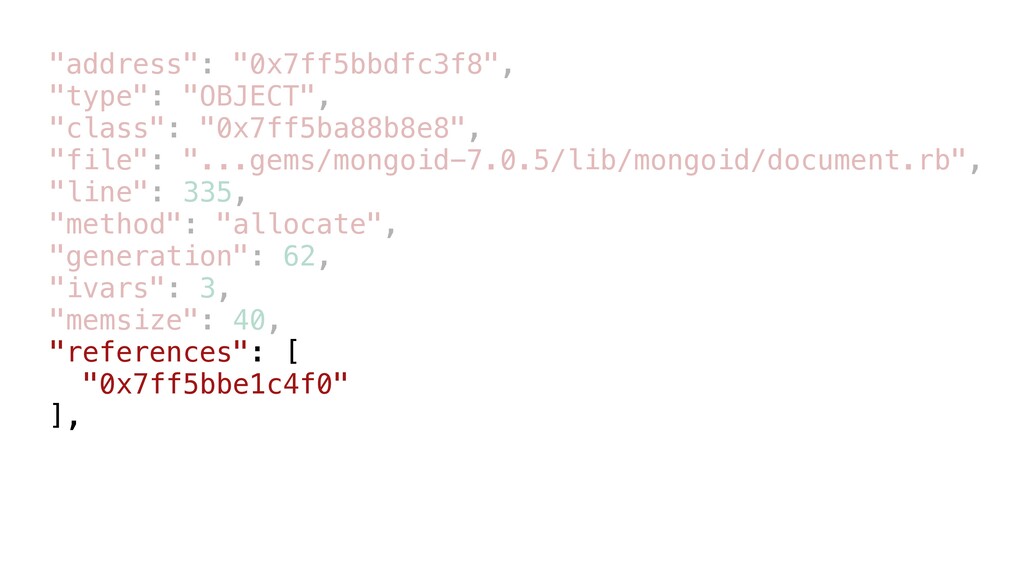
What's in a heap dump?
None
"address": "0x7ff5bbdfc3f8",
"address": "0x7ff5bbdfc3f8", "type": "OBJECT", "class": "0x7ff5ba88b8e8",
"address": "0x7ff5bbdfc3f8", "type": "OBJECT", "class": "0x7ff5ba88b8e8", "file": "...gems/mongoid-7.0.5/lib/mongoid/document.rb", "line": 335,
"method": "allocate",
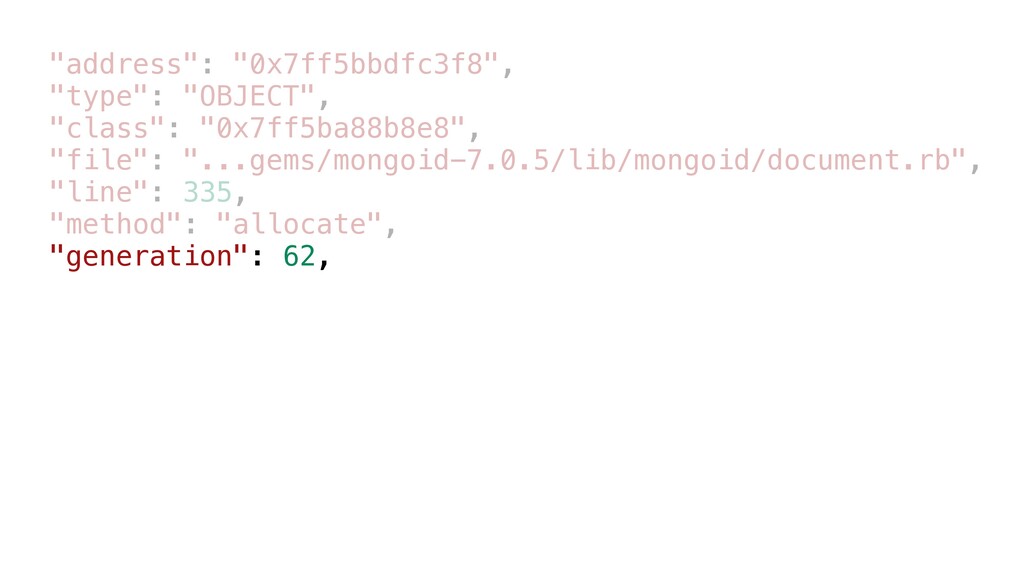
"address": "0x7ff5bbdfc3f8", "type": "OBJECT", "class": "0x7ff5ba88b8e8", "file": "...gems/mongoid-7.0.5/lib/mongoid/document.rb", "line": 335,
"method": "allocate", "generation": 62,
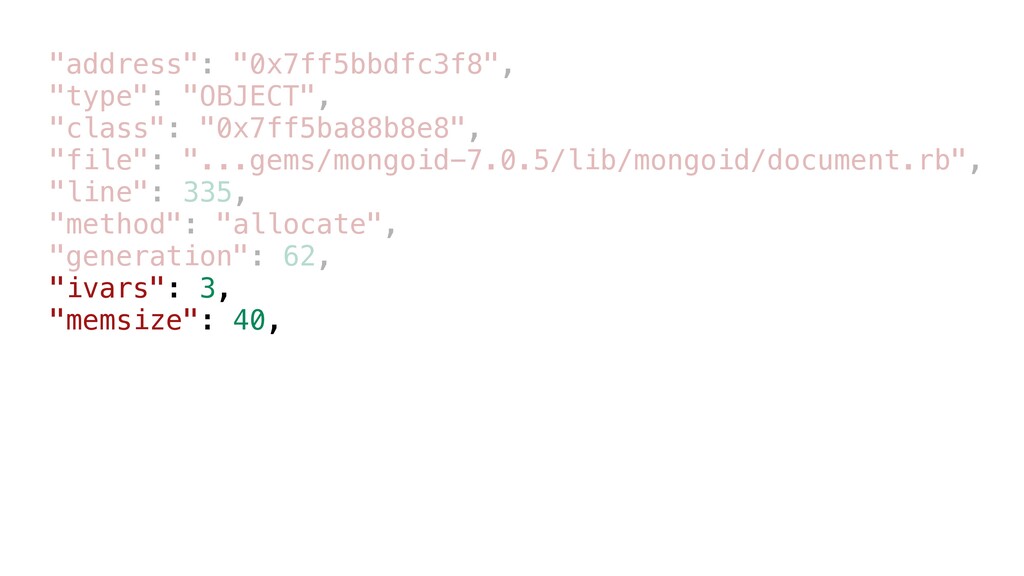
"address": "0x7ff5bbdfc3f8", "type": "OBJECT", "class": "0x7ff5ba88b8e8", "file": "...gems/mongoid-7.0.5/lib/mongoid/document.rb", "line": 335,
"method": "allocate", "generation": 62, "ivars": 3, "memsize": 40,
"address": "0x7ff5bbdfc3f8", "type": "OBJECT", "class": "0x7ff5ba88b8e8", "file": "...gems/mongoid-7.0.5/lib/mongoid/document.rb", "line": 335,
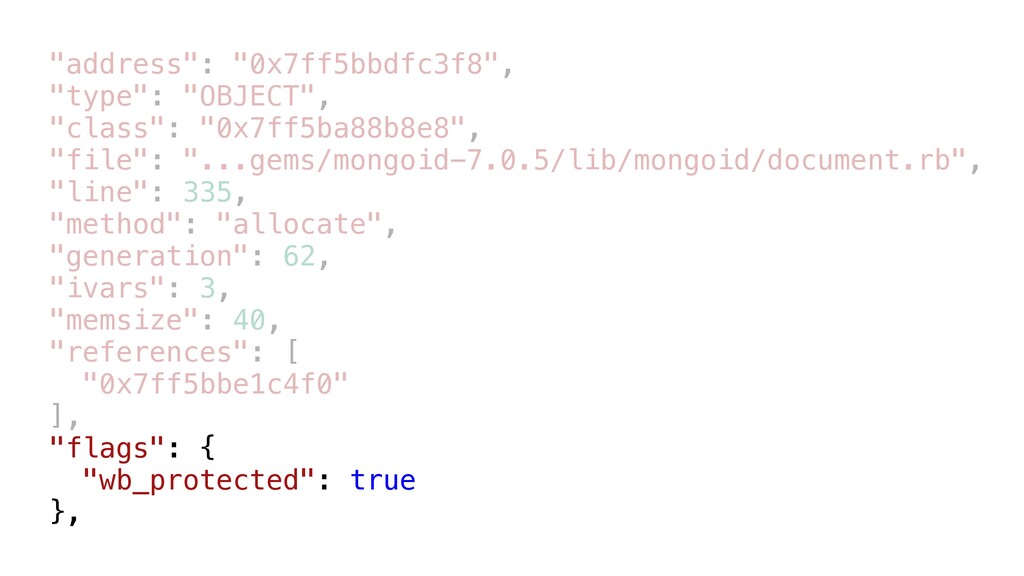
"method": "allocate", "generation": 62, "ivars": 3, "memsize": 40, "references": [ "0x7ff5bbe1c4f0" ],
"address": "0x7ff5bbdfc3f8", "type": "OBJECT", "class": "0x7ff5ba88b8e8", "file": "...gems/mongoid-7.0.5/lib/mongoid/document.rb", "line": 335,
"method": "allocate", "generation": 62, "ivars": 3, "memsize": 40, "references": [ "0x7ff5bbe1c4f0" ], "flags": { "wb_protected": true },
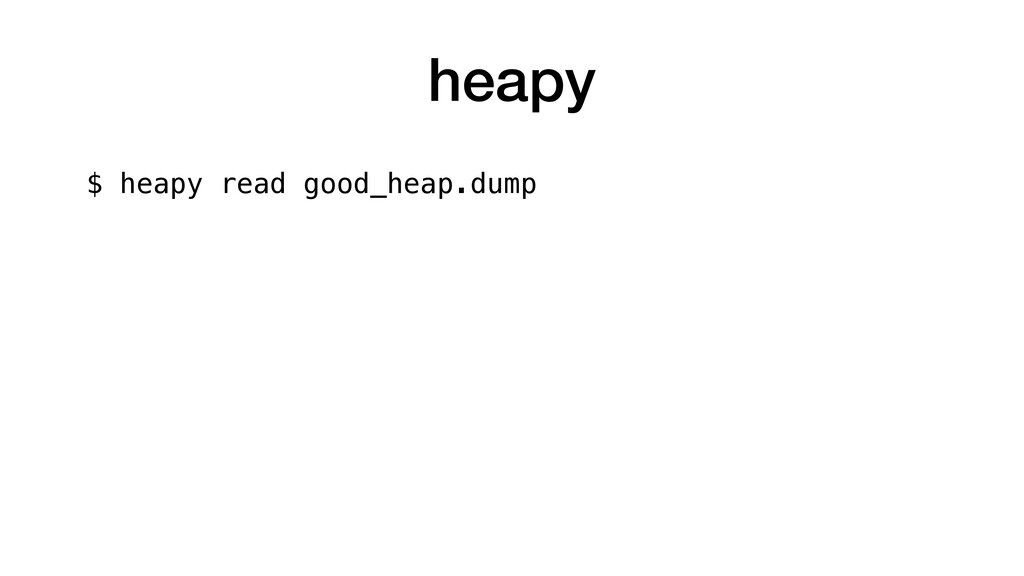
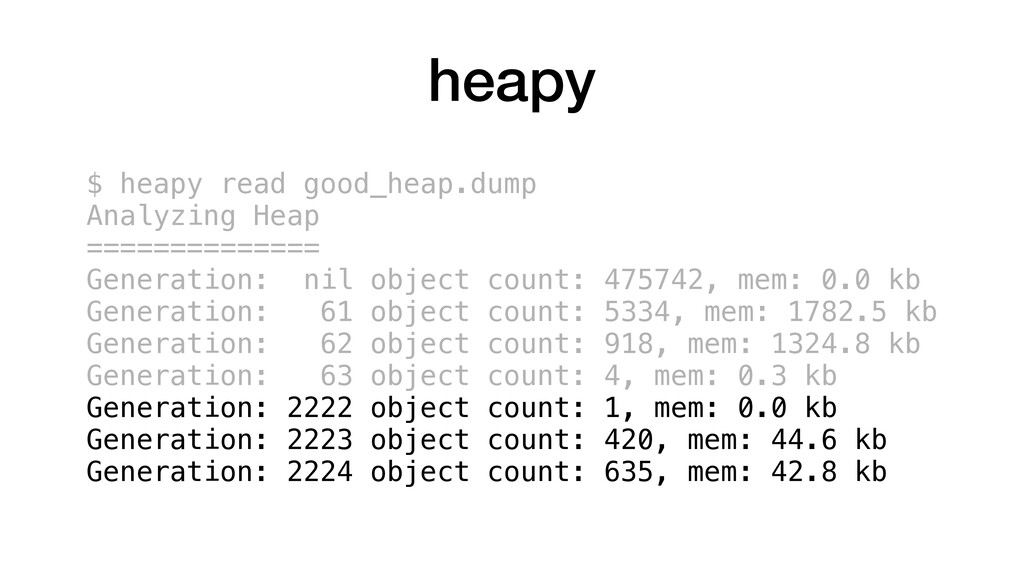
heapy
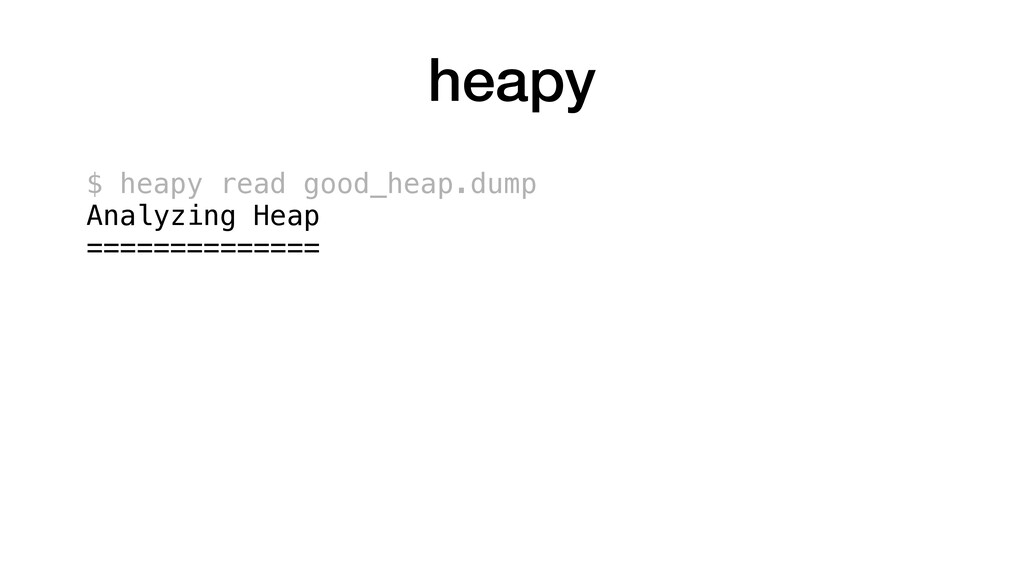
heapy $ heapy read good_heap.dump
heapy $ heapy read good_heap.dump Analyzing Heap ==============
heapy $ heapy read good_heap.dump Analyzing Heap ============== Generation: nil
object count: 475742, mem: 0.0 kb
heapy $ heapy read good_heap.dump Analyzing Heap ============== Generation: nil
object count: 475742, mem: 0.0 kb Generation: 61 object count: 5334, mem: 1782.5 kb Generation: 62 object count: 918, mem: 1324.8 kb Generation: 63 object count: 4, mem: 0.3 kb
heapy $ heapy read good_heap.dump Analyzing Heap ============== Generation: nil
object count: 475742, mem: 0.0 kb Generation: 61 object count: 5334, mem: 1782.5 kb Generation: 62 object count: 918, mem: 1324.8 kb Generation: 63 object count: 4, mem: 0.3 kb Generation: 2222 object count: 1, mem: 0.0 kb Generation: 2223 object count: 420, mem: 44.6 kb Generation: 2224 object count: 635, mem: 42.8 kb
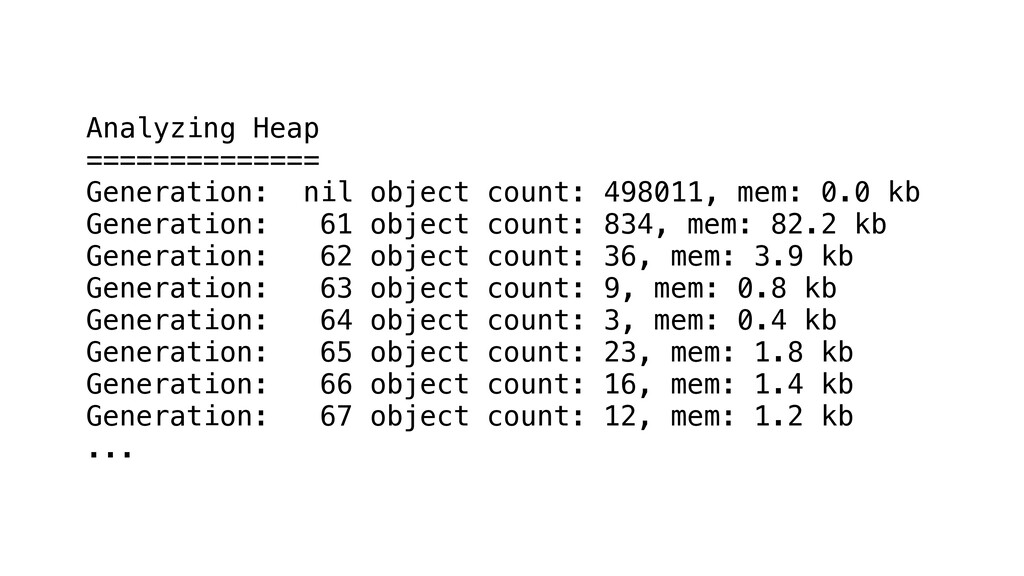
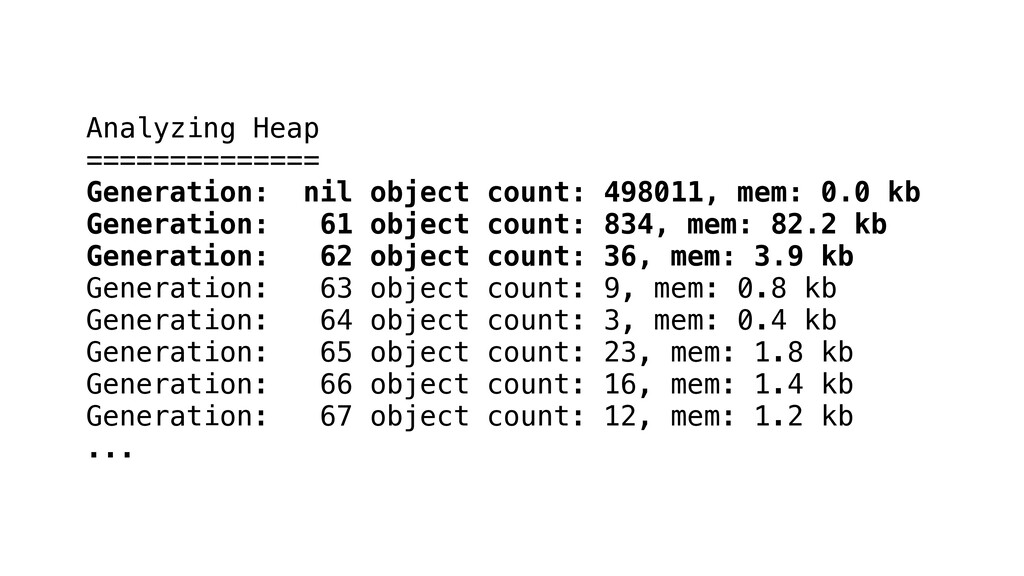
Analyzing Heap ============== Generation: nil object count: 498011, mem: 0.0
kb Generation: 61 object count: 834, mem: 82.2 kb Generation: 62 object count: 36, mem: 3.9 kb Generation: 63 object count: 9, mem: 0.8 kb Generation: 64 object count: 3, mem: 0.4 kb Generation: 65 object count: 23, mem: 1.8 kb Generation: 66 object count: 16, mem: 1.4 kb Generation: 67 object count: 12, mem: 1.2 kb ...
Generation: 218 object count: 11, mem: 1.2 kb Generation: 219
object count: 10, mem: 1.1 kb Generation: 220 object count: 12, mem: 1.2 kb Generation: 221 object count: 12, mem: 1.2 kb Generation: 222 object count: 13, mem: 9.2 kb Generation: 223 object count: 10, mem: 1.0 kb Generation: 224 object count: 12, mem: 1.2 kb Generation: 225 object count: 12, mem: 1.2 kb Generation: 226 object count: 9, mem: 0.9 kb Generation: 227 object count: 11, mem: 1.2 kb ...
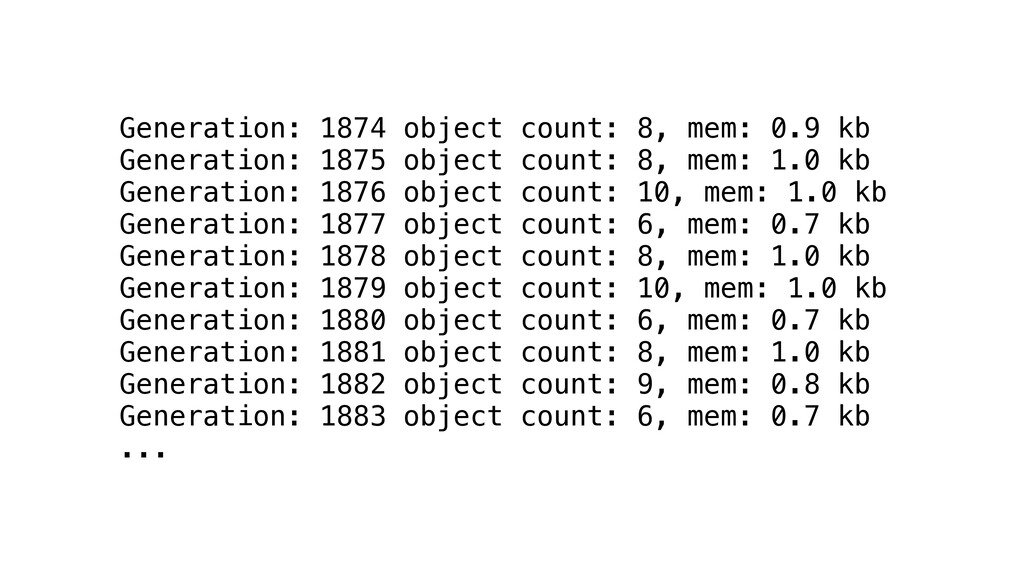
Generation: 1874 object count: 8, mem: 0.9 kb Generation: 1875
object count: 8, mem: 1.0 kb Generation: 1876 object count: 10, mem: 1.0 kb Generation: 1877 object count: 6, mem: 0.7 kb Generation: 1878 object count: 8, mem: 1.0 kb Generation: 1879 object count: 10, mem: 1.0 kb Generation: 1880 object count: 6, mem: 0.7 kb Generation: 1881 object count: 8, mem: 1.0 kb Generation: 1882 object count: 9, mem: 0.8 kb Generation: 1883 object count: 6, mem: 0.7 kb ...
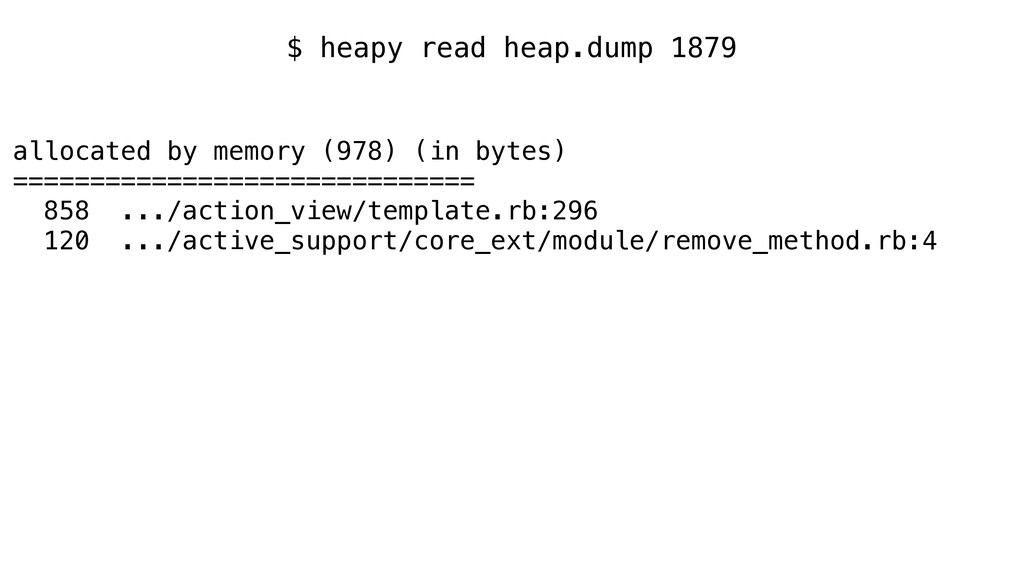
$ heapy read heap.dump 1879
$ heapy read heap.dump 1879 allocated by memory (978) (in
bytes) ============================== 858 .../action_view/template.rb:296 120 .../active_support/core_ext/module/remove_method.rb:4
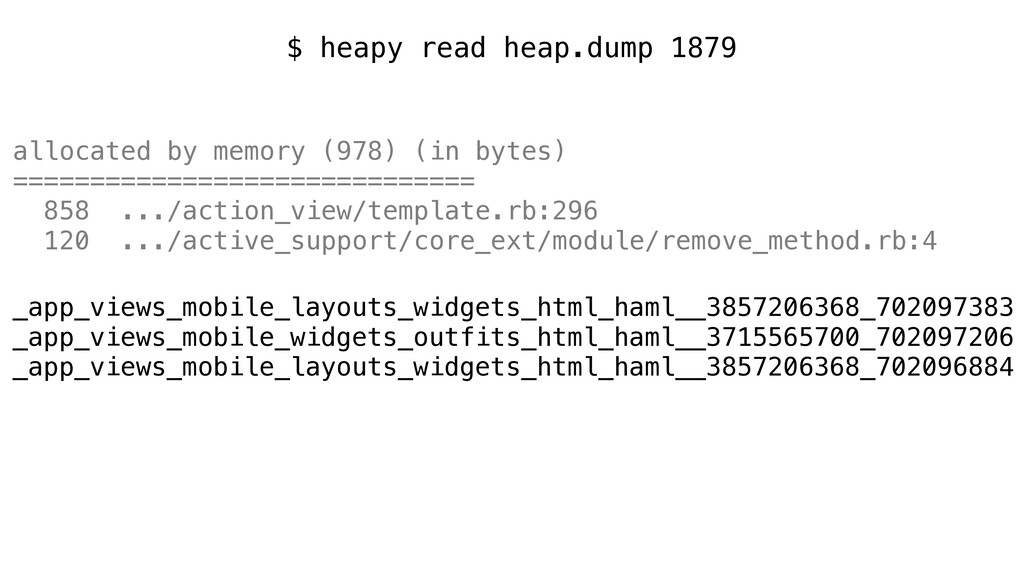
$ heapy read heap.dump 1879 allocated by memory (978) (in
bytes) ============================== 858 .../action_view/template.rb:296 120 .../active_support/core_ext/module/remove_method.rb:4 _app_views_mobile_layouts_widgets_html_haml__3857206368_702097383 _app_views_mobile_widgets_outfits_html_haml__3715565700_702097206 _app_views_mobile_layouts_widgets_html_haml__3857206368_702096884
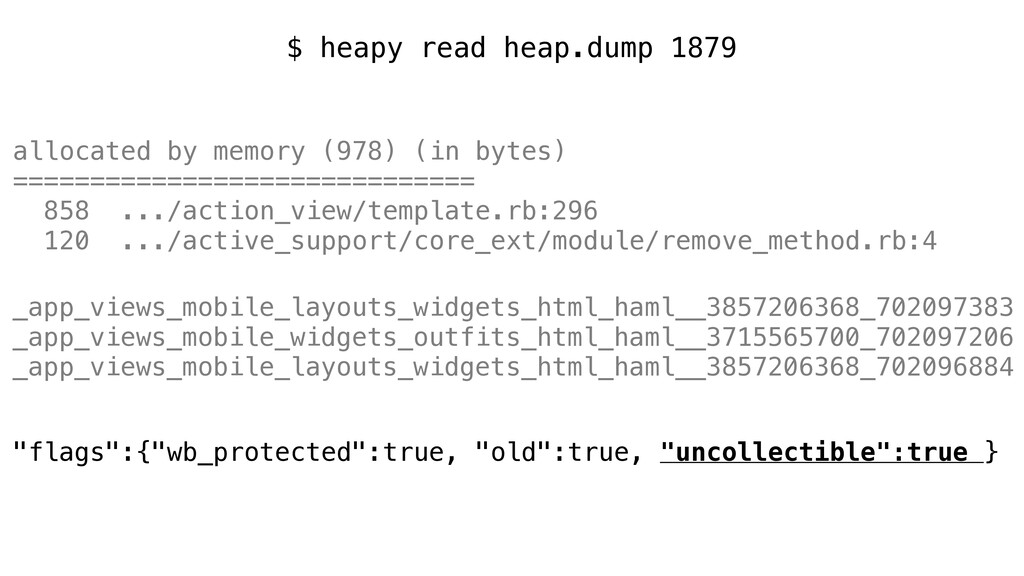
$ heapy read heap.dump 1879 allocated by memory (978) (in
bytes) ============================== 858 .../action_view/template.rb:296 120 .../active_support/core_ext/module/remove_method.rb:4 _app_views_mobile_layouts_widgets_html_haml__3857206368_702097383 _app_views_mobile_widgets_outfits_html_haml__3715565700_702097206 _app_views_mobile_layouts_widgets_html_haml__3857206368_702096884 "flags":{"wb_protected":true, "old":true, "uncollectible":true }
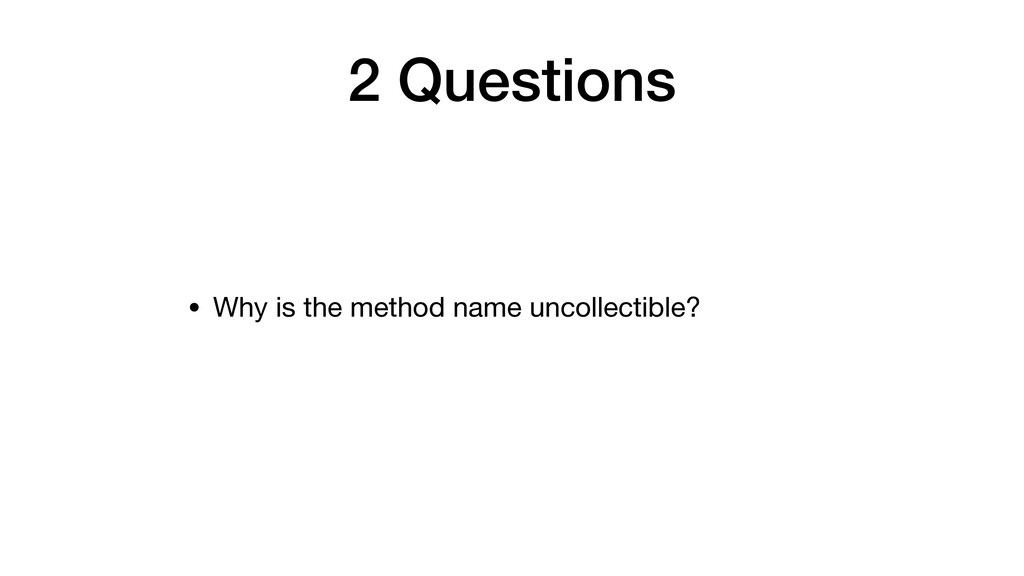
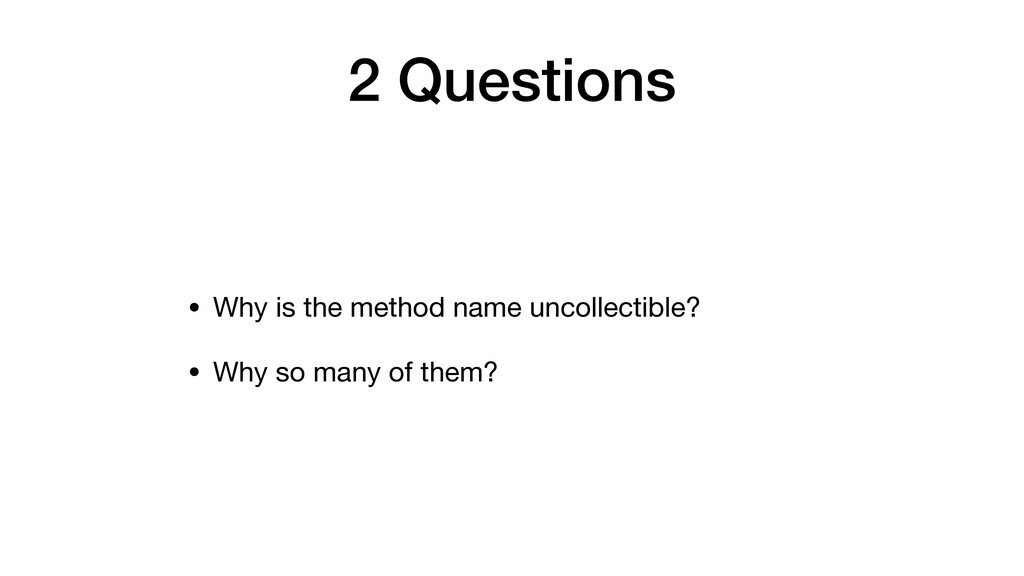
2 Questions
2 Questions • Why is the method name uncollectible?
2 Questions • Why is the method name uncollectible? •
Why so many of them?
Ruby 2.2: Symbols can be garbage collected
Ruby 2.2: Symbols can be garbage collected *Terms and conditions
may apply Your statutory rights are not affected
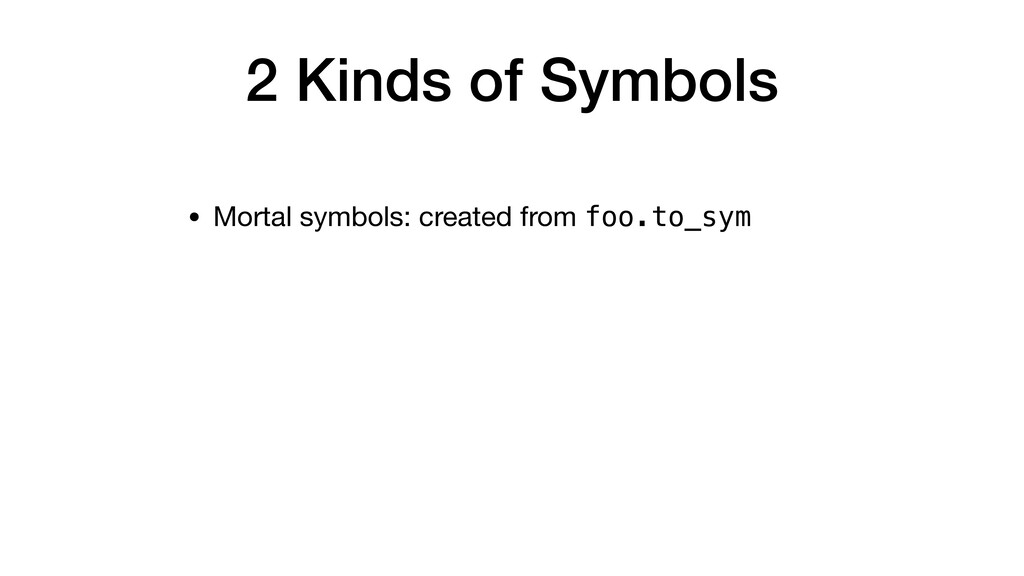
2 Kinds of Symbols
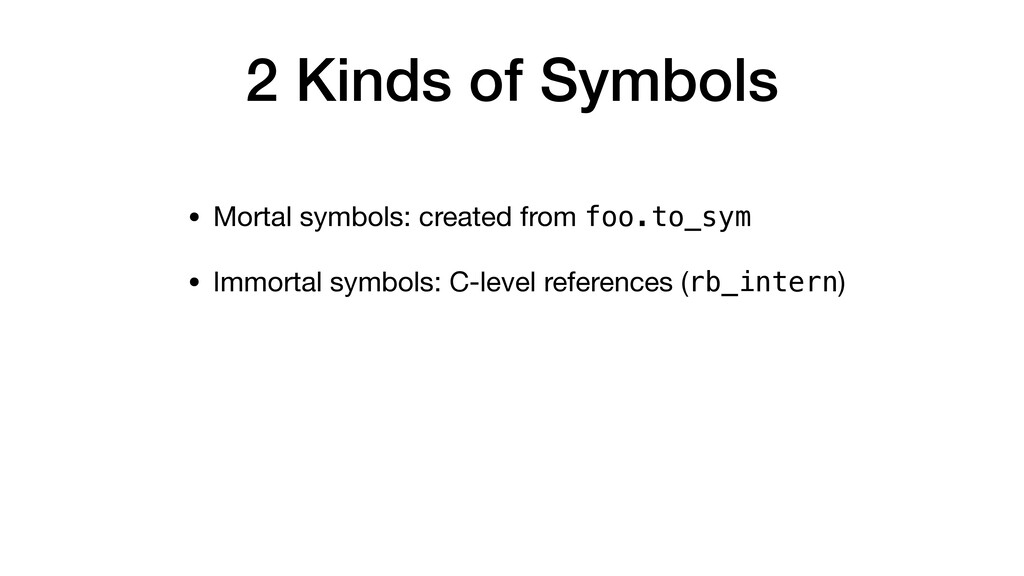
2 Kinds of Symbols • Mortal symbols: created from foo.to_sym
2 Kinds of Symbols • Mortal symbols: created from foo.to_sym
• Immortal symbols: C-level references (rb_intern)
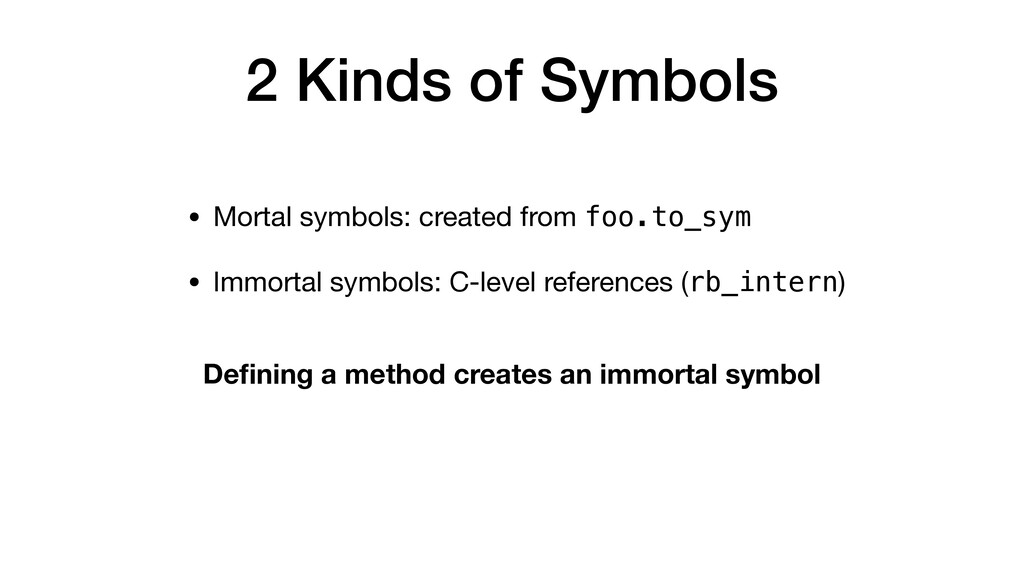
2 Kinds of Symbols • Mortal symbols: created from foo.to_sym
• Immortal symbols: C-level references (rb_intern) Defining a method creates an immortal symbol
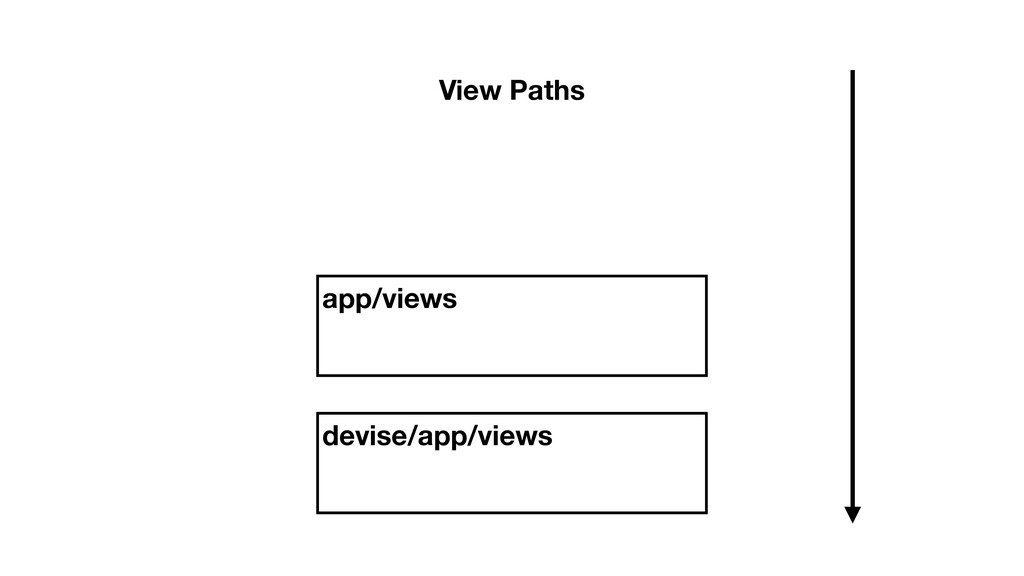
Action View template caching
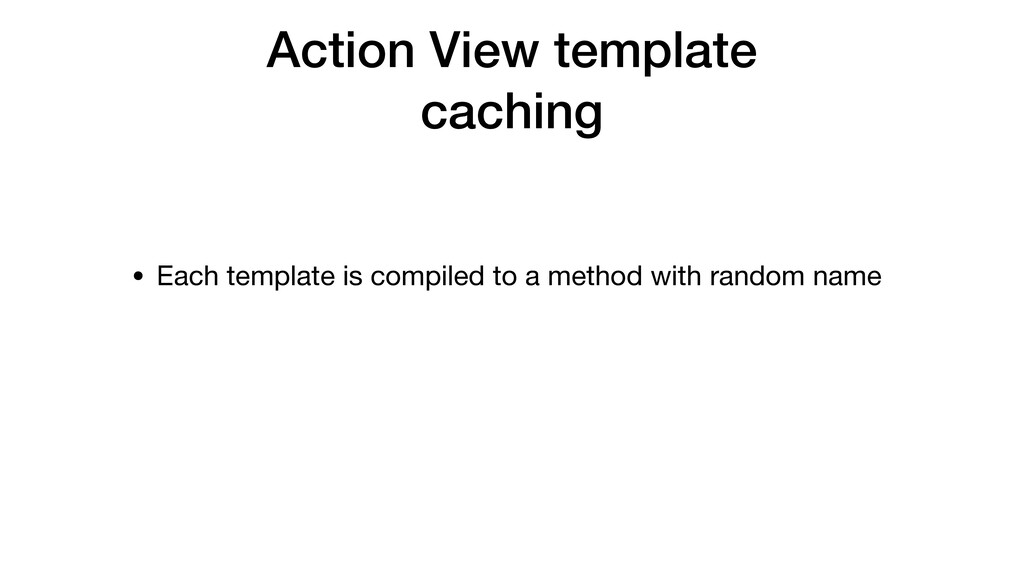
Action View template caching • Each template is compiled to
a method with random name
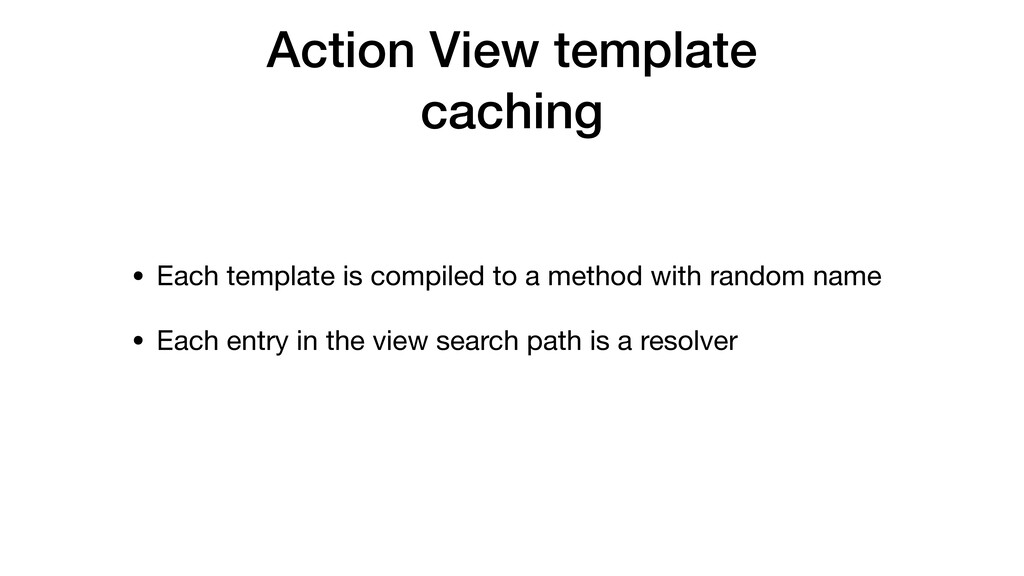
Action View template caching • Each template is compiled to
a method with random name • Each entry in the view search path is a resolver
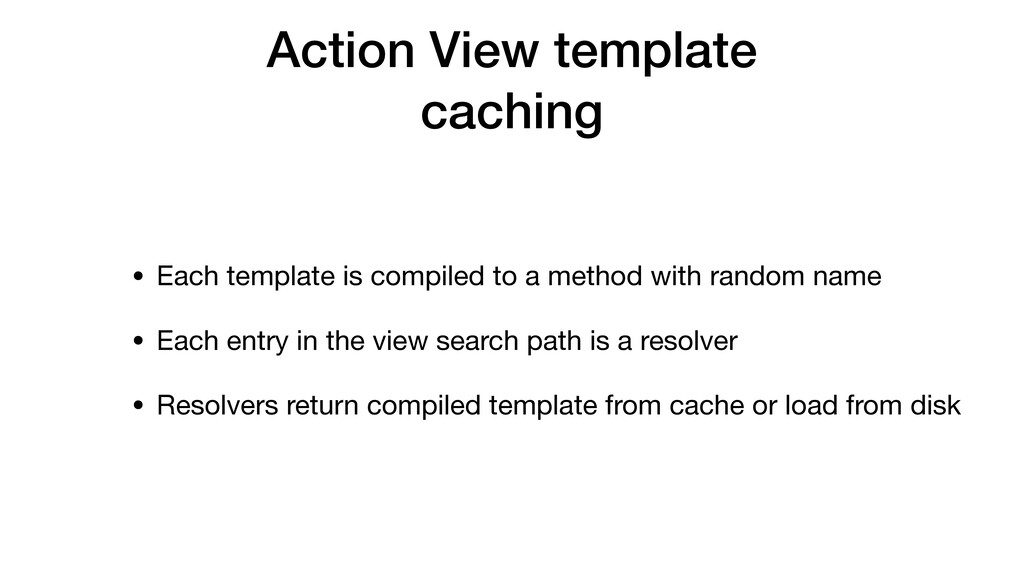
Action View template caching • Each template is compiled to
a method with random name • Each entry in the view search path is a resolver • Resolvers return compiled template from cache or load from disk
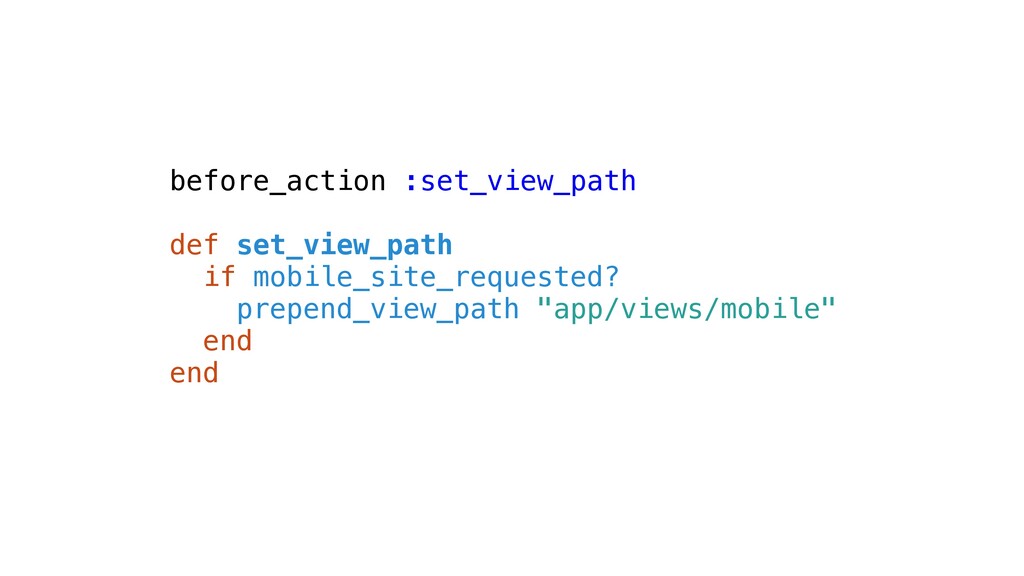
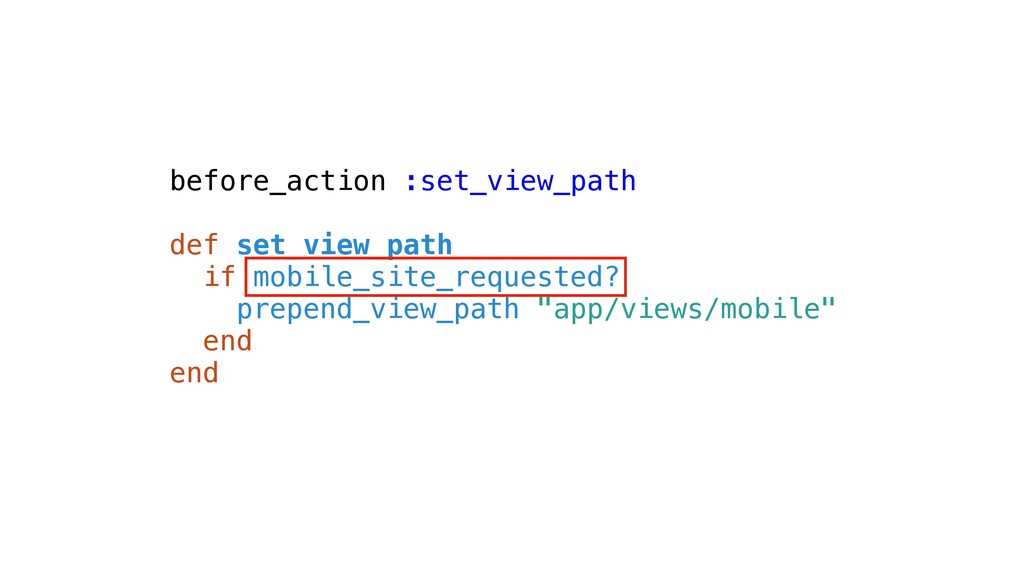
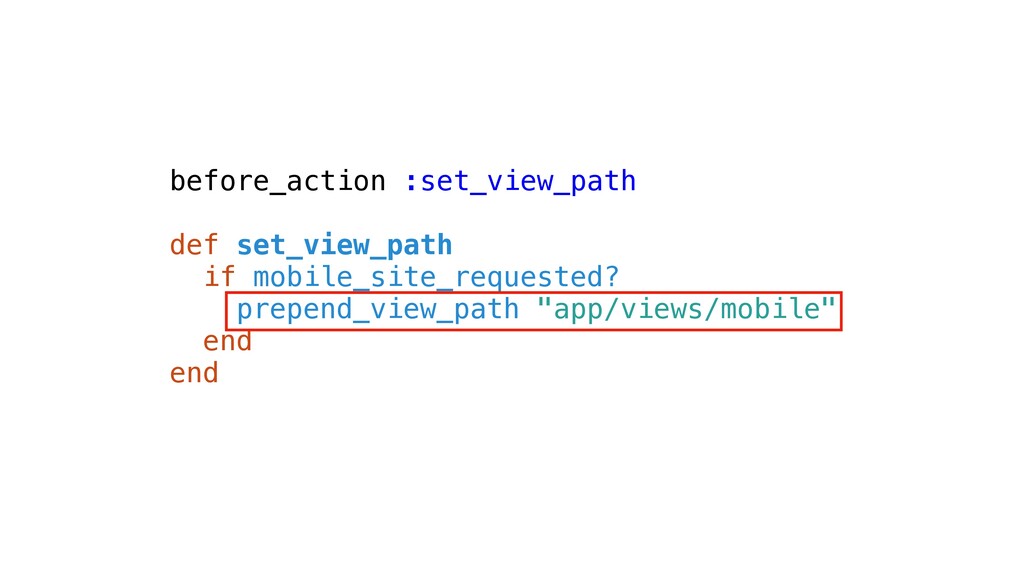
before_action :set_view_path def set_view_path if mobile_site_requested? prepend_view_path "app/views/mobile" end end
before_action :set_view_path def set_view_path if mobile_site_requested? prepend_view_path "app/views/mobile" end end
before_action :set_view_path def set_view_path if mobile_site_requested? prepend_view_path "app/views/mobile" end end
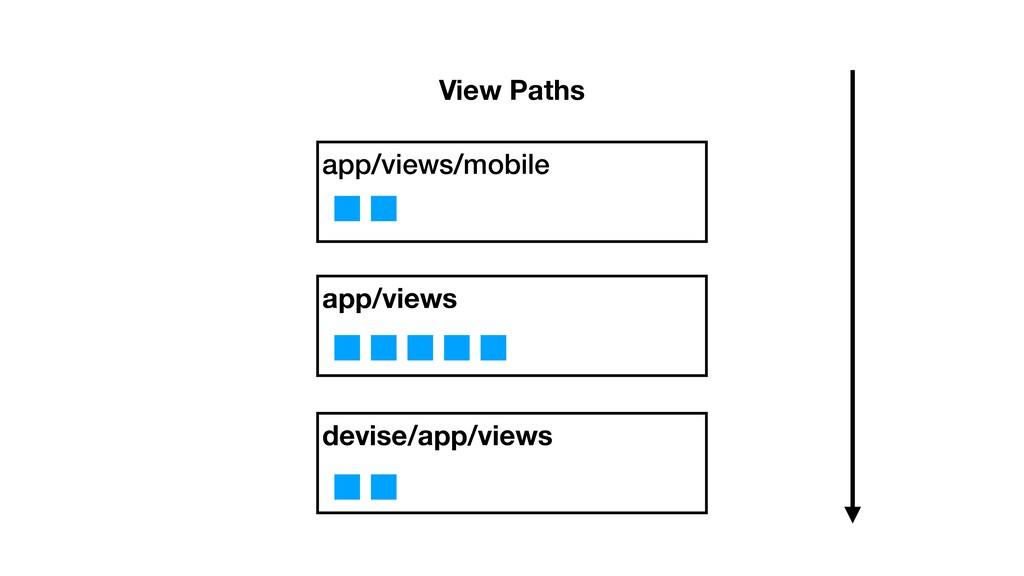
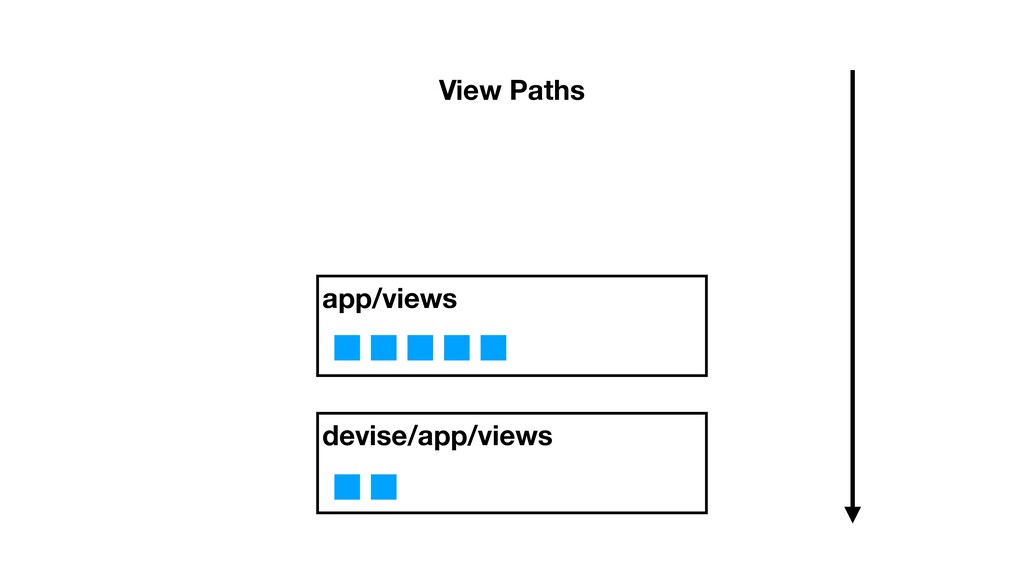
devise/app/views app/views View Paths
devise/app/views app/views View Paths
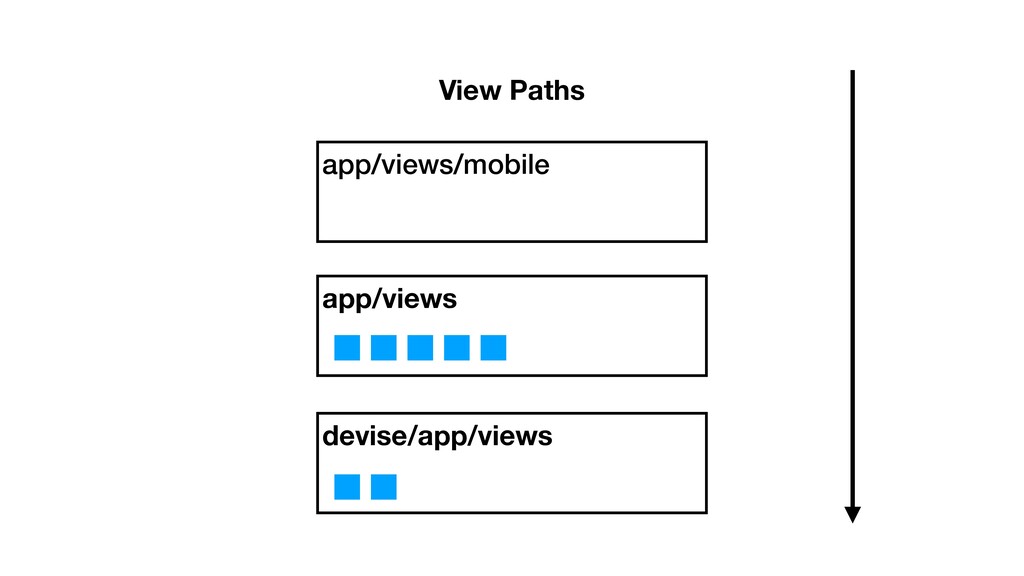
devise/app/views app/views View Paths app/views/mobile
devise/app/views app/views View Paths app/views/mobile
devise/app/views app/views View Paths
devise/app/views app/views View Paths app/views/mobile
New (empty) cache on each request!
Each request leaks a symbol
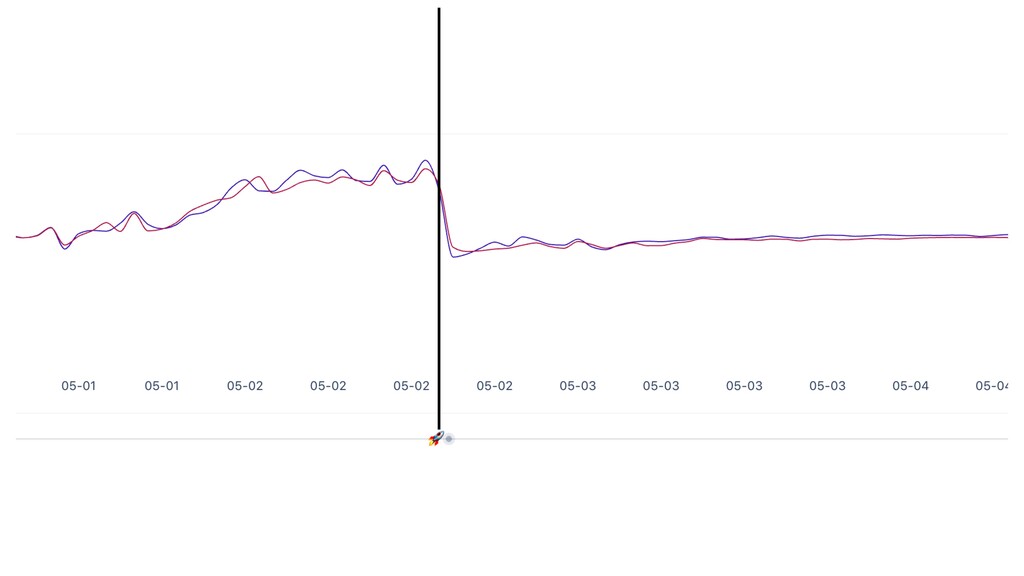
None
None
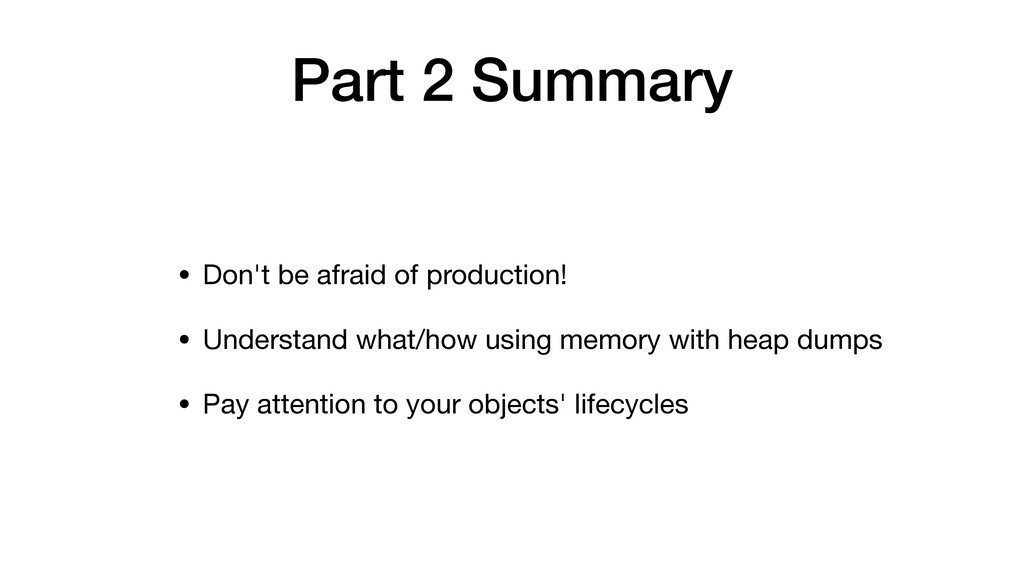
Part 2 Summary
Part 2 Summary • Don't be afraid of production!
Part 2 Summary • Don't be afraid of production! •
Understand what/how using memory with heap dumps
Part 2 Summary • Don't be afraid of production! •
Understand what/how using memory with heap dumps • Pay attention to your objects' lifecycles
Thank you! @fglc2 / dressipi
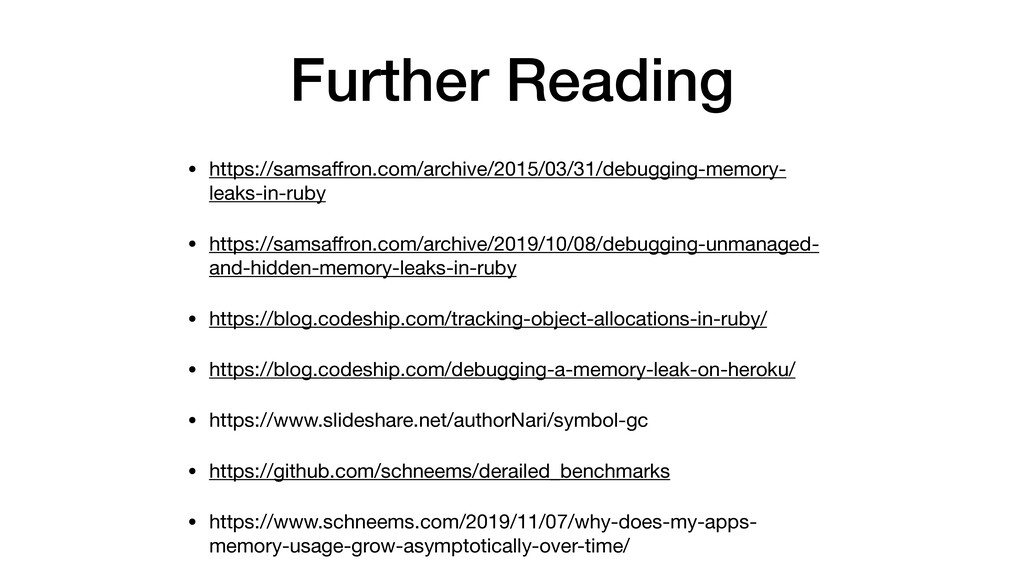
Further Reading • https://samsaffron.com/archive/2015/03/31/debugging-memory- leaks-in-ruby • https://samsaffron.com/archive/2019/10/08/debugging-unmanaged- and-hidden-memory-leaks-in-ruby • https://blog.codeship.com/tracking-object-allocations-in-ruby/
• https://blog.codeship.com/debugging-a-memory-leak-on-heroku/ • https://www.slideshare.net/authorNari/symbol-gc • https://github.com/schneems/derailed_benchmarks • https://www.schneems.com/2019/11/07/why-does-my-apps- memory-usage-grow-asymptotically-over-time/