Upgrade to Pro
— share decks privately, control downloads, hide ads and more …
Speaker Deck
Features
Speaker Deck
PRO
Sign in
Sign up for free
Search
Search
Monitoring in Motion: Challenges of Monitoring ...
Search
Ilan Rabinovitch
February 26, 2016
Technology
120
0
Share
Embed
Copy iframe code
Copy JS code
Copy link
Start on current slide
Monitoring in Motion: Challenges of Monitoring Containers and Kuberntes
Ilan Rabinovitch
February 26, 2016
More Decks by Ilan Rabinovitch
See All by Ilan Rabinovitch
Monitoring in Motion - ContainerCon 2016
irabinovitch
0
110
Data Driven Post Mortems at Datadog - LinuxCon 2016
irabinovitch
1
240
Introduction to Docker Monitoring
irabinovitch
0
180
OSCON 2016 - Monitoring in Motion
irabinovitch
2
200
Monitoring OpenStack at Lithium (OpenStack Summit Austin 2016)
irabinovitch
0
83
LinuxFest Northwest 2016 - Monitoring 101
irabinovitch
0
53
Monitoring ECS and Dynamic Infrastructure
irabinovitch
0
130
Doing DevOps Right with Datadog + Pagerduty
irabinovitch
0
140
Docker Usage Patterns - Docker Meetup Palo Alto - Nov 2015
irabinovitch
0
85
Other Decks in Technology
See All in Technology
Oracle Exadata Database Service on Cloud@Customer X11M (ExaDB-C@C) サービス概要
oracle4engineer
PRO
2
8.4k
Data + AI Summit 2026 イベントレポート: 「AIがビジネスで意思決定するデータ基盤」へ
nek0128
0
280
AI時代の開発生産性を捉え直す — 経営と現場をつなぐ「開発組織のオブザーバビリティ」— / AI Dev Ex Conference 2026
tkyowa
0
180
穢れた技術選定について
watany
18
5.7k
Gen3R: 3D Scene Generation Meets Feed-Forward Reconstruction
spatial_ai_network
0
140
OPENLOGI Company Profile for engineer
hr01
1
74k
仕様駆動開発、導入半年。「本当に速くなってるの?」にデータで答える / AICon2026_hirakawa
rakus_dev
0
150
個人開発で育てる「大規模設計の苗床」 - AI時代の1人開発から始める業務への知識接続 / The Seedbed for Large-Scale Design - From AI-Era Solo Projects to Professional Knowledge
bitkey
PRO
1
280
kaonavi Tech Night#1
kaonavi
0
120
凡エンジニアがこの先生きのこるためには。〜TypeScript完全に理解したい〜
alchemy1115
2
310
関数型の考えを TypeScript に持ち込んで、テストしやすい純粋関数を増やす / Pure at the Core, Effects at the Edge: Bringing Functional Thinking into TypeScript
kaminashi
2
130
インフラと開発の垣根を超えていき!〜元AWSインフラエンジニアがAWS開発で奮闘している話〜
hatahata021
3
300
Featured
See All Featured
ラッコキーワード サービス紹介資料
rakko
1
4M
Performance Is Good for Brains [We Love Speed 2024]
tammyeverts
12
1.7k
The AI Search Optimization Roadmap by Aleyda Solis
aleyda
1
6k
Music & Morning Musume
bryan
47
7.3k
Code Review Best Practice
trishagee
74
20k
The innovator’s Mindset - Leading Through an Era of Exponential Change - McGill University 2025
jdejongh
PRO
1
220
Joys of Absence: A Defence of Solitary Play
codingconduct
1
410
The Illustrated Children's Guide to Kubernetes
chrisshort
51
53k
Building Experiences: Design Systems, User Experience, and Full Site Editing
marktimemedia
0
550
WENDY [Excerpt]
tessaabrams
11
38k
The Illustrated Guide to Node.js - THAT Conference 2024
reverentgeek
1
410
Automating Front-end Workflow
addyosmani
1370
210k
Transcript
Monitoring In Motion Challenges in Monitoring Kubernetes & Containers Cloud
Native SF Meetup Feb 25, 2016 Ilan Rabinovitch Director, Community Datadog
About Me • Long time Datadog user. • Prior to
Datadog built automation and monitoring tooling at Ooyala and Edmunds.com • SCALE and TXLF Co-Founder Ilan Rabinovitch Datadog
[email protected]
@irabinovitch
Agenda • Monitoring 101 - Crash Course • Challenges in
Monitoring Dynamic Infrastructure • Demo Time • Questions?
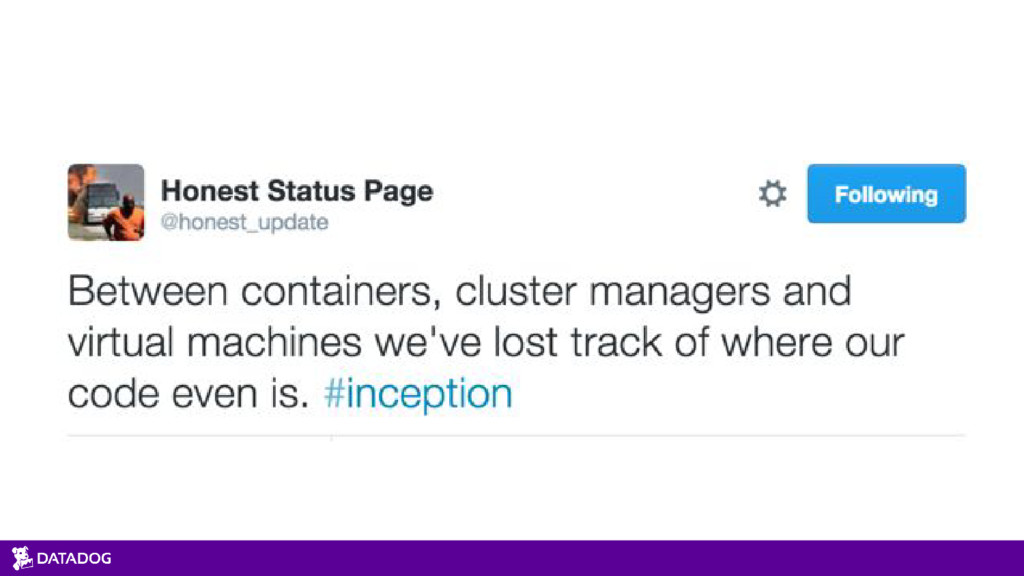
Monitoring Everything
None
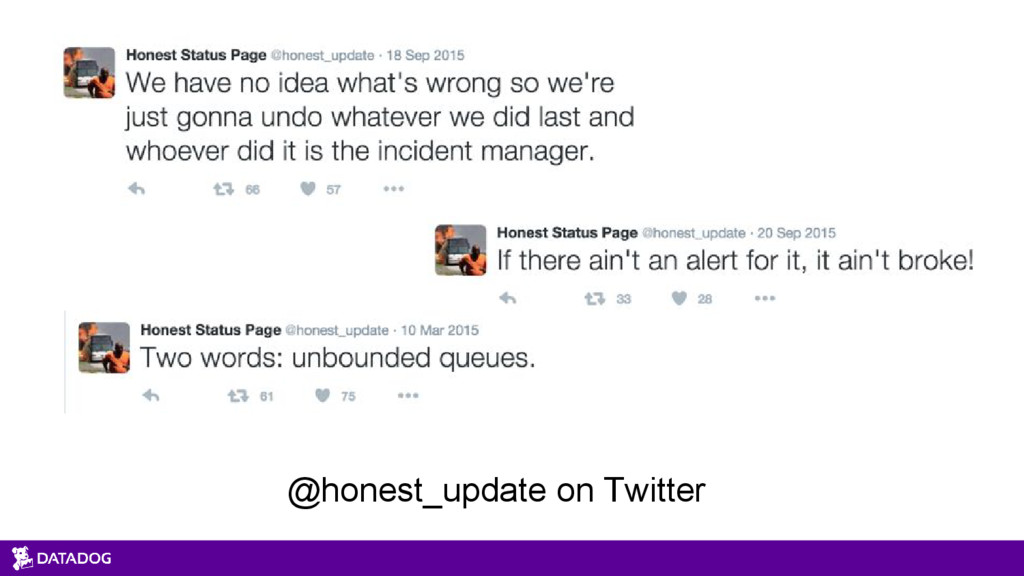
@honest_update on Twitter
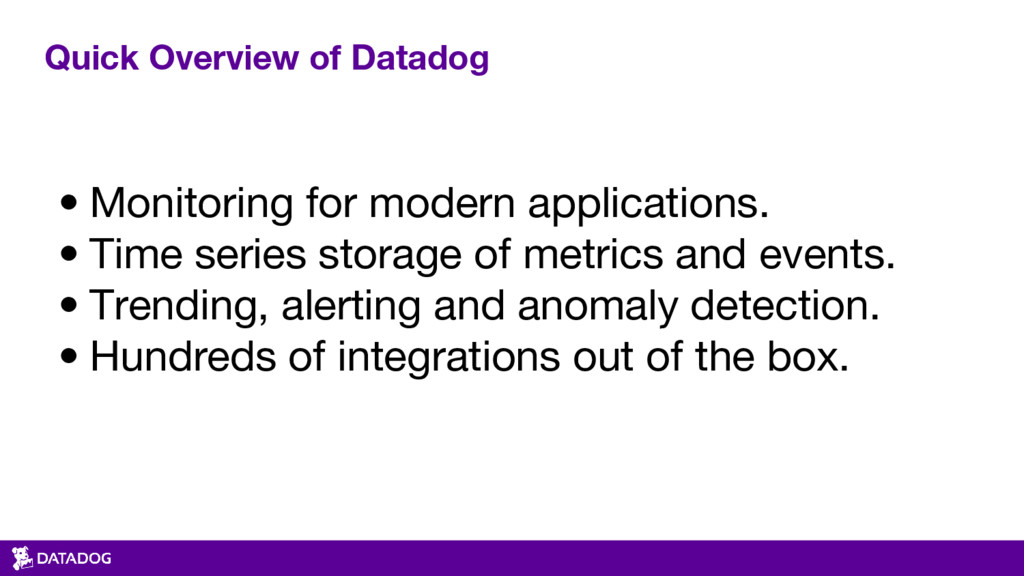
Quick Overview of Datadog • Monitoring for modern applications. •
Time series storage of metrics and events. • Trending, alerting and anomaly detection. • Hundreds of integrations out of the box.
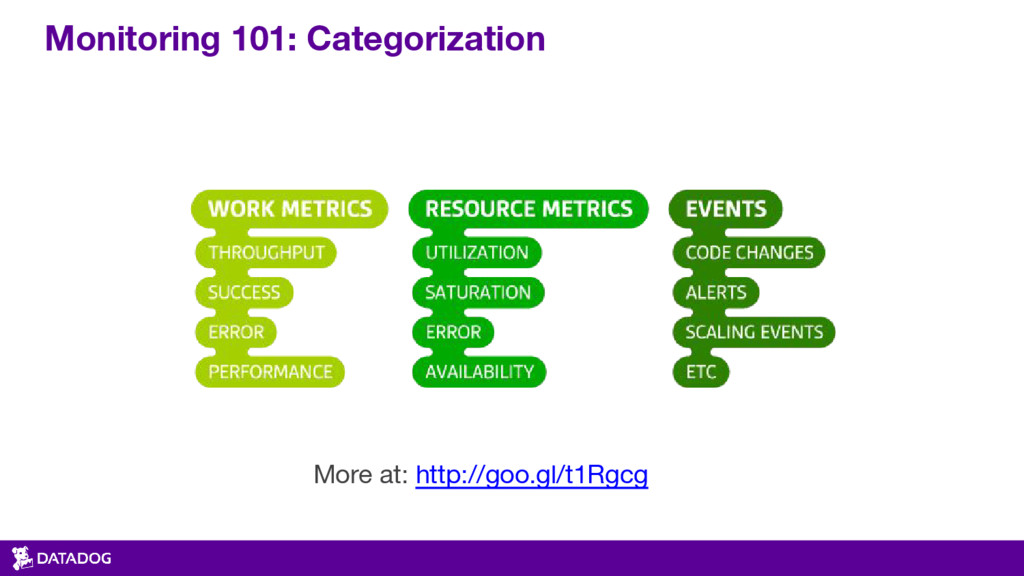
Monitoring 101: Categorization More at: http://goo.gl/t1Rgcg
None
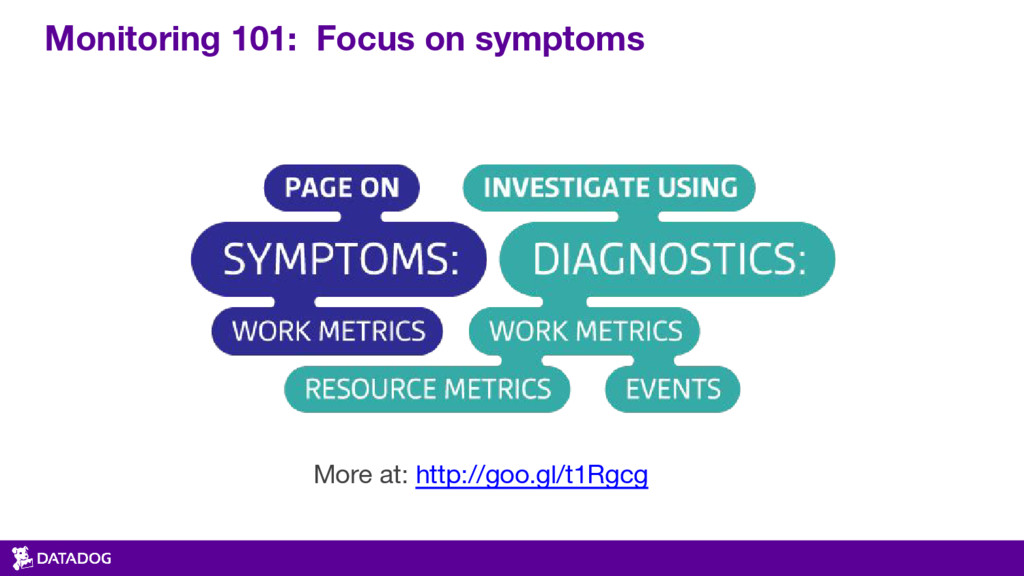
Monitoring 101: Focus on symptoms More at: http://goo.gl/t1Rgcg
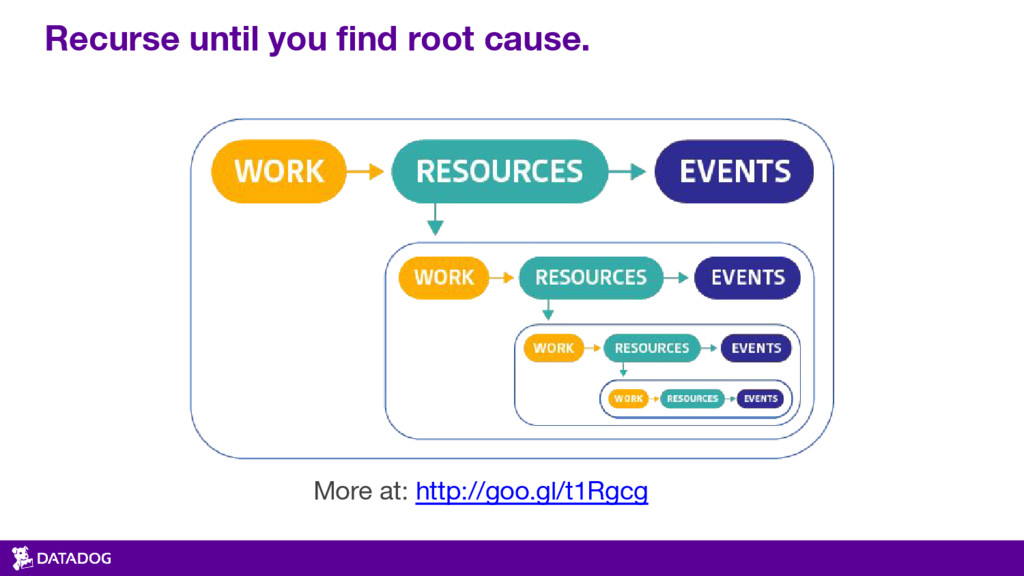
Recurse until you find root cause. More at: http://goo.gl/t1Rgcg
Container Monitoring Challenges
https://www.datadoghq.com/docker-adoption/
None
None
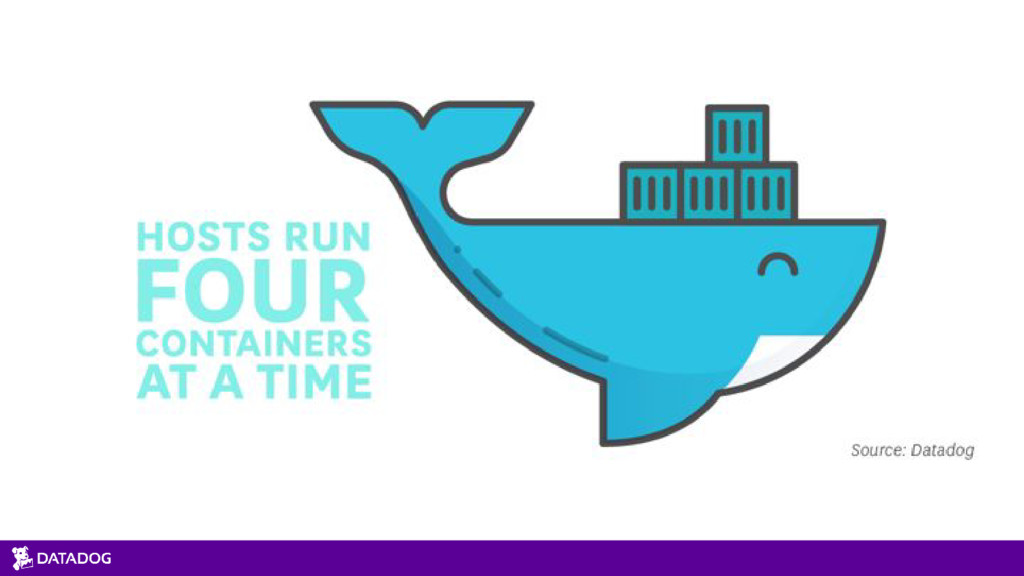
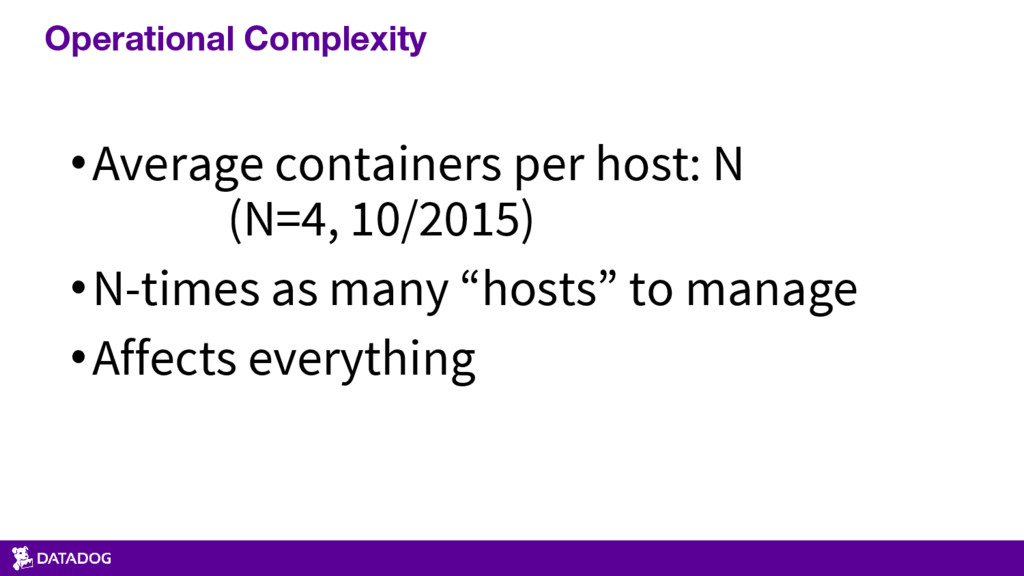
Operational Complexity •Average containers per host: N (N=4, 10/2015) •N-times
as many “hosts” to manage •Affects everything
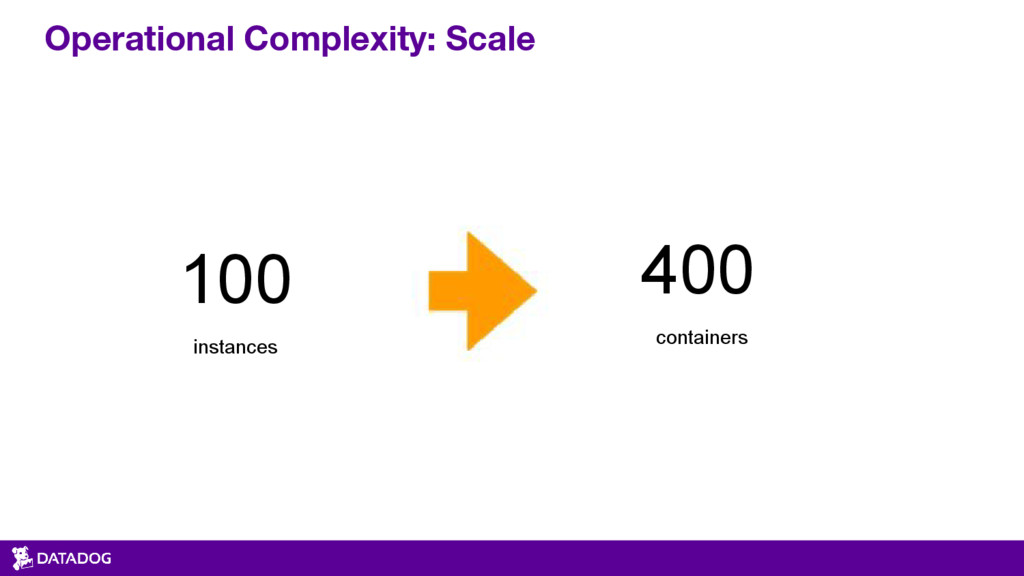
Operational Complexity: Scale 100 instances 400 containers
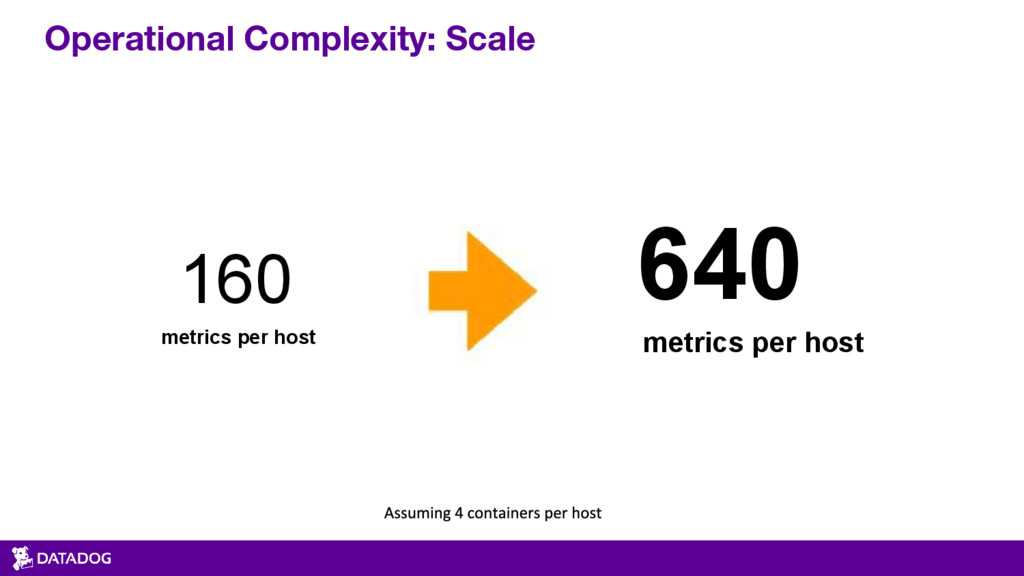
Operational Complexity: Scale 160 metrics per host 640 metrics per
host
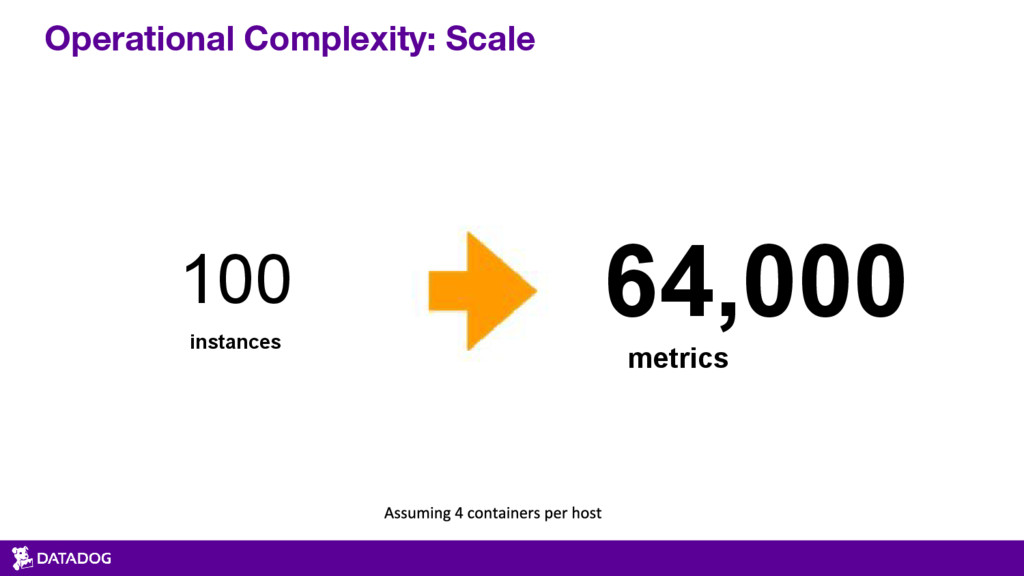
Operational Complexity: Scale 100 instances 64,000 metrics
None
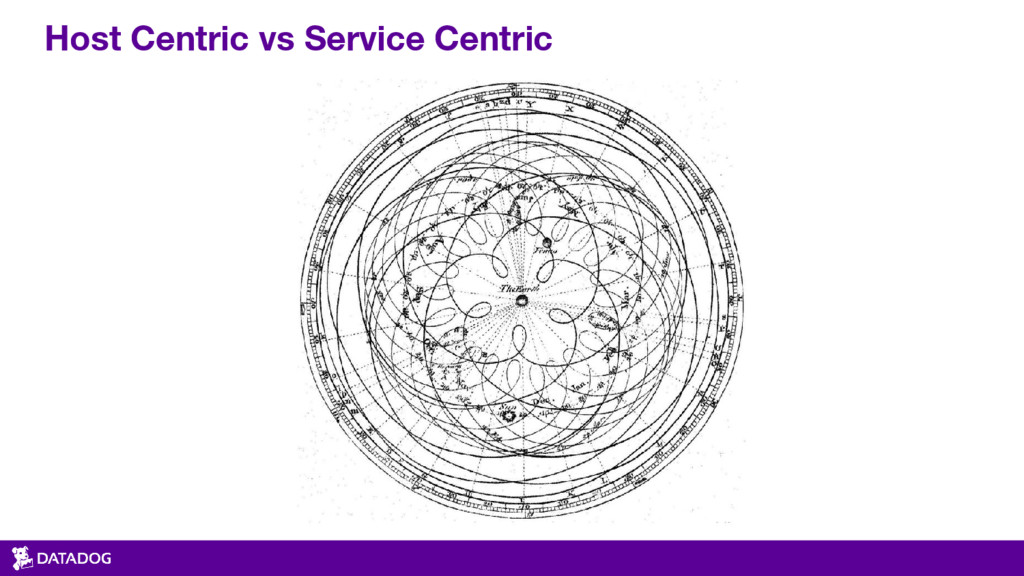
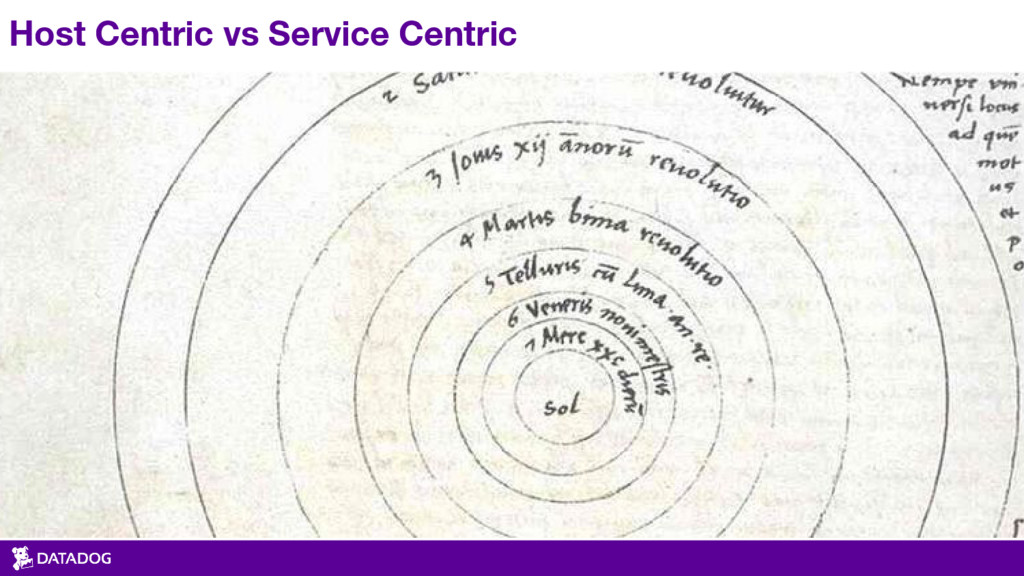
Host Centric vs Service Centric
Host Centric vs Service Centric
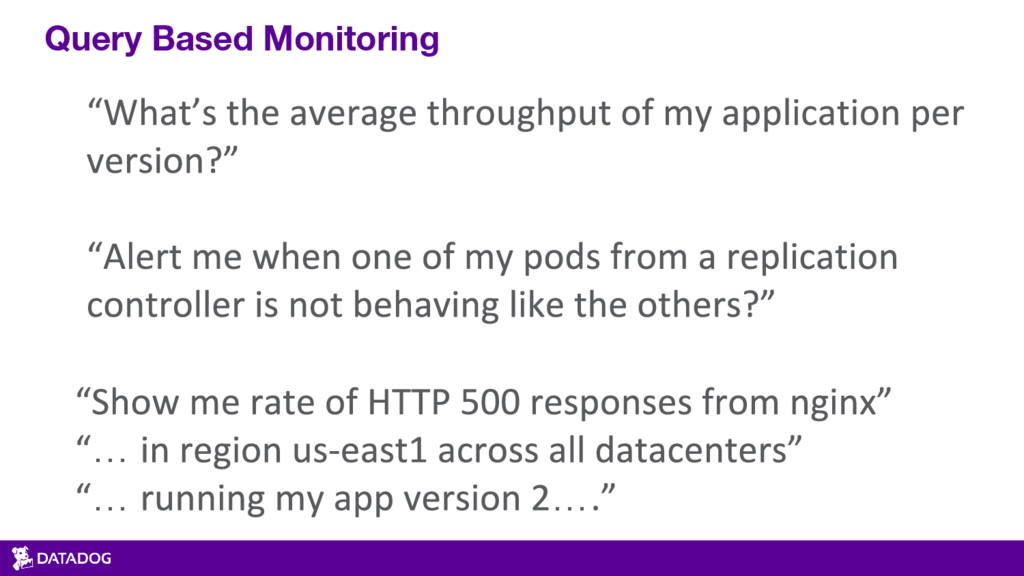
Query Based Monitoring … … …
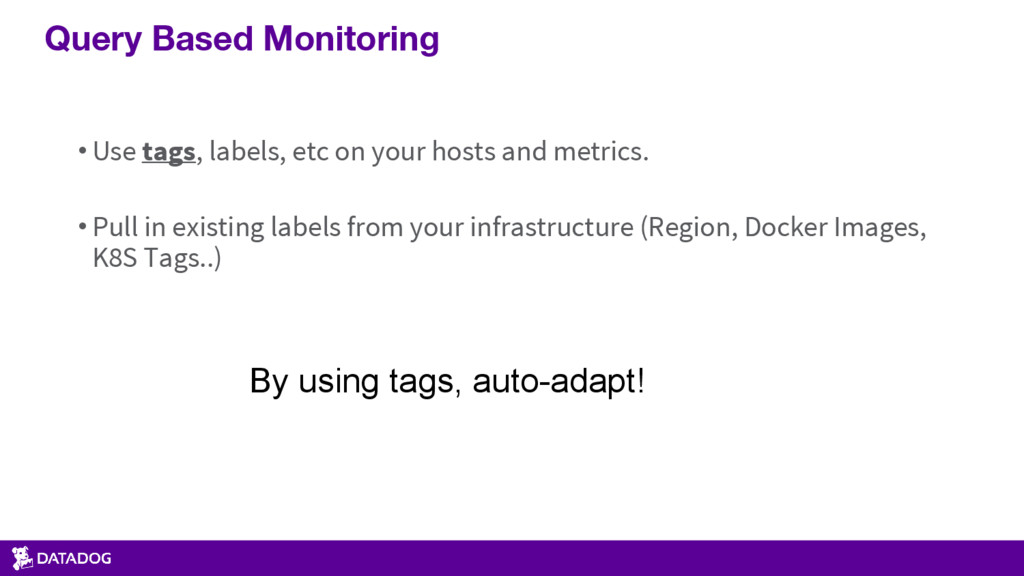
•Use tags, labels, etc on your hosts and metrics. •Pull
in existing labels from your infrastructure (Region, Docker Images, K8S Tags..) Query Based Monitoring By using tags, auto-adapt!
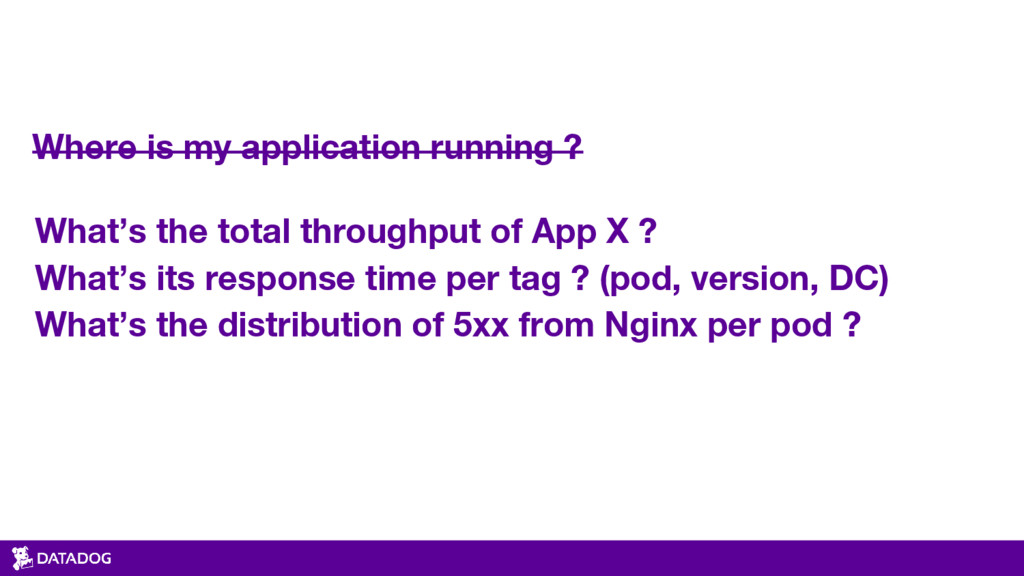
Where is my application running ? What’s the total throughput
of App X ? What’s its response time per tag ? (pod, version, DC) What’s the distribution of 5xx from Nginx per pod ?
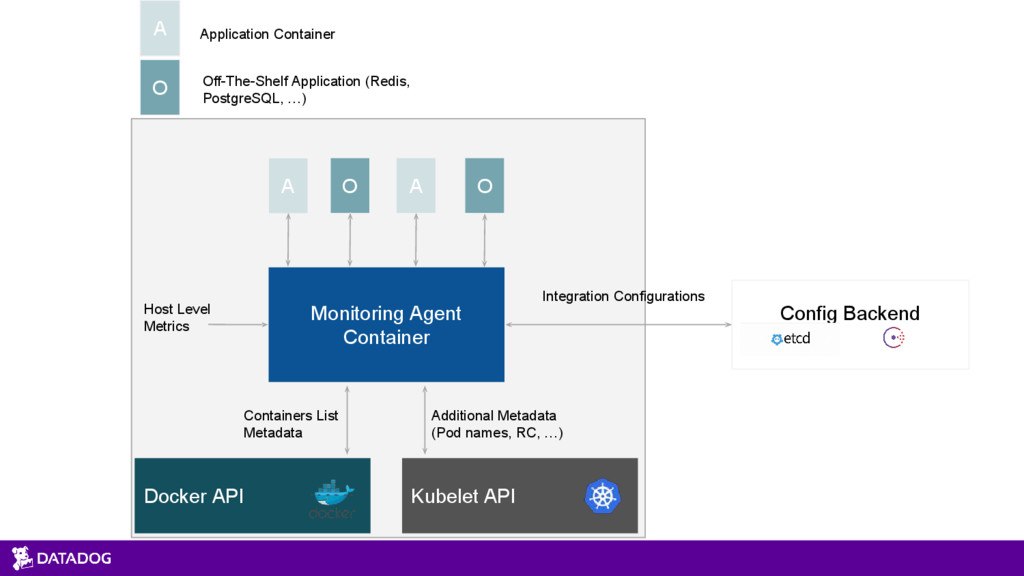
Auto Discovery
Docker API Kubelet API Monitoring Agent Container A O A
O A O Application Container Off-The-Shelf Application (Redis, PostgreSQL, …) Containers List Metadata Additional Metadata (Pod names, RC, …) Config Backend Integration Configurations Host Level Metrics
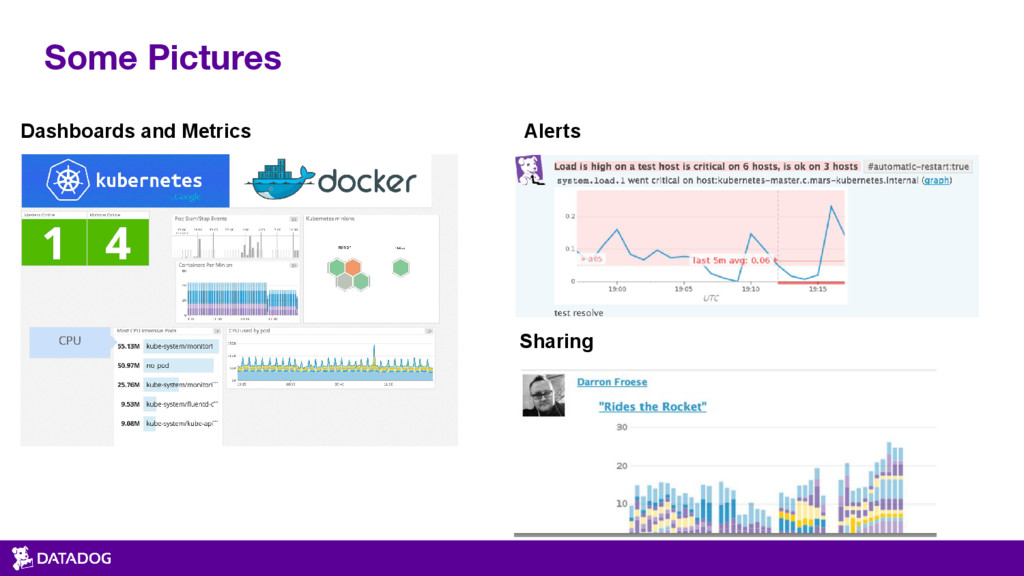
Some Pictures Dashboards and Metrics Alerts Sharing
Demo time