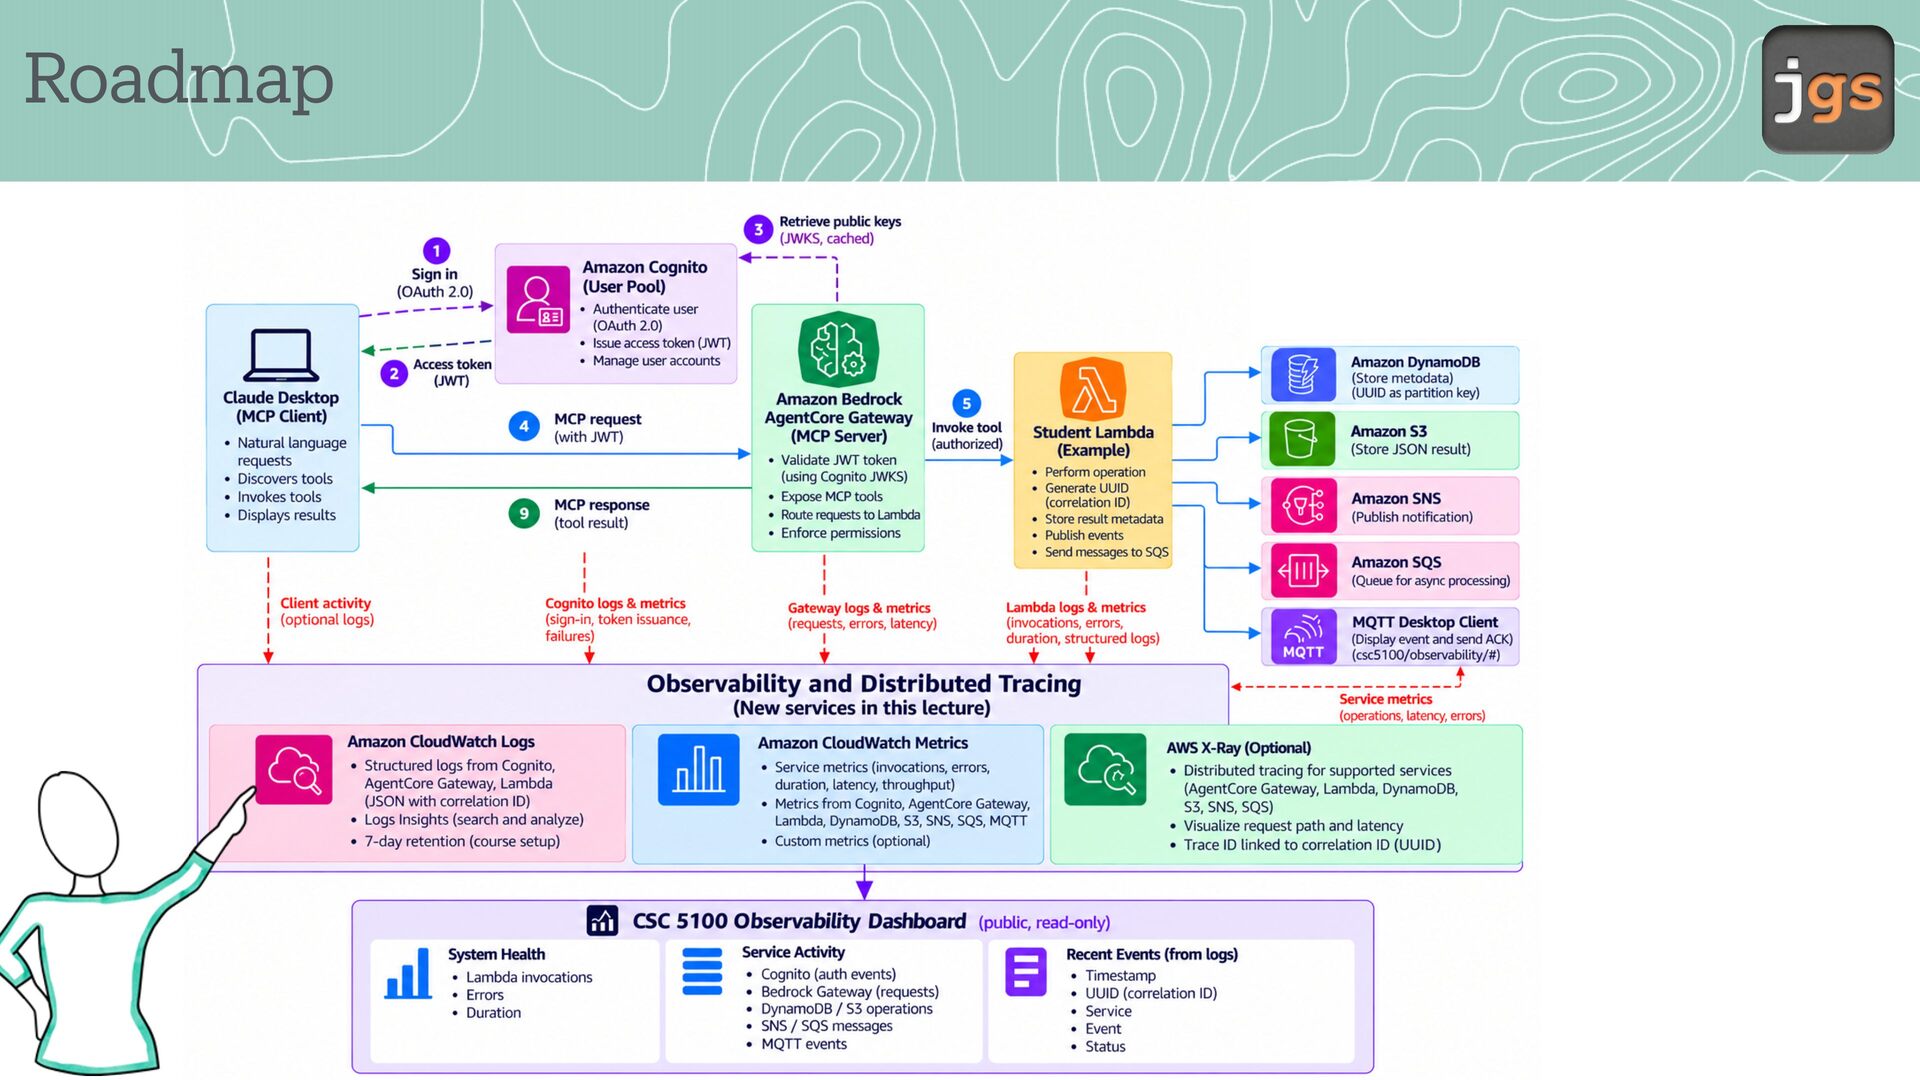
when one service fails? • How do we follow a reading across Lambda, DynamoDB, S3, SNS, SQS, and MQTT? • How can you inspect results without AWS Console credentials? 02
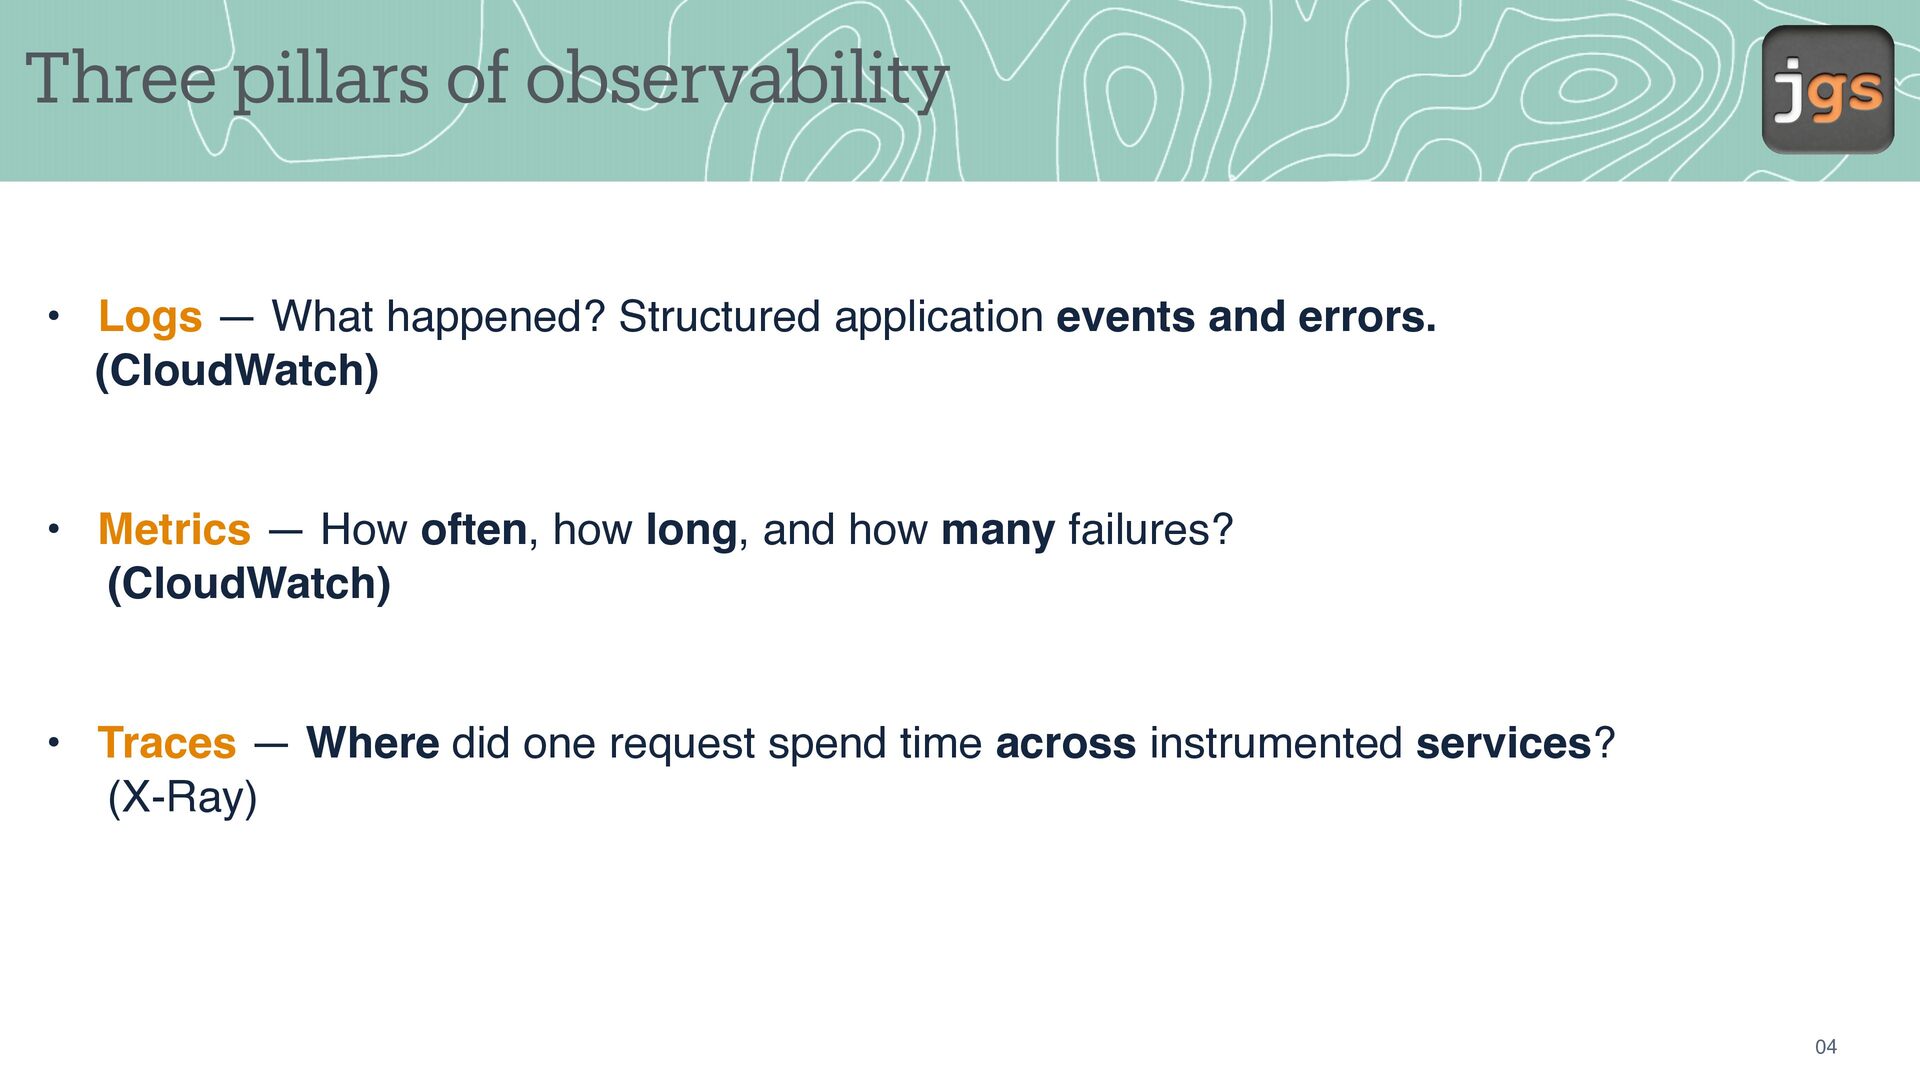
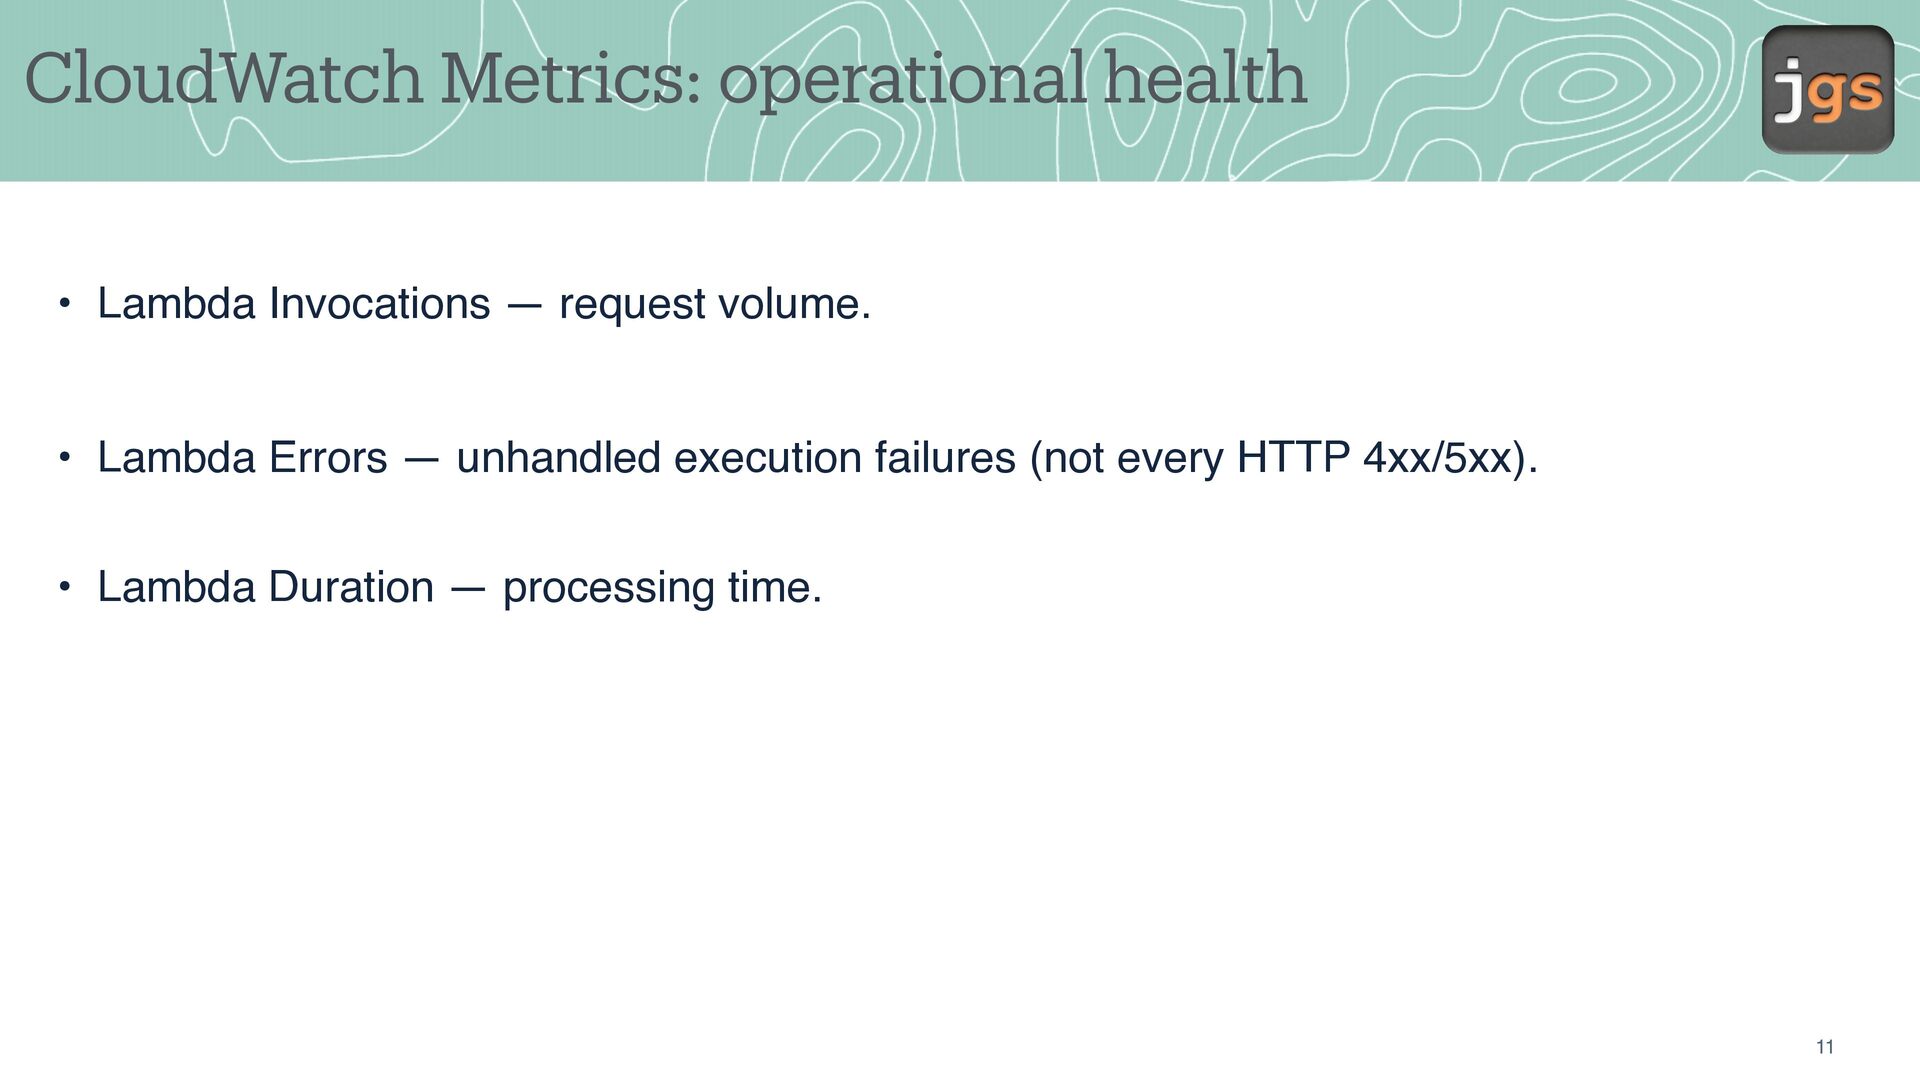
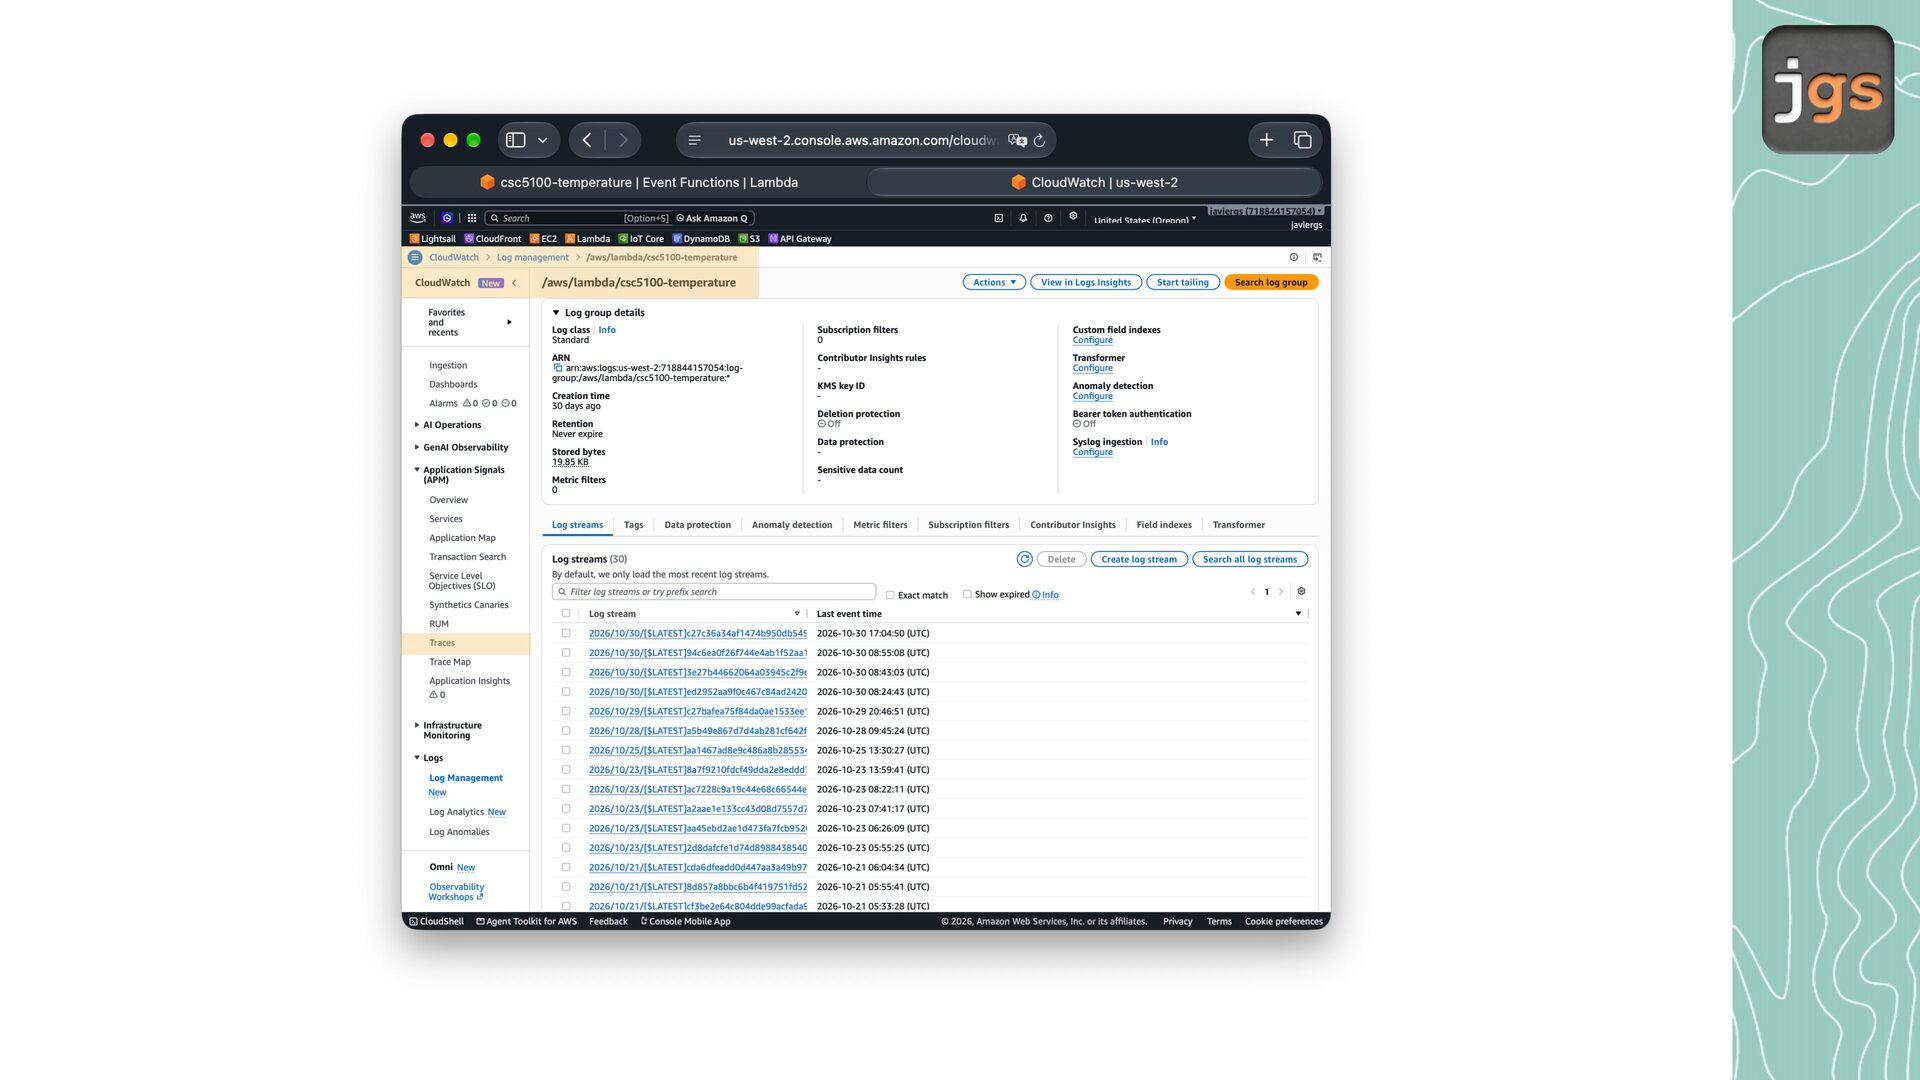
application events and errors. (CloudWatch) • Metrics — How often, how long, and how many failures? (CloudWatch) • Traces — Where did one request spend time across instrumented services? (X-Ray) 04
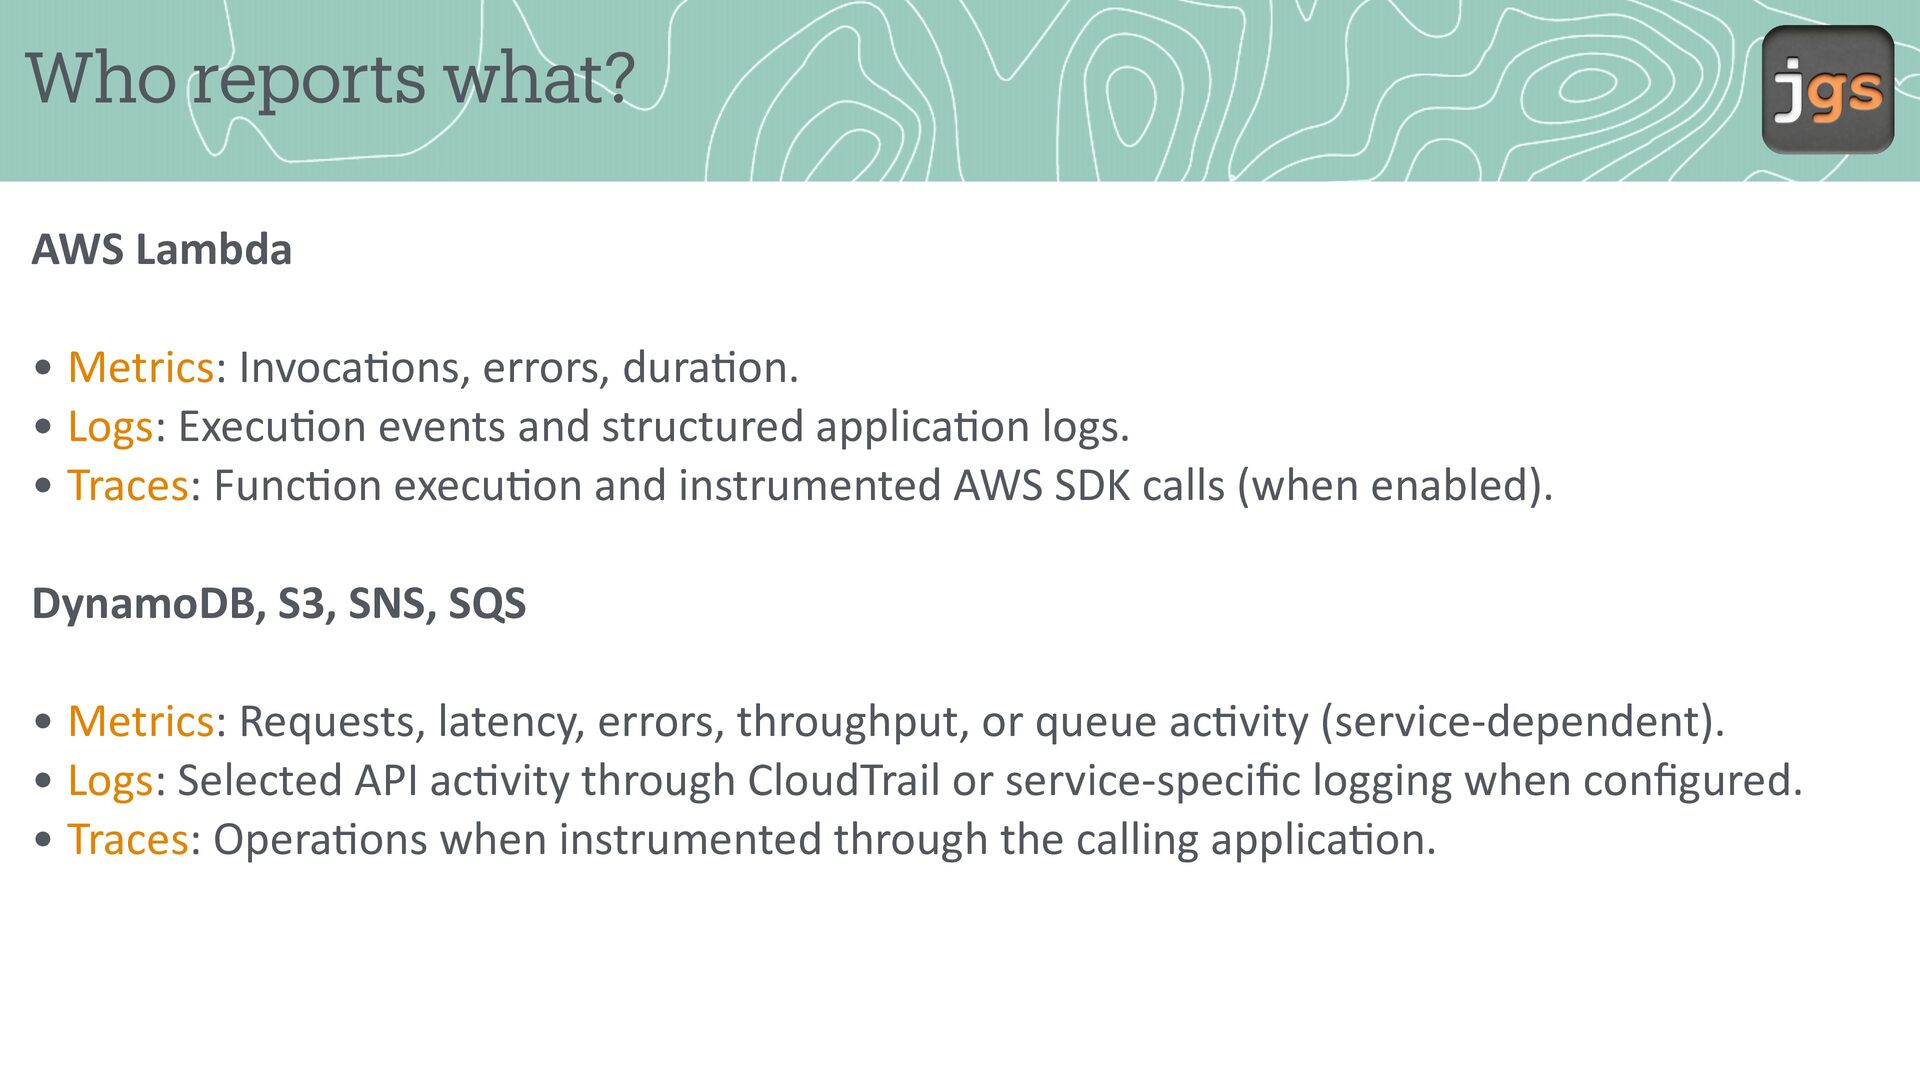
dura on. • Logs: Execu on events and structured applica on logs. • Traces: Func on execu on and instrumented AWS SDK calls (when enabled). DynamoDB, S3, SNS, SQS fi ti fi ti ti ti ti ti ti ti ti ti • Metrics: Requests, latency, errors, throughput, or queue ac vity (service-dependent). • Logs: Selected API ac vity through CloudTrail or service-speci c logging when con gured. • Traces: Opera ons when instrumented through the calling applica on.
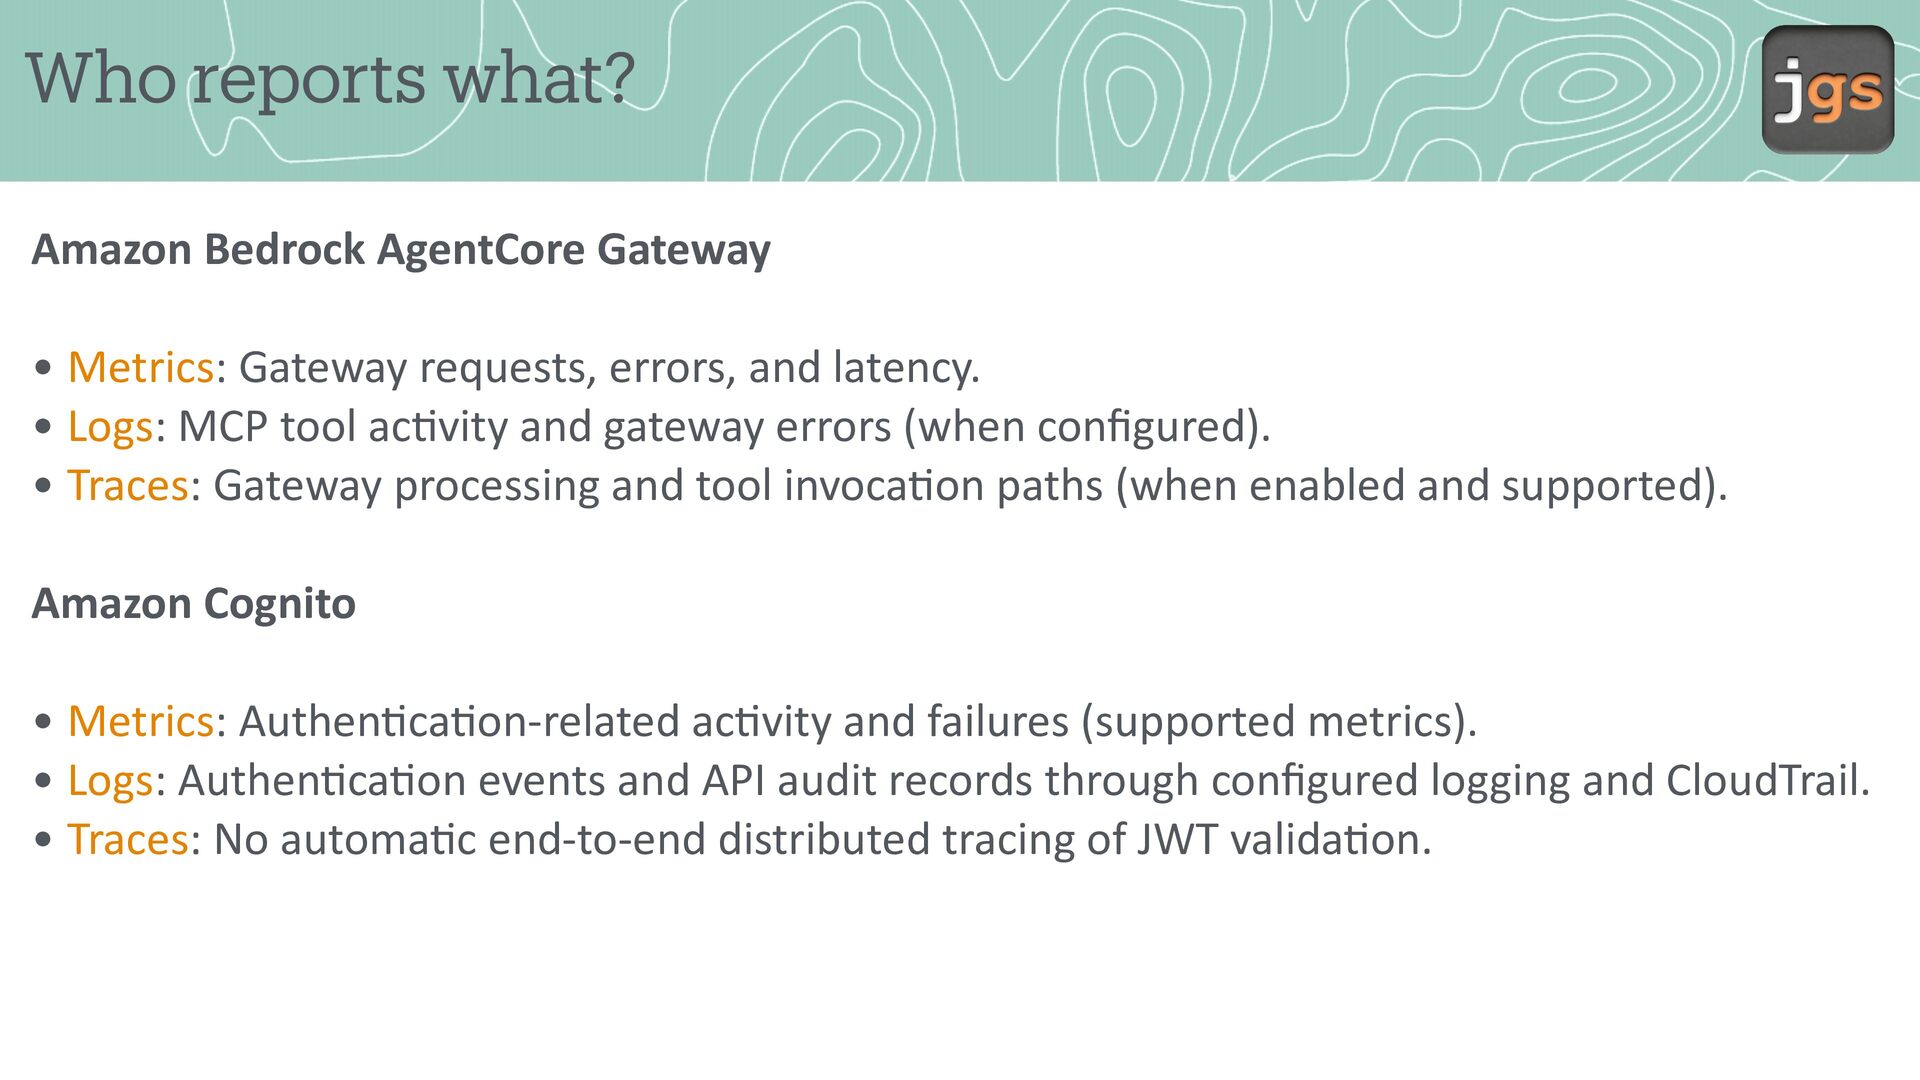
requests, errors, and latency. • Logs: MCP tool ac vity and gateway errors (when con gured). • Traces: Gateway processing and tool invoca on paths (when enabled and supported). Amazon Cognito ti fi fi ti ti ti ti ti ti ti ti • Metrics: Authen ca on-related ac vity and failures (supported metrics). • Logs: Authen ca on events and API audit records through con gured logging and CloudTrail. • Traces: No automa c end-to-end distributed tracing of JWT valida on.
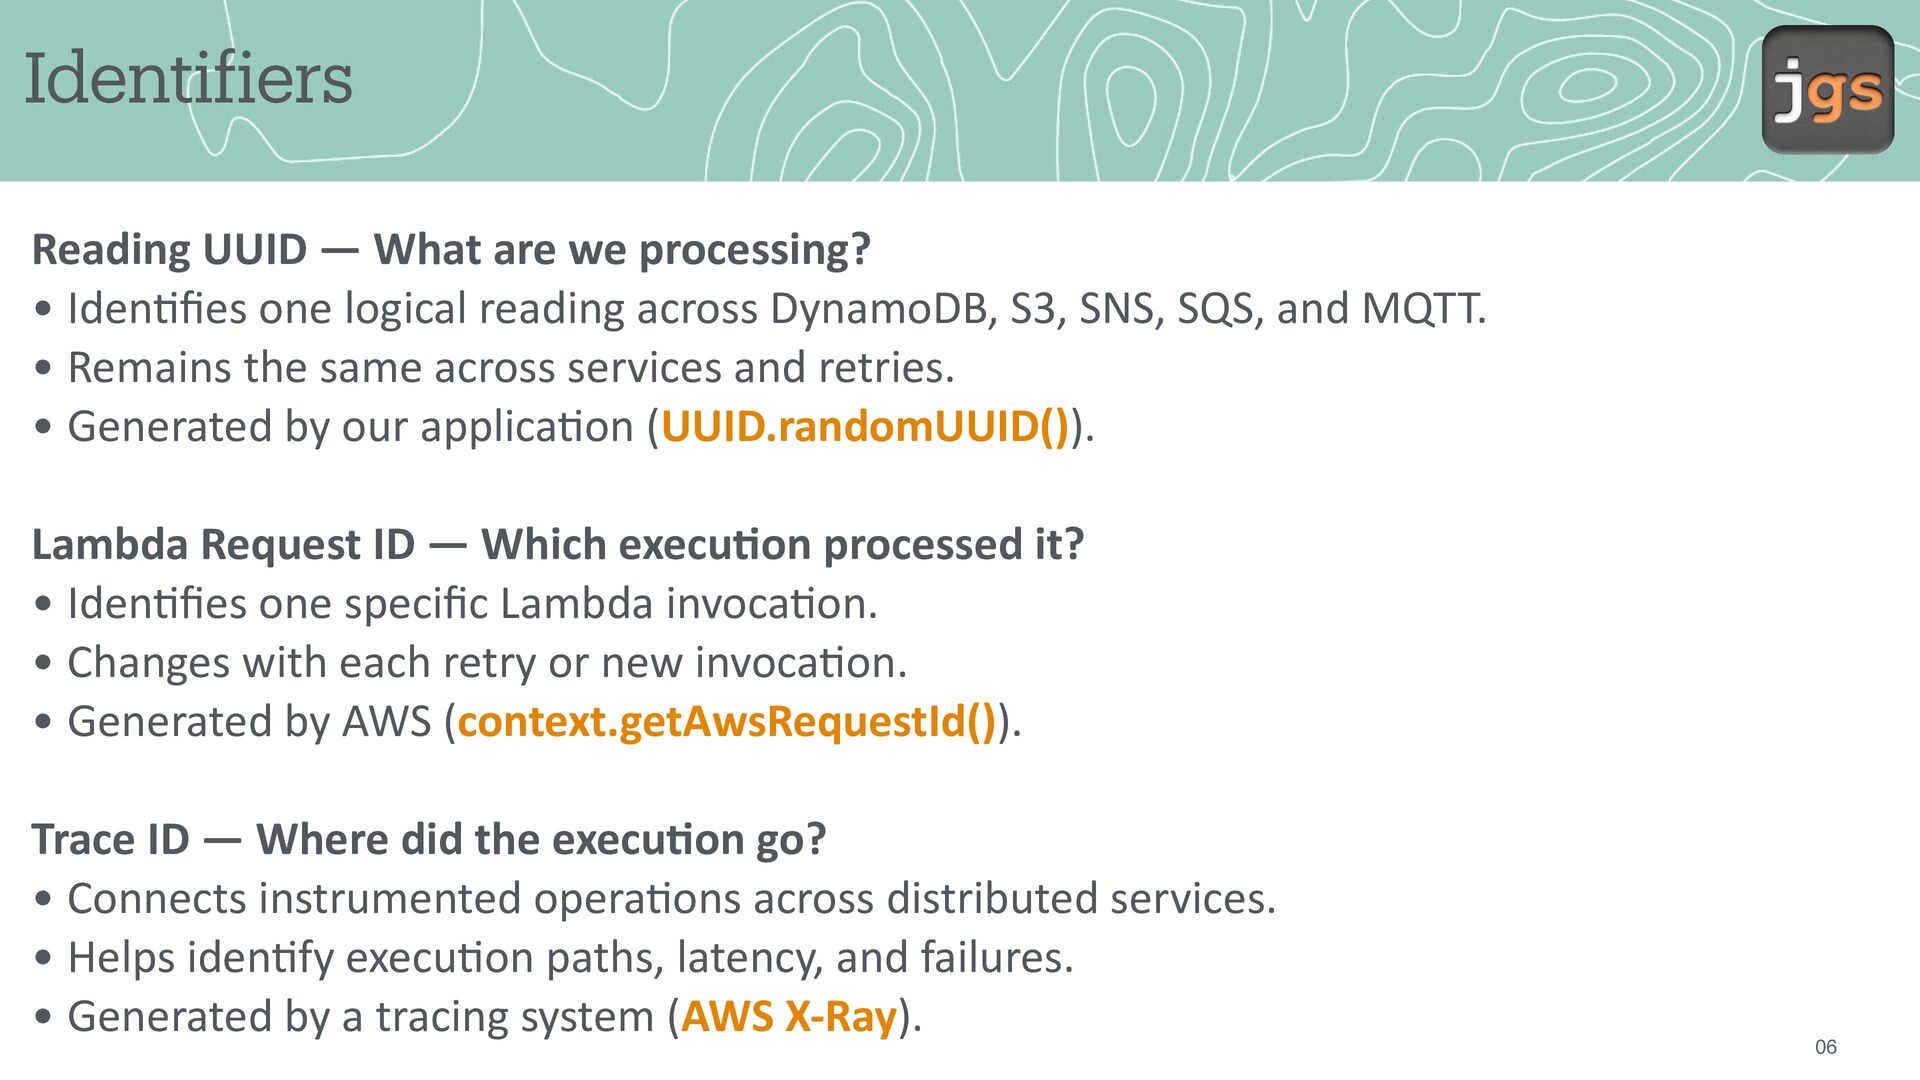
Iden es one logical reading across DynamoDB, S3, SNS, SQS, and MQTT. • Remains the same across services and retries. • Generated by our applica on (UUID.randomUUID()). Lambda Request ID — Which execu on processed it? • Iden es one speci c Lambda invoca on. • Changes with each retry or new invoca on. • Generated by AWS (context.getAwsRequestId()). ti ti ti ti ti ti ti fi ti f fi fi ti ti Trace ID — Where did the execu on go? • Connects instrumented opera ons across distributed services. • Helps iden fy execu on paths, latency, and failures. • Generated by a tracing system (AWS X-Ray). 06
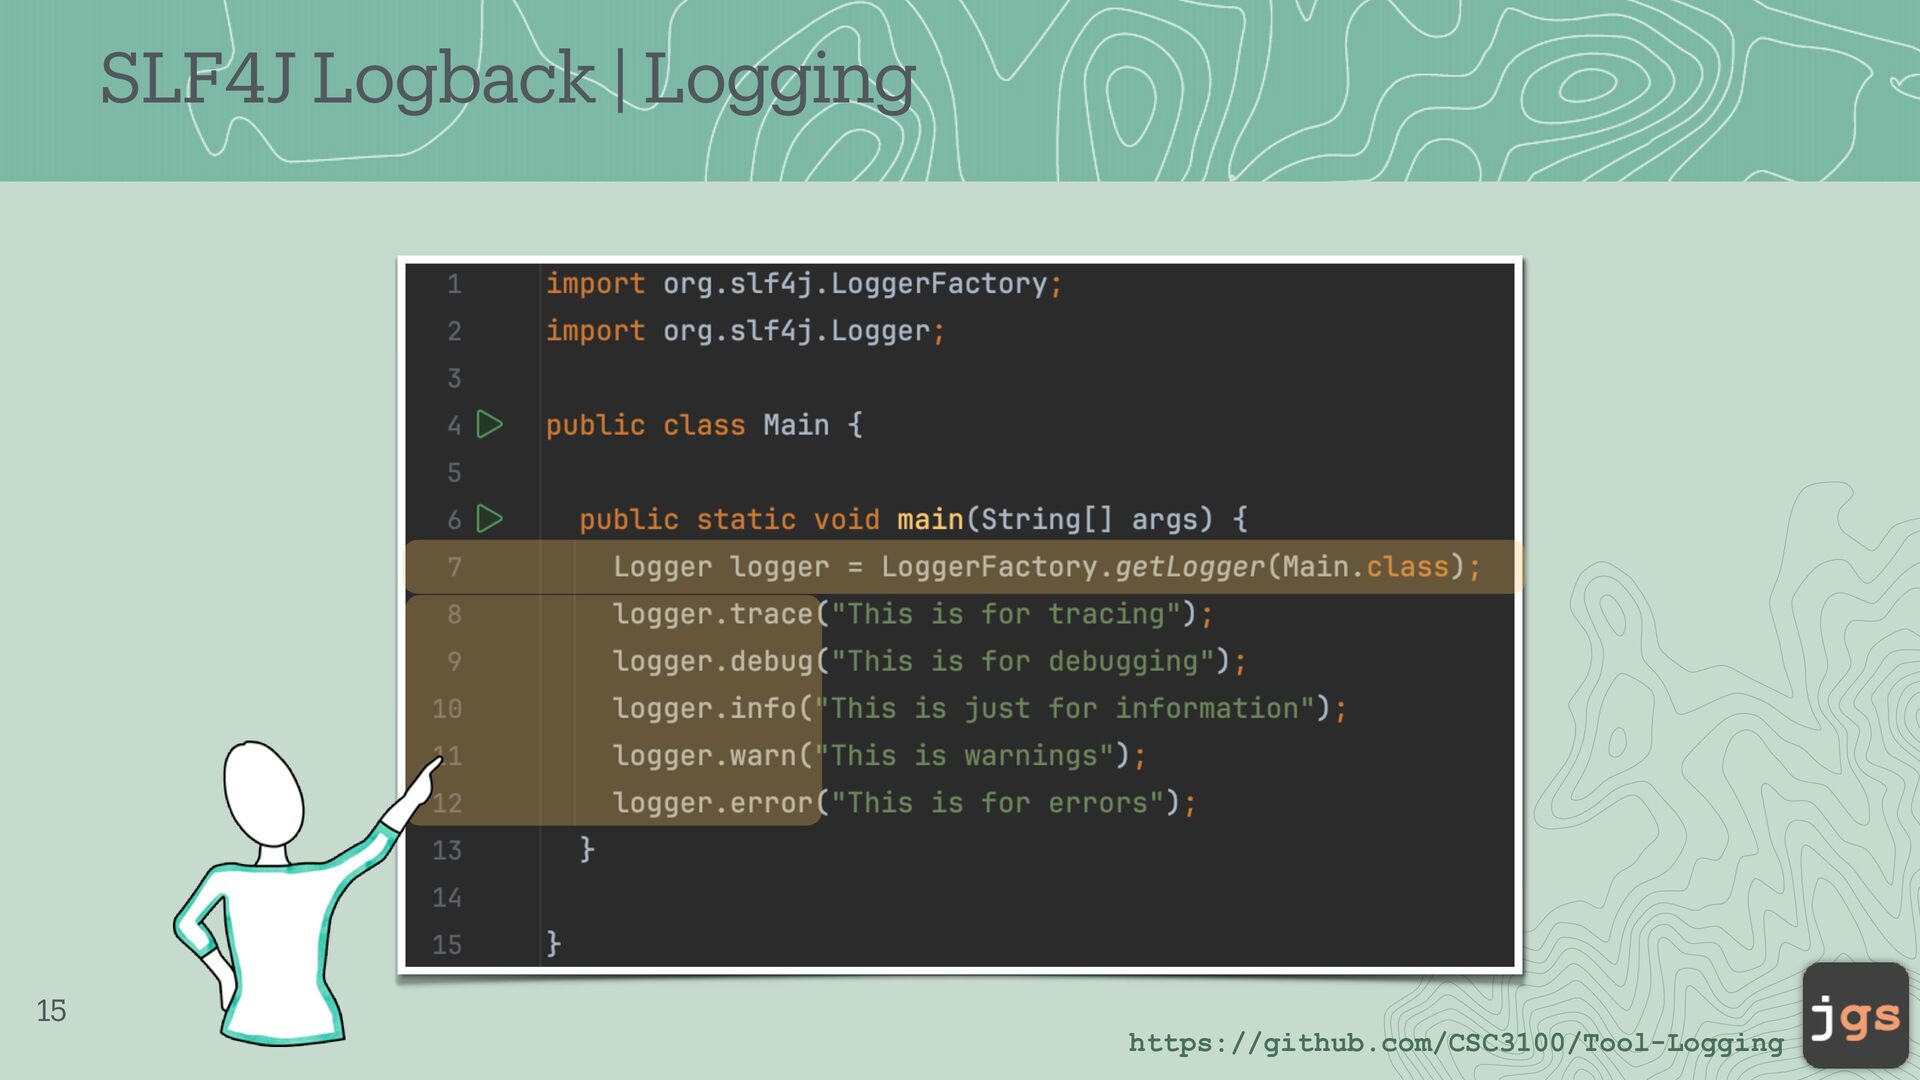
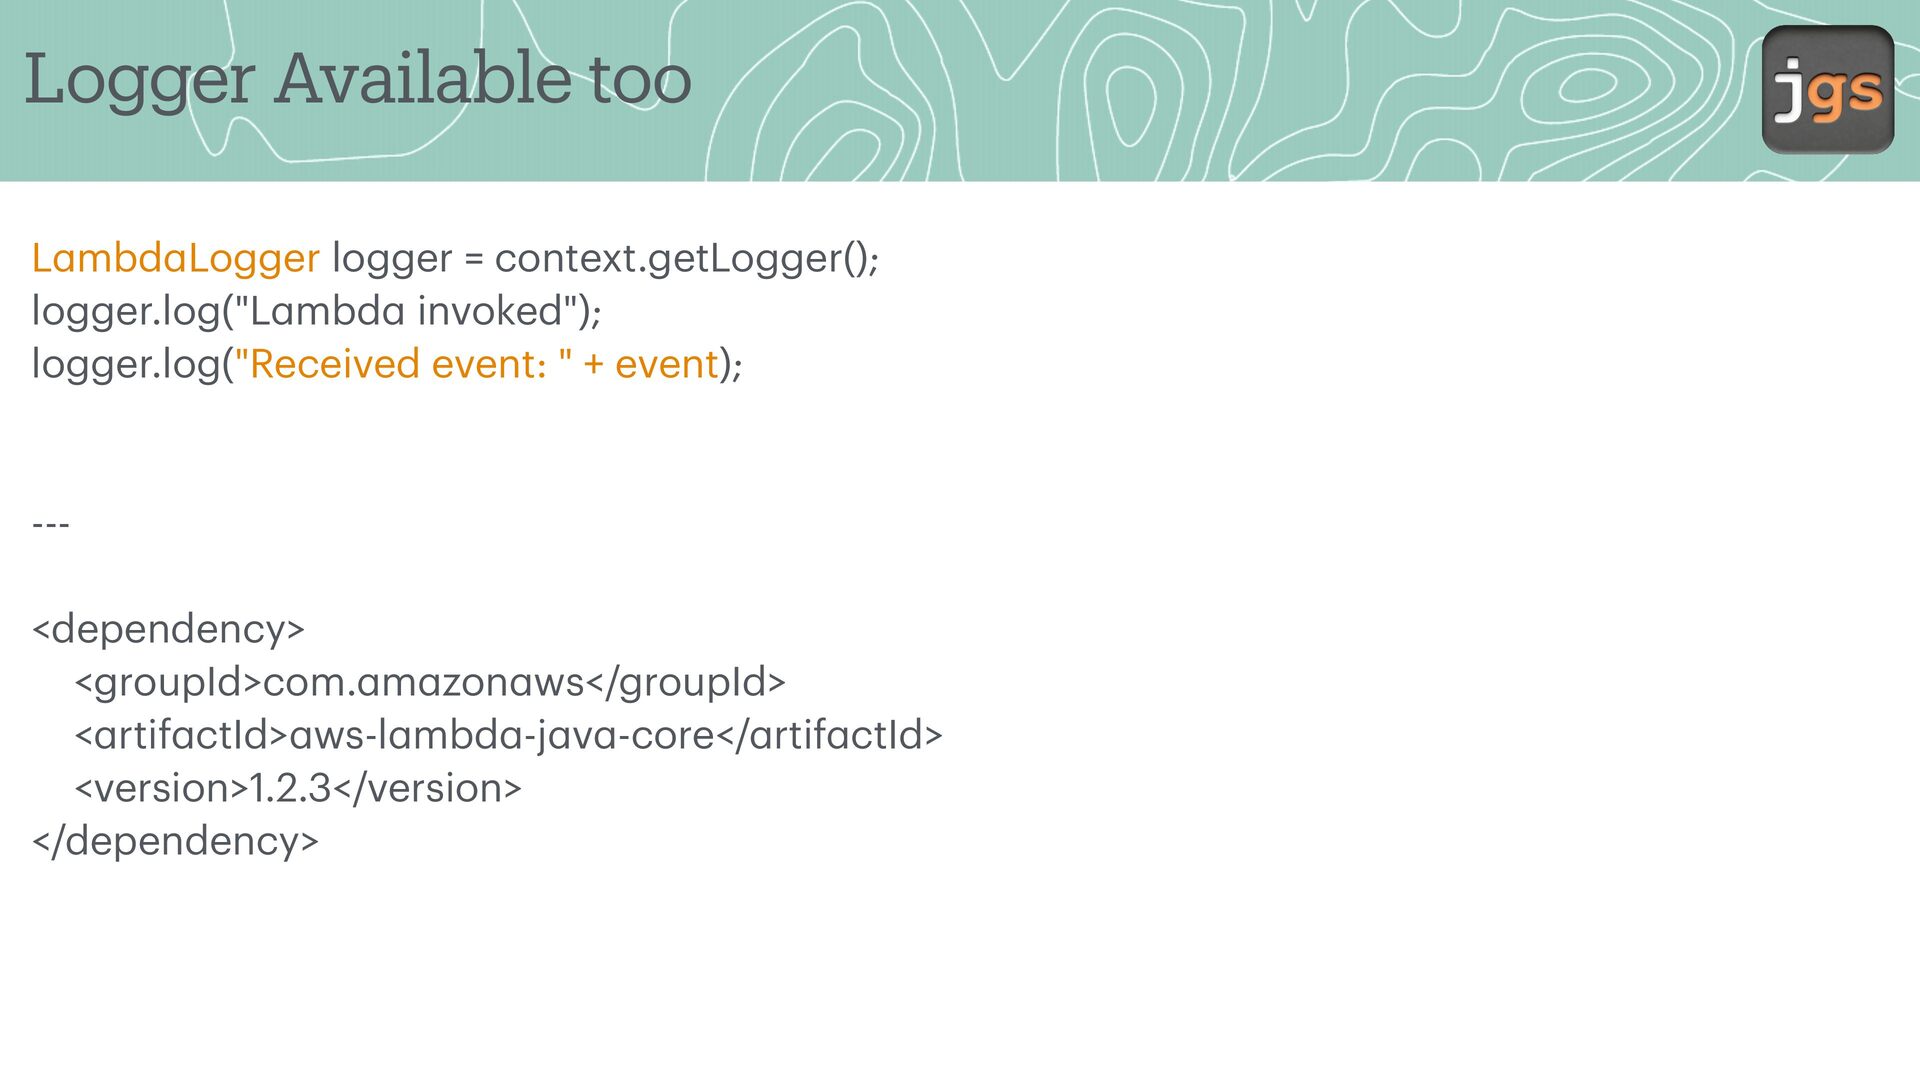
mbd invoked"); logger.log("Received event: " + event); --- a a a a a a a a a a a a a a a a <dependency> <groupId>com. m zon ws</groupId> < rtif ctId> ws-l mbd -j v -core</ rtif ctId> <version>1.2.3</version> </dependency>
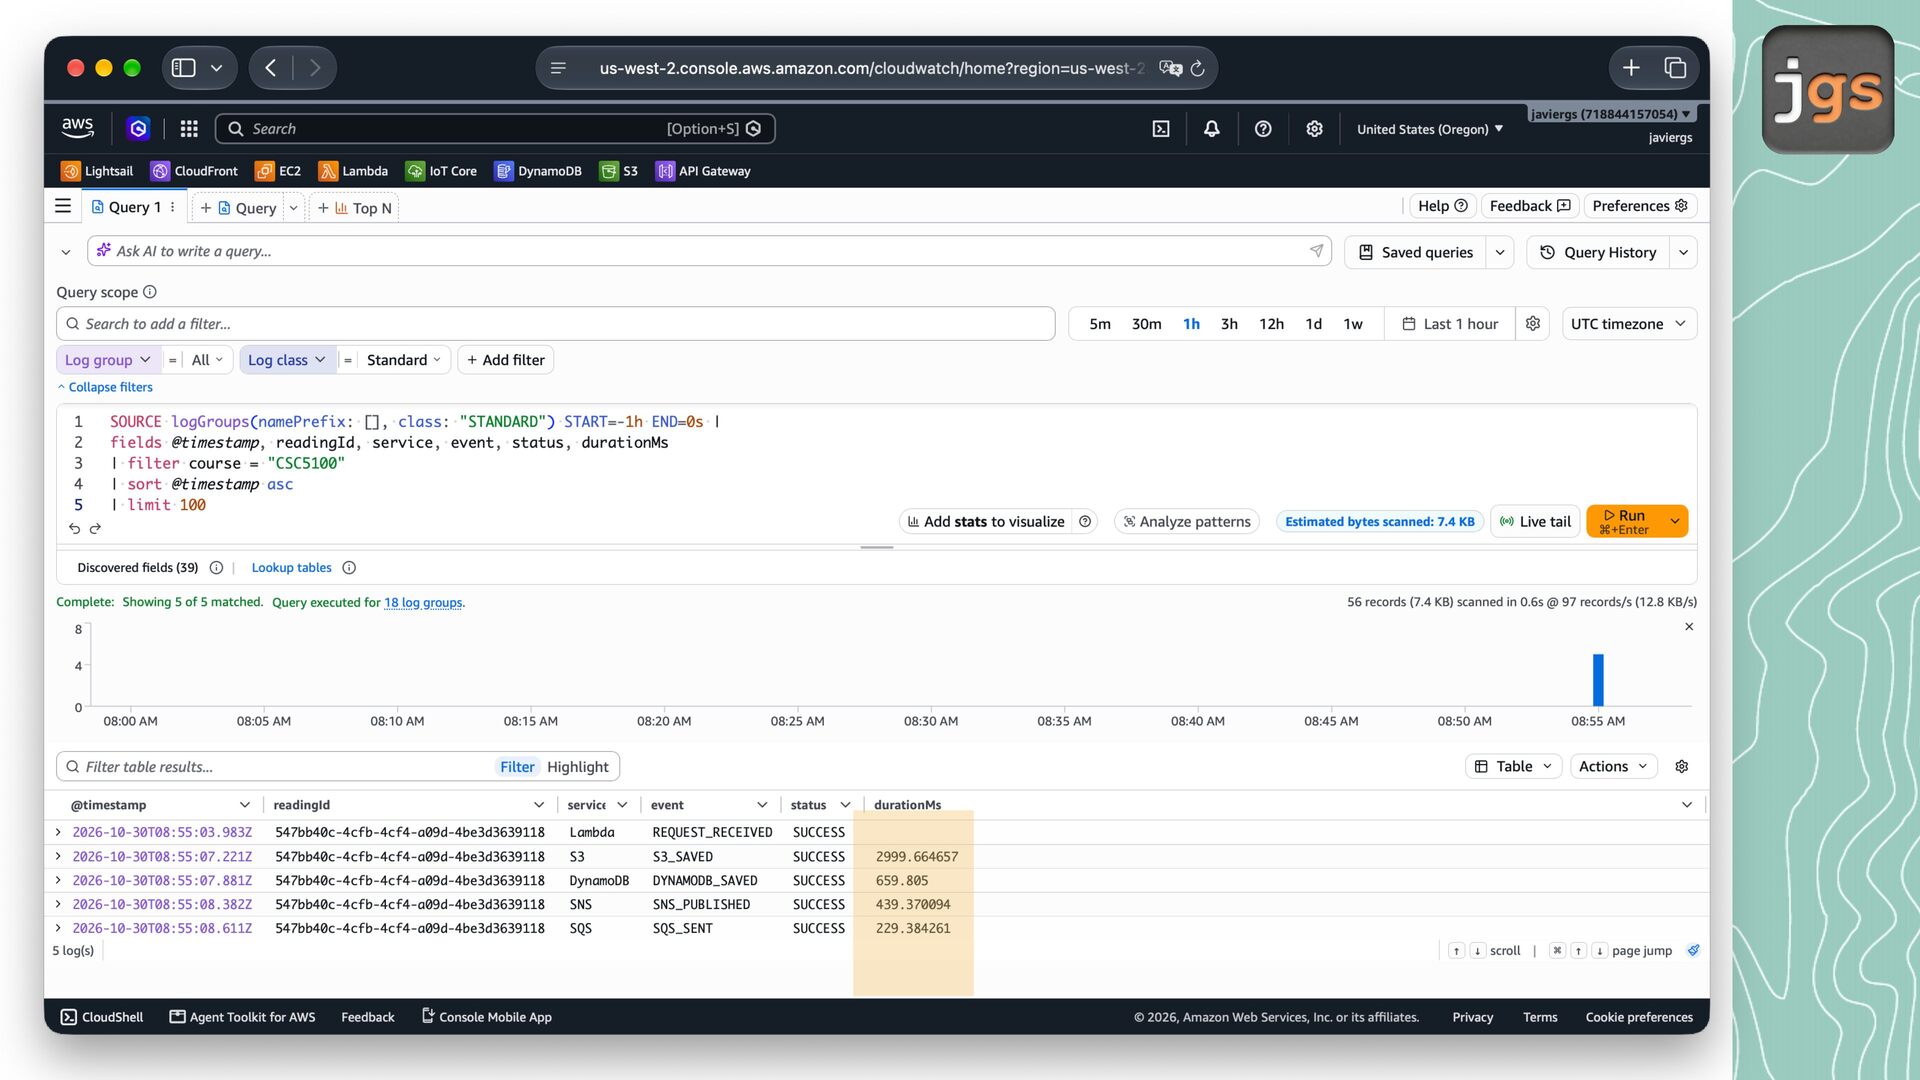
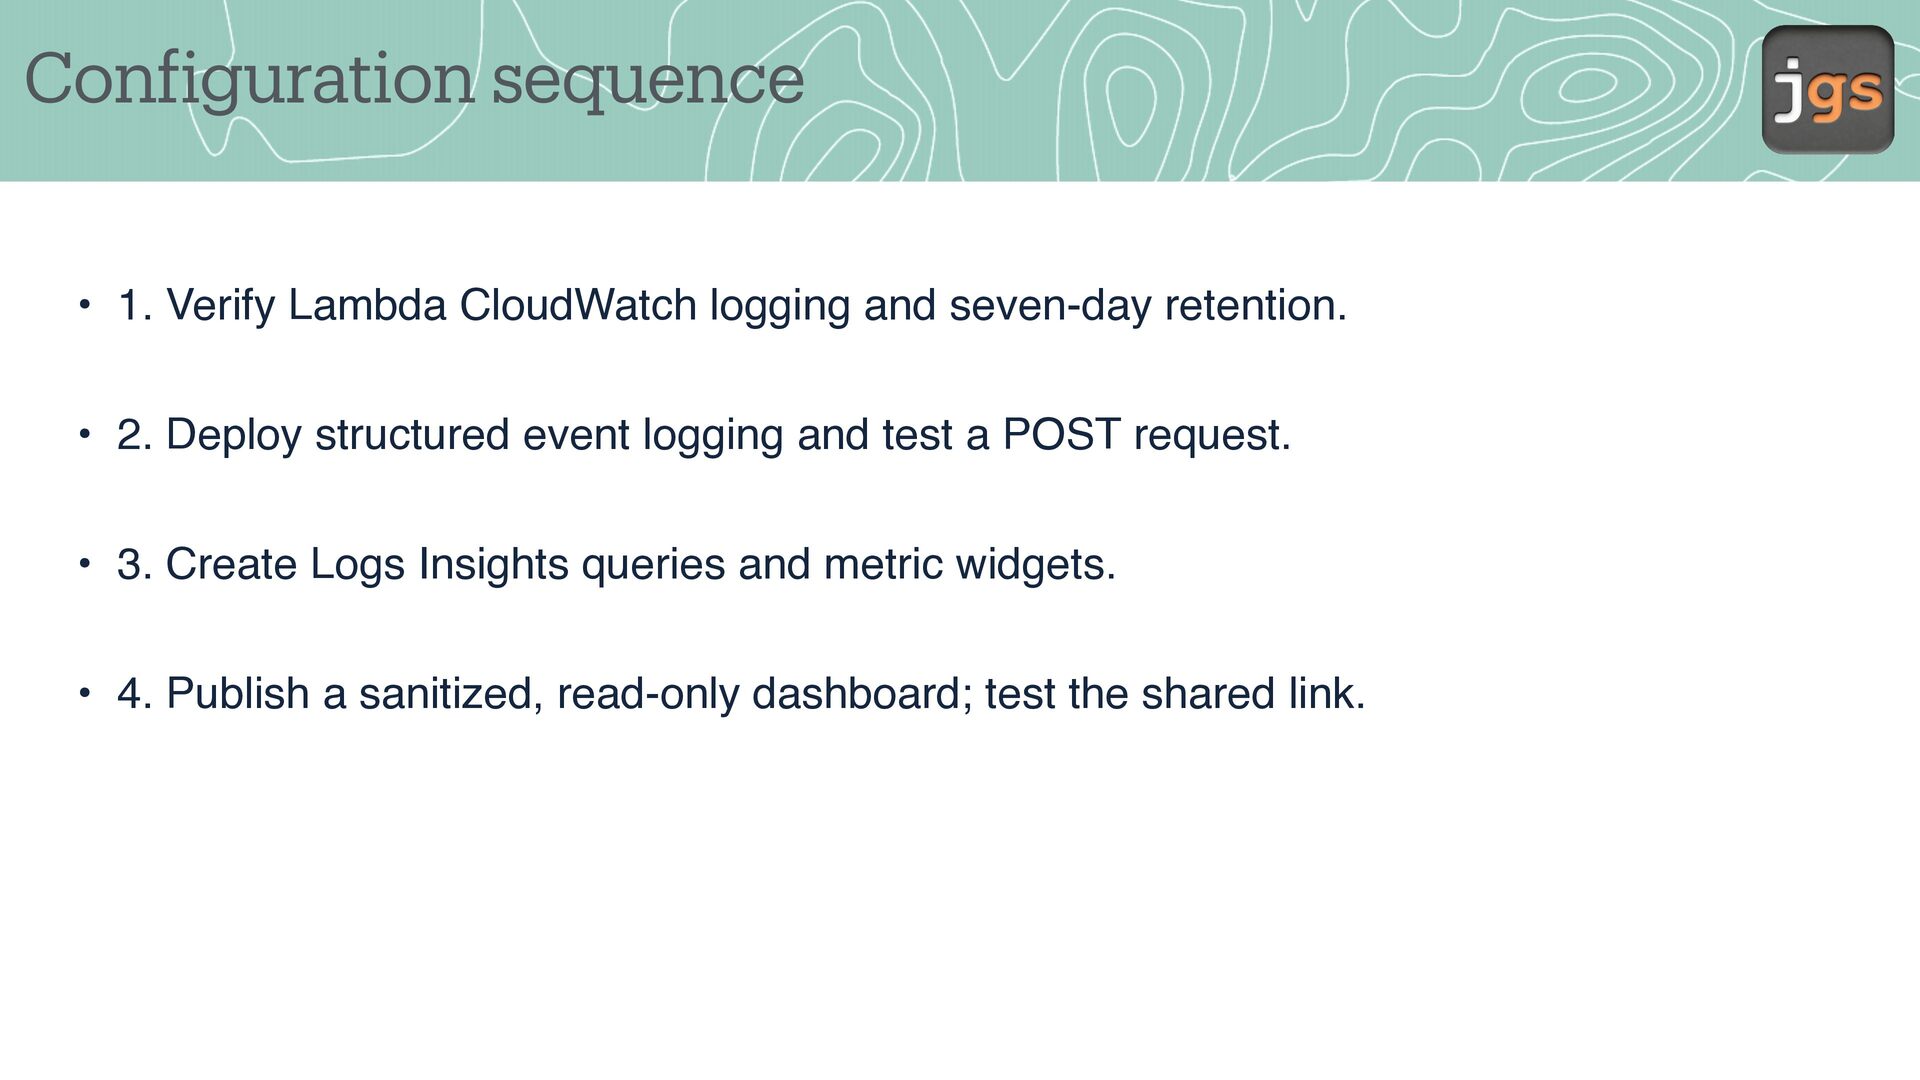
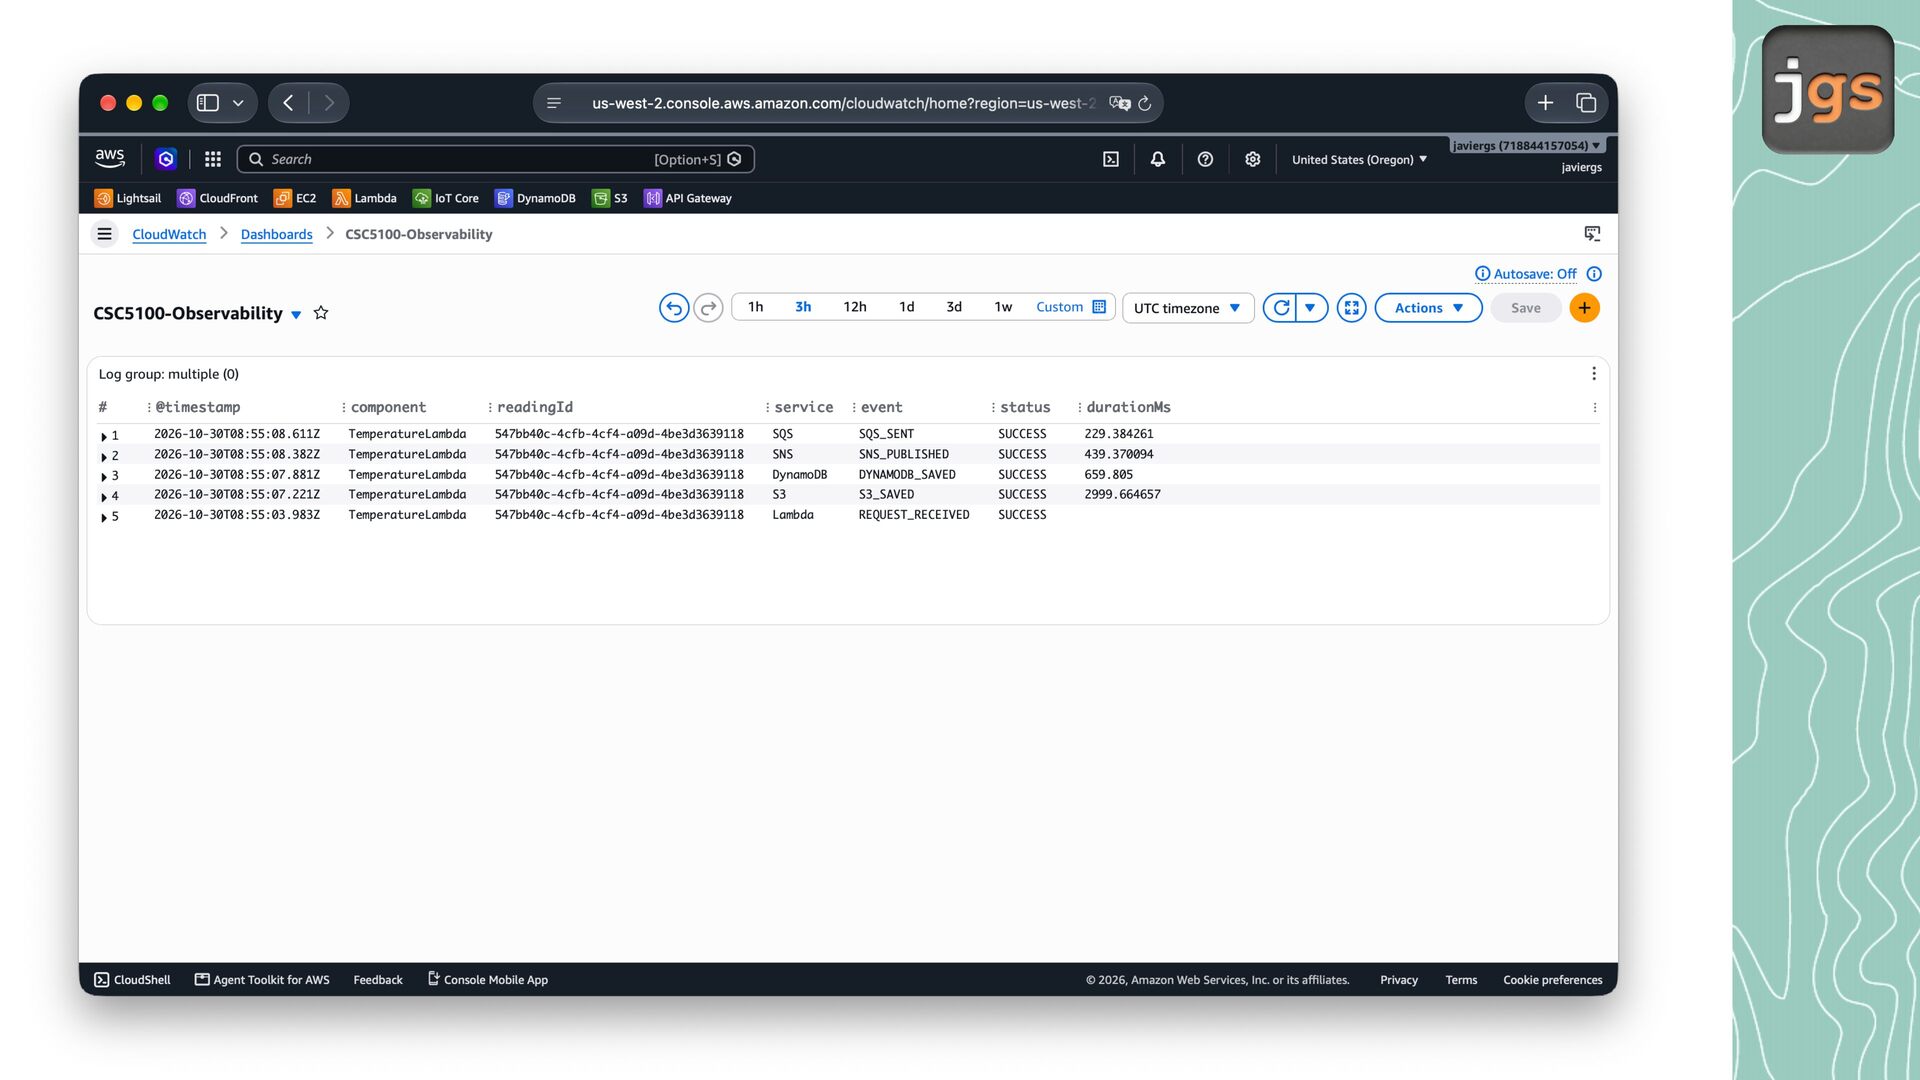
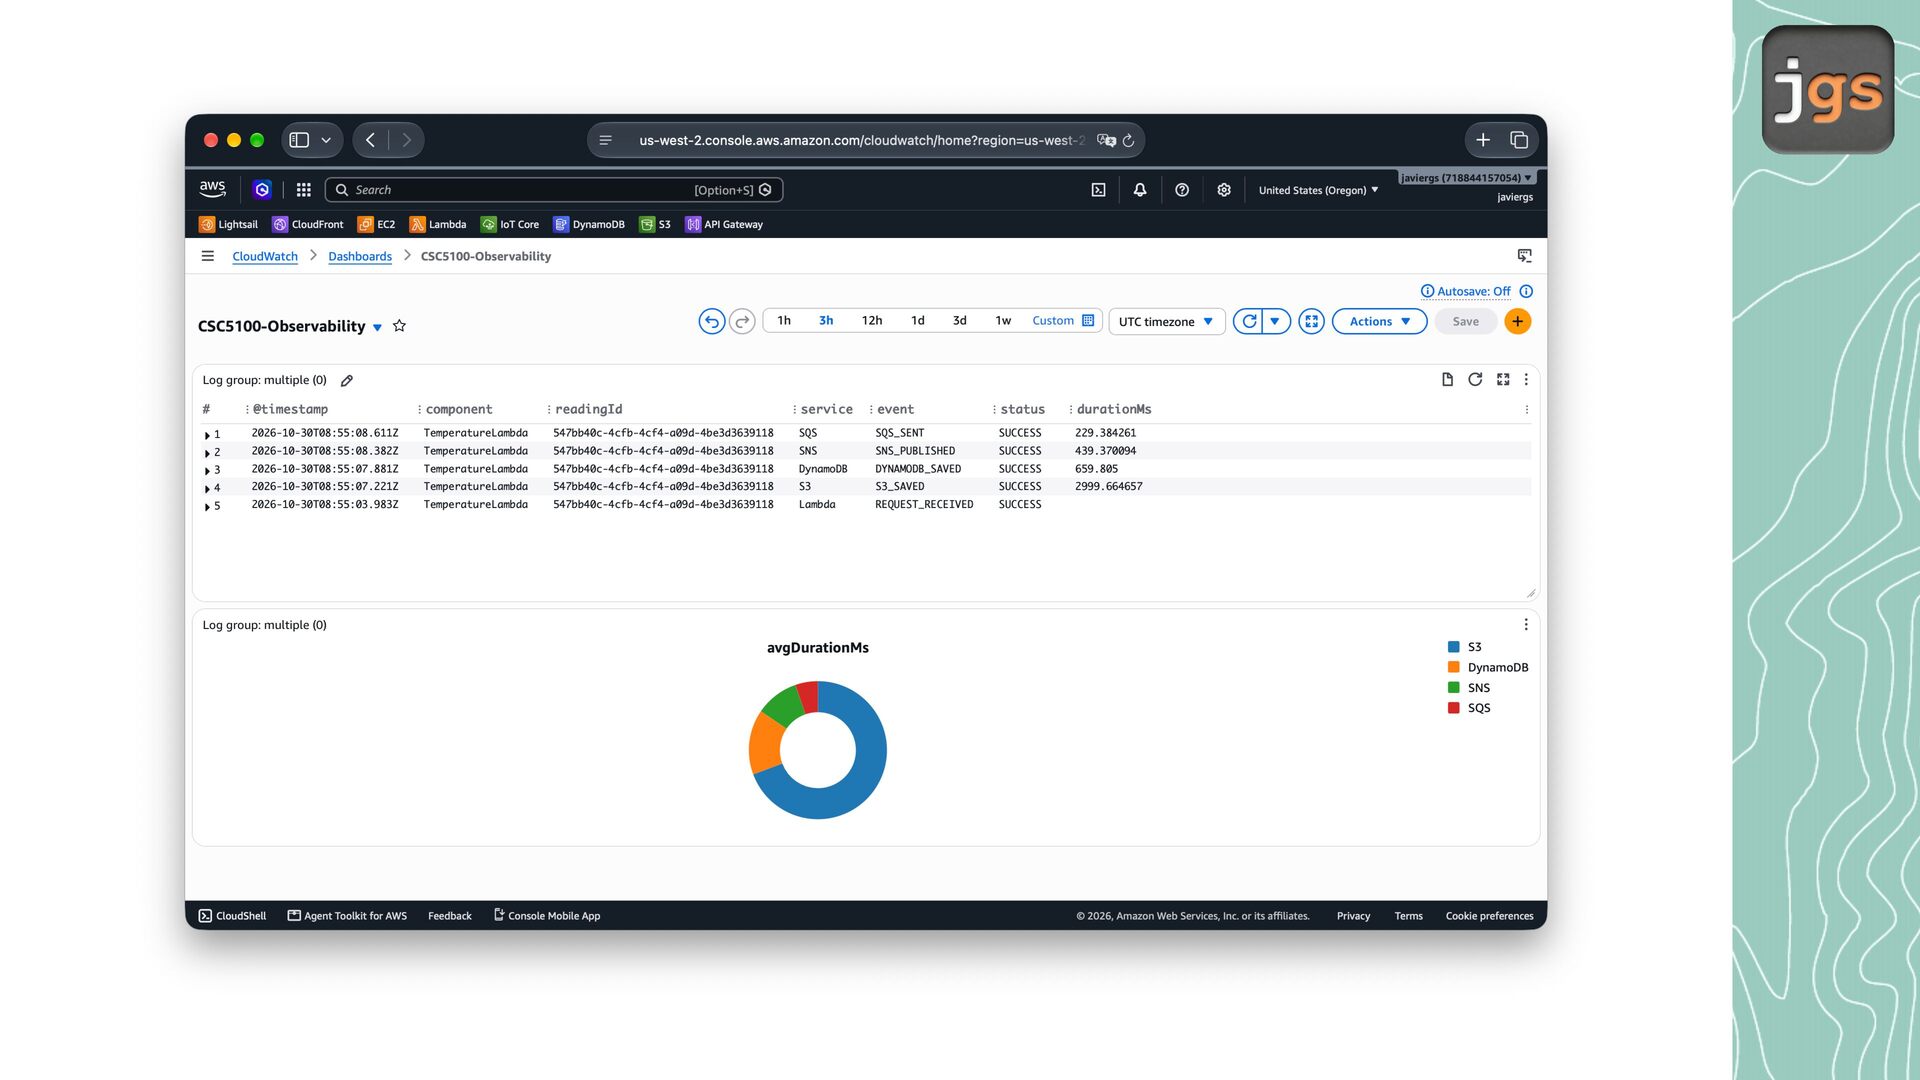
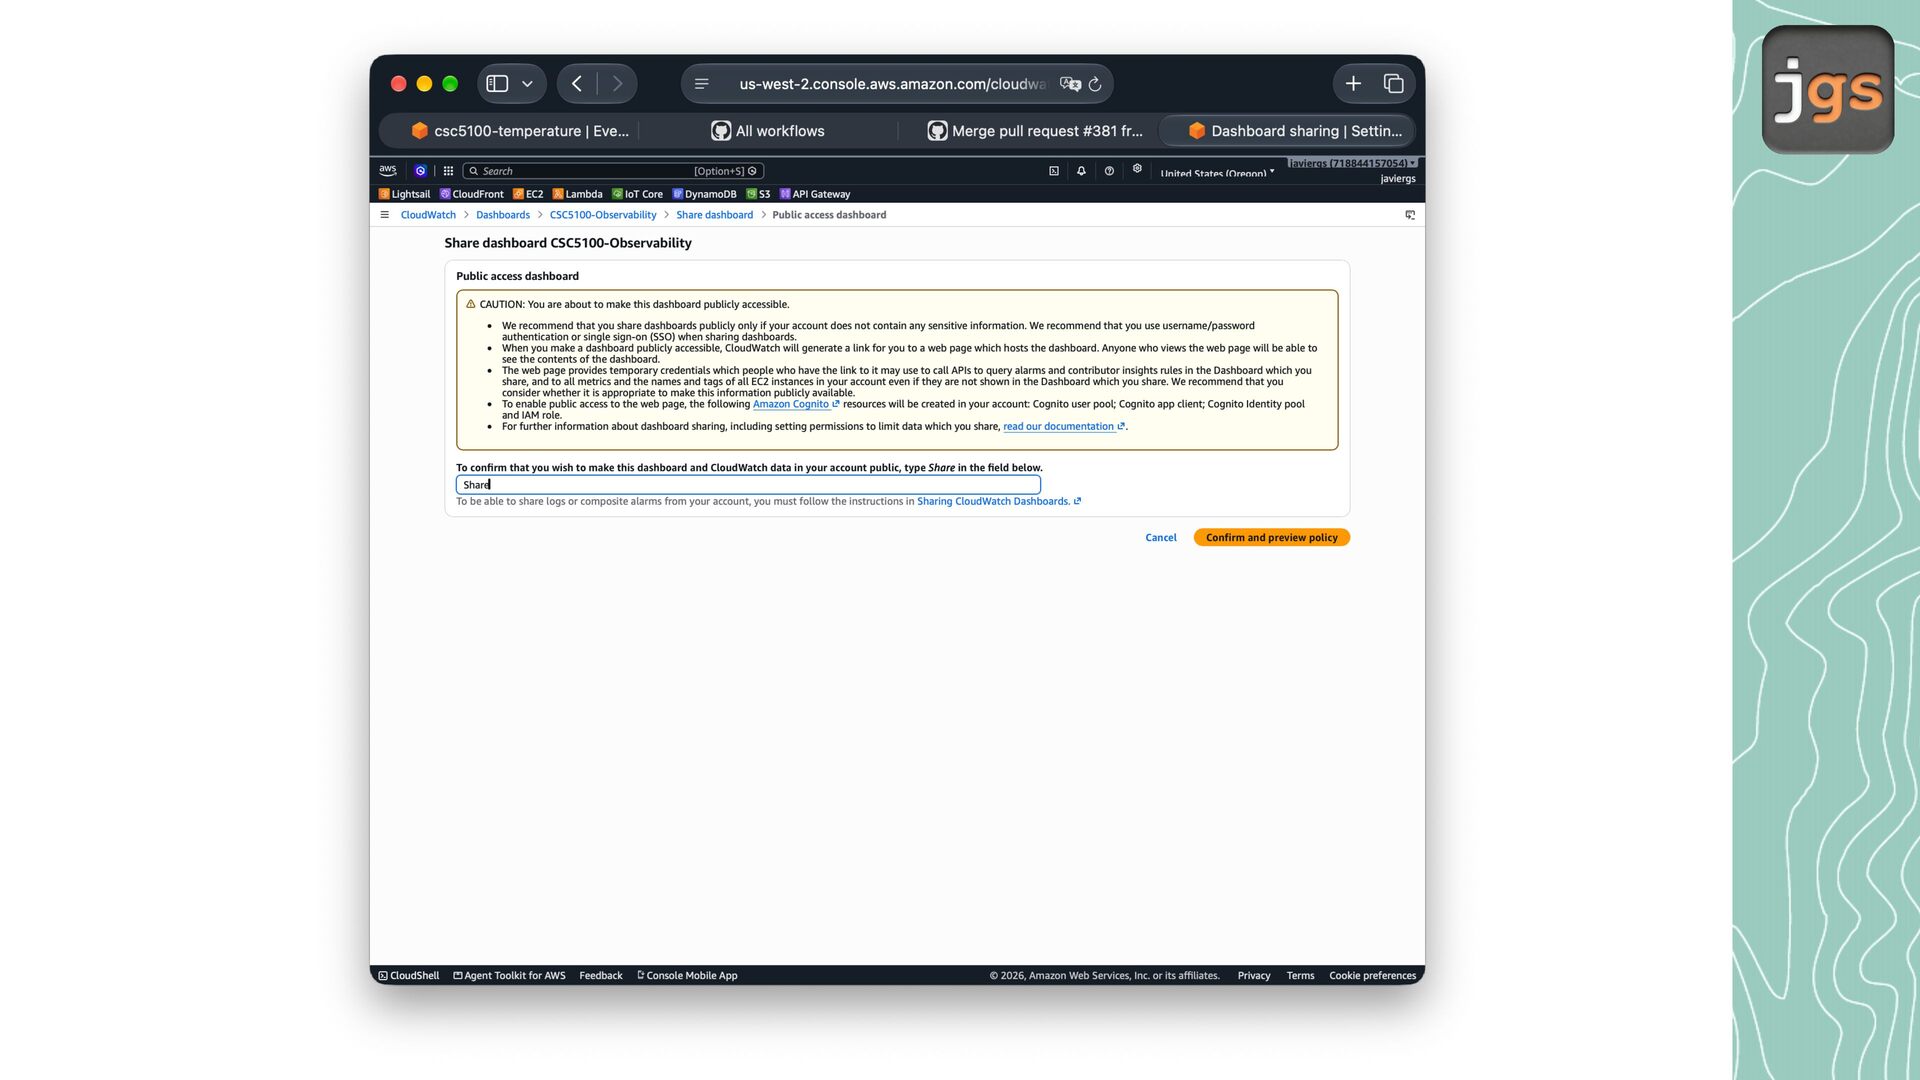
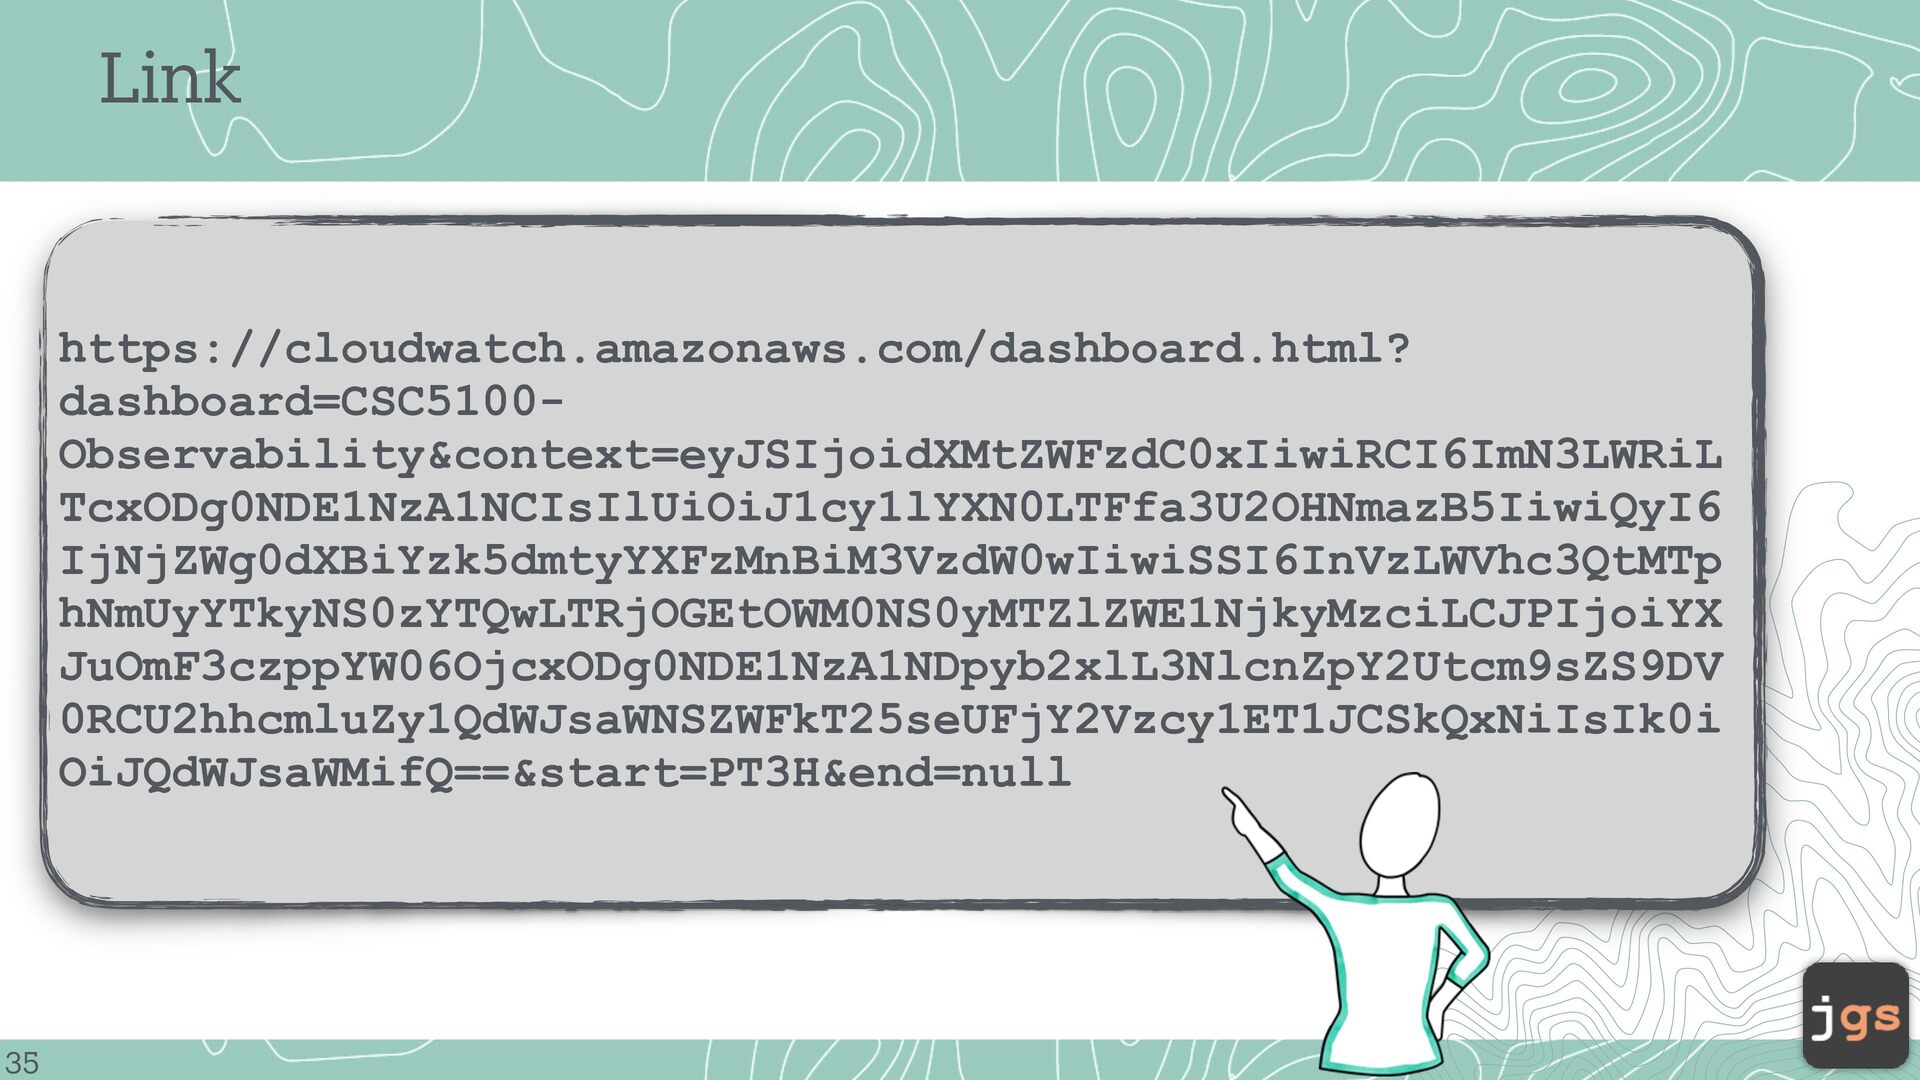
seven-day retention. • 2. Deploy structured event logging and test a POST request. • 3. Create Logs Insights queries and metric widgets. f • 4. Publish a sanitized, read-only dashboard; test the shared link.
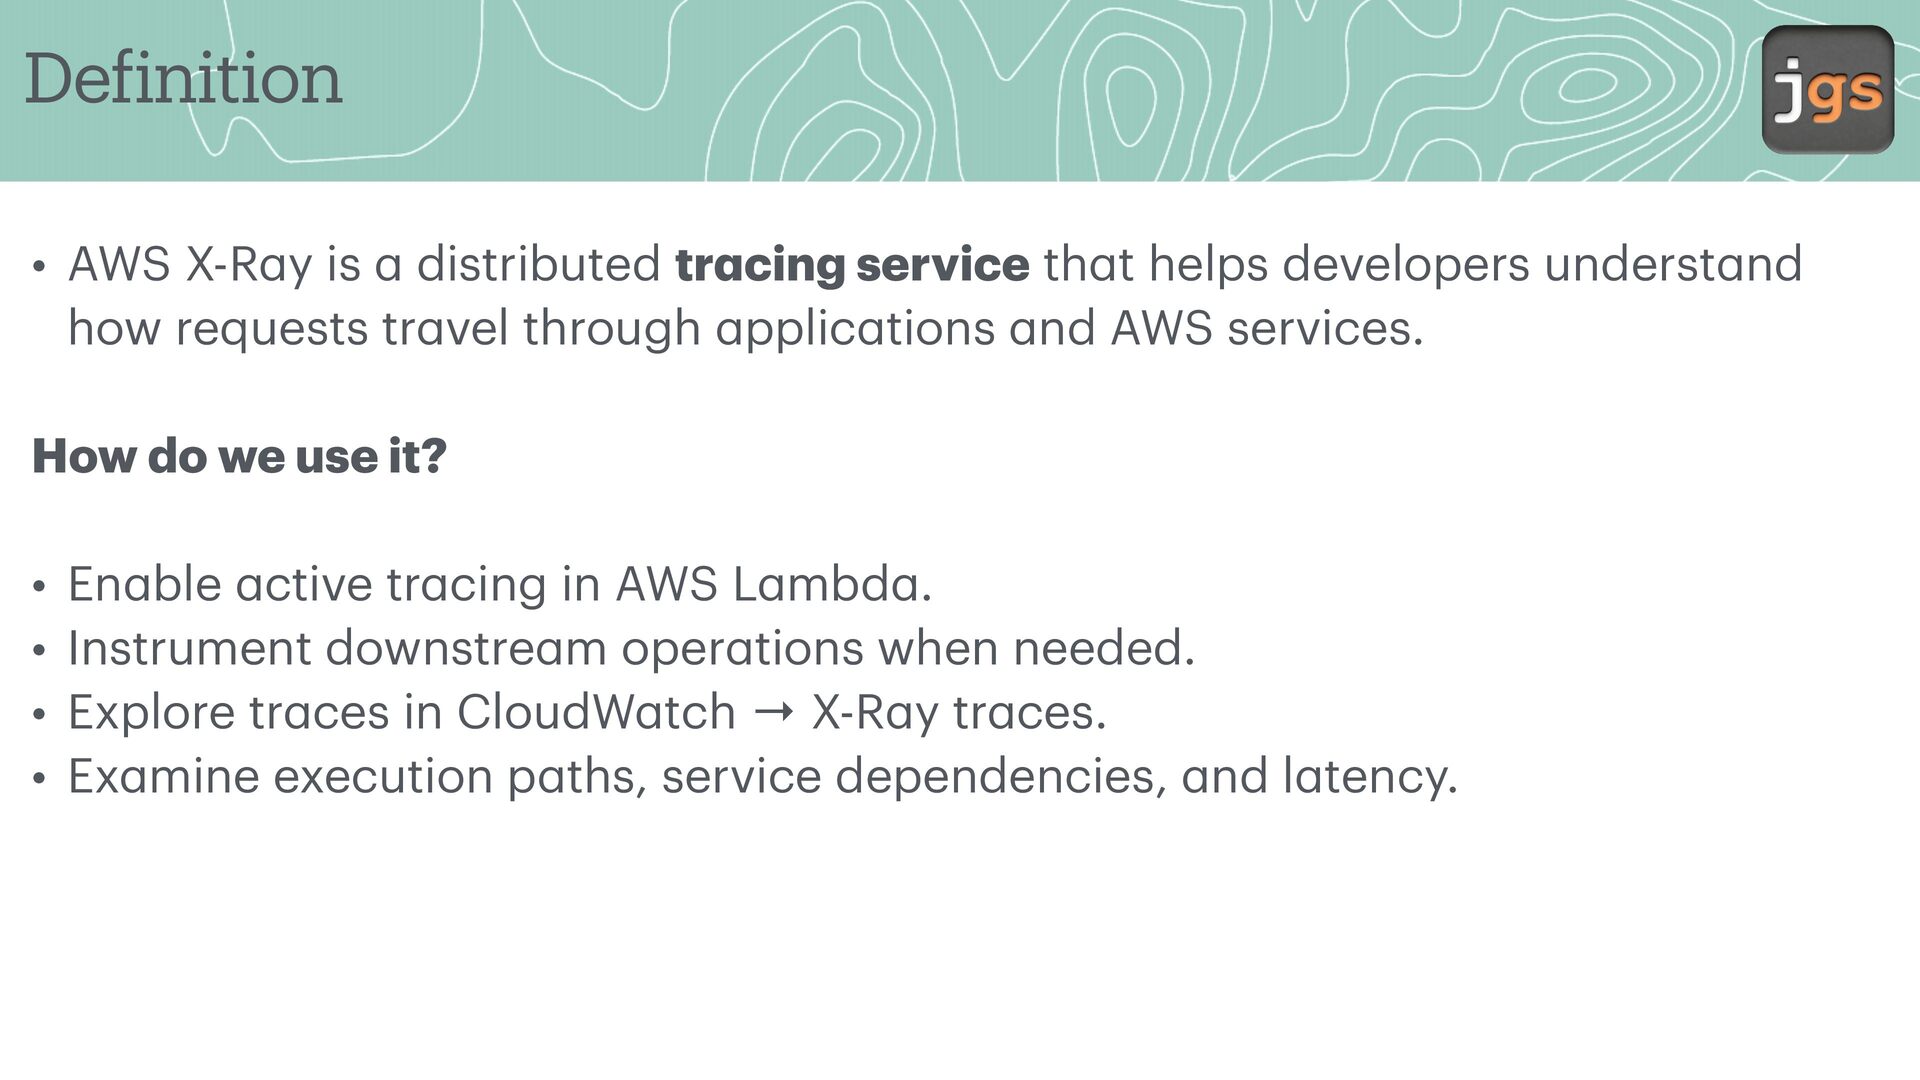
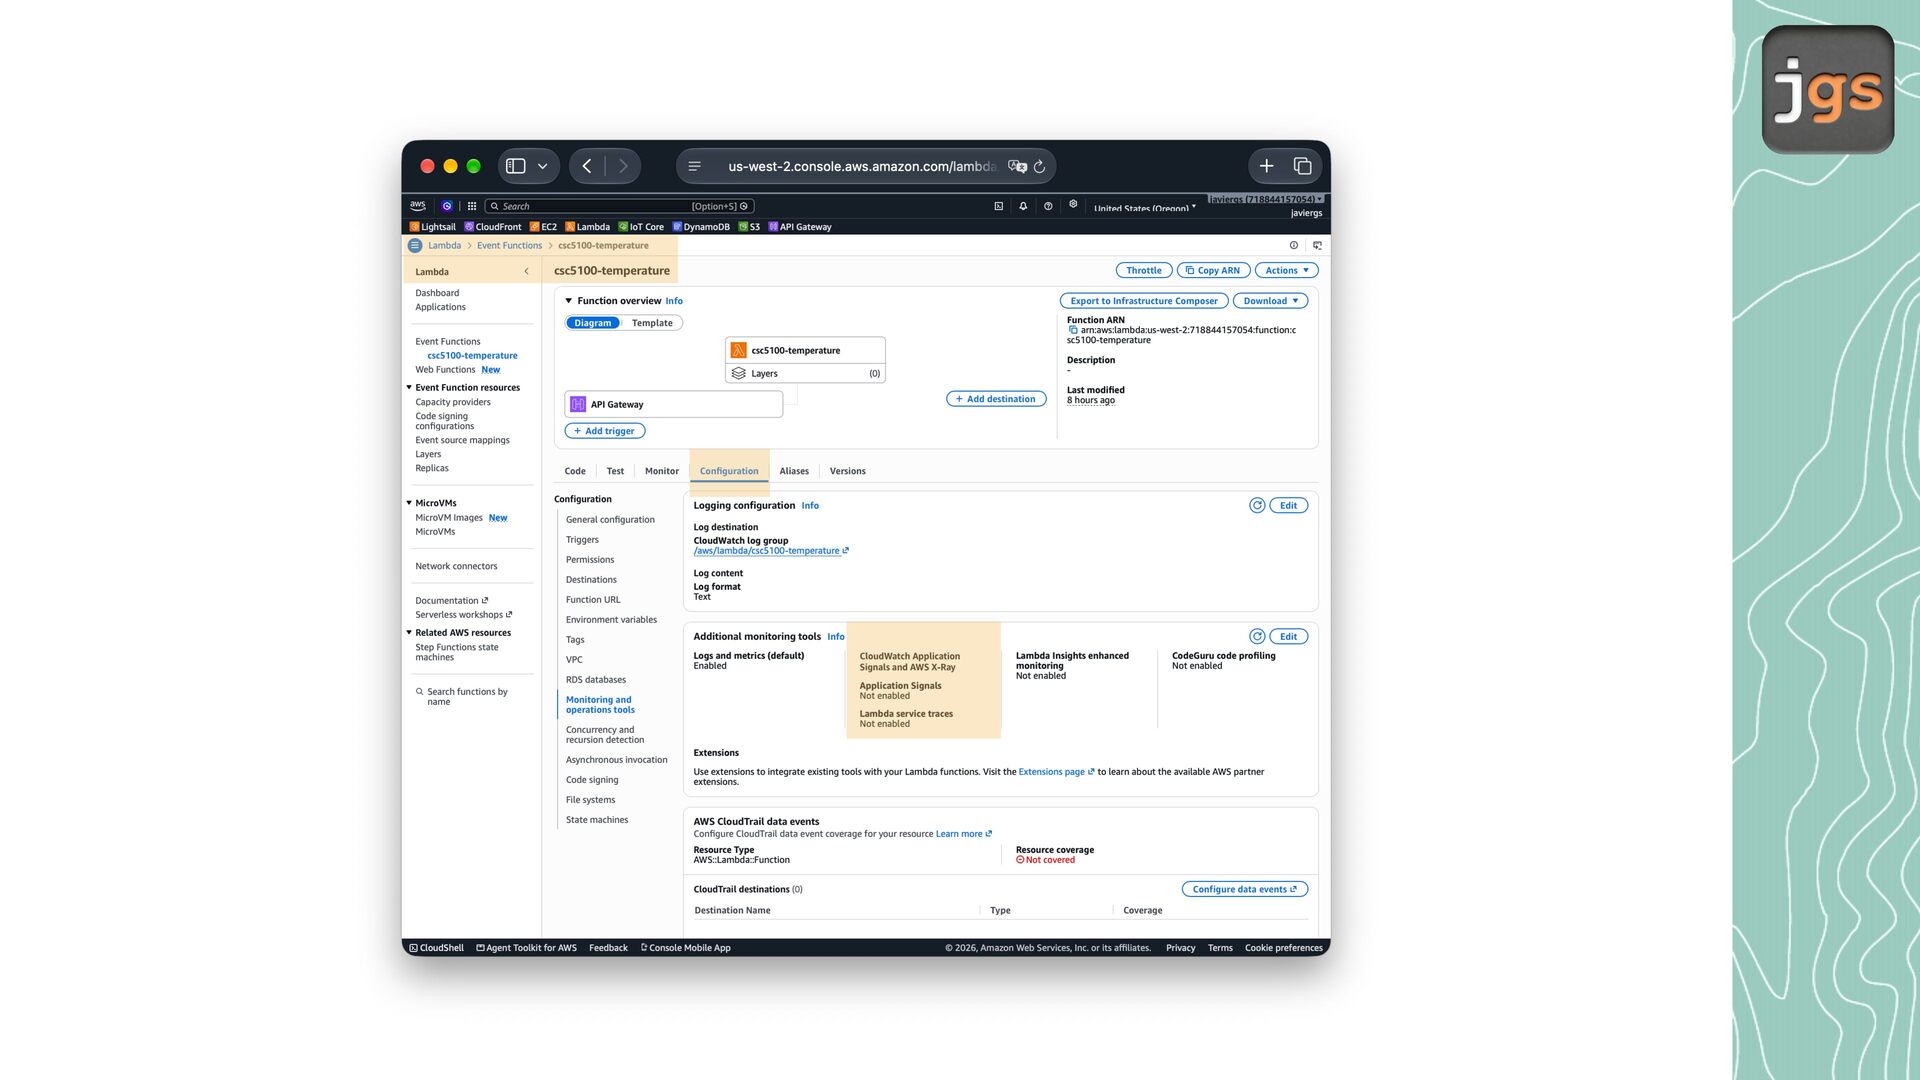
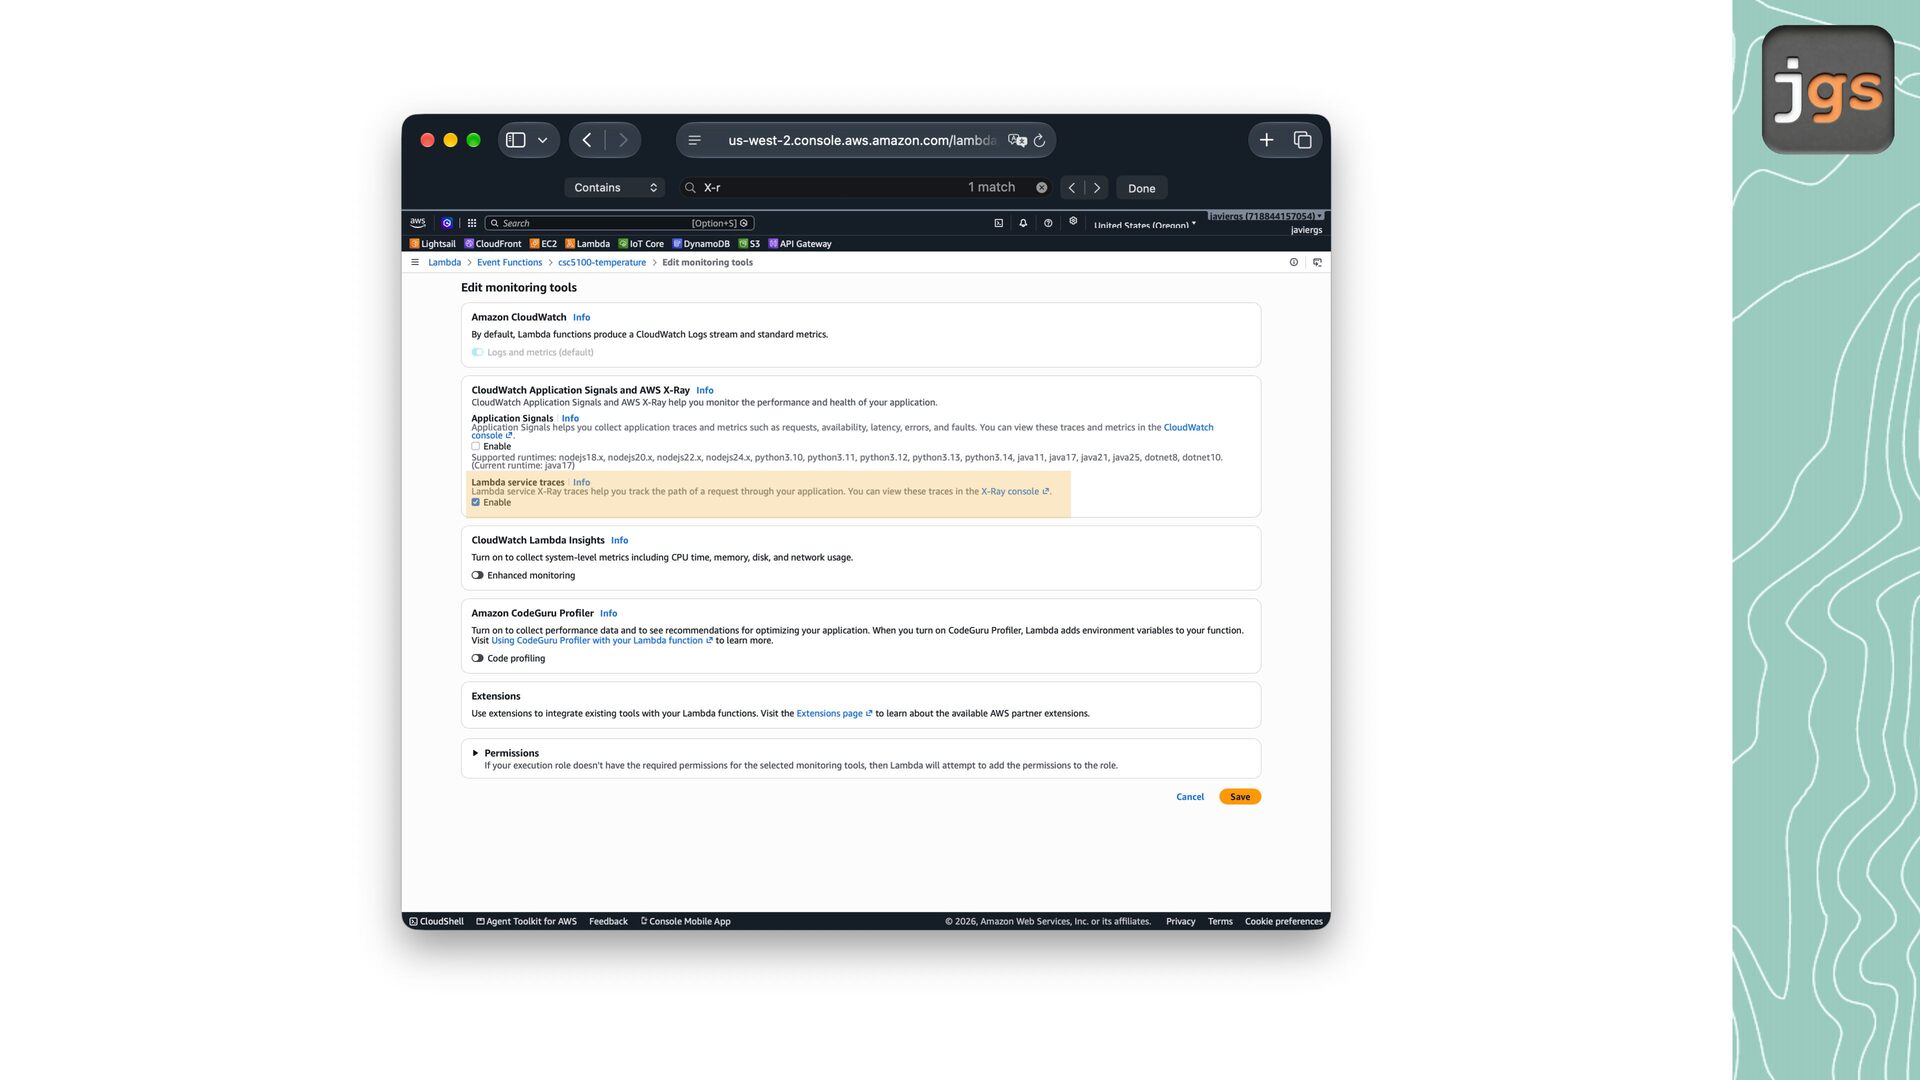
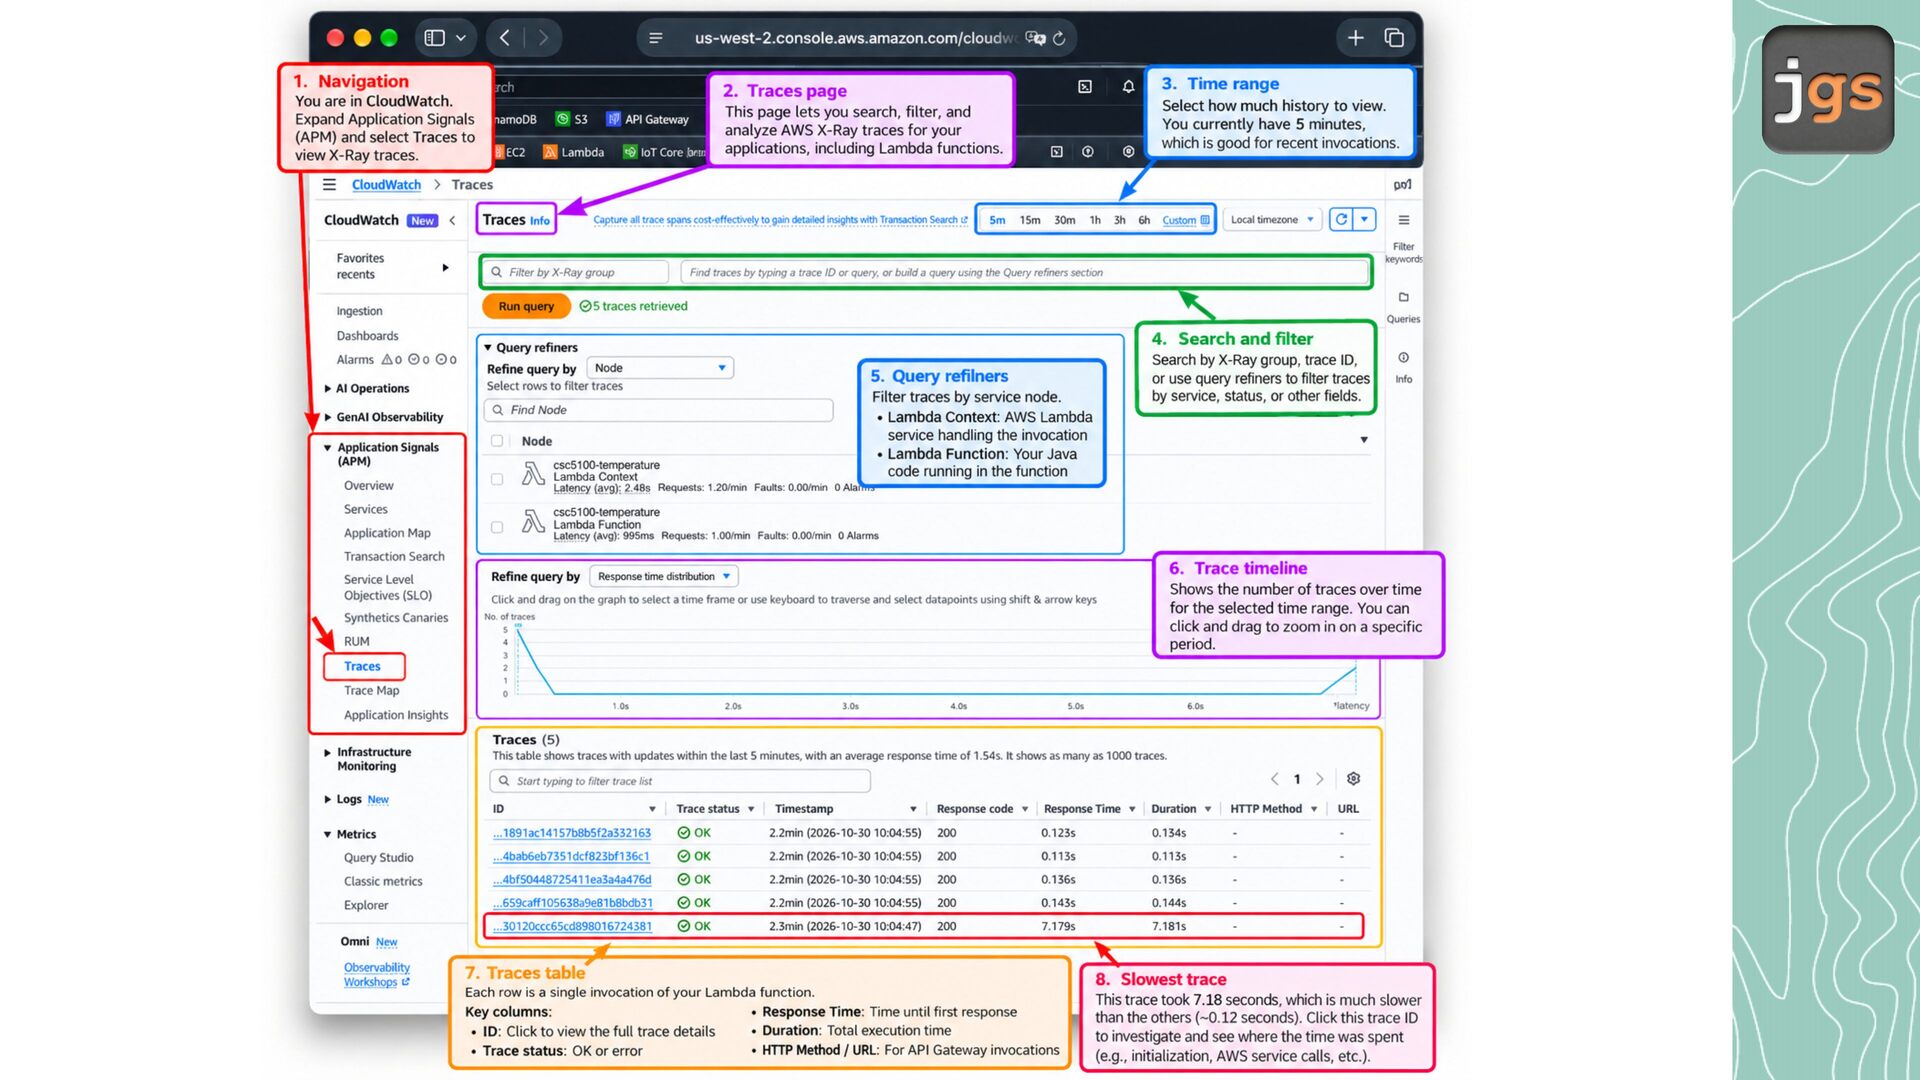
service th t helps developers underst nd how requests tr vel through pplic tions nd AWS services. How do we use it? a a a a a a a a a a a a a a a a a a a a a a f a a • En ble ctive tr cing in AWS L mbd . • Instrument downstre m oper tions when needed. • Explore tr ces in CloudW tch → X-R y tr ces. • Ex mine execution p ths, service dependencies, nd l tency.
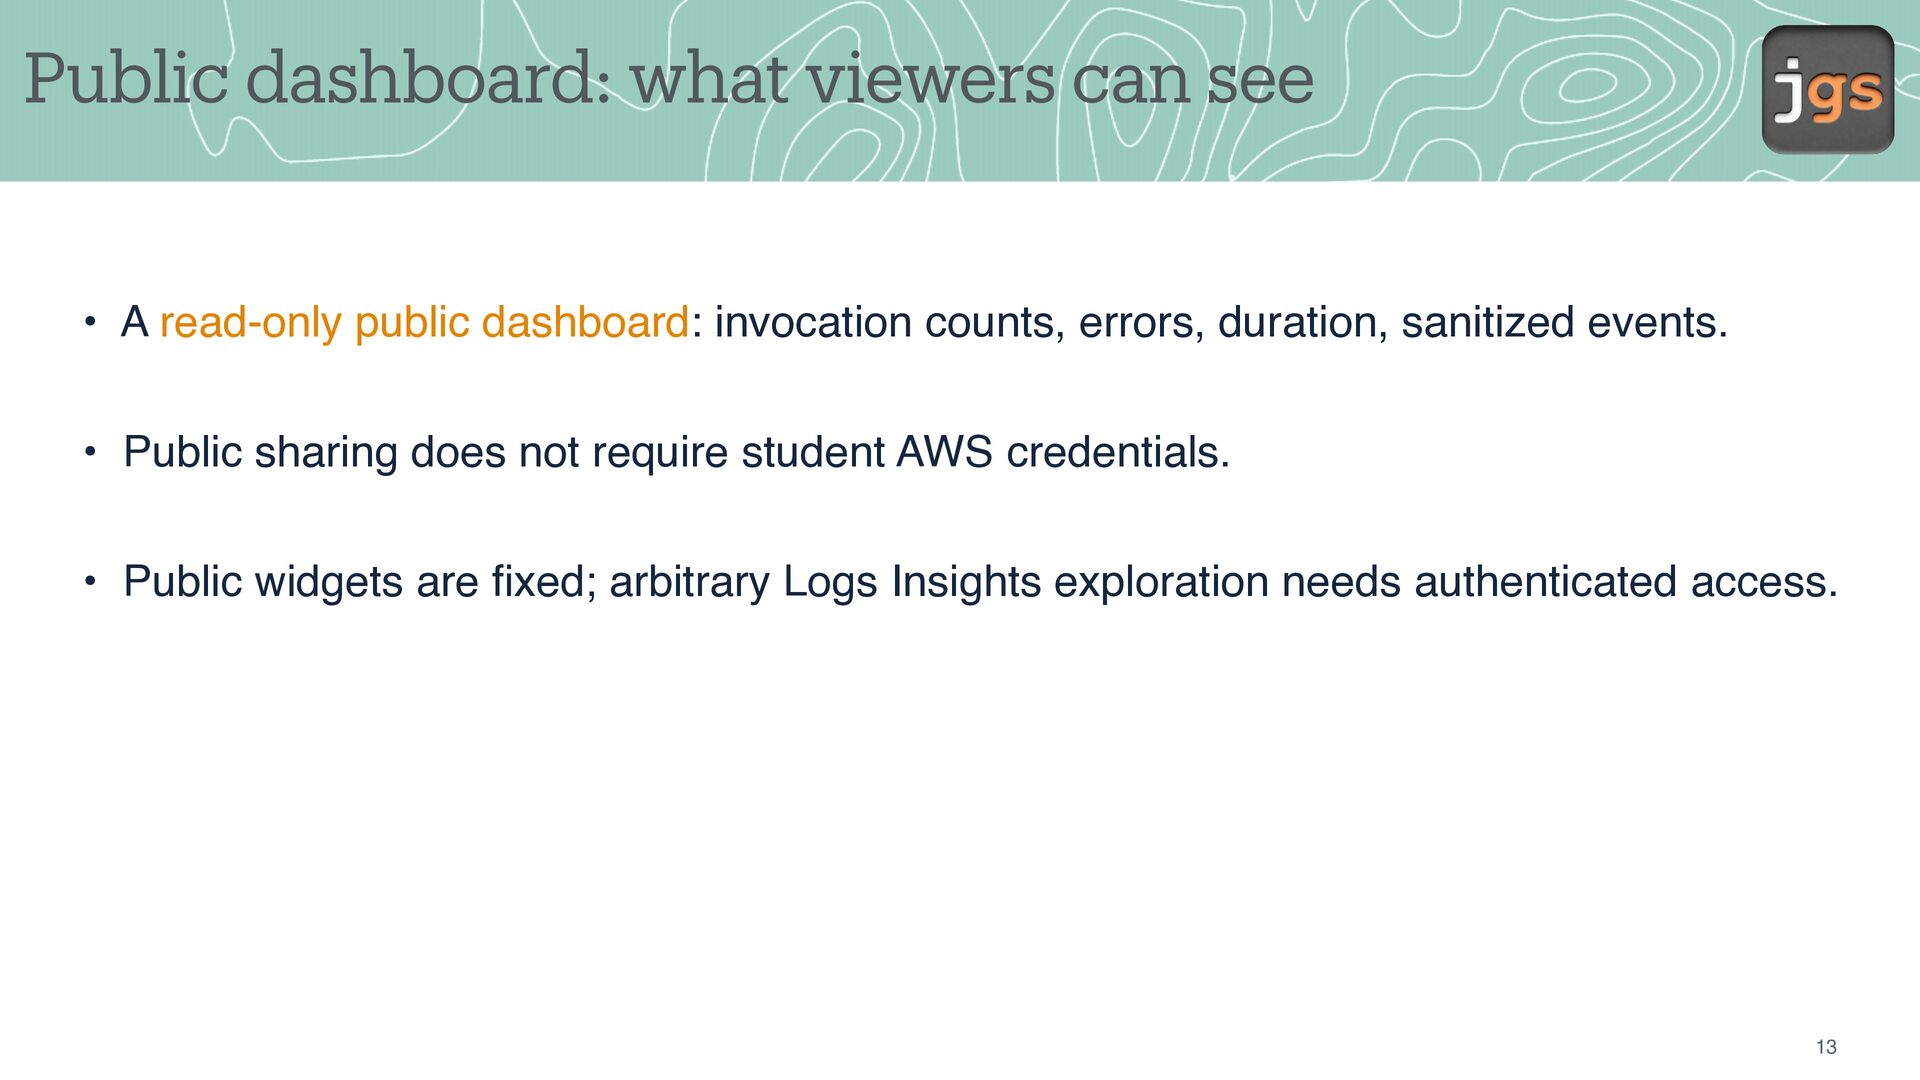
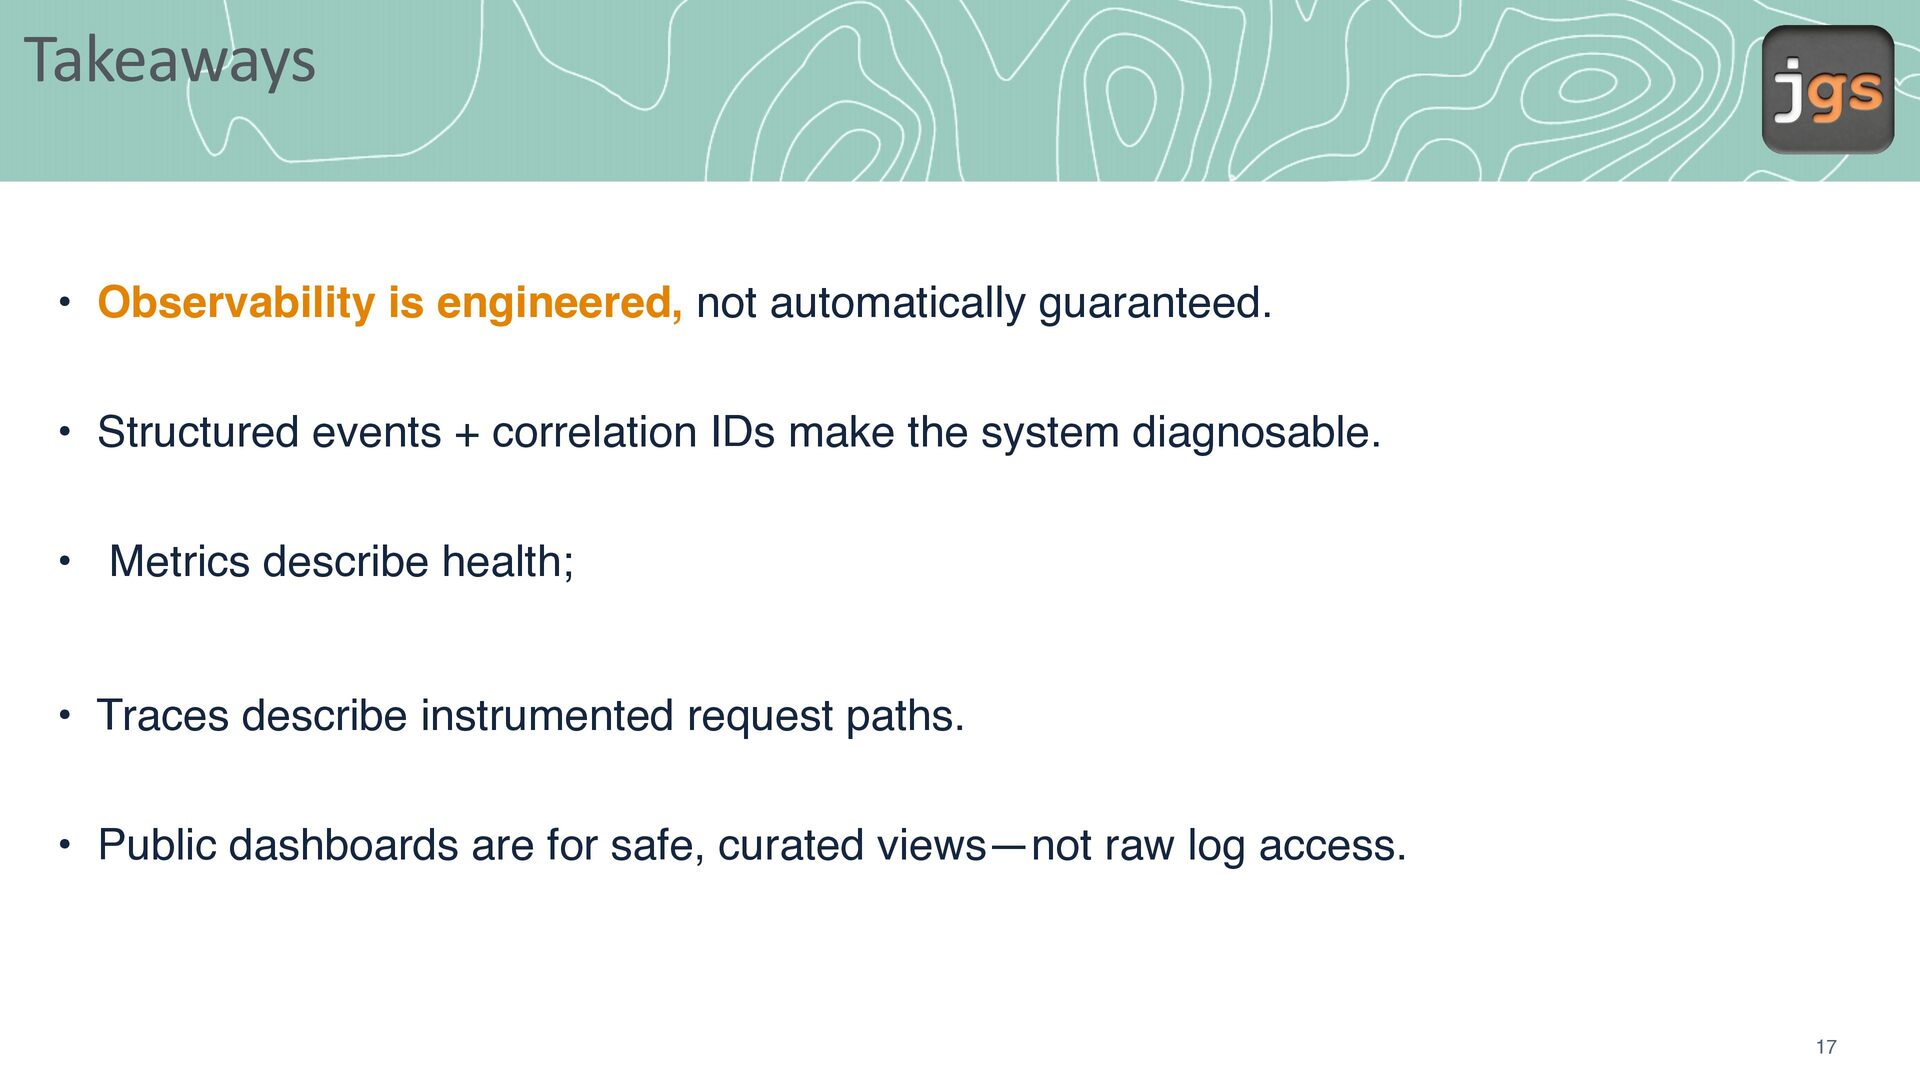
events + correlation IDs make the system diagnosable. • Metrics describe health; • Traces describe instrumented request paths. • Public dashboards are for safe, curated views—not raw log access. 17
2026 Copyright Notice. These slides are provided exclusively for educational use in CSC 5100 within the California State University system. Redistribution or use for any other purpose is prohibited without prior written permission.


 javiergs
 miccheng
 drumath2237
 har1101
 paulk
 kmkim
 3saito
 koukimiura
 mtsmfm
 leegeunhyeok
 sakawe_ee
 yuta_onishi_97
 itsmedreamwalker
 reverentgeek
 kevinliebholz
 asonas
 axbom
 jnunemaker
 mkilby
 eitanlees
 mza
 trishagee
 tamaranovitovic
 dougneiner
 tammyeverts