This deck is project report prepared for Fall 2014 Data mining class at University of South Florida. The project involves applying data mining algorithms for analysis of Cricket game. Code is available in Github.
2014 - Jeyaram Ashokraj With less than 100 days to go for ICC Cricket world cup, I thought some predictions about it would be interesting and appropriate. A little background about the game, Cricket is third most popular game (After football and basketball) going by estimated fan followers [1]. The primary reason being its played major populous nations. But it’s expanding rapidly and till date 106 countries have registered at various levels with administering council (ICC). Cricket is a bat and ball game with 11 players played between two teams. There are three popular formats in the game. The world cup is specific for 50 over game format. It’s played once in 4 years and the upcoming edition of 2015 is hosted by Australia and New Zealand. The previous world cup held in 2011 was won by India. Member nations src: Wikipedia The idea is primarily inspired by NCAA Basketball brackets (March Madness) and particularly Nate Silver’s blog [2] on the same. Tournament Structure: In 2015 world cup, there are 14 teams participating, each divided into two pools (A and B). There are total of 42 matches in the first round (group stage), 7 teams in a pool play against each other. Top two finishers in the pool proceed to next rounds, which are knock-out style matches. Pool A Pool B England South Africa Australia India Sri Lanka Pakistan Bangladesh West Indies New Zealand Zimbabwe Afghanistan Ireland Scotland United Arab Emirates (Game structure after group stage matches) src: wikipedia
previous history of direct encounters of the two teams. Ex. Australia vs England have played 127 ODI’s in the span 1980-2014. The model learns about the outcomes of these matches. And when a match is scheduled in this world cup it predicts a probability score of winning. The idea here is similar to Case Based Reasoning (CBR) techniques where examples of previous instances are looked at. 2. Scoring every player in the team and aggregating a team score. This score will be used to predict the outcome of the match. Data: The dataset was collected by scraping through a CricInfo website. CricInfo Statsguru has extensive data on almost all cricket matches played in the history. The scraping was set using import.io[3] tool. This was automated to collect data from several pages of results using Shell script and unix utility Curl[4], which returns JSON data. The json data is finally converted to CSV using python script. And finally csvkit[5] for slicing and reordering data. Some of the data which were extracted from the website are 1. Team results (1980 - 2014) (records: 5946) 2. Individual batting data (2012 - 2014) 3. Individual bowling data (2012 - 2014) 4. Individual fielding data (2012 - 2014) 5. Team results by toss win and loss (1980 - 2014) (records: 5946) For this exercise and model evaluation purpose, the data is split into two 1. Set 1 a. Training set - data from years 2000 to 2010 (records:2287) b. Test set - data from year 2011 (records:225) 2. Set 2 a. Training set - data from years 2004 to 2014 (records:2399) b. Test set - data from group stages of world cup 2015 (records: 84) The idea is predict the world cup based previous 10 years of match data. So last the world cup was held in 2011 and training data consists of data from previous ten years (2000 - 2010). This number would give fair idea of how the model would have performed in the last world cup.
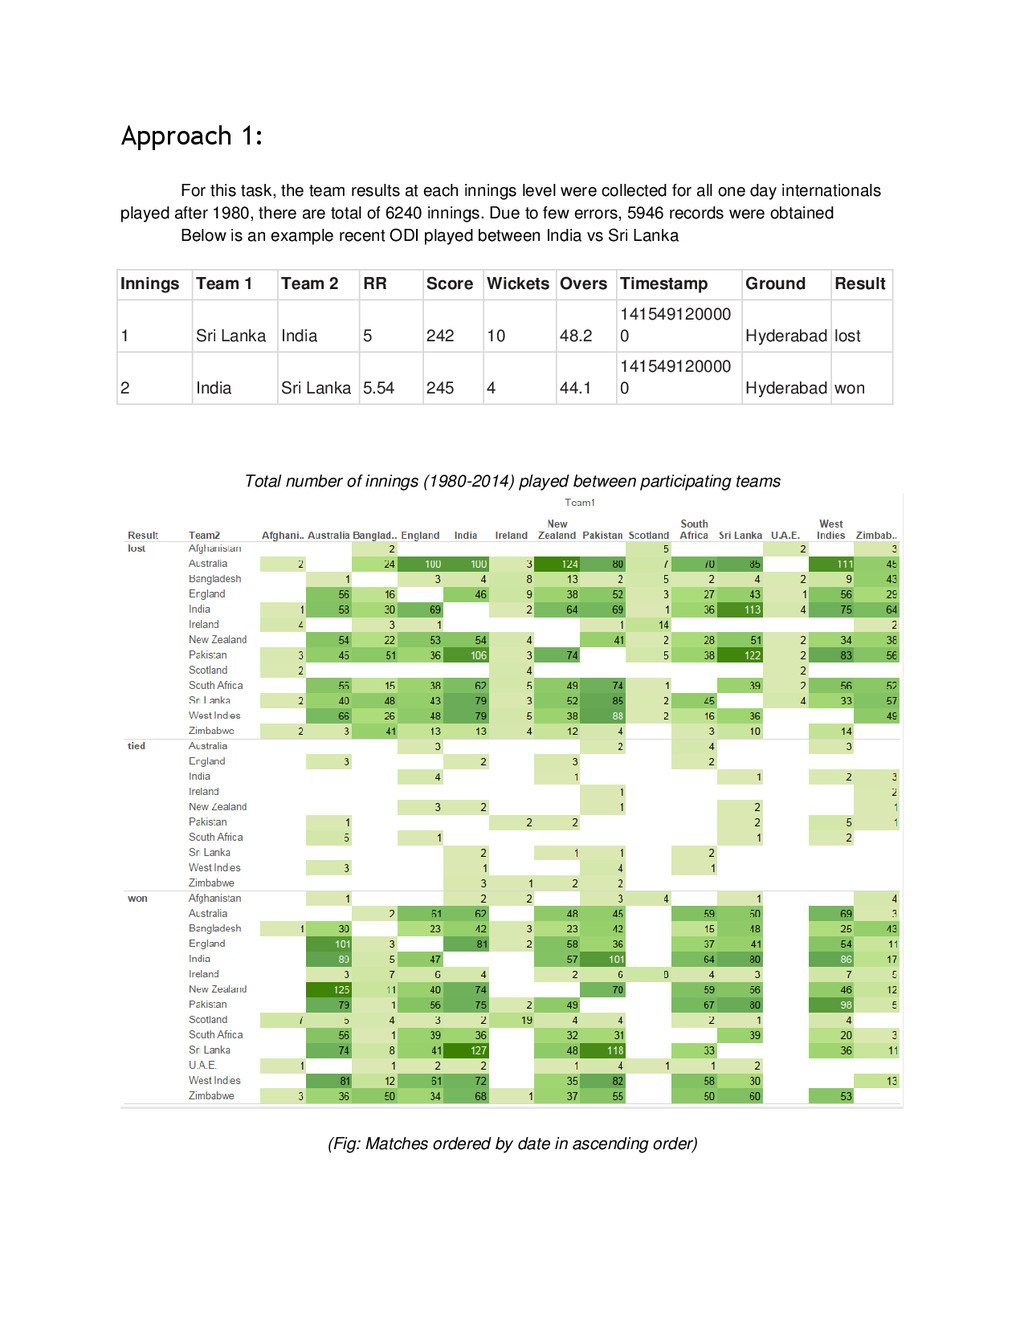
innings level were collected for all one day internationals played after 1980, there are total of 6240 innings. Due to few errors, 5946 records were obtained Below is an example recent ODI played between India vs Sri Lanka Innings Team 1 Team 2 RR Score Wickets Overs Timestamp Ground Result 1 Sri Lanka India 5 242 10 48.2 141549120000 0 Hyderabad lost 2 India Sri Lanka 5.54 245 4 44.1 141549120000 0 Hyderabad won Total number of innings (1980-2014) played between participating teams (Fig: Matches ordered by date in ascending order)
countries which are participating this world cup 2015) Run Rate Numeric Runs scored per over Score Numeric Total innings score by Team A The highly correlated variable with the outcome Overs Numeric Number of overs played by Team A Wickets Numeric Number of wickets lost by Team A Ground Nominal Ground Names Certain teams have favorite ground venues where they have a good record of winning. Coordinates Numeric longitude and latitude coordinates of the ground For Visualization purposes Result Nominal Win Lost Tie Venue Nominal Home - Match played in Team A’s country Away - Match played in Team B’s country Neutral - Match played in other country Teams usually perform better in home grounds.
variables) The variable which has a high correlation with the outcome is obviously the Score column. So we will create additional columns from the data. One such column is home/away/neutral game. Models: Below models were run in Weka using 60% - training set 40% - test set split. Prediction accuracies fell in the range of 77% - 80% Algorithm Accuracy RMSE TP Rate FP rate Precision Recall Nearest Neighbour (K=25) 80.0834 0.3213 0.84 0.3213 0.3213 0.84 Logistic Regression 77.3723 0.3303 0.787 0.21 0.772 0.787 Neural Network 80.5005 0.3063 0.862 0.234 0.769 0.862 Naive Bayes 79.7706 0.3206 0.789 0.179 0.8 0.789 Decision Tree 76.3295 0.3387 0.947 0.399 0.682 0.947
of classifying the outcome of the match either as win or lost, it is good to have a number representing the probability of winning. Logistic regression applies the sigmoid function to give a score between 0 and 1. The model is built in R using Generalized Linear Model (GLM) package.
fixtures of the tournament in the group stage, which looks like this. So there are two cases here, assuming each team has the 50% possibility of batting or fielding first. The green column indicates target variable and the red columns indicate the missing values. Case 1: Team A bats first Match Inning s Team A Team B RR Score Wickets Over s ground venue result 1 1 Australia England Melbourne home ? 2 1 New Zealand Sri Lanka Christchurch home ? . . . . . . . . . ? To fill the missing values Exponential Moving Averages(EMA) is used. For Example, (, ) = ( , 3) + ( , 5) + ( , 4) 3 Exponential average provides more weightage to recent performances. In the similar way other column values were calculated. The exponential moving average is calculated using MATLAB. Score=zeros(length(TeamA),1) for n=2:length(TeamA) teamA_teamB_rows = strcmp(cricket.TeamA,TeamA{n}) & strcmp(cricket.TeamB,TeamB{n}); teamA_rows = strcmp(cricket.TeamA,TeamA{n}); recent = cricket.Score(teamA_teamB_rows); complete = full_data.Score(teamA_teamB_rows); overall = cricket.Score(teamA_rows); if length(complete)>6 x = tsmovavg(recent,'e',3,1); y = tsmovavg(complete,'e',5,1); z = tsmovavg(overall,'e',5,1); exp = (x(end)+y(end)+z(end))/3 ; else exp = (mean(complete) + mean(overall))/2; end Score(n,1) = exp(end); fprintf('%f\n',exp(end)); end
home 42.24% 20 2 Australia New Zealand 5.47 254.55 6.38 46.58 Auckland away 80.87% 21 1 India U.A.E 5.30 251.22 6.40 47.29 Perth neutral 100.00% 21 2 U.A.E India 4.16 163.25 9.92 39.04 Perth neutral 0.00% 22 1 Pakistan Zimbabwe 5.29 245.40 6.49 46.06 Brisbane neutral 98.26% 22 2 Zimbabwe Pakistan 4.44 201.44 8.16 44.92 Brisbane neutral 8.90% 23 1 England Sri Lanka 5.19 225.46 7.33 43.68 Wellington neutral 42.19% 23 2 Sri Lanka England 5.12 226.23 7.27 43.76 Wellington neutral 69.35% 24 1 Ireland South Africa 4.40 168.50 8.77 37.88 Canberra neutral 0.75% 24 2 South Africa Ireland 5.37 220.75 5.64 41.10 Canberra neutral 93.20% 25 1 Pakistan U.A.E NaN NaN NaN NaN Napier neutral NA 25 2 U.A.E Pakistan NaN NaN NaN NaN Napier neutral NA 26 1 Australia Afghanistan 5.41 259.27 7.32 47.95 Perth home 98.74% 26 2 Afghanistan Australia 4.67 207.34 9.00 44.16 Perth away 3.86% 27 1 Bangladesh Scotland 4.96 208.54 6.52 41.90 Nelson neutral 59.10% 27 2 Scotland Bangladesh 3.75 163.38 9.28 43.38 Nelson neutral 0.63% 28 1 India West Indies 5.38 243.25 6.79 45.04 Perth neutral 83.14% 28 2 West Indies India 5.00 221.79 7.73 44.42 Perth neutral 32.32% 29 1 Pakistan South Africa 4.86 223.55 8.32 45.59 Auckland neutral 38.05% 29 2 South Africa Pakistan 5.30 237.60 6.66 45.07 Auckland neutral 73.37% 30 1 Ireland Zimbabwe 4.42 202.84 8.90 45.71 Hobart neutral 46.71% 30 2 Zimbabwe Ireland 4.56 217.18 8.53 47.10 Hobart neutral 54.60% 31 1 Australia Sri Lanka 5.23 238.40 6.76 45.50 Sydney home 75.54% 31 2 Sri Lanka Australia 4.93 217.97 7.68 43.95 Sydney away 32.70% 32 1 New Zealand Afghanistan NaN NaN NaN NaN Napier home NA 32 2 Afghanistan New Zealand NaN NaN NaN NaN Napier away NA 33 1 England Bangladesh 5.40 240.34 6.51 44.76 Adelaide neutral 93.94% 33 2 Bangladesh England 4.56 209.95 8.38 45.62 Adelaide neutral 18.38% 34 1 India Ireland 5.07 216.47 4.90 42.42 Hamilton neutral 96.66% 34 2 Ireland India 4.31 197.84 9.10 45.81 Hamilton neutral 1.14% 35 1 Sri Lanka Scotland 5.39 254.81 7.13 47.02 Hobart neutral 96.37% 35 2 Scotland Sri Lanka 3.65 142.63 9.28 37.98 Hobart neutral 0.27% 36 1 South Africa U.A.E NaN NaN NaN NaN Wellington neutral NA 36 2 U.A.E South Africa NaN NaN NaN NaN Wellington neutral NA 37 1 New Zealand Bangladesh 5.45 221.81 7.30 42.97 Hamilton home 77.47% 37 2 Bangladesh New Zealand 4.31 195.84 8.27 44.88 Hamilton away 3.02% 38 1 Afghanistan England NaN NaN NaN NaN Sydney neutral NA 38 2 England Afghanistan NaN NaN NaN NaN Sydney neutral NA 39 1 India Zimbabwe 5.24 231.41 5.97 43.83 Auckland neutral 97.64% 39 2 Zimbabwe India 4.37 198.11 8.27 44.44 Auckland neutral 4.00% 40 1 Australia Scotland 6.16 296.77 6.49 47.95 Hobart home 98.92% 40 2 Scotland Australia 3.92 166.96 9.28 42.27 Hobart away 0.14%
15.76% 41 2 Pakistan Ireland 4.68 212.06 6.89 44.44 Adelaide neutral 98.19% 42 1 West Indies U.A.E NaN NaN NaN NaN Napier neutral NA 42 2 U.A.E West Indies NaN NaN NaN NaN Napier neutral NA Below screenshot shows Australia winning 10/12 matches against England in Home ground. And the model also predicted a higher probability for Australia winning the game. Points table end of group stages by predictions Team Pld W L A1 Australia 6 6 0 A2 Sri Lanka 6 5 1 A3 New Zealand 6 4 2 A4 England 6 3 3 Bangladesh 6 2 4 Afghanistan 6 1 5 Scotland 6 0 6 Team Pld W L B1 South Africa 6 6 0 B2 India 6 5 1 B3 Pakistan 6 4 2 B4 West Indies 6 3 3 Zimbabwe 6 2 4 Ireland 6 1 5 United Arab Emirates 6 0 6
Overs Ground Venue Winning % Australia West Indies 4.95 233.33 6.9 46.85 Sydney home 85.83% West Indies Australia 4.92 236.11 9.32 47.63 Sydney away 5.86% Sri Lanka Pakistan 5.48 228.66 7.03 41.69 Melbourne neutral 78.01% Pakistan Sri Lanka 4.72 213.46 8.4 44.05 Melbourne neutral 45.44% New Zealand India 5.52 266.43 7.04 48.22 Adelaide neutral 63.58% India New Zealand 5.43 257.24 6.41 47.26 Adelaide neutral 83.03% England South Africa 4.89 218.56 6.7 44.63 Wellington neutral 51.15% South Africa England 4.96 226.29 6.92 45.48 Wellington neutral 65.29% Semi’s Team-A Team-B RunRate Score Wickets Overs Ground Venue winning % Australia India 5.34 250.61 7.88 46.59 Auckland neutral 34.19% India Australia 6.08 276.98 5.82 45.18 Auckland neutral 70.59% South Africa Sri Lanka 5.41 257.39 7.04 47.30 Sydney neutral 67.17% Sri Lanka South Africa 5.27 239.07 8.08 45.31 Sydney neutral 52.35% Finals Prediction: India vs South Africa at Melbourne, the same match had already happened in the group stage, so going by the same numbers, South Africa are my favourites. Evaluation with World Cup 2011 In the same way, the logistic regression model was trained with data from 2000 to 2010 (previous 10 years) and tested with matches held in 2011. (Fig: confusion matrix of logistic regression fitting test data) Accuracy = 64% (With 0.5 Cutoff). Based on the ROC curve from below, we can observe that accuracy could be improved by increasing the cut off 0.7
RunRate Wickets Ground Venue Result.A Result.P 50% Correct? 1 India Bangladesh 44.68 240.77 5.37 6.35 Dhaka away won 93.10% won Yes 2 Bangladesh India 45.70 207.12 4.47 8.16 Dhaka home lost 11.46% lost Yes 1 Australia Zimbabwe 45.18 253.82 5.63 5.61 Ahmedabad neutral won 98.08% won Yes 2 Zimbabwe Australia 46.82 209.64 4.42 8.36 Ahmedabad neutral lost 2.39% lost Yes 1 West Indies South Africa 44.79 216.47 4.82 7.65 Delhi neutral lost 15.80% lost Yes 2 South Africa West Indies 45.36 235.43 5.22 5.89 Delhi neutral won 85.05% won Yes 1 Bangladesh Ireland 44.57 206.24 4.59 7.46 Dhaka home won 85.52% won Yes 2 Ireland Bangladesh 44.24 196.58 4.42 7.95 Dhaka away lost 37.58% lost Yes 1 New Zealand Australia 44.12 220.72 4.99 7.98 Nagpur neutral lost 21.04% lost Yes 2 Australia New Zealand 45.83 246.54 5.39 6.37 Nagpur neutral won 83.25% won Yes 1 Pakistan Sri Lanka 45.93 223.45 4.82 7.46 Colombo away won 63.91% won Yes 2 Sri Lanka Pakistan 45.03 222.88 4.94 7.53 Colombo home lost 78.74% won No 1 England Ireland 47.24 238.42 5.05 7.49 Bangalore neutral lost 92.70% won No 2 Ireland England 41.04 193.08 4.76 8.78 Bangalore neutral won 7.15% lost No 1 Bangladesh West Indies 43.15 182.82 4.21 8.35 Dhaka home lost 17.43% lost Yes
won 72.40% won Yes 1 Zimbabwe New Zealand 46.84 219.47 4.64 7.99 Ahmedabad neutral lost 8.71% lost Yes 2 New Zealand Zimbabwe 45.09 236.95 5.26 7.14 Ahmedabad neutral won 87.86% won Yes 1 Ireland India 46.36 190.74 4.12 9.11 Bangalore away lost 1.29% lost Yes 2 India Ireland 39.89 204.00 5.05 4.05 Bangalore home won 99.39% won Yes 1 England South Africa 42.86 213.47 5.01 6.74 Chennai neutral won 69.36% won Yes 2 South Africa England 44.65 223.13 5.00 6.91 Chennai neutral lost 83.60% won No 1 New Zealand Pakistan 43.73 216.28 4.95 7.40 Colombo neutral won 70.15% won Yes 2 Pakistan New Zealand 45.98 228.89 4.98 7.45 Colombo neutral lost 82.00% won No 1 Sri Lanka Zimbabwe 40.91 202.49 5.09 6.32 Colombo home won 98.28% won Yes 2 Zimbabwe Sri Lanka 42.88 176.02 4.01 8.58 Colombo away lost 4.45% lost Yes 1 England Bangladesh 43.02 225.95 5.27 5.94 Chittagong away lost 95.80% won No 2 Bangladesh England 45.85 198.86 4.31 8.59 Chittagong home won 21.29% lost No 1 West Indies Ireland 42.52 206.98 4.87 5.25 Mohali neutral won 98.39% won Yes 2 Ireland West Indies 45.86 194.74 4.24 8.61 Mohali neutral lost 17.93% lost Yes 1 India South Africa 45.65 234.05 5.08 7.39 Nagpur home lost 39.13% lost Yes 2 South Africa India 45.09 231.73 5.14 6.20 Nagpur away won 45.75% lost No 1 Zimbabwe Pakistan 45.36 200.25 4.39 8.49 Colombo neutral lost 12.83% lost Yes 2 Pakistan Zimbabwe 46.15 242.22 5.22 6.72 Colombo neutral won 98.19% won Yes 1 South Africa Ireland 38.08 199.72 5.27 4.93 Kolkata neutral won 96.53% won Yes 2 Ireland South Africa 37.74 164.99 4.34 8.61 Kolkata neutral lost 0.96% lost Yes 1 England West Indies 43.40 219.04 5.09 7.27 Chennai neutral won 80.51% won Yes 2 West Indies England 43.82 217.20 4.98 7.23 Chennai neutral lost 60.70% won No 1 Sri Lanka New Zealand 44.80 218.12 4.89 7.17 Mumbai neutral won 88.06% won Yes 2 New Zealand Sri Lanka 44.04 205.96 4.67 7.86 Mumbai neutral lost 63.21% won No 1 Australia Pakistan 44.95 233.91 5.21 6.32 Colombo neutral lost 91.68% won No 2 Pakistan Australia 45.79 215.30 4.66 8.29 Colombo neutral won 44.51% lost No 1 South Africa Bangladesh 42.34 219.67 5.31 5.08 Dhaka away won 96.73% won Yes 2 Bangladesh South Africa 44.58 185.17 4.10 9.02 Dhaka home lost 4.38% lost Yes 1 India West Indies 45.04 232.69 5.15 6.91 Chennai home won 87.61% won Yes 2 West Indies India 43.40 211.92 4.93 7.37 Chennai away lost 24.78% lost Yes 1 West Indies Pakistan 44.77 214.00 4.77 7.77 Dhaka neutral lost 27.36% lost Yes 2 Pakistan West Indies 45.91 219.32 4.74 7.67 Dhaka neutral won 73.15% won Yes 1 Australia India 45.31 247.70 5.46 6.37 Ahmedabad away lost 59.78% won No 2 India Australia 46.11 237.81 5.11 7.65 Ahmedabad home won 26.72% lost No 1 New Zealand South Africa 44.63 215.21 4.85 7.46 Dhaka neutral won 42.48% lost No 2 South Africa New 44.99 226.91 5.05 6.25 Dhaka neutral lost 79.05% won No
away lost 42.15% lost Yes 2 Sri Lanka England 43.90 222.09 5.09 7.10 Colombo home won 88.61% won Yes 1 New Zealand Sri Lanka 44.04 205.96 4.67 7.86 Colombo away lost 39.26% lost Yes 2 Sri Lanka New Zealand 44.80 218.12 4.89 7.17 Colombo home won 83.84% won Yes 1 India Pakistan 46.05 247.22 5.33 7.27 Mohali home won 78.95% won Yes 2 Pakistan India 46.84 246.45 5.23 7.50 Mohali away lost 62.50% won No 1 Sri Lanka India 45.03 229.45 5.11 7.42 Mumbai away lost 69.69% won No 2 India Sri Lanka 45.01 235.56 5.19 7.06 Mumbai home won 83.19% won Yes Future work: 1. Instead of moving averages for the scores and other input features, try out other ways to predict them. 2. Score players and create normalized team score. This avoids the need to predict scores. QlikView Dashboard & Tableau Visualizations: A Qlik view dashboard is created to view the statistics interactively. Each match should be filtered and the statistics are displayed.
http://david-hu.com/2011/11/02/how-khan-academy-is-using-machine-learning-to-assess-student- mastery.html 6. Wikipedia,Stackoverflow, Matlab help pages and R online manuals.