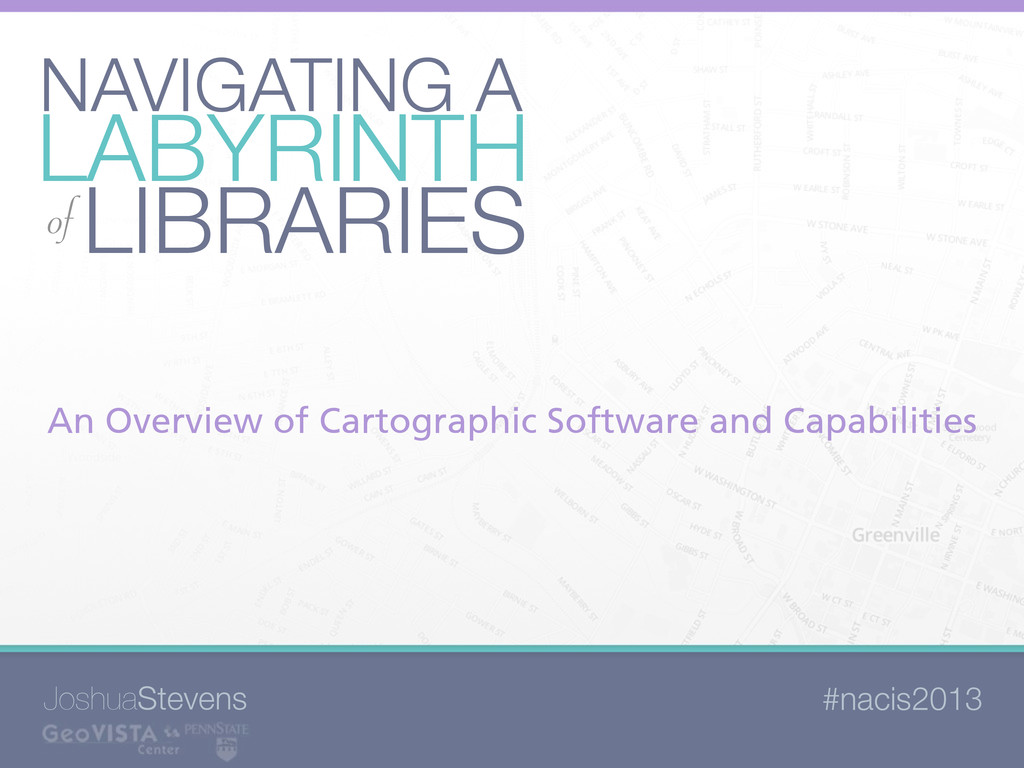
NACIS PCD 2013: Navigating a Labyrinth of Libraries
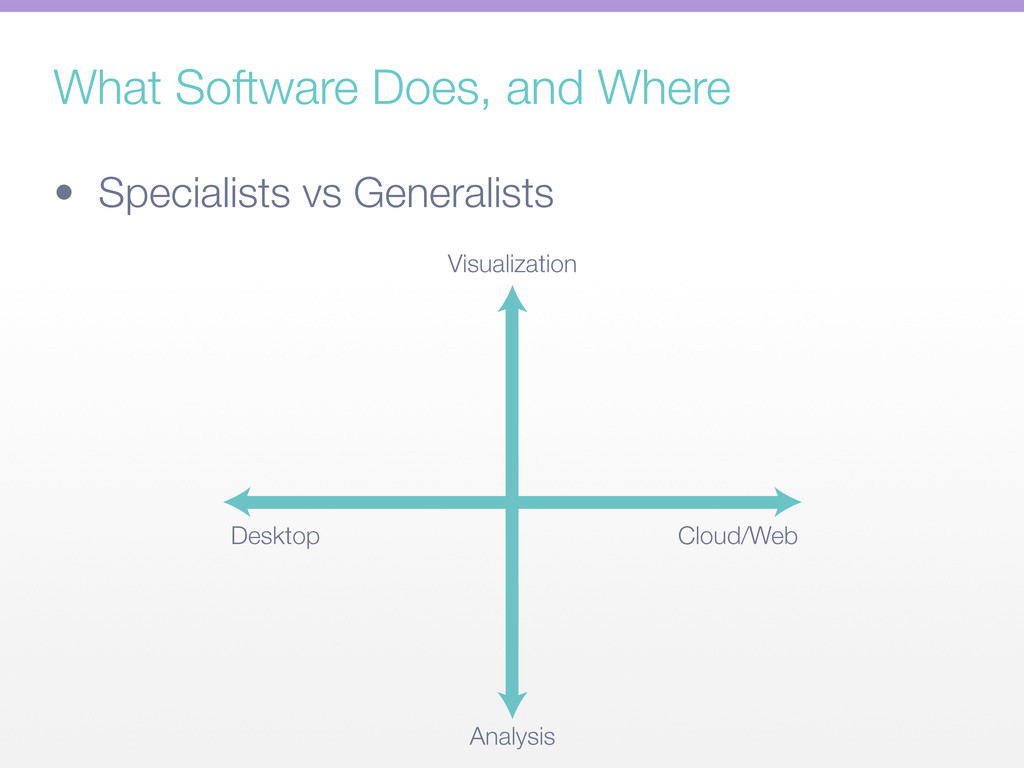
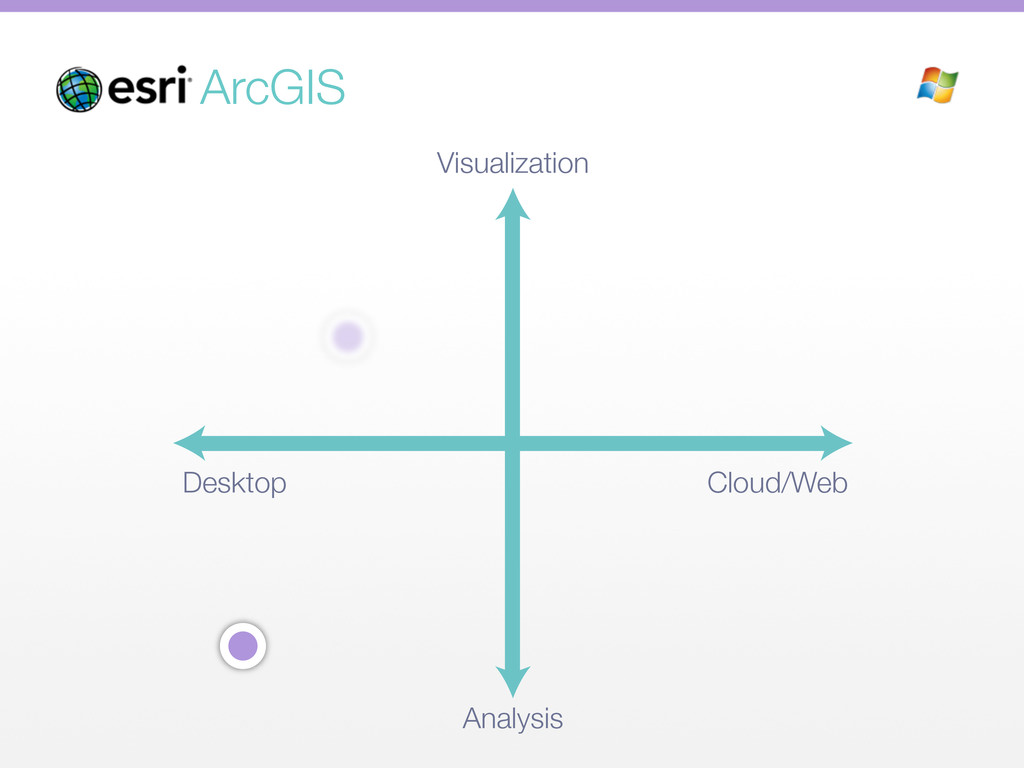
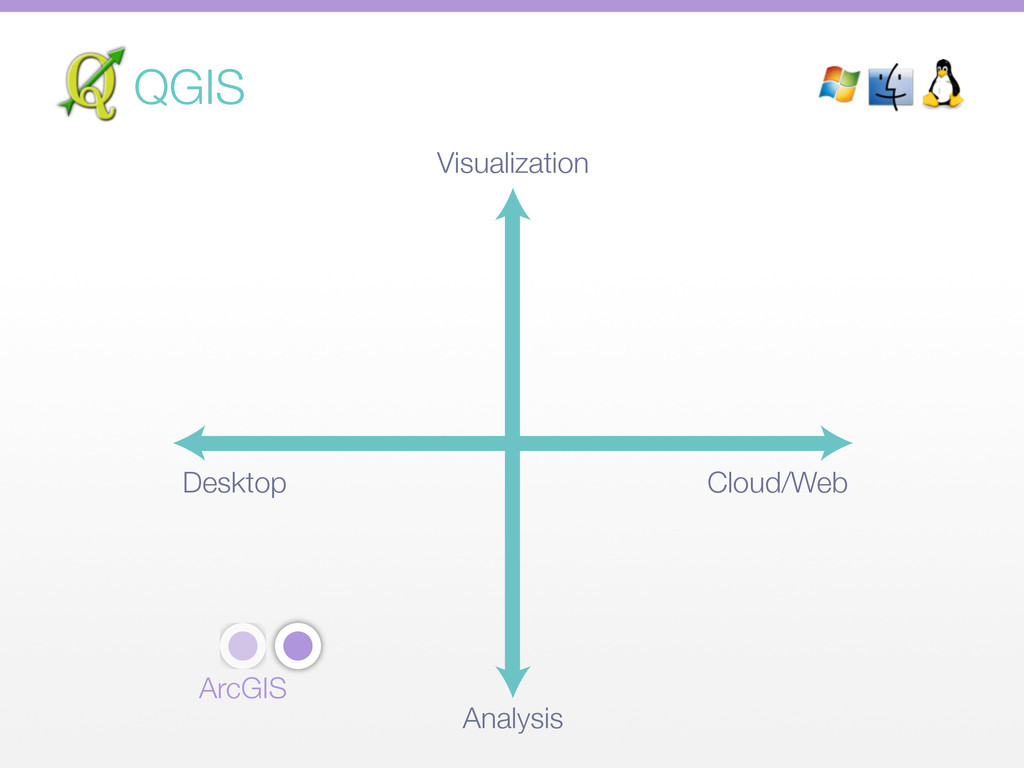
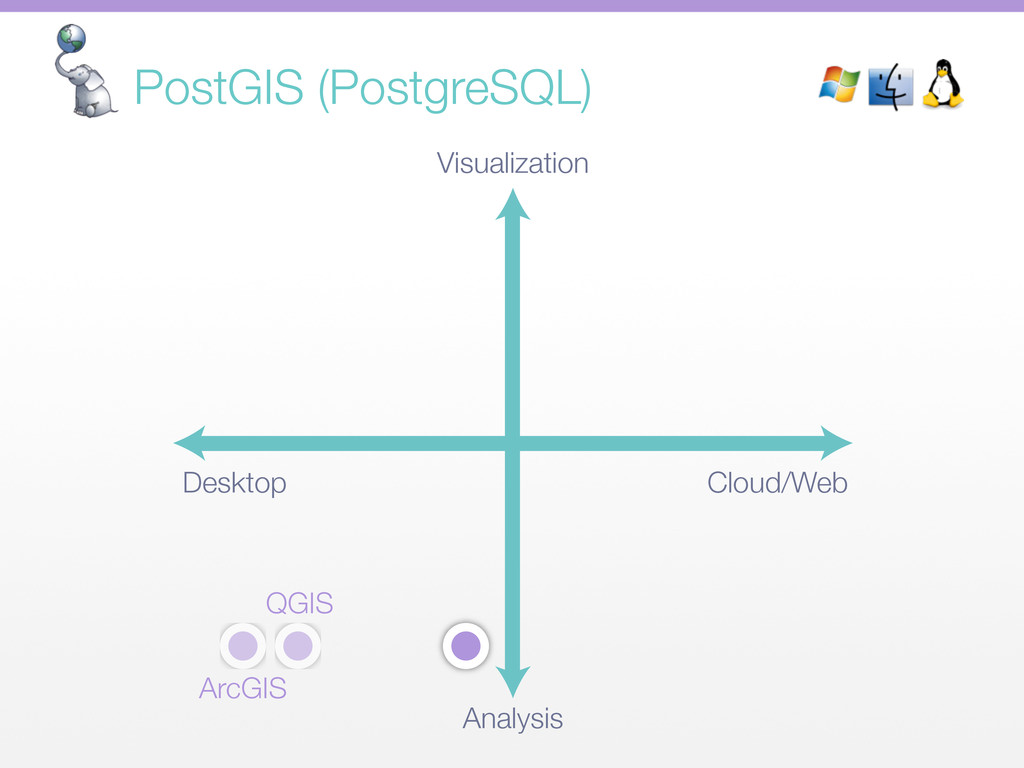
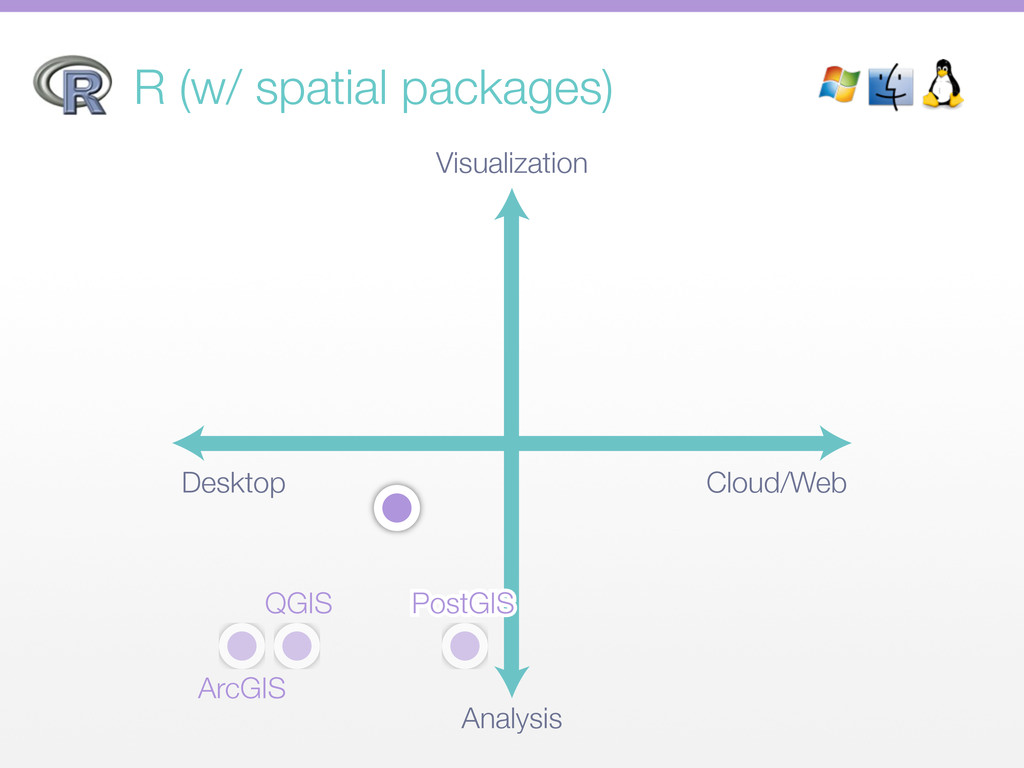
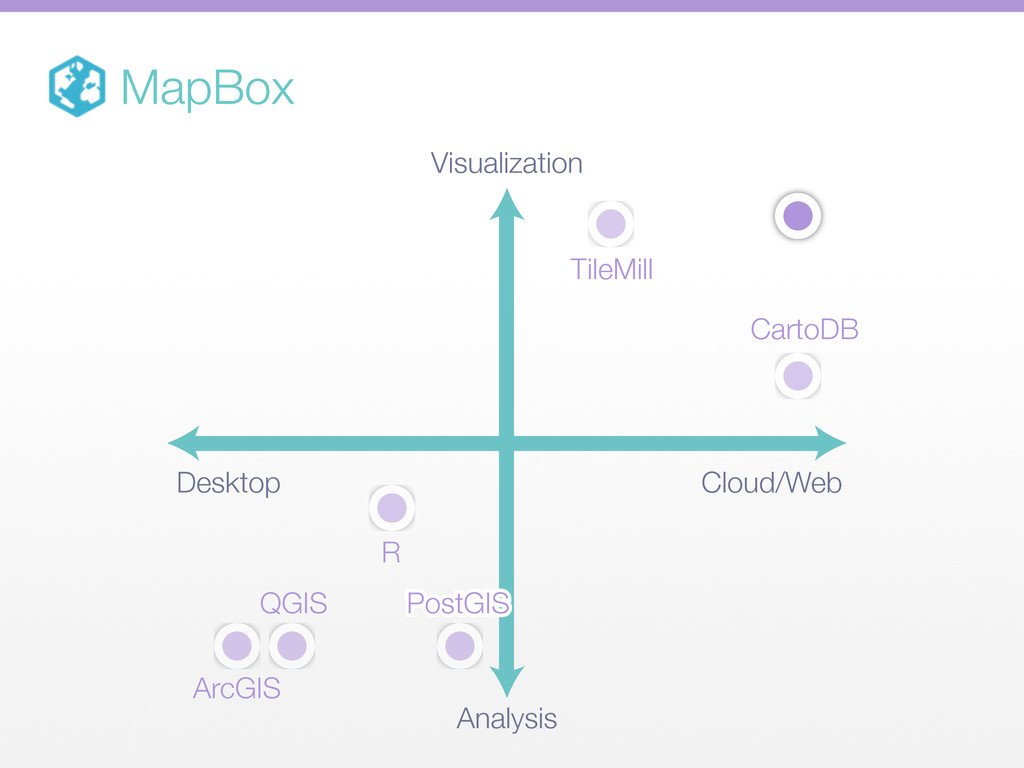
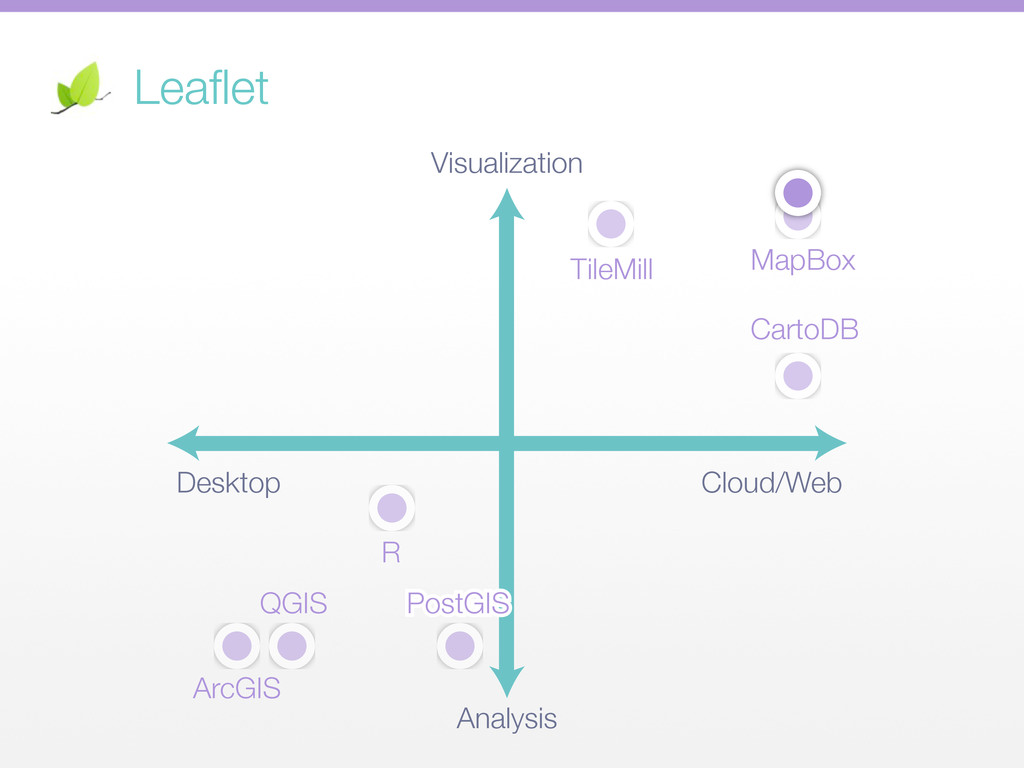
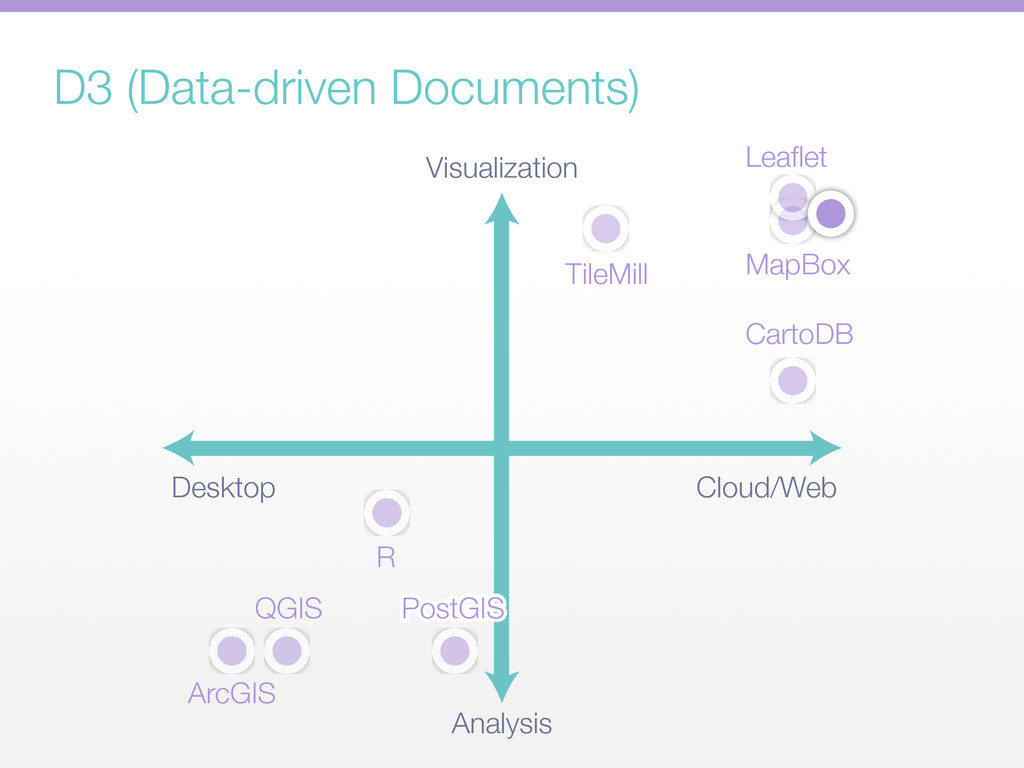
This talk briefly and broadly introduces some popular mapping software for the desktop and web. Each is aligned on a spectrum between visualization and analysis, as a minor update to my January 2013 presentation on the same topic.
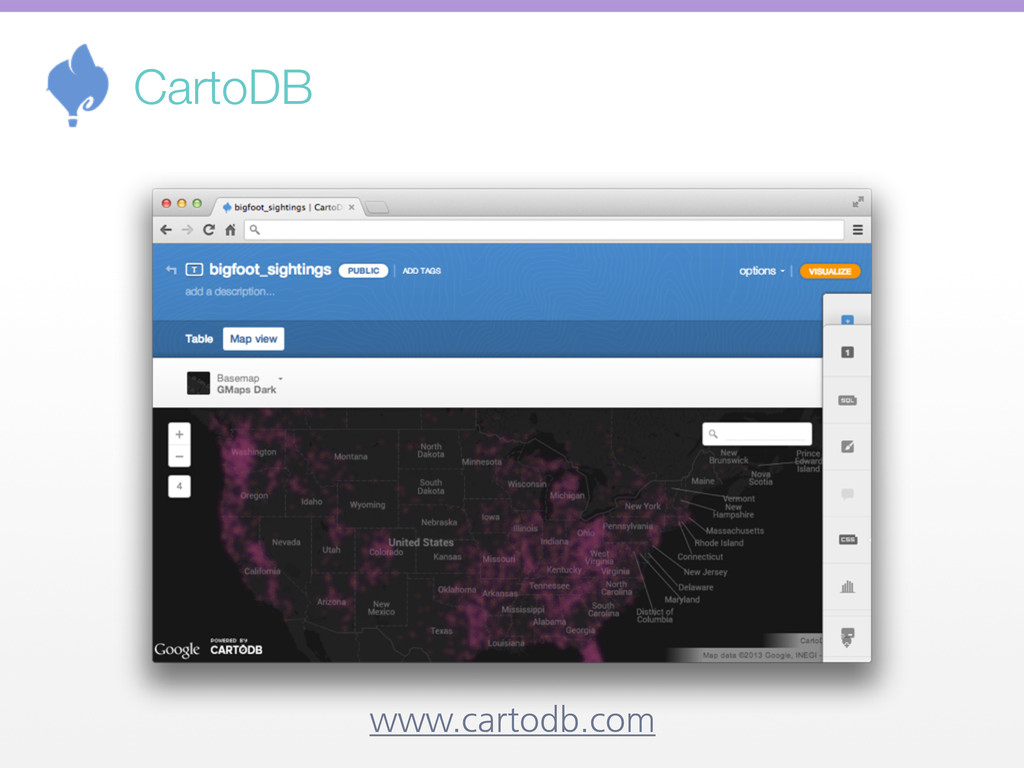
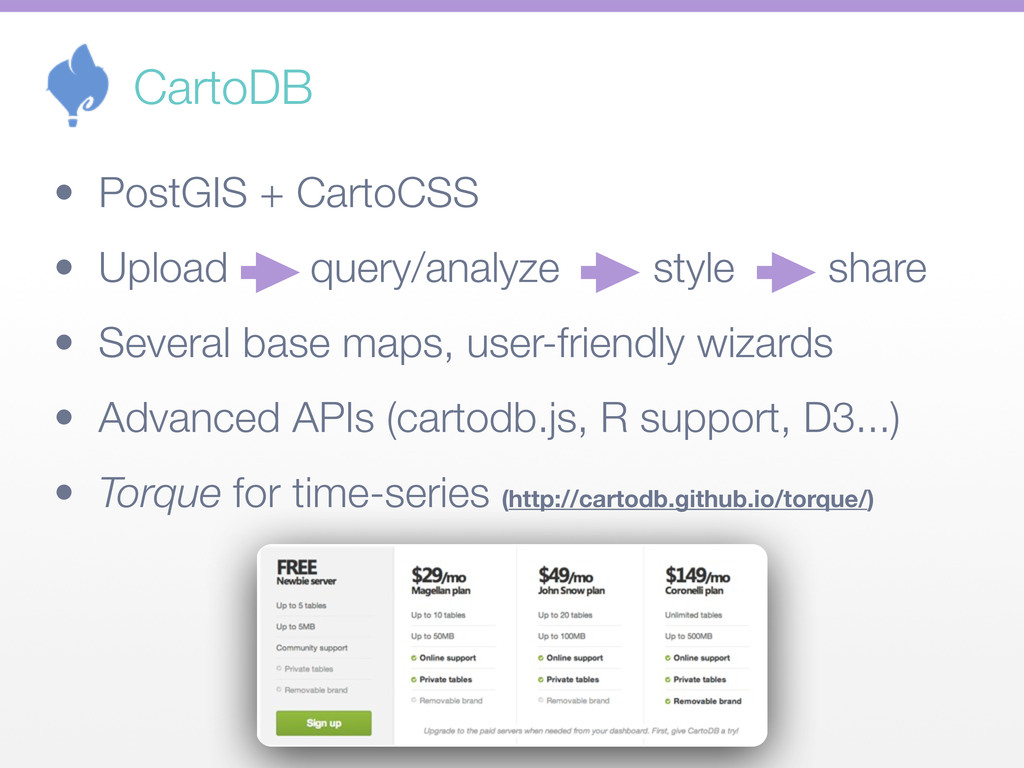
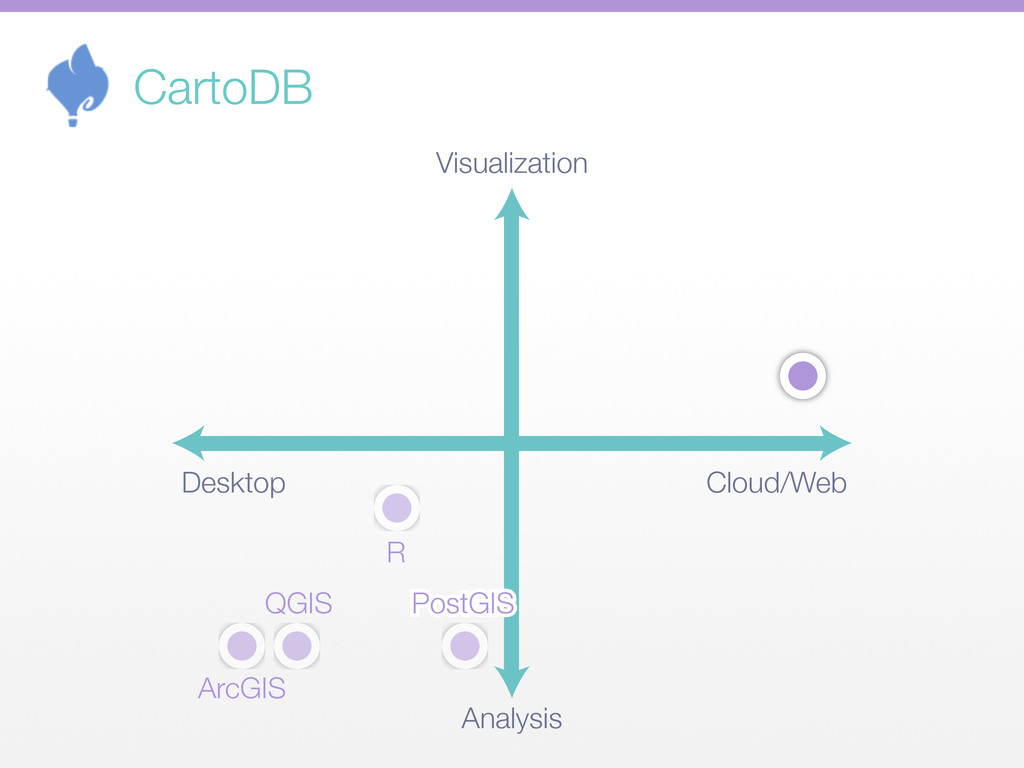
Several base maps, user-friendly wizards • Advanced APIs (cartodb.js, R support, D3...) • Torque for time-series (http://cartodb.github.io/torque/) CartoDB
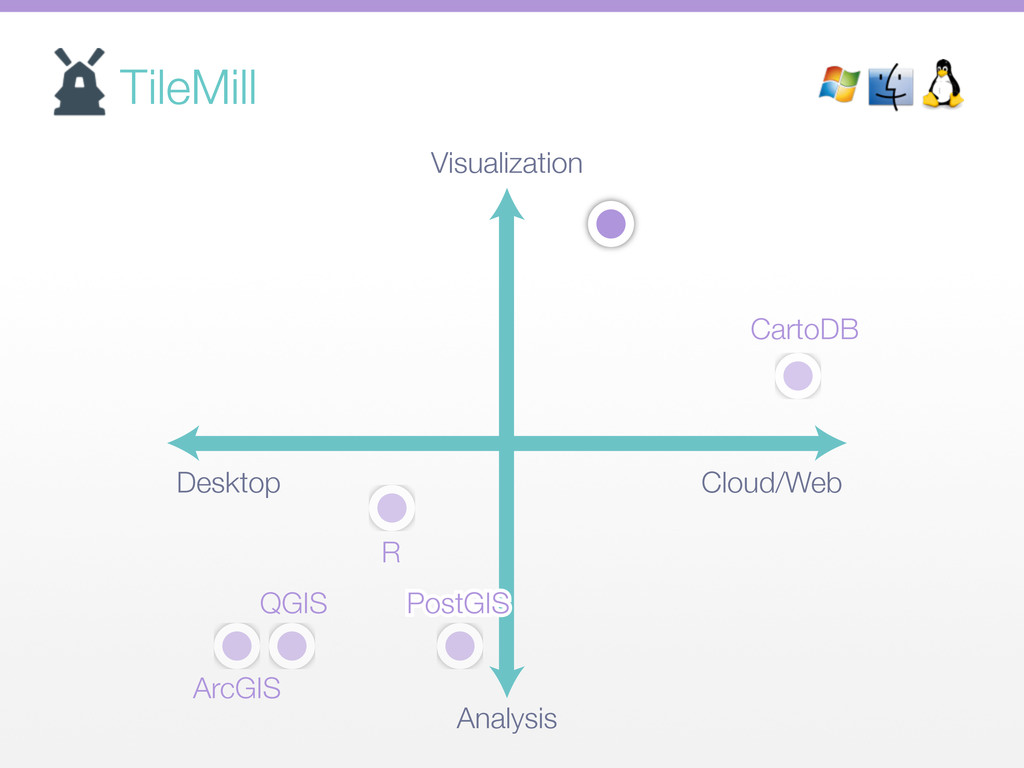
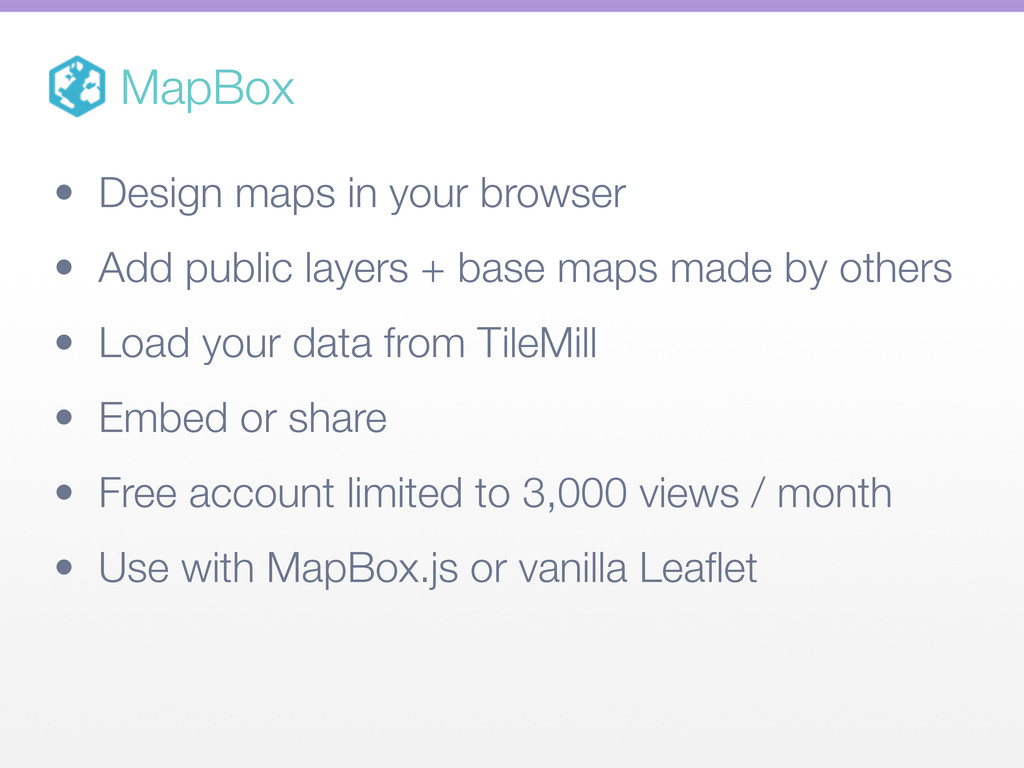
+ base maps made by others • Load your data from TileMill • Embed or share • Free account limited to 3,000 views / month • Use with MapBox.js or vanilla Leaflet MapBox
markers, lines, polygons • Very interactive • Pairs well with other libraries (e.g., D3) • Basis for many others (MapBox.js, HugePic) • Awesome support, getting simpler (better!) Leaflet
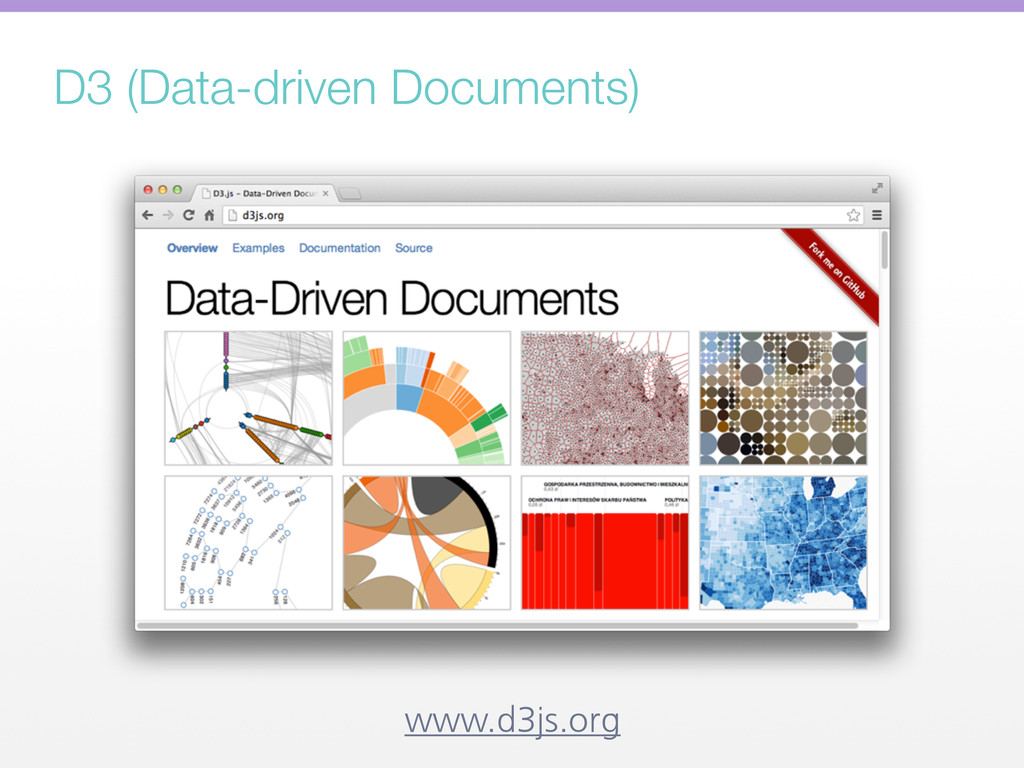
capable, many examples online • Steep learning curve, requires JS proficiency • Maps are only a small facet of D3 • Great when combined with other libraries (CartoDB.js/Torque, MapBox.js, Leaflet) D3 (Data-driven Documents)