Upgrade to Pro — share decks privately, control downloads, hide ads and more …

Kafka vs. Pulsar: Performance Evaluation by Pet...

Kafka vs. Pulsar: Performance Evaluation by Petabyte-Scale Streaming Platform Providers

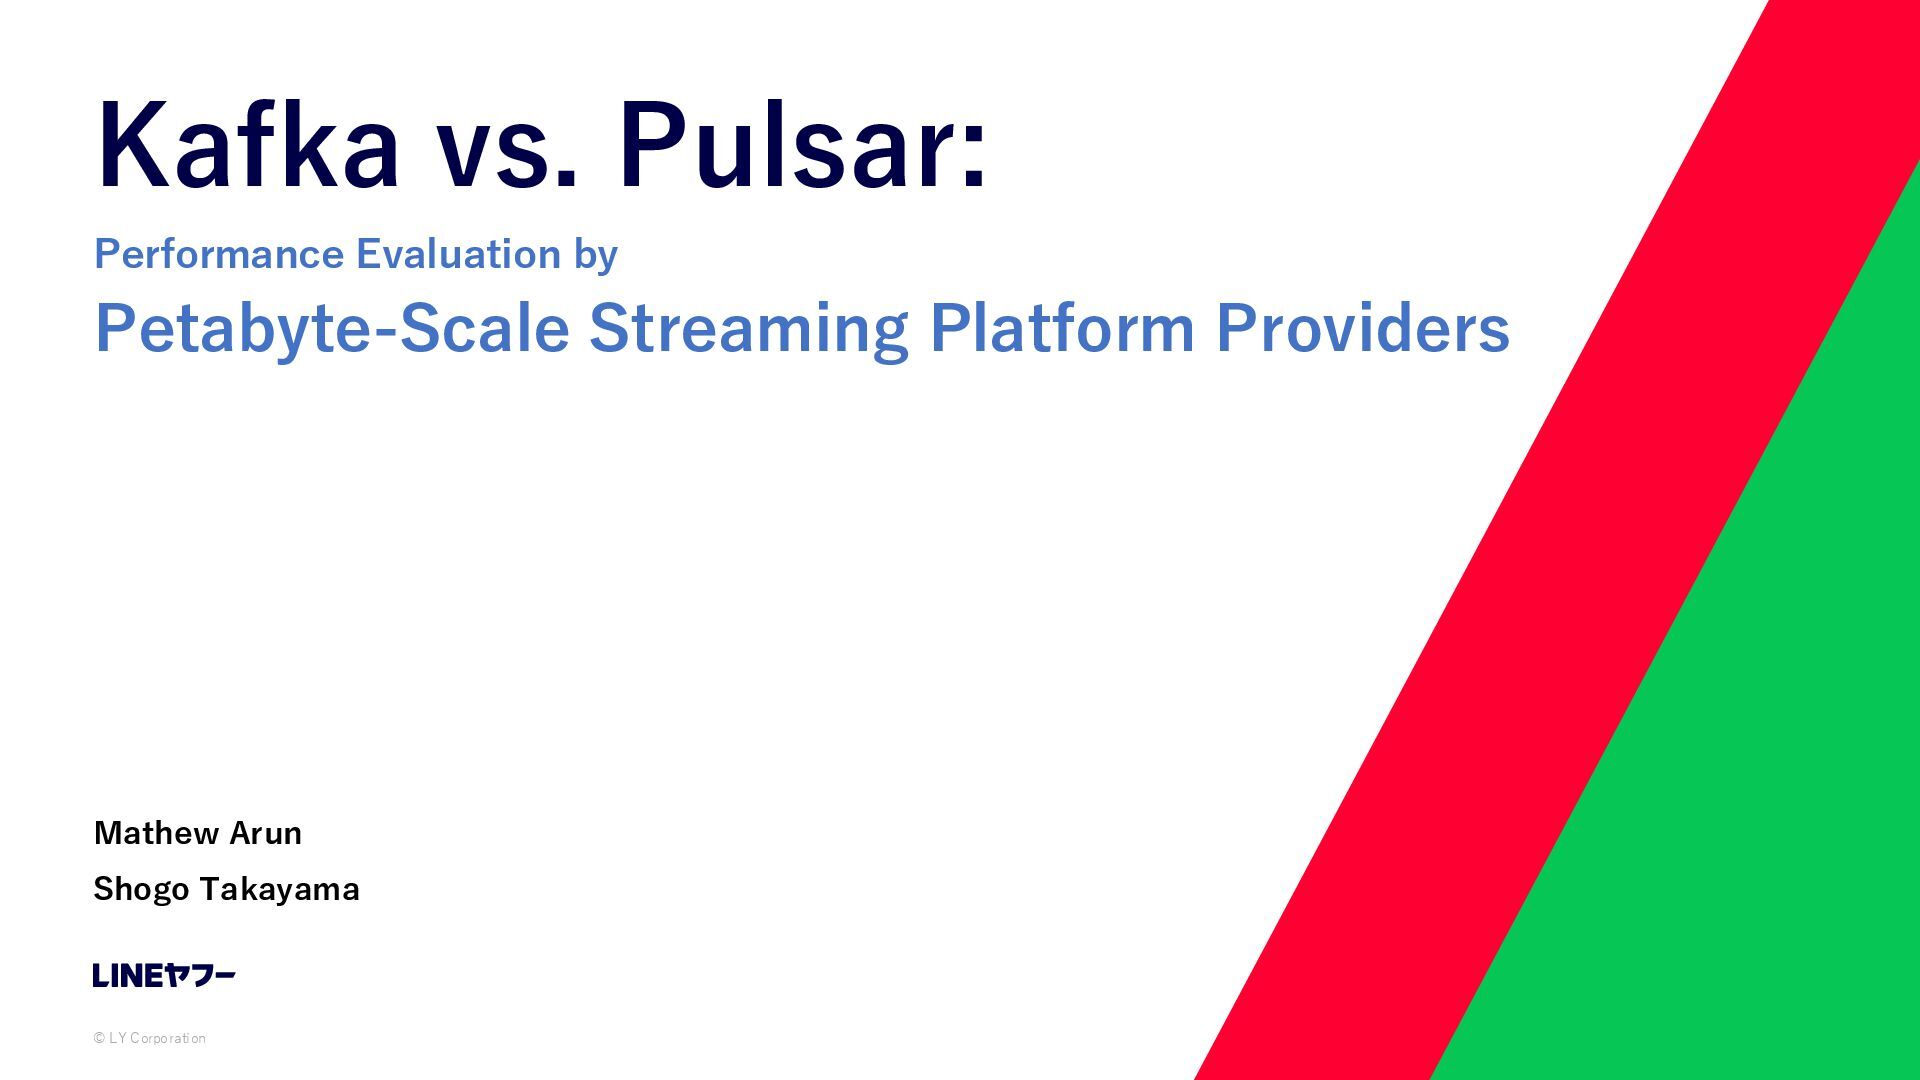
"Kafka vs. Pulsar, which is faster?" - A question faced by everyone when selecting a modern data streaming platform. We took up the challenge to answer that question rigourously.
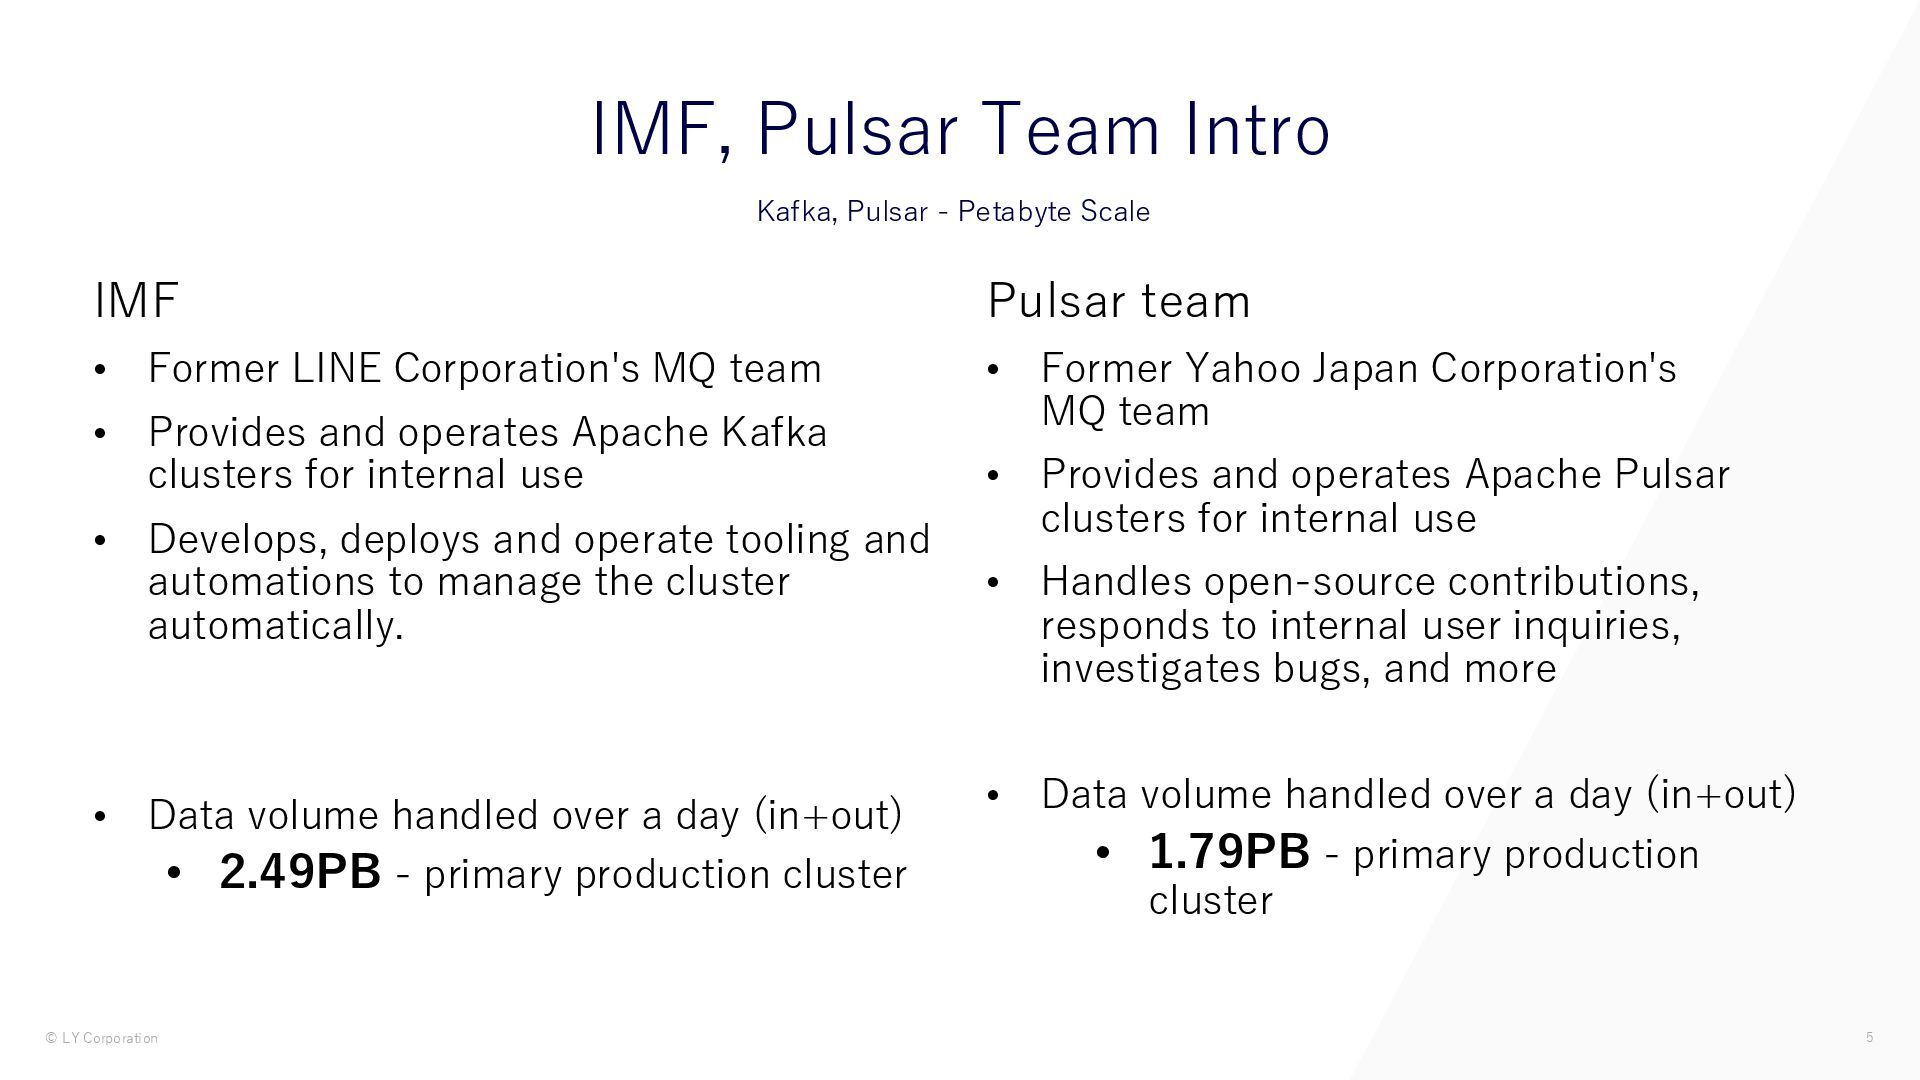
LINEヤフー is a rare company which uses large scale production clusters of both Apache Kafka and Apache Pulsar. Following the merger, former LINE Kafka team and the former Yahoo Pulsar team brought together the know-how they have cultivated through large-scale production operations of their respective platforms.
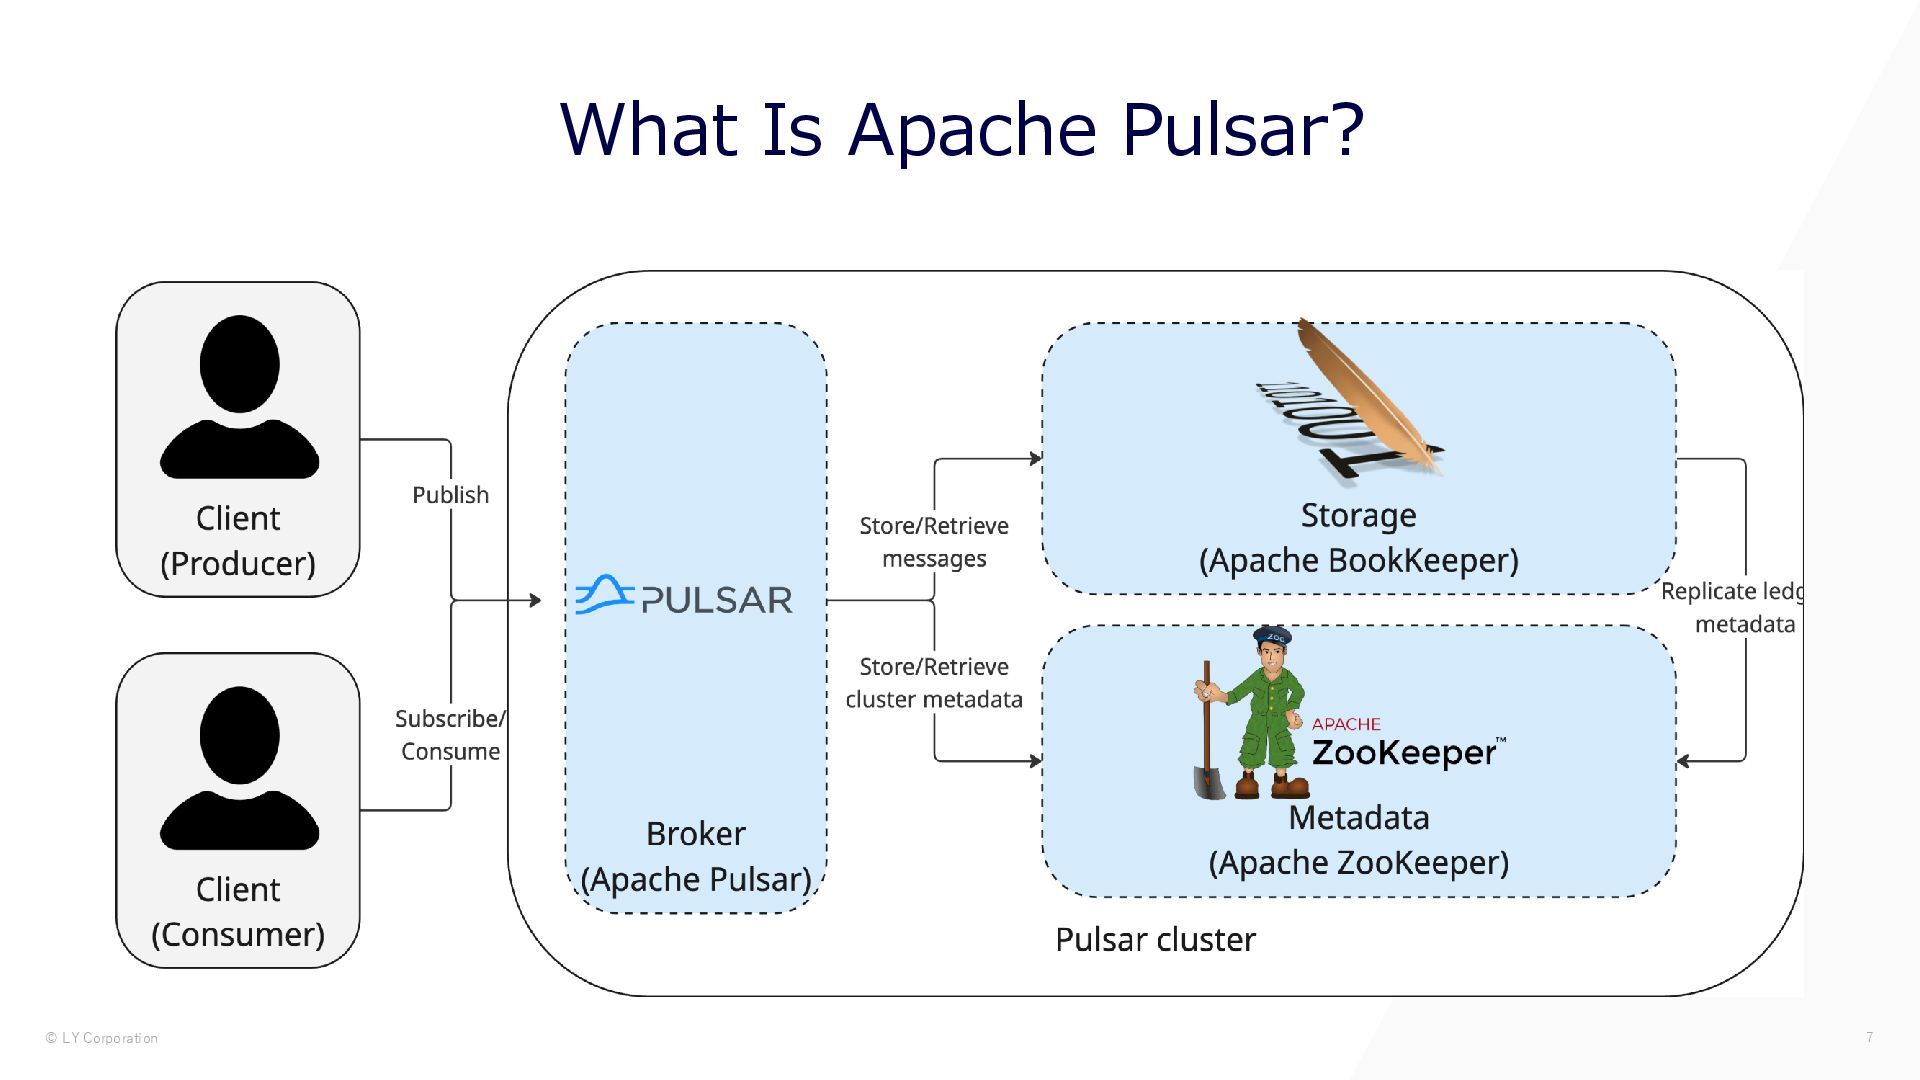
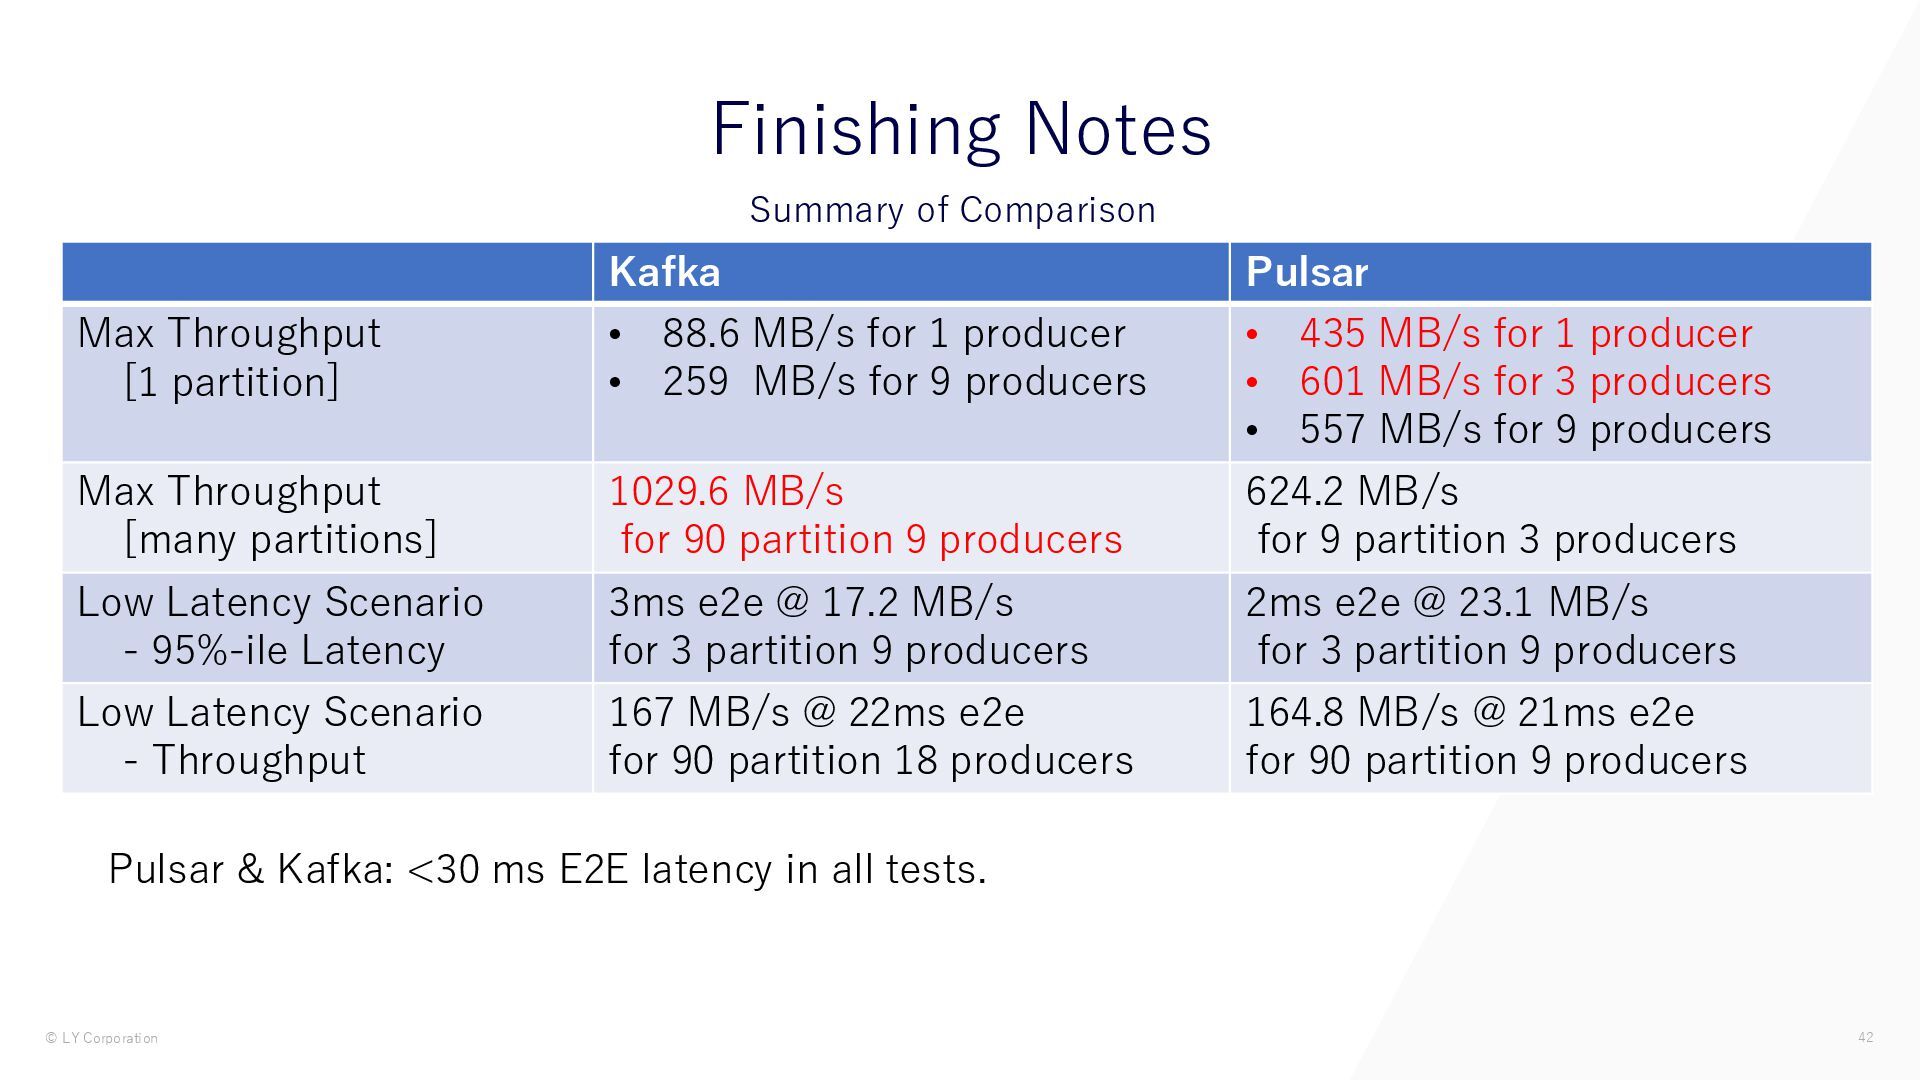
Leveraging these strengths, we present the results of a Kafka vs. Pulsar benchmark comparing multiple workload scenarios. Focusing on throughput and latency, we will explore how bottlenecks arise in both products and determine which is faster.

More Decks by LINEヤフーTech (LY Corporation Tech)

Other Decks in Technology

Transcript

  1. © LY Corporation Kafka vs. Pulsar: Performance Evaluation by Petabyte-Scale

    Streaming Platform Providers Mathew Arun Shogo Takayama
  2. © LY Corporation Agenda 01 Introduction 02 Benchmarking – Why

    we did it & how we did it 03 Test Scenarios & Measurements 04 Outcomes/Surprises 05 Finishing Notes 2
  3. © LY Corporation Mathew Arun [マテュ アルン] Server Side Engineer

    IMF Kafka Team, LINE Dev Group Joined : August 2020 Hobbies : Motorcycle Riding, Snowboarding 高山 翔吾 [Takayama Shogo] Server Side Engineer Pulsar Team, SI Group Joined : June 2018 Hobbies : Cooking, Games About Us 4
  4. © LY Corporation IMF • Former LINE Corporation's MQ team

    • Provides and operates Apache Kafka clusters for internal use • Develops, deploys and operate tooling and automations to manage the cluster automatically. • Data volume handled over a day (in+out) • 2.49PB - primary production cluster Pulsar team • Former Yahoo Japan Corporation's MQ team • Provides and operates Apache Pulsar clusters for internal use • Handles open-source contributions, responds to internal user inquiries, investigates bugs, and more • Data volume handled over a day (in+out) • 1.79PB - primary production cluster Kafka, Pulsar - Petabyte Scale 5 IMF, Pulsar Team Intro
  5. © LY Corporation Apache Pulsar is an open-source Messaging Platform,

    similar to Kafka. Key differences from Kafka: • Broker & storage layers are decoupled - each scales independently • Broker => routing, BookKeeper => storage • One topic can serve as both a stream and a queue • 4 subscription types; consumer picks What Is Apache Pulsar? 6
  6. © LY Corporation • Merger & MQ Strategy • LINE

    Corporation + Yahoo Japan Corporation + More → LY Corporation • Considered one MQ; decided to keep both Pulsar & Kafka • Teams can now choose Kafka or Pulsar per use case • We built guidelines and in-house performance tests to aid selection • Moreover, LY is a rare case where Kafka and Pulsar are operated in PB scale 9 Performance Benchmarking Motivation
  7. © LY Corporation 10 Benchmarking Host spec CPU Memory Storage

    LAN • Kafka Broker x3 • Pulsar Broker x3 • Pulsar BookKeeper x3 All Bare Metal Servers Xeon Silver 4210 (2 CPU) 192 GB • HDD 8TB x12 (RAID 5) • SSD 480GB x2 (RAID 1) • 25GbE SFP28 (2 port) • ZooKeeper (Shared) x5 • VMs 8 vCPU 16 GB 100GB SSD - • Benchmark Worker x12 • Rich VMs 20 vCPU 240 GB 500GB SSD - • Prometheus x1 • VM 12 vCPU 48 GB 100GB SSD - * Sharing the Zookeeper, as the resource requirement is less, and since the experiments are scattered
  8. © LY Corporation To conduct the load tests, we configured

    each platform as closely as possible to the setups used in our production environment. • Kafka • Version: v3.3.2 (with a few internal patches) • Replication factor: 3 • min.insync.replica: 2 • Pulsar • Version: v2.11.0 • Ensemble size: 3, Write Quorum: 2, Ack Quorum: 2 • Subscription Type: Failover 11 Major Server Configurations
  9. © LY Corporation 12 Major Client Configurations Config Throughput Low-Latency

    Kafka linger.ms 1000 ms 0 batch.size 1 MB 1 MB acks all all max.in.flight.requests.per.connection 1 1 Pulsar batchingEnabled true false batchingMaxBytes 1 MB 1 MB batchingDelay 1000 ms 1000 ms
  10. © LY Corporation • Open-source benchmark framework maintained under the

    OpenMessaging project. • URL: https://openmessaging.cloud/docs/benchmarks/ • Apache 2.0 License • Purpose • Generate reproducible, vendor-neutral workloads for “log-based MQ” systems. • Built-in Drivers • Apache Kafka, Apache Pulsar, RocketMQ, Redis … • Key Features • Workload defined as simple YAML (msg size, rate, partitions, key strategy …) • Distributed workers → horizontal load generation on any number of nodes. • Prometheus-friendly metrics & automatic latency histograms. 14 What is OpenMessagingBenchmark (OMB)?
  11. © LY Corporation 1. Max Throughput – Batch 1 MB

    2. Low-Latency 3. Max Throughput – compression(zstd) 4. Keyed Throughput 5. Consumer Catch-up 1TB backlog 6. Recovery 7. Broadcast Note: Today's presentation will focus on Scenarios 1-2. 16 Test Scenarios
  12. © LY Corporation • OMB has an option to discover

    max sustainable throughput - peak throughput • no backlog -> ramp up produce rate • backlog -> ramp down produce rate • latency values vary widely due to this behavior • So, we (re-)run experiments at 90% of peak throughput to get stable latency figures. • Throughput - 90% of the peak throughput • Max stable produce rate that the consumer can keep up with • Latency - End to End Latency : Message Consume Time - Message Send (API call) Time • We show 95%-ile e2e latency in our graphs Regarding Throughput & Latency Measurements 17
  13. © LY Corporation As explained in Kafka Protocol documentation. “The

    server guarantees that on a single TCP connection, requests will be processed in the order they are sent and responses will return in that order as well. The broker’s request processing allows only a single in- flight request per connection in order to guarantee this ordering.” • A connection means any connection between client to broker, or between broker to broker. • Each connection shown in this diagram processes requests in sequence • Higher latency => lower request rate • Bottlenecks • 1 - 3 Producer : P2B rate • > 3 Producers : B2B rate 22 Why Kafka throughput is lower for Single partition? Experimentally Observed Throughput Limits per Connection
  14. © LY Corporation • For more Throughput : Use More

    Connections • Increase producers –> more producer connections -> more simultaneous requests • until replica fetcher connection [broker to broker] saturates • Increase partitions -> more producer connections -> more simultaneous requests & more replica fetcher connections 23 Why Kafka throughput is lower for Single partition?
  15. © LY Corporation • 1-partition test → 1 Pulsar broker

    • 3 BookKeeper nodes (E=3, WQ=2, AQ=2) • Data striped across all Bookie nodes • Broker → BookKeeper writes: asynchronous & pipelined • ACK sent after SSD-journal write 24 Advantages of Apache Pulsar in Single-Partition Scenarios
  16. © LY Corporation 28 Pulsar Write Throughput: Theoretical Upper Limit

    400MB/s 400MB/s 400MB/s (400MB/s x3) / 2replica = limit: 600MB/s
  17. © LY Corporation Regardless of the partition count • Once

    throughput approaches the SSD’s performance ceiling • BookKeeper can no longer drain its write queue fast enough • Latency then begins to rise • BookKeeper starts throttling some writes • Consequently • the produce rate declines • end-to-end latency increases 29 Pulsar Write Throughput: Theoretical Upper Limit
  18. © LY Corporation 9 Partition - Varying Producer Case •

    For producer count 1 through 3, the bottleneck is on the producer to broker connection • The sequential request processing limits the produce request rate. • For producer counts 6 and 9, the connections for the inter-broker replication becomes the bottleneck • Affected by the same sequential request processing. 9 Producer - Varying Partition Case • 1 partition : bottlenecked at the single replica fetcher connection used between Followers -> Leader • 3 partition : uses 3 times more replica fetchers than 1 partition, 2.5 x 1 partition rates, not quite 3x • 9 partition : • uses 3 times more replica fetchers than 3 partition (18 connections) • each broker leads 3 partitions => ProduceRequest has 1-3 batches for multiple partitions • increases the processing time on the broker side • replica fetchers will have to wait more before the messages area ready for replication • leading to a lower replica fetch request rate 32 Kafka Throughput Analysis
  19. © LY Corporation • Per Broker Leader Replica Count -

    3 Broker cluster • 1 - 3 Partitions : 1 leader • 9 Partitions : 3 leaders per • 90 Partitions : 10 leaders • Produce Request groups message batches destined for same broker. • linger.ms=0 • means client will wait for at least 0ms before sending message batch out • means if multiple message gets send very close, they may be batched together • 1 leader per broker -> Produce Request for that broker will have at most 1 batch • 2+ leaders per broker -> Produce Request may have more than one batch • More latency 36 Why Kafka Latency Increased for 9+ Partitions?
  20. © LY Corporation Factors Influencing the Results • Additional partition

    enables more concurrent writes to all three BookKeeper nodes. • However, the low-latency workload is sensitive to the “pending-request limit,” making broker-side throttling more likely. 37 Why Did Pulsar’s Throughput Surge?
  21. © LY Corporation Summary of Comparison 42 Finishing Notes Kafka

    Pulsar Max Throughput [1 partition] • 88.6 MB/s for 1 producer • 259 MB/s for 9 producers • 435 MB/s for 1 producer • 601 MB/s for 3 producers • 557 MB/s for 9 producers Max Throughput [many partitions] 1029.6 MB/s for 90 partition 9 producers 624.2 MB/s for 9 partition 3 producers Low Latency Scenario - 95%-ile Latency 3ms e2e @ 17.2 MB/s for 3 partition 9 producers 2ms e2e @ 23.1 MB/s for 3 partition 9 producers Low Latency Scenario - Throughput 167 MB/s @ 22ms e2e for 90 partition 18 producers 164.8 MB/s @ 21ms e2e for 90 partition 9 producers Pulsar & Kafka: <30 ms E2E latency in all tests.
  22. © LY Corporation Kafka • Single partition = 1 TCP

    connection = only 1 in-flight request • Producer → Broker (P2B) tops out at ≈ 89 MB/s per connection • Broker → Broker (B2B, replica fetcher) tops out at ≈ 260 MB/s per connection Pulsar • Throughput focus → SSD write bandwidth is the hard ceiling • Latency focus → Number of in-flight Produce requests waiting for ACKs • Growing callback queue → BookKeeper processing threads are saturated Main Bottlenecks 43 Finishing Notes