Upgrade to Pro
— share decks privately, control downloads, hide ads and more …
Speaker Deck
Features
Speaker Deck
PRO
Sign in
Sign up for free
Search
Search
Berlin 2013 - Session - Daniele de Matteis & Ha...
Search
Monitorama
September 19, 2013
490
3
Share
Embed
Copy iframe code
Copy JS code
Copy link
Start on current slide
Berlin 2013 - Session - Daniele de Matteis & Harry Wincup
Monitorama
September 19, 2013
More Decks by Monitorama
See All by Monitorama
Monitorama PDX 2017 - Ian Bennett
monitorama
1
630
PDX 2017 - Pedro Andrade
monitorama
0
830
PDX 2017 - Roy Rapoport
monitorama
4
1k
PDX 2017 - Julia Evans
monitorama
0
520
Berlin 2013 - Session - Brad Lhotsky
monitorama
5
770
Berlin 2013 - Session - Alex Petrov
monitorama
6
730
Berlin 2013 - Session - Jeff Weinstein
monitorama
2
670
Berlin 2013 - Session - Oliver Hankeln
monitorama
1
600
Berlin 2013 - Session - David Goodlad
monitorama
0
520
Featured
See All Featured
For a Future-Friendly Web
brad_frost
183
10k
Building Better People: How to give real-time feedback that sticks.
wjessup
370
20k
[Rails World 2023 - Day 1 Closing Keynote] - The Magic of Rails
eileencodes
38
2.9k
Building Applications with DynamoDB
mza
96
7.1k
Hiding What from Whom? A Critical Review of the History of Programming languages for Music
tomoyanonymous
3
1.1k
16th Malabo Montpellier Forum Presentation
akademiya2063
PRO
0
310
Intergalactic Javascript Robots from Outer Space
tanoku
273
27k
How to Grow Your eCommerce with AI & Automation
katarinadahlin
PRO
1
230
How to Build an AI Search Optimization Roadmap - Criteria and Steps to Take #SEOIRL
aleyda
1
2.1k
Redefining SEO in the New Era of Traffic Generation
szymonslowik
1
370
10 Git Anti Patterns You Should be Aware of
lemiorhan
PRO
659
62k
The Curious Case for Waylosing
cassininazir
1
440
Transcript
Monitoring, graphs and visualisations 1
Graphs are crucial 2
✦ What is good graphing? ✦ How do you achieve
it? Graphs are crucial 2
Consistency 3
! Chart needs to make sense, asap! Consistency 3
! Chart needs to make sense, asap! Ad-hoc chart type
definition Consistency 3
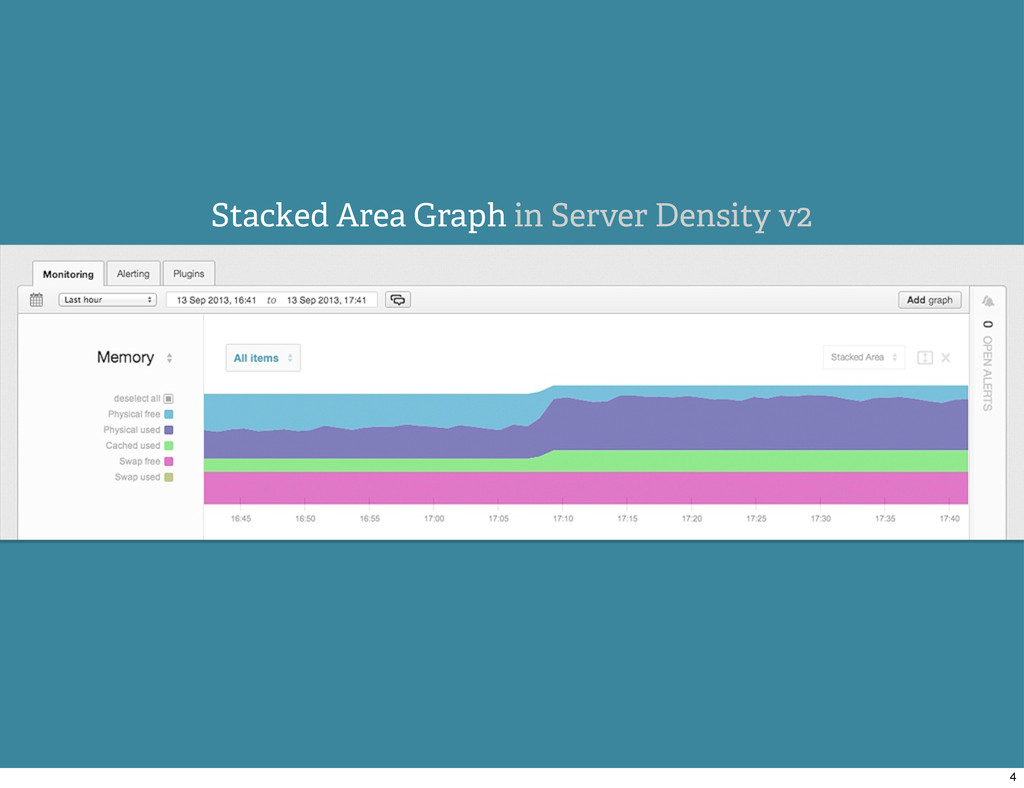
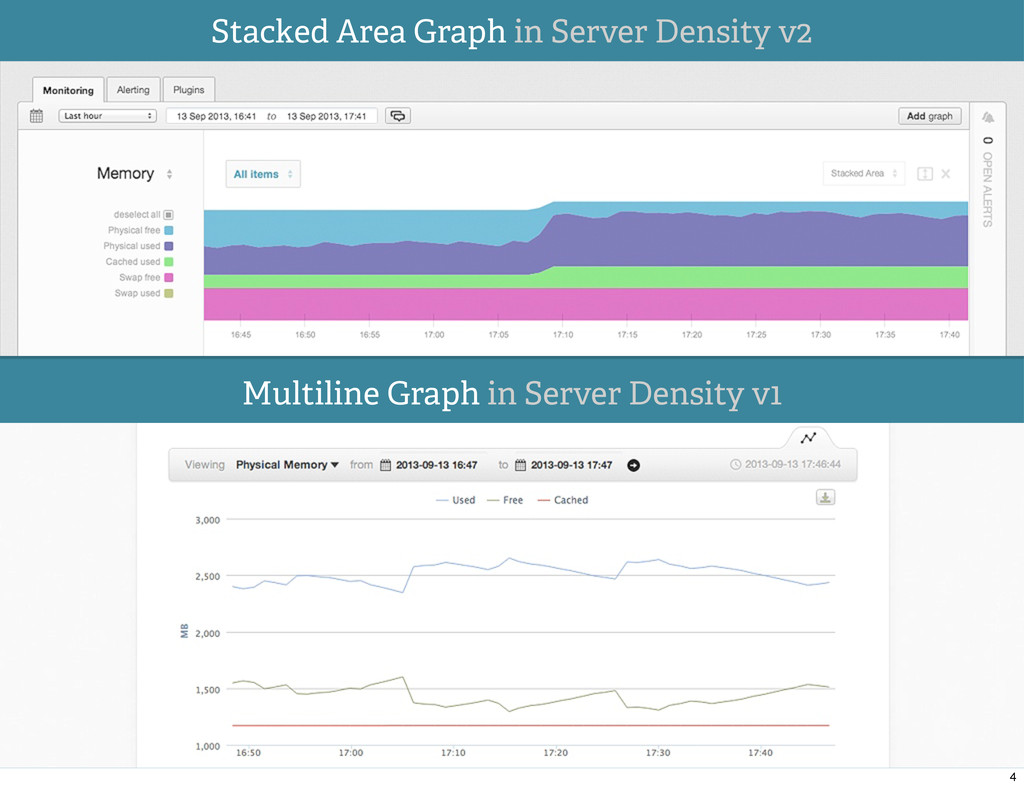
Stacked Area Graph in Server Density v2 4
Stacked Area Graph in Server Density v2 Multiline Graph in
Server Density v1 4
Context 5
! Where am I, what am I looking at? Context
5
! Where am I, what am I looking at? Display
data hierarchy Context 5
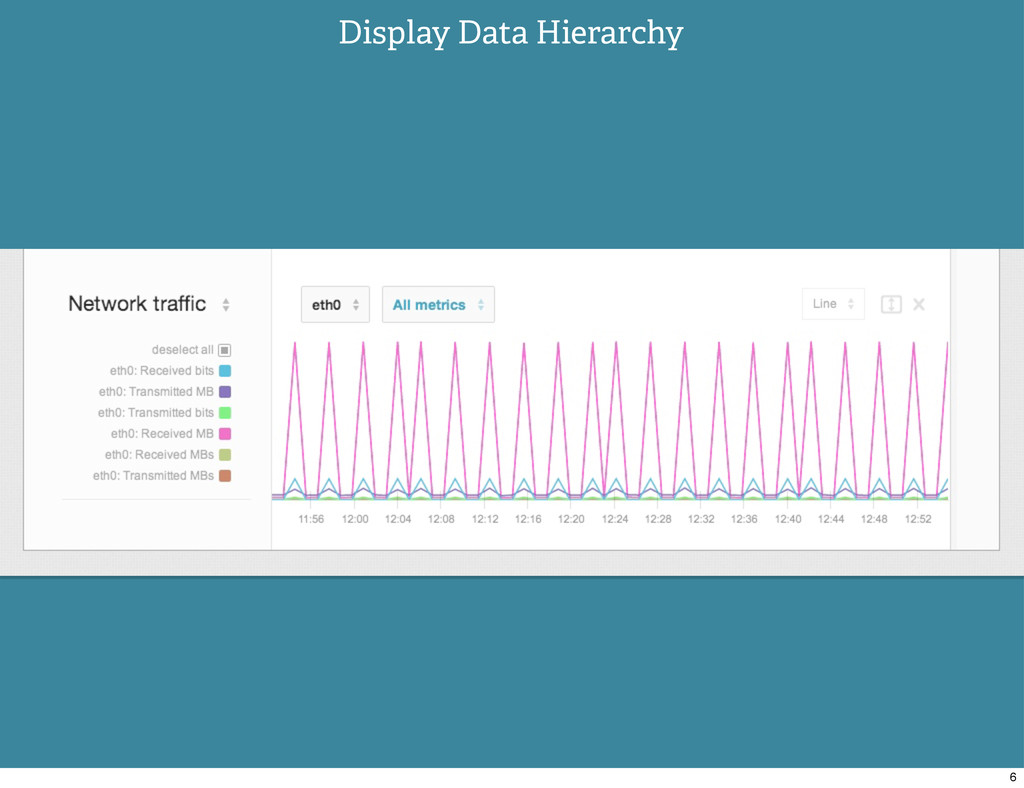
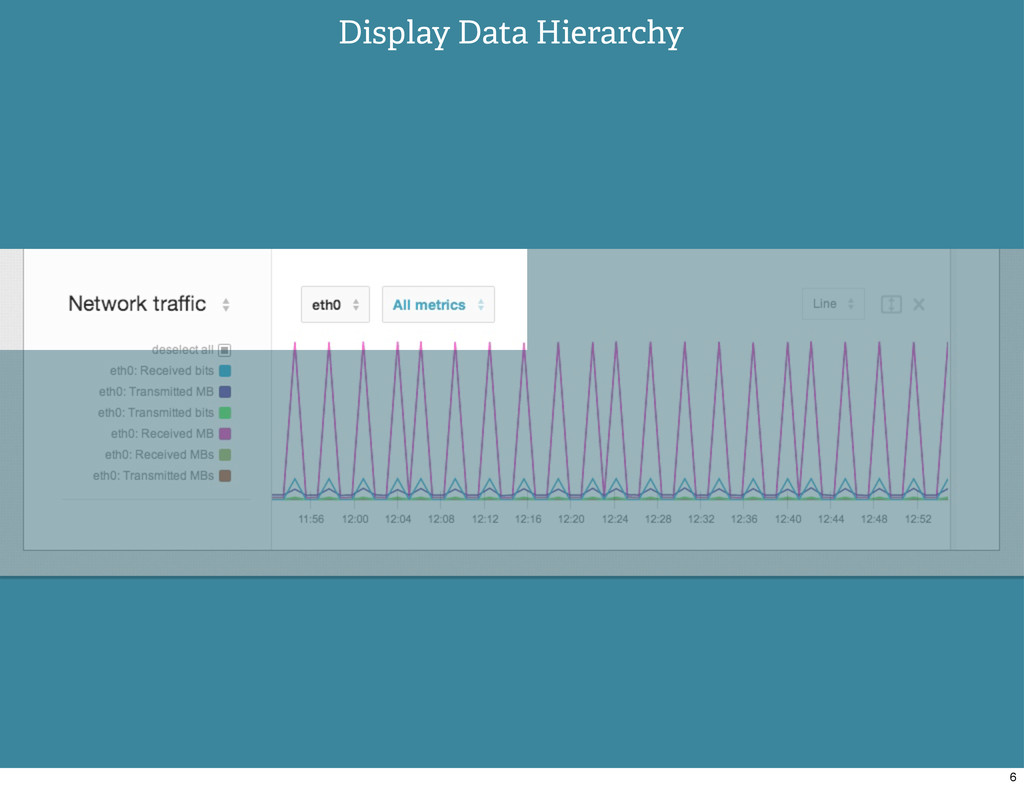
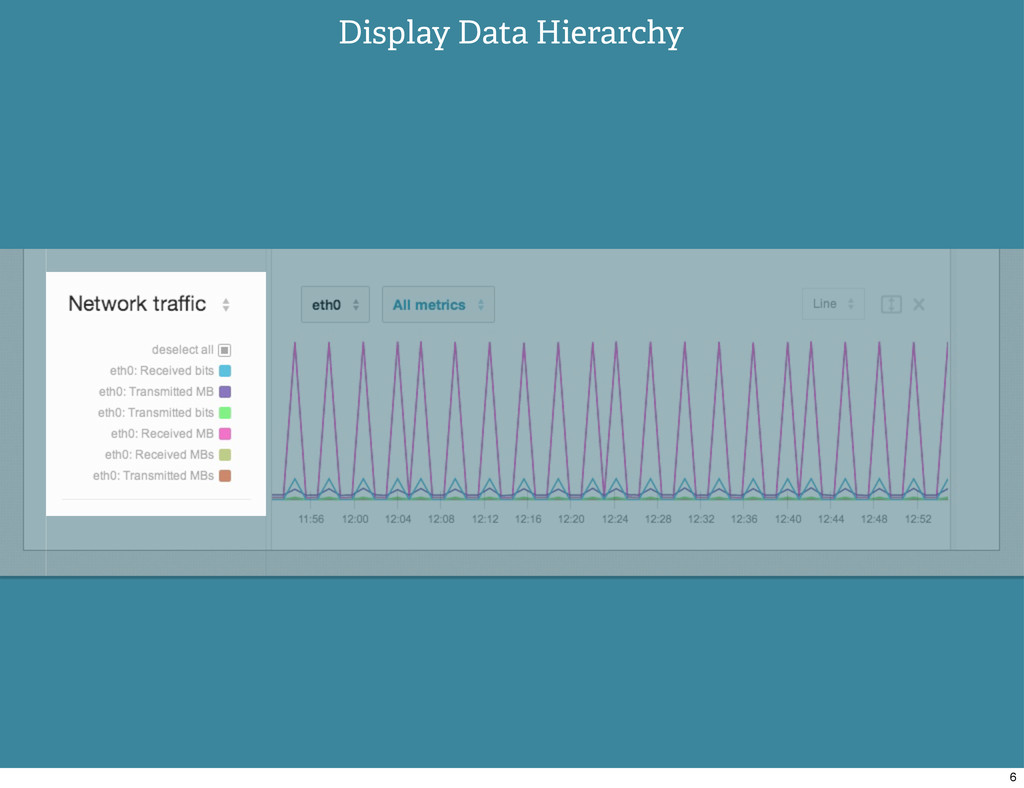
Display Data Hierarchy 6
Display Data Hierarchy 6
Display Data Hierarchy 6
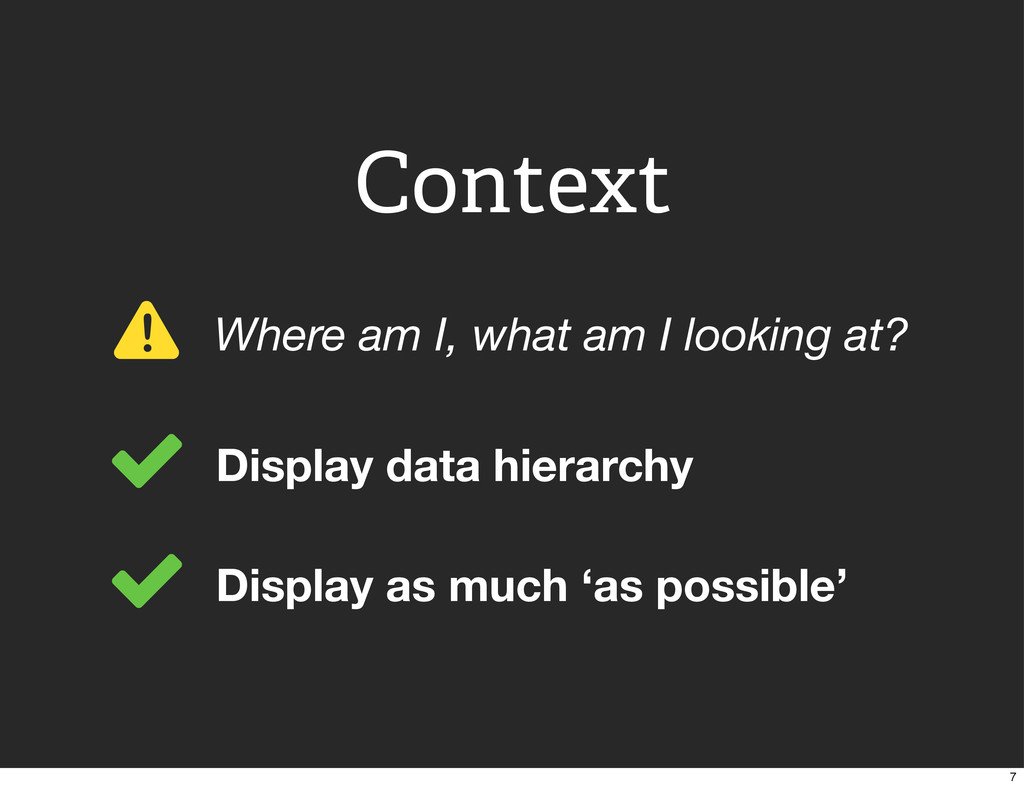
! Where am I, what am I looking at? Display
data hierarchy Display as much ‘as possible’ Context 7
Clarity 8
! Too many line series even for my 27″! Clarity
8
! Too many line series even for my 27″! Welcome
Horizon graphs. Clarity 8
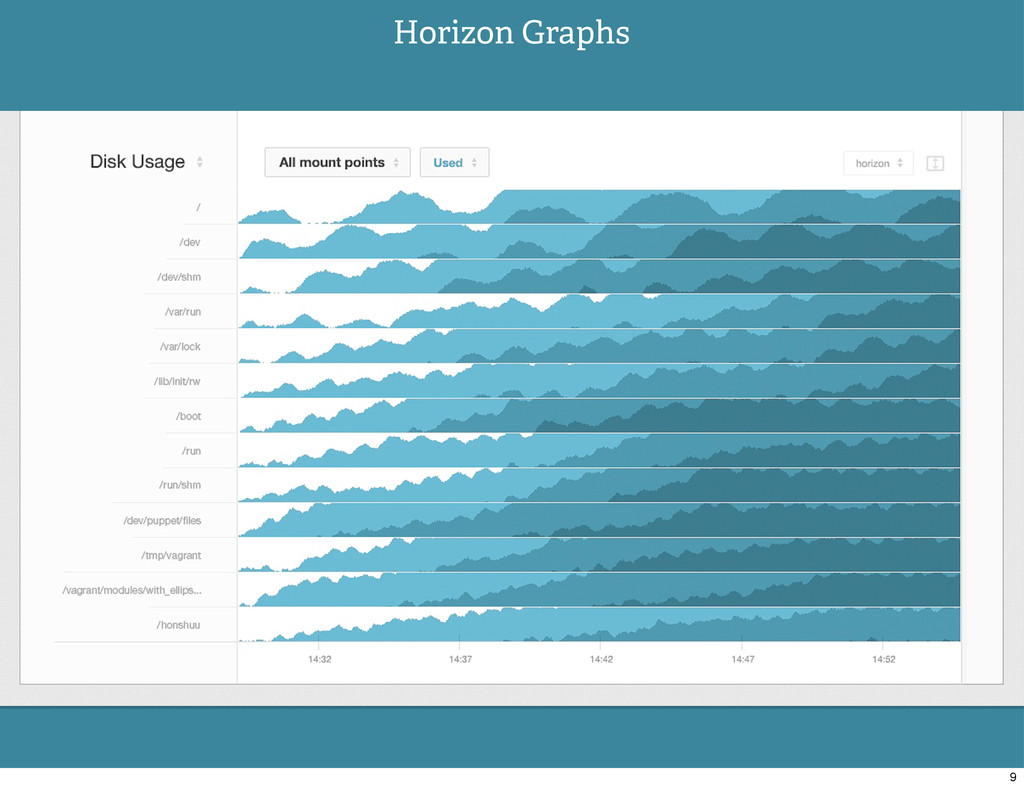
Horizon Graphs 9
! Too many line series even for my 27″! Welcome
Horizon graphs. ! There is too much on this page... Clarity 10
! Too many line series even for my 27″! Welcome
Horizon graphs. When in doubt, less ink! ! There is too much on this page... Clarity 10
Perspective 11
! Here’s a spike, so what? Perspective 11
! Here’s a spike, so what? Expose system events Perspective
11
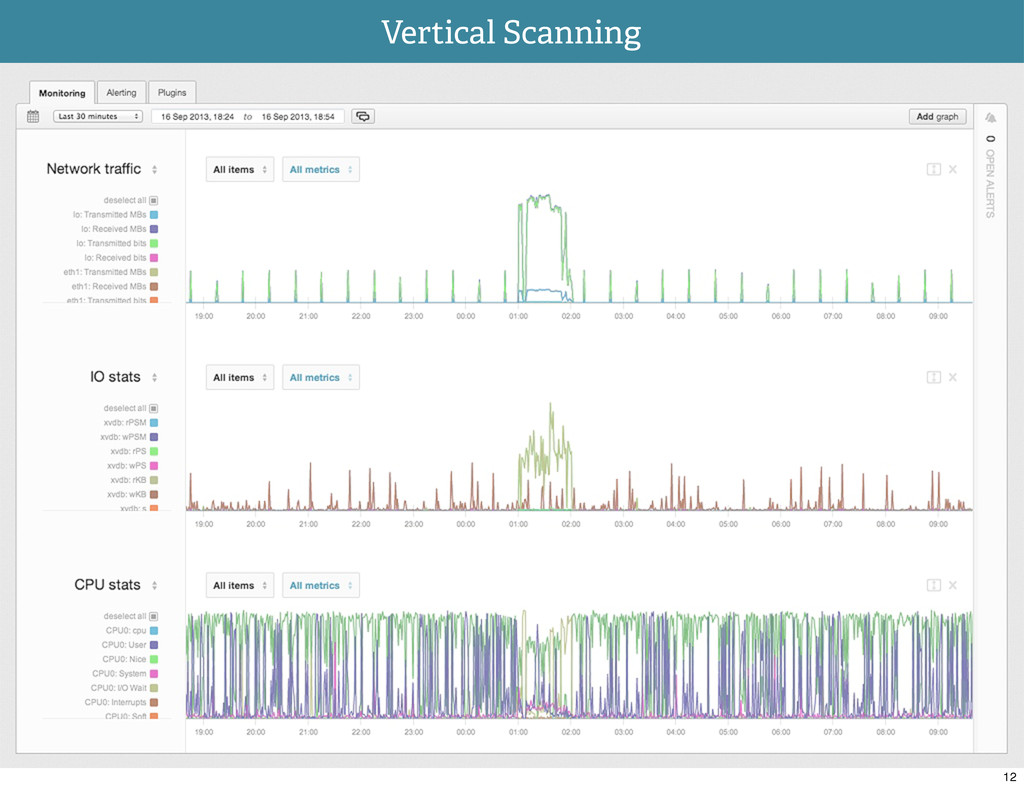
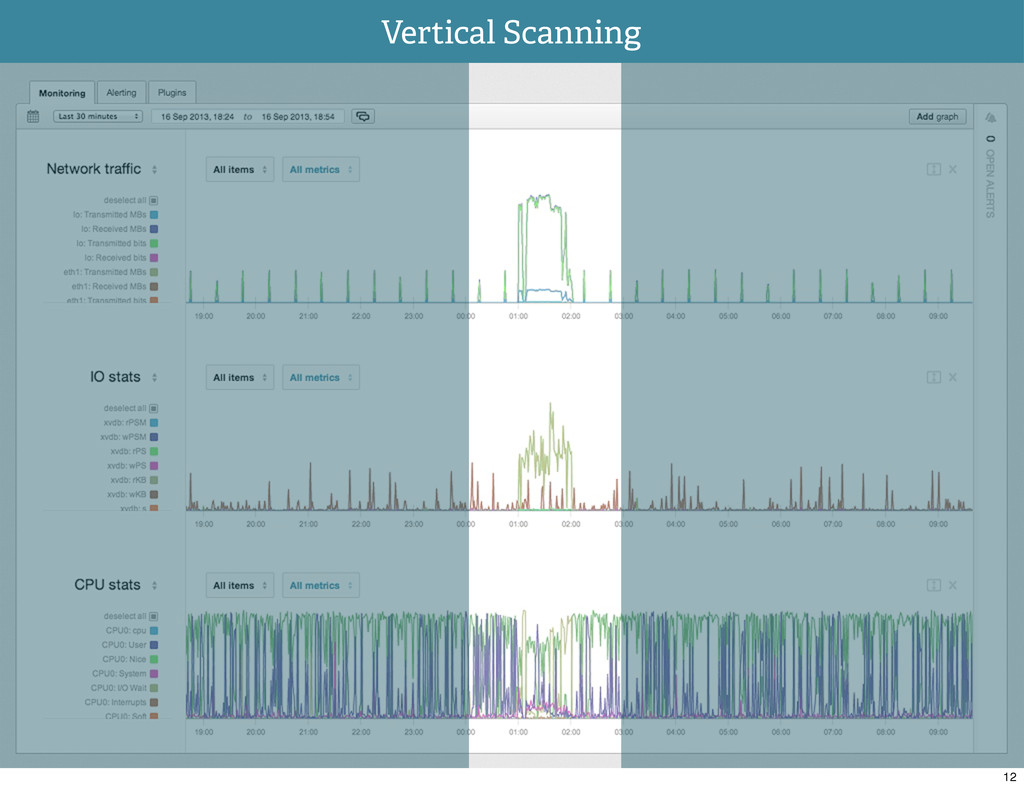
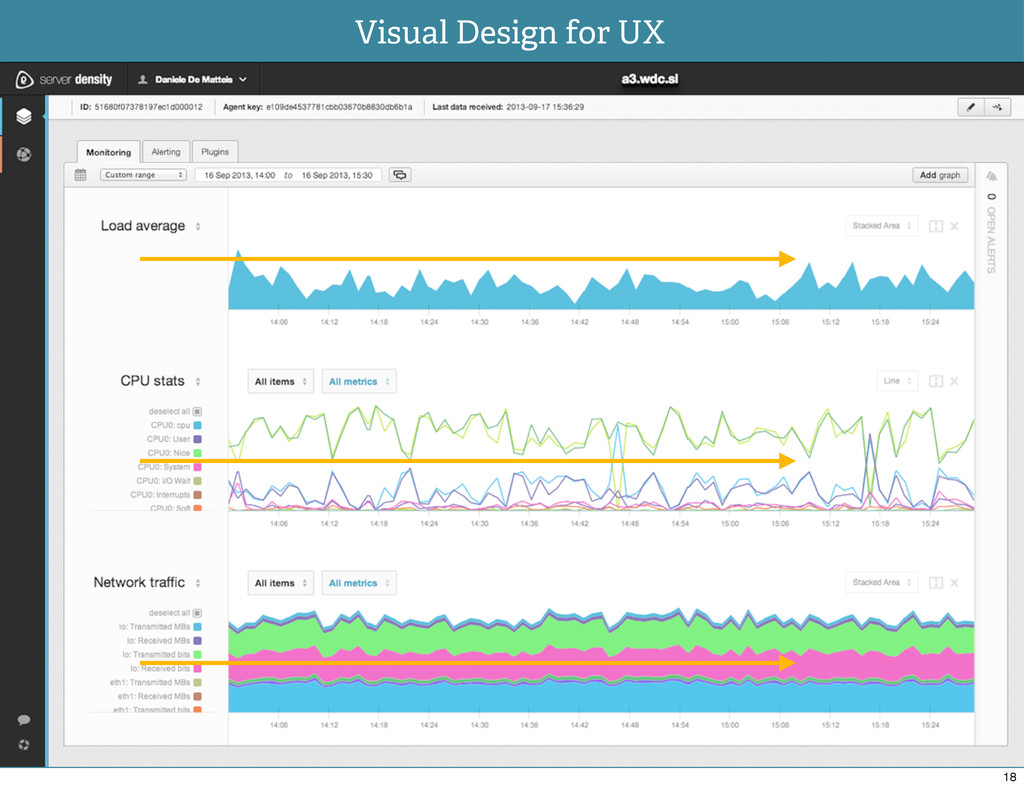
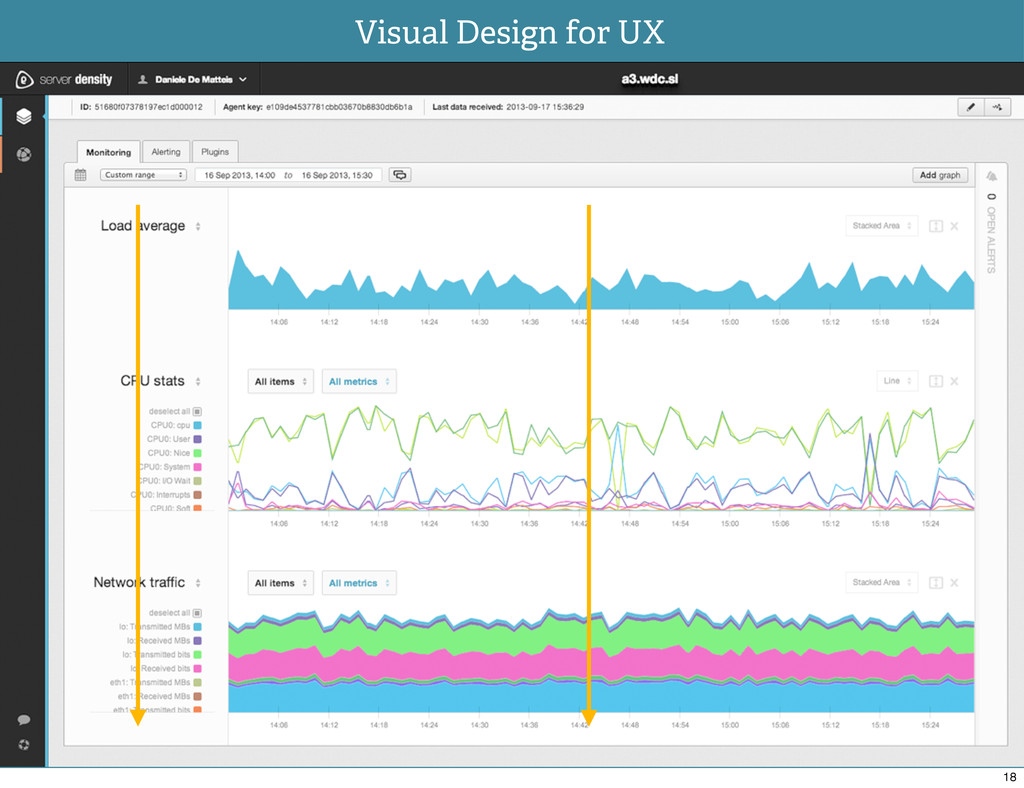
Vertical Scanning 12
Vertical Scanning 12
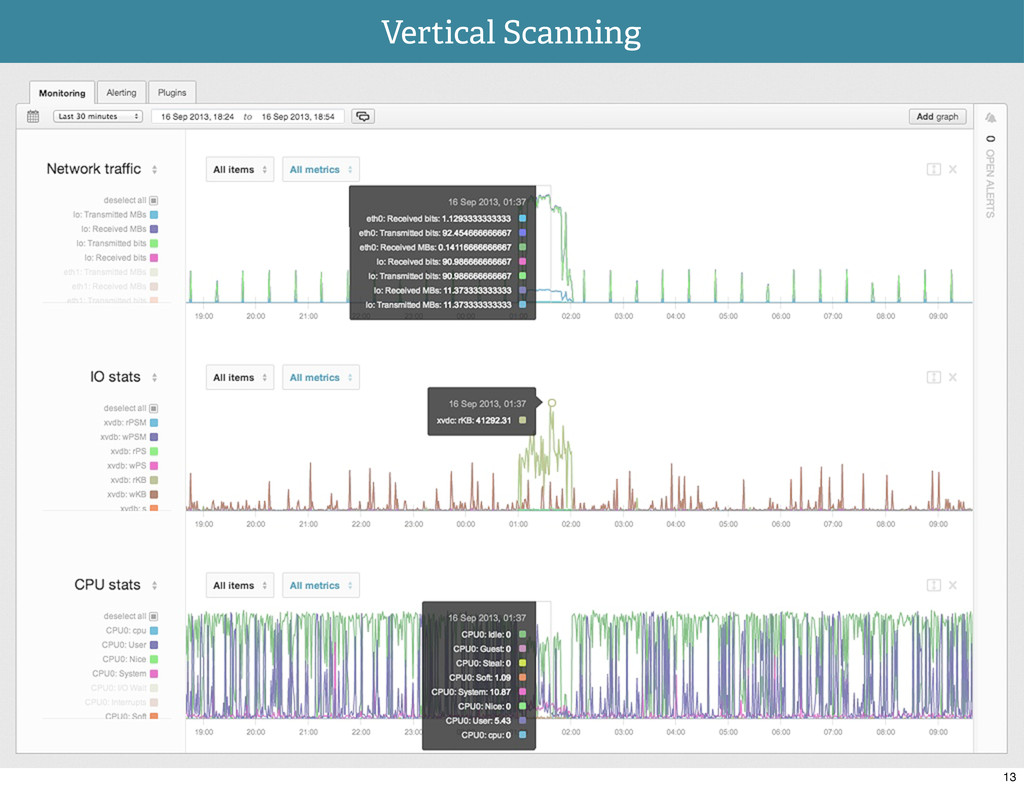
Vertical Scanning 13
Appeal 14
! Chart is boring, imma go back to sleep... Appeal
14
! Chart is boring, imma go back to sleep... Wait,
let’s make it worth it! Appeal 14
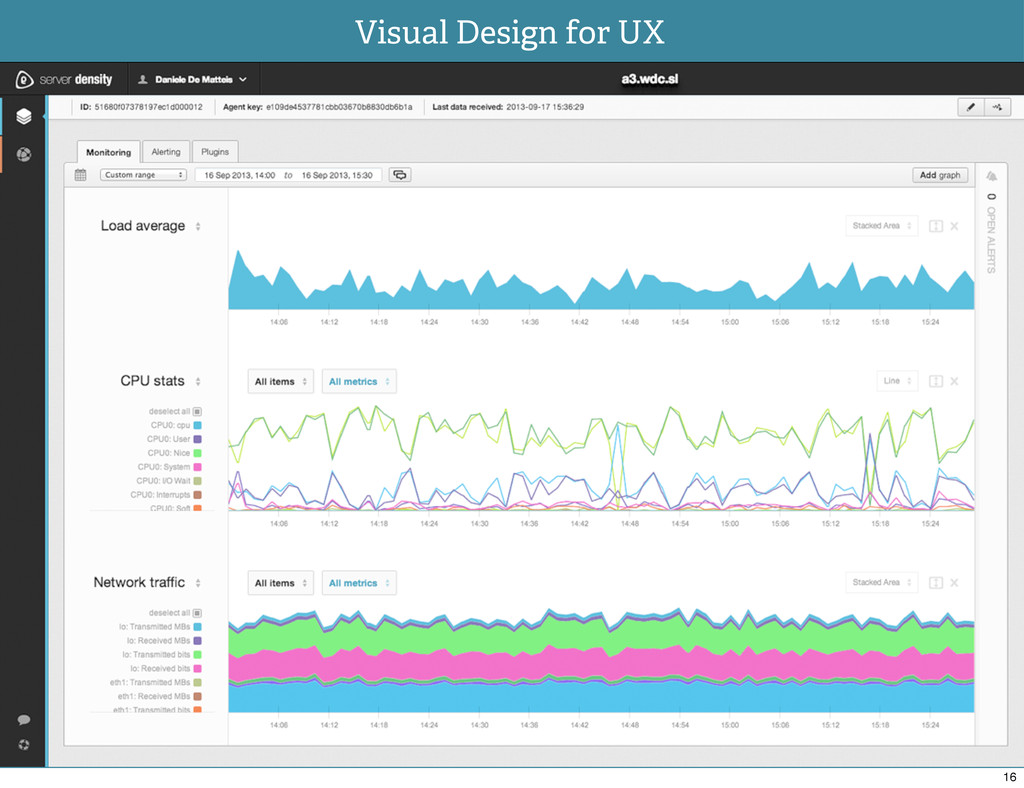
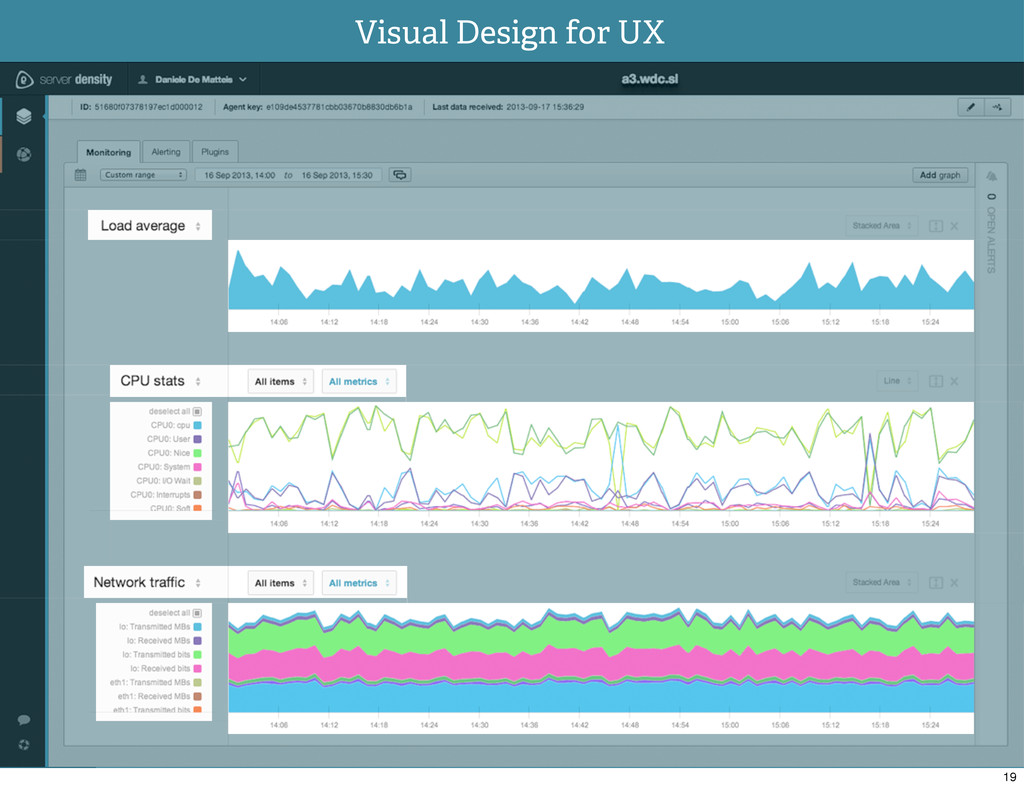
Visual Design for UX 16
Visual Design for UX 16
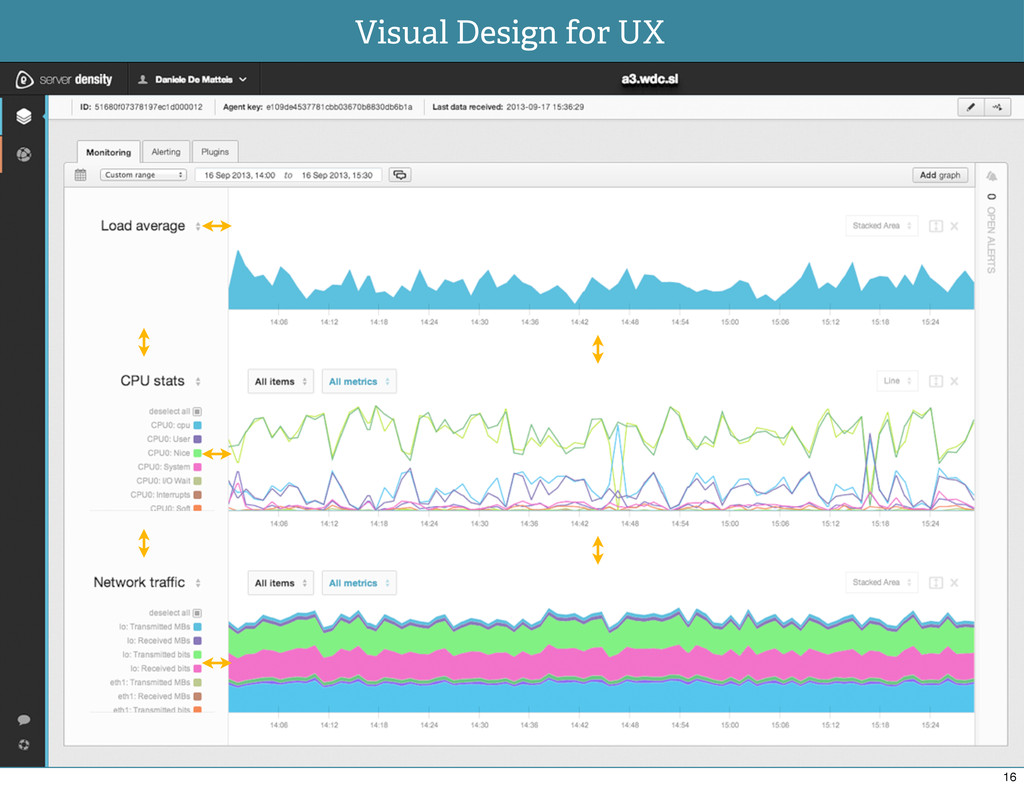
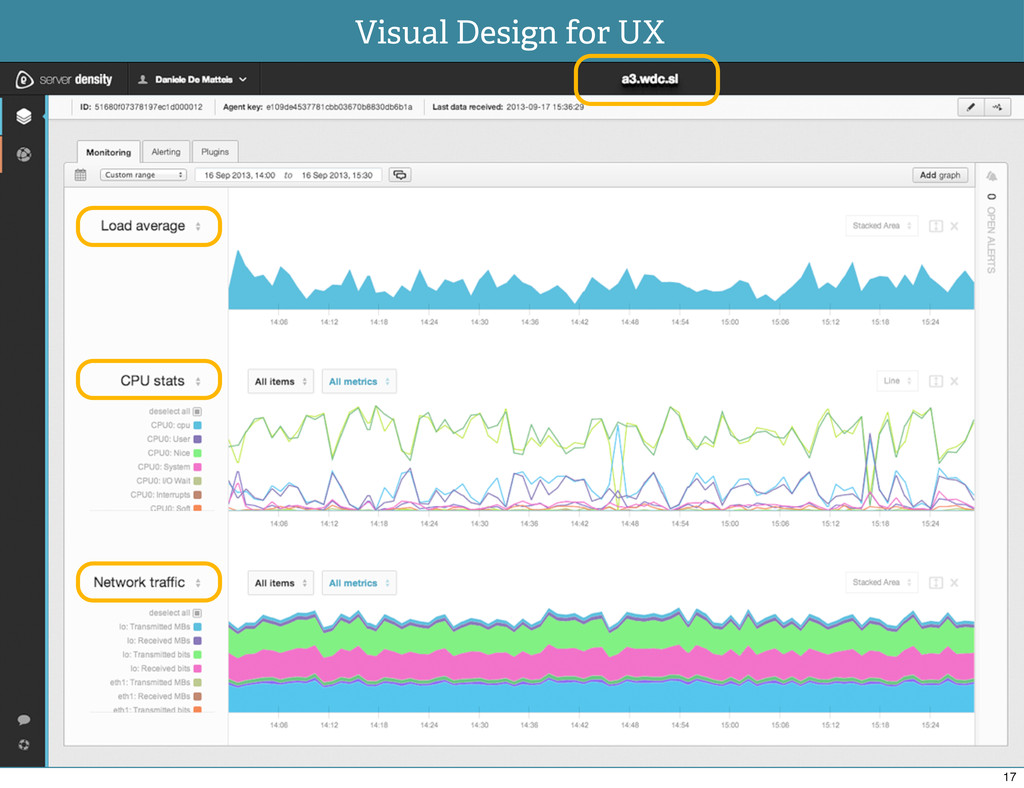
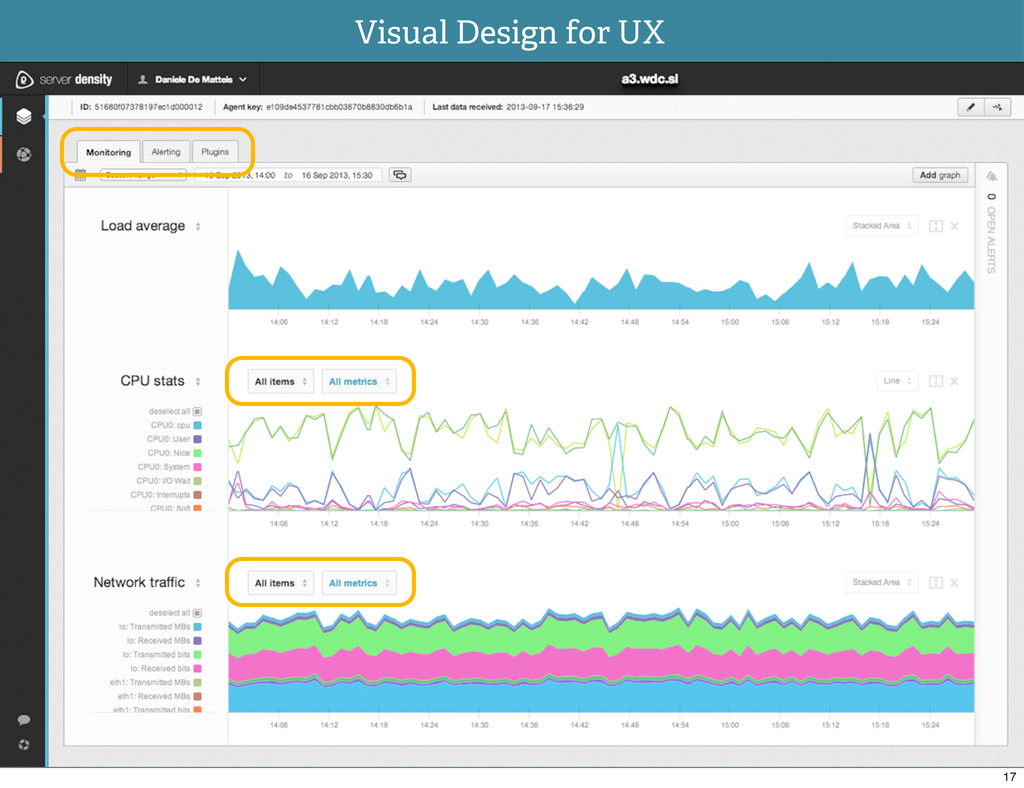
Visual Design for UX 17
Visual Design for UX 17
Visual Design for UX 17
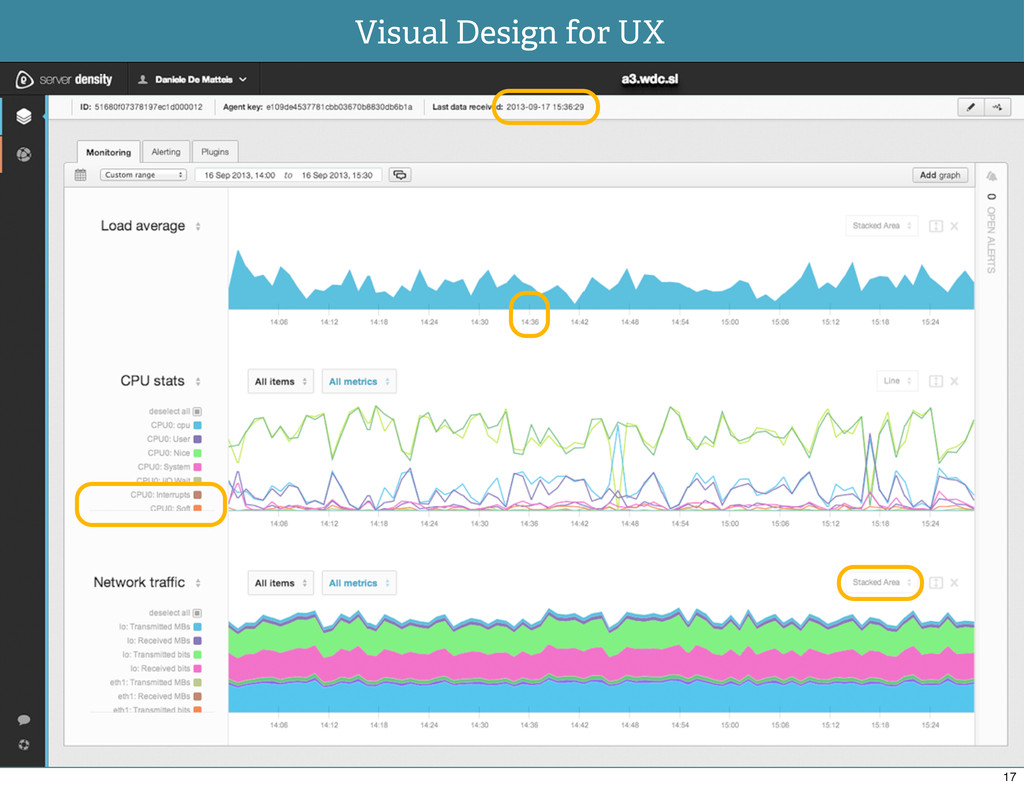
Visual Design for UX 18
Visual Design for UX 18
Visual Design for UX 19
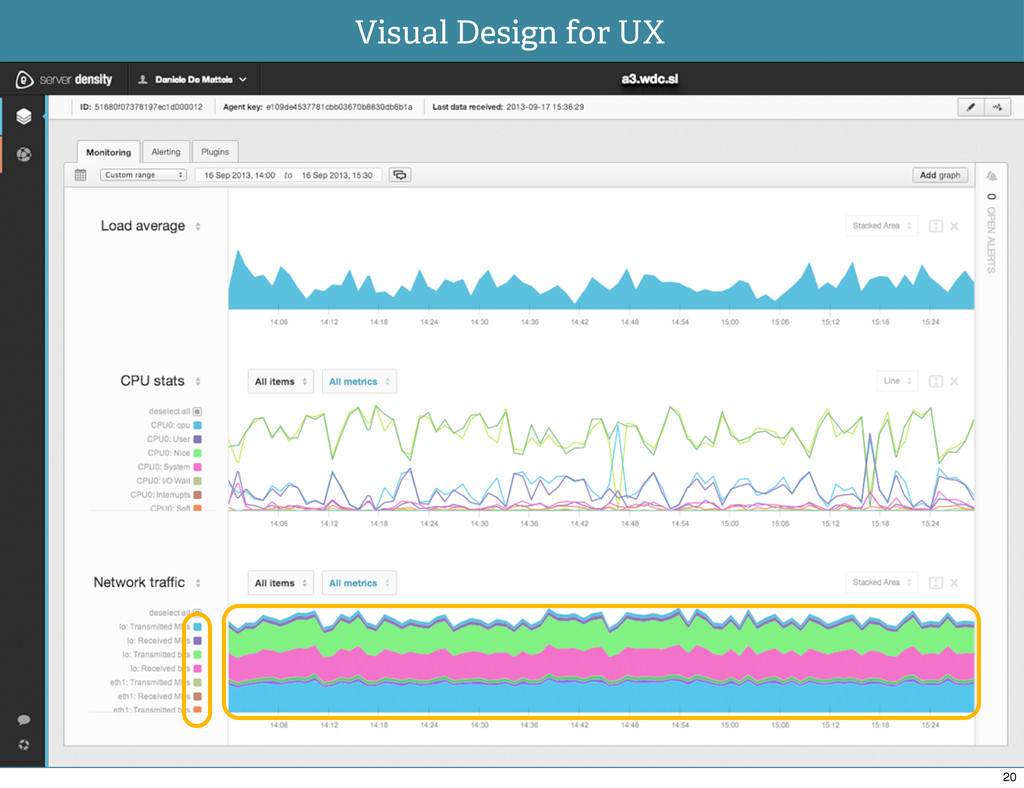
Visual Design for UX 20
Visual Design for UX 20
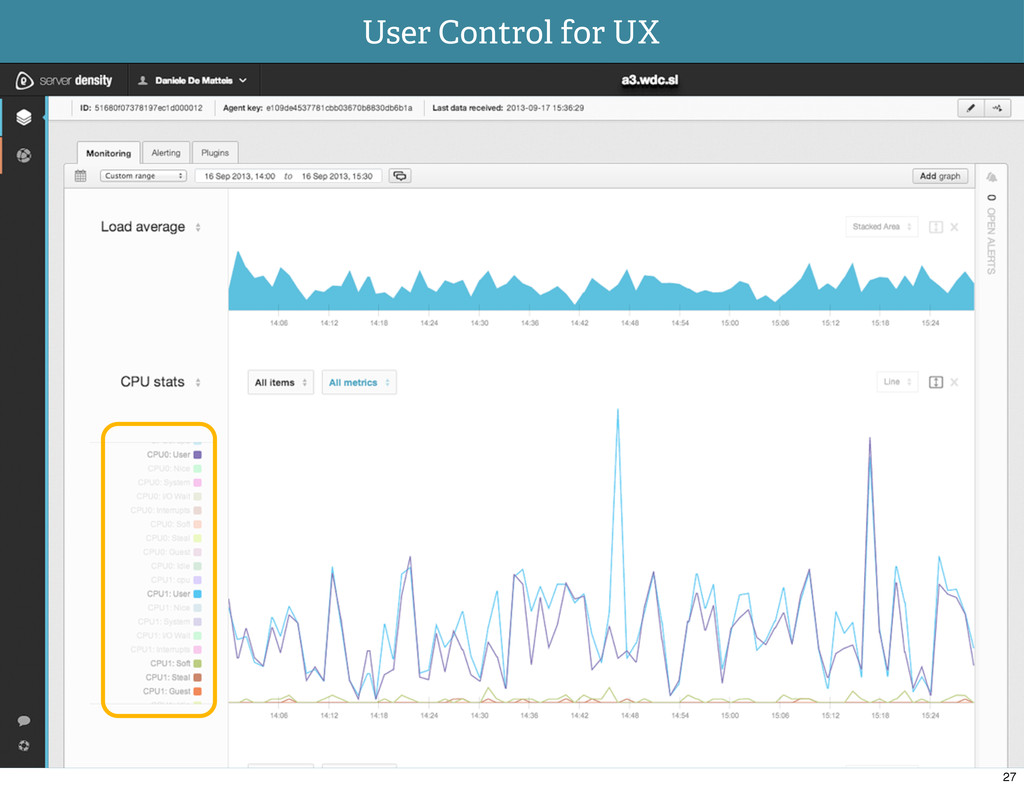
Control 21
! Where’s the rest of this? Control 21
! Where’s the rest of this? 1 click away, but
now you look for it ;) Control 21
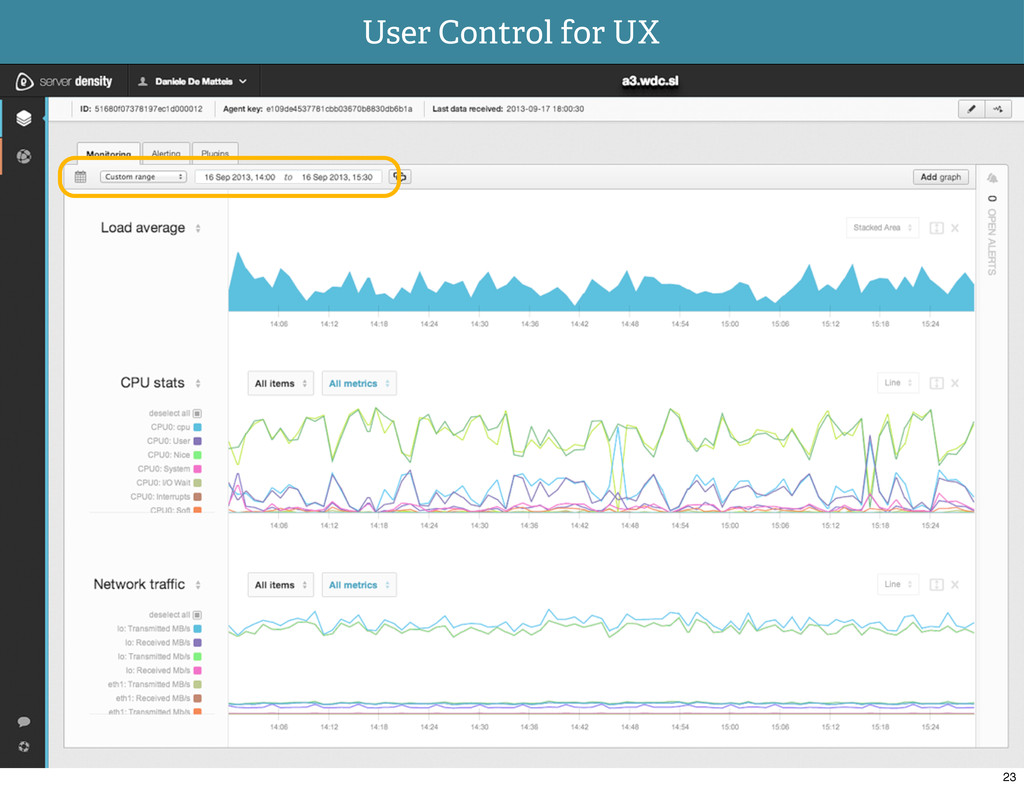
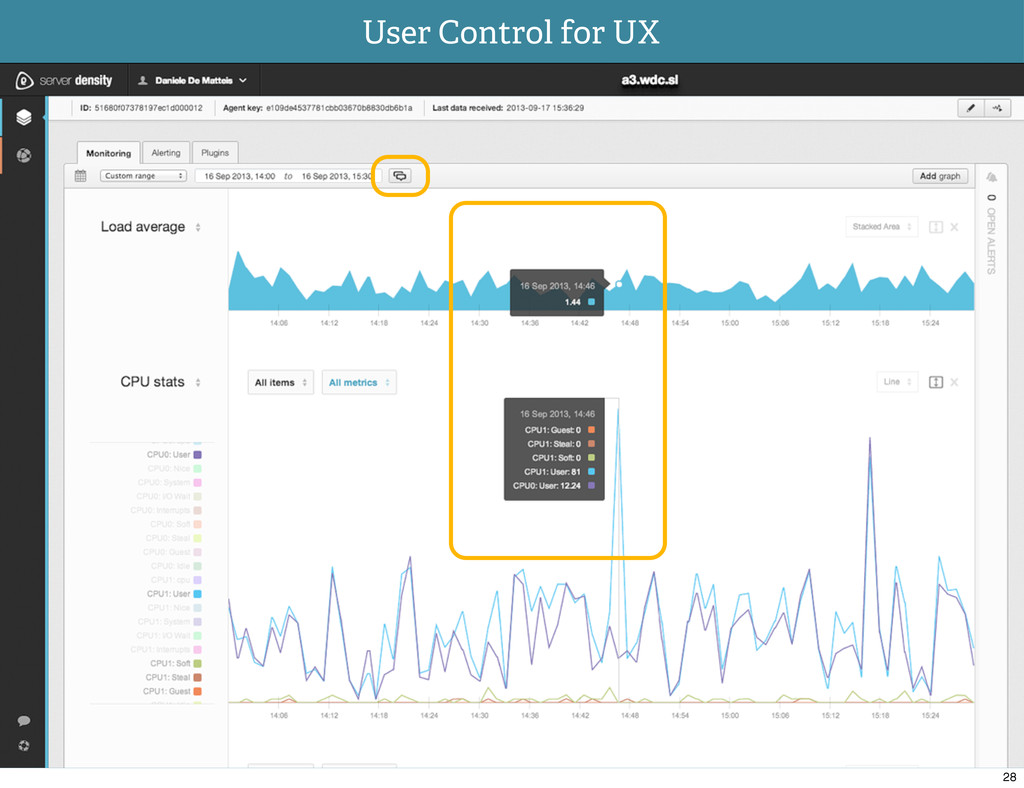
User Control for UX 23
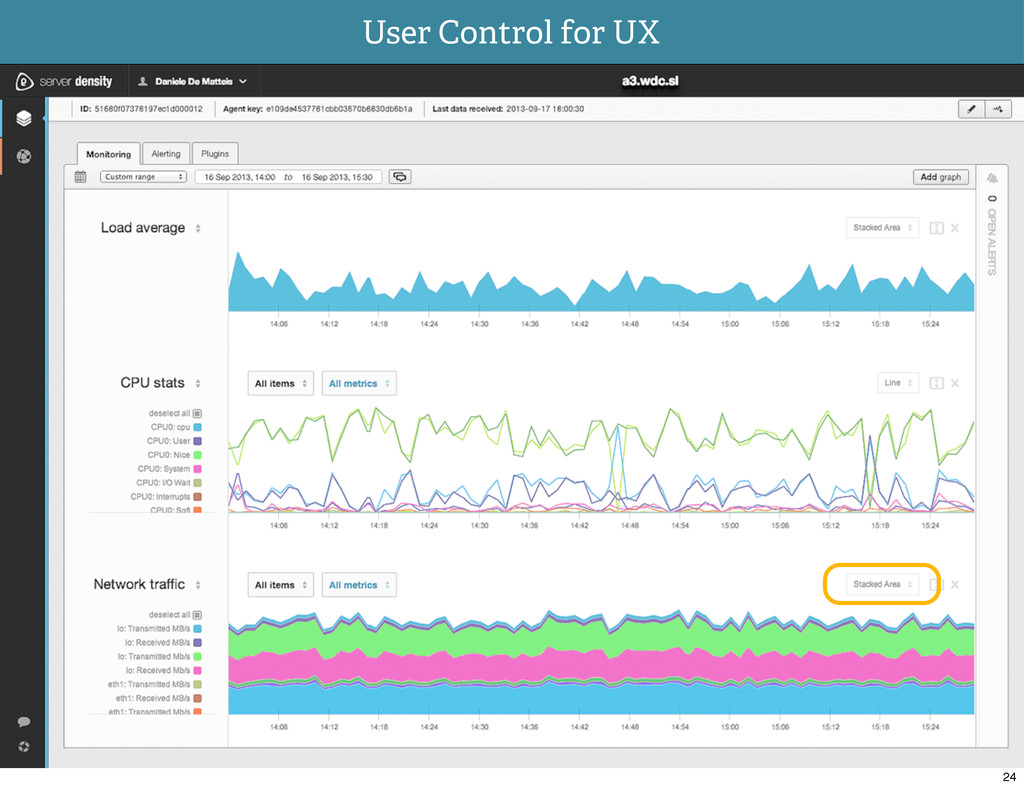
User Control for UX 24
User Control for UX 25
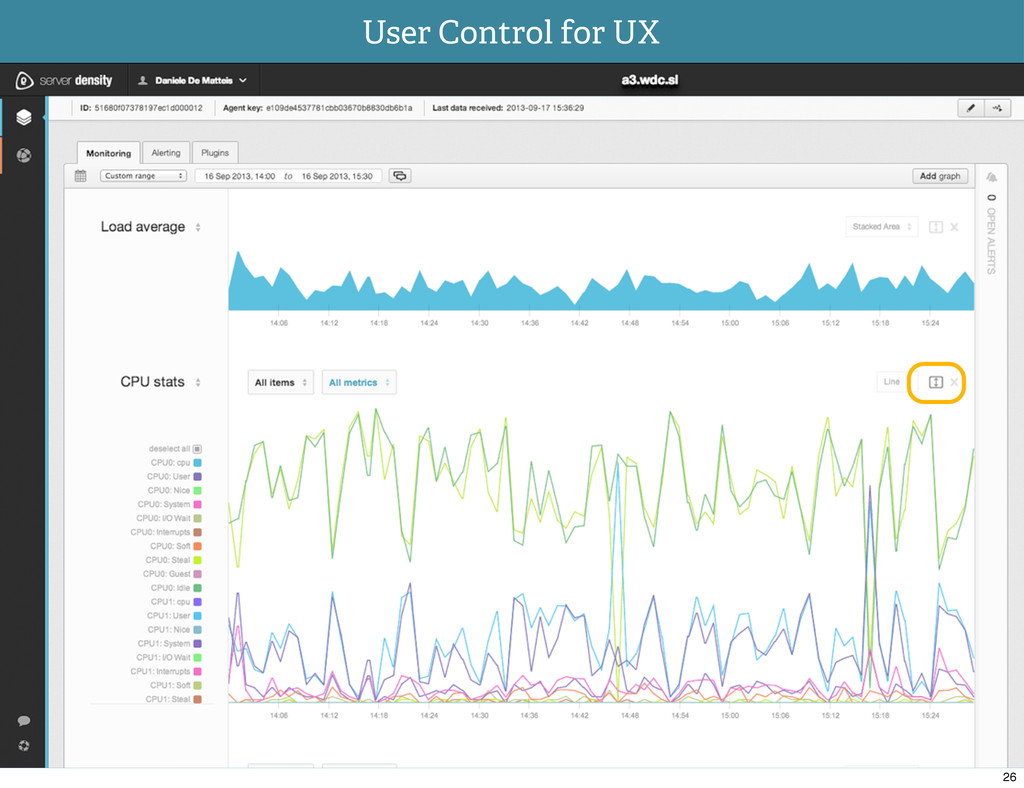
User Control for UX 26
User Control for UX 27
User Control for UX 28
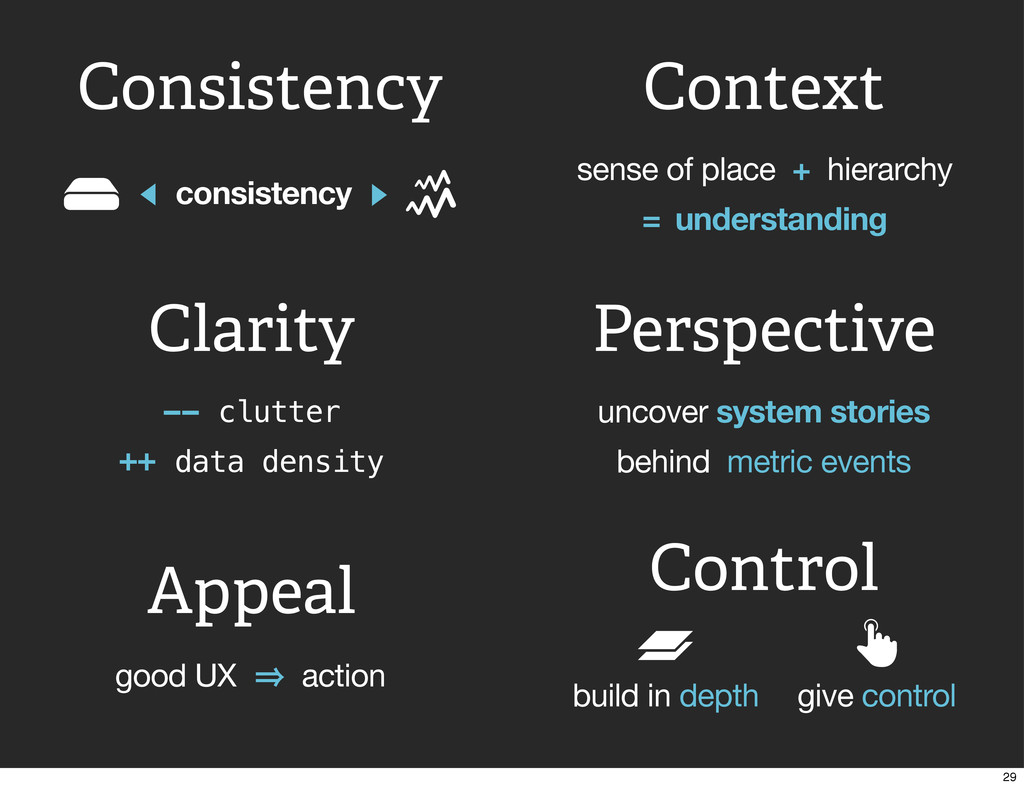
good UX 㱺 action uncover system stories behind metric events
sense of place + hierarchy = understanding -- clutter ++ data density consistency build in depth give control Consistency Context Clarity Perspective Appeal Control 29
More than graphs! 30
Network diagrams, Status boards, Heatmaps... More than graphs! 30
Network diagrams, Status boards, Heatmaps... Dashboards 30
Identify information immediately At a glance 31
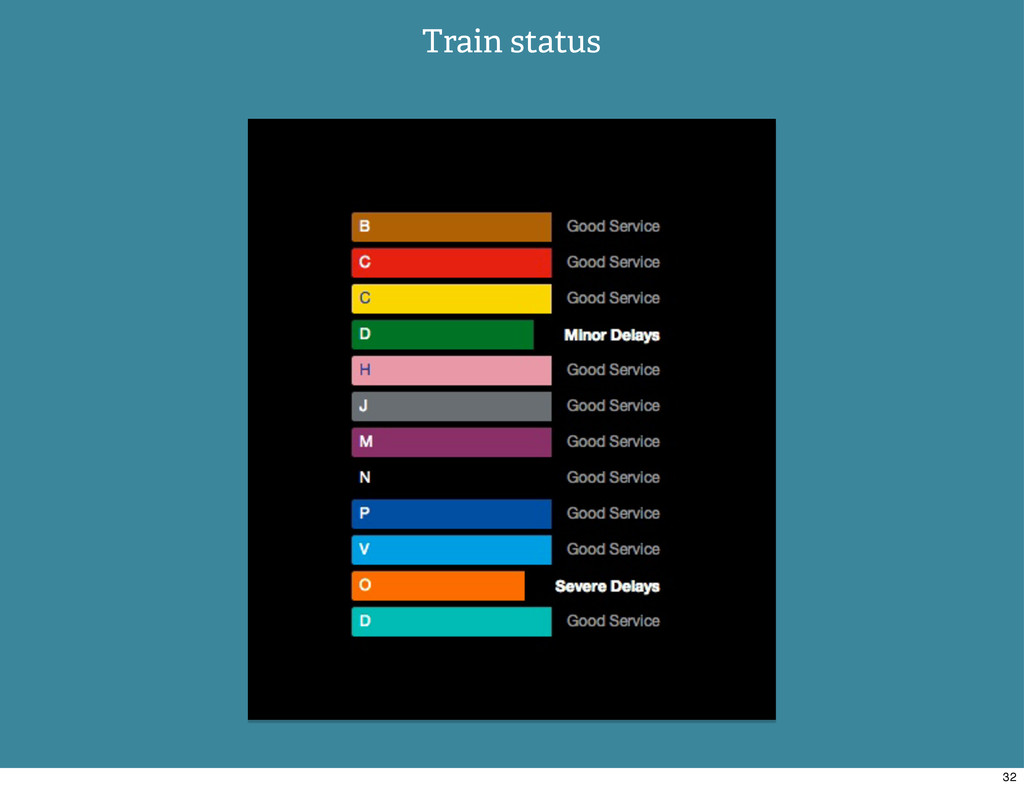
Train status 32
@morekid @harrywincup @serverdensity Thanks. Daniele De Matteis Harry Wincup serverdensity.com
33