Upgrade to Pro — share decks privately, control downloads, hide ads and more …

Observability

 Observability

Tech Talk given on Observability and it's pillars to multiple groups.

Avatar for pigol

pigol

May 14, 2020
Tweet

More Decks by pigol

Other Decks in Programming

Transcript

  1. When is a developers job done? 1. After dev-complete? 2.

    After Staging push? 3. After QA sign-off? 4. After Prod Release?
  2. When is a developers job done? 1. After dev-complete? 2.

    After Staging push? 3. After QA sign-off? 4. After Prod Release? Answer: None of the above!
  3. Release to Production is just the beginning! “40% to 90%

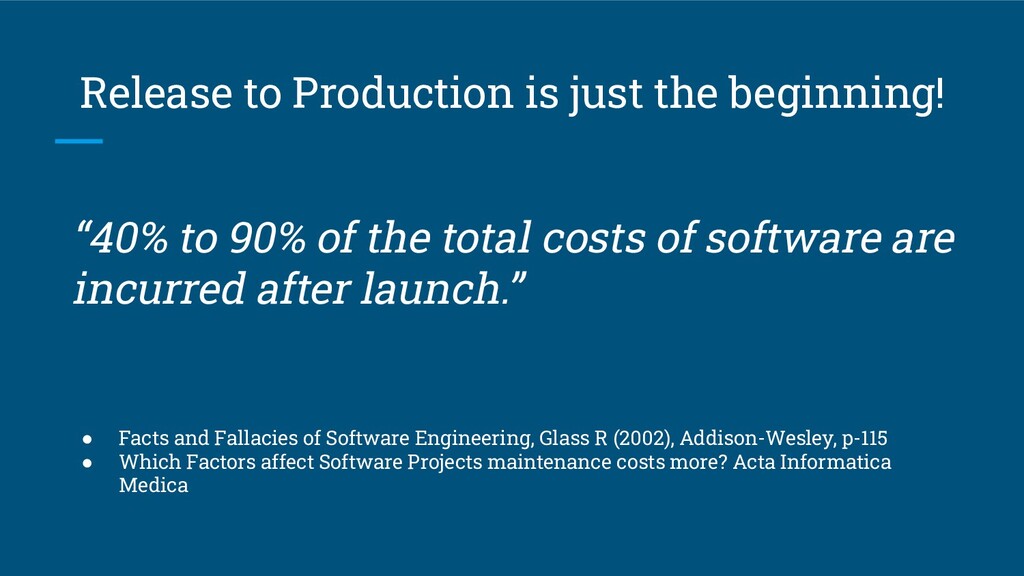
    of the total costs of software are incurred after launch.” • Facts and Fallacies of Software Engineering, Glass R (2002), Addison-Wesley, p-115 • Which Factors affect Software Projects maintenance costs more? Acta Informatica Medica
  4. What to monitor? Let’s take an example: Platform API’s •

    API Latency (95th percentile, Avg, 99th percentile) • CPU, Load Avg • Memory • Swap • JMX Heap Size • HTTP Error Codes (200, 400, 300) • Exceptions • External API call Latencies • … • And more…….
  5. What to monitor? Let’s take an example: Platform API’s •

    API Latency (95th percentile, Avg, 99th percentile) • CPU, Load Avg • Memory • Swap • JMX Heap Size • HTTP Error Codes (200, 400, 300) • Exceptions • External API call Latencies • And more……. X Servers X Clusters
  6. What to monitor? Let’s take an example: Platform API’s •

    API Latency (95th percentile, Avg, 99th percentile) • CPU, Load Avg • Memory • Swap • JMX Heap Size • HTTP Error Codes (200, 400, 300) • Exceptions • External API call Latencies • And more……. X Servers X Clusters
  7. Monitoring • Capturing the state of the system to determine

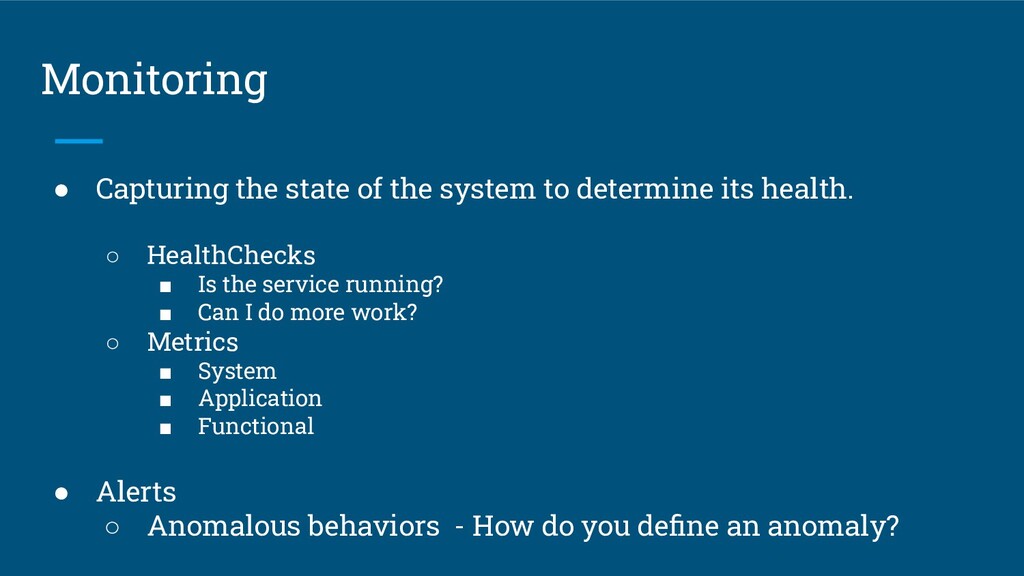
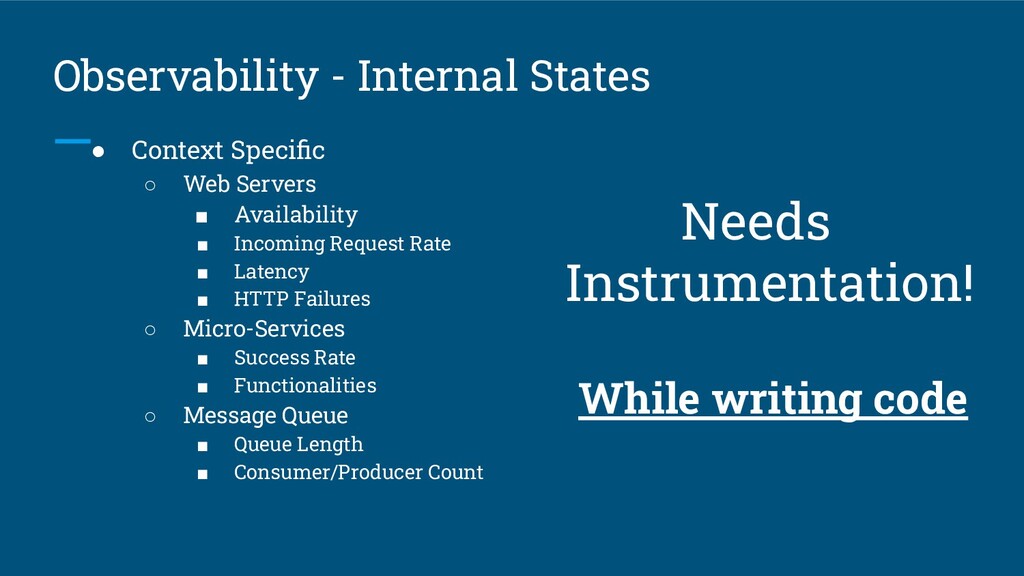
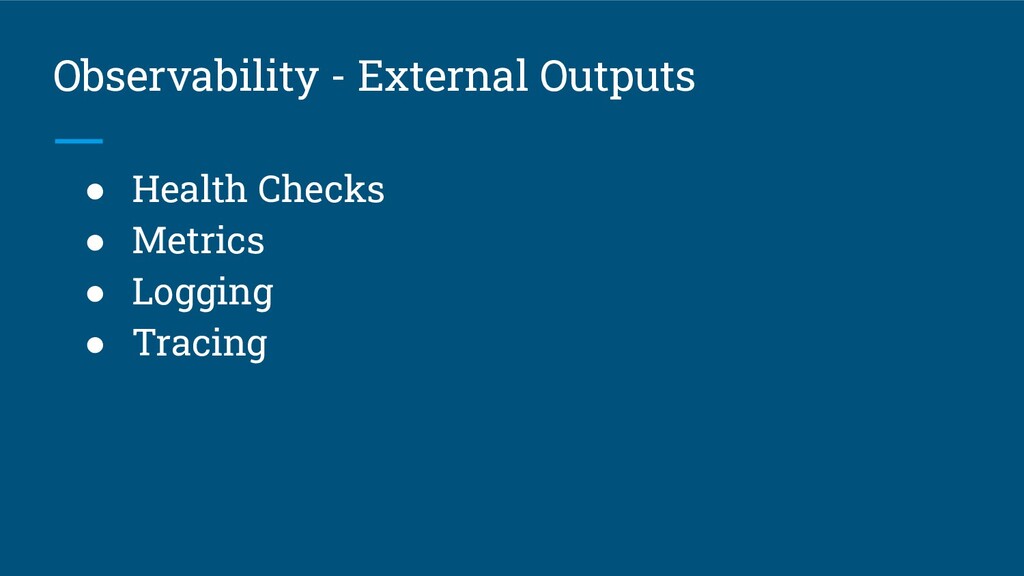
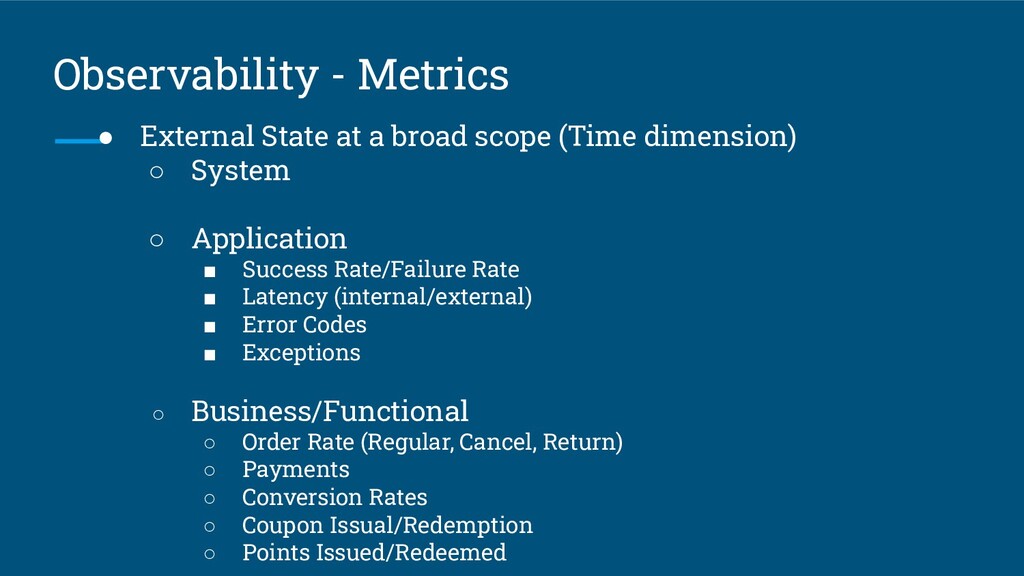
    its health. ◦ HealthChecks ▪ Is the service running? ▪ Can I do more work? ◦ Metrics ▪ System ▪ Application ▪ Functional • Alerts ◦ Anomalous behaviors - How do you define an anomaly?
  8. Monitoring • Alerts - Known Failures ◦ Knowledge Based ◦

    Reactive (post-outages) What about the unknown failures?
  9. Observability • https://theagileadmin.com/2018/02/16/monitoring-and-observability/ Observability is a measure of how well

    the internal states of a system can be inferred from knowledge of its external outputs.
  10. Observability - Internal States • Context Specific ◦ Web Servers

    ▪ Availability ▪ Incoming Request Rate ▪ Latency ▪ HTTP Failures ◦ Micro-Services ▪ Success Rate ▪ Functionalities ◦ Message Queue ▪ Queue Length ▪ Consumer/Producer Count Needs Instrumentation! While writing code
  11. Observability - Health Checks • HealthChecks ◦ Is the service

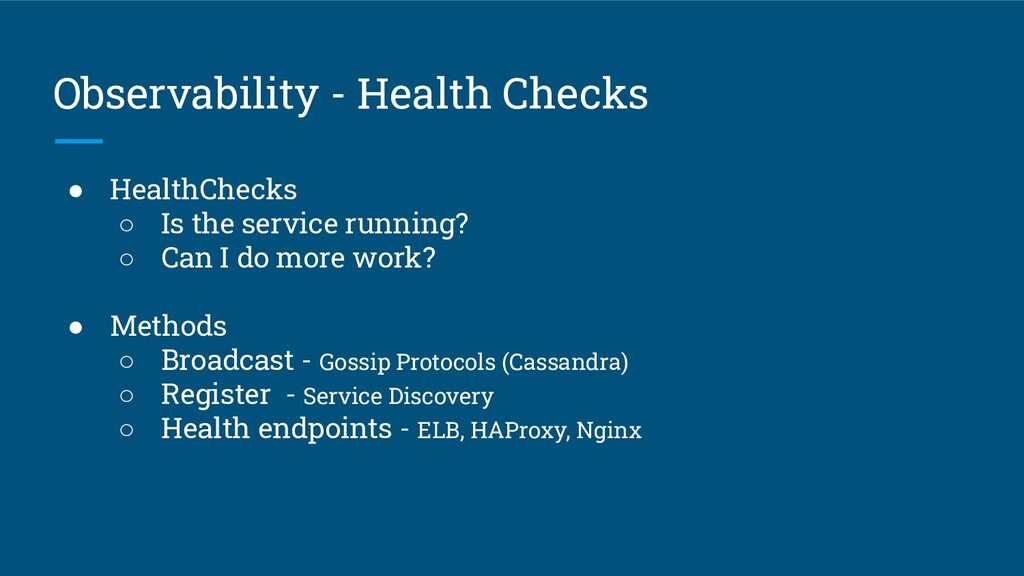
    running? ◦ Can I do more work? • Methods ◦ Broadcast - Gossip Protocols (Cassandra) ◦ Register - Service Discovery ◦ Health endpoints - ELB, HAProxy, Nginx
  12. Observability - Metrics • External State at a broad scope

    (Time dimension) ◦ System ◦ Application ▪ Success Rate/Failure Rate ▪ Latency (internal/external) ▪ Error Codes ▪ Exceptions ◦ Business/Functional ◦ Order Rate (Regular, Cancel, Return) ◦ Payments ◦ Conversion Rates ◦ Coupon Issual/Redemption ◦ Points Issued/Redeemed
  13. Observability - Metrics • Meaningful Metrics** - Generous • Alerts

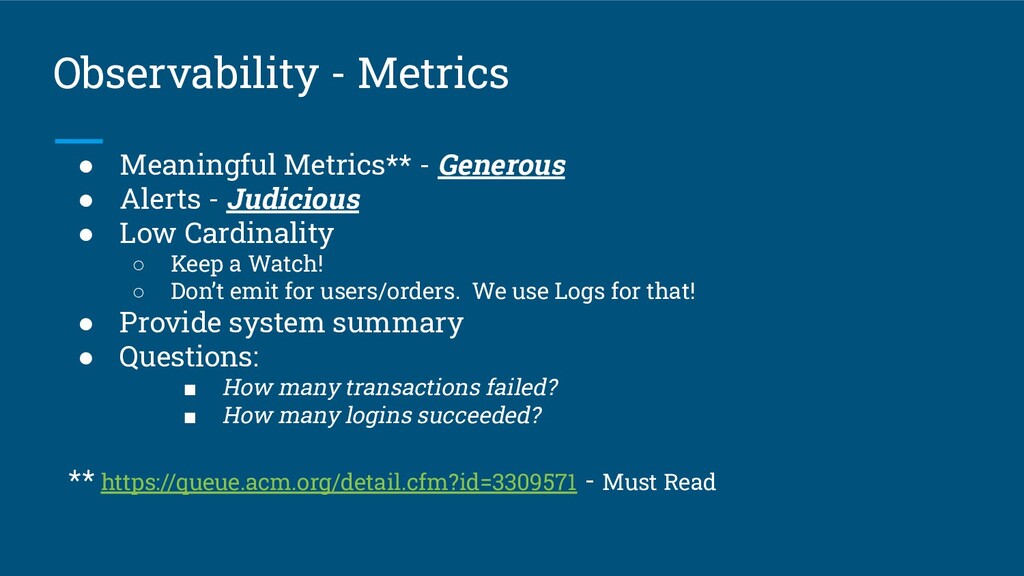
    - Judicious • Low Cardinality ◦ Keep a Watch! ◦ Don’t emit for users/orders. We use Logs for that! • Provide system summary • Questions: ▪ How many transactions failed? ▪ How many logins succeeded? ** https://queue.acm.org/detail.cfm?id=3309571 - Must Read
  14. Observability - Metrics • Tools ◦ Graphite ◦ InfluxDB ◦

    Prometheus ◦ OpenTSDB ◦ Scuba (Facebook) ◦ Apache Druid
  15. Observability - Logging • Understanding at a smaller scope ◦

    Request, customer, transaction • Ask Questions: ◦ Why couldn’t the customer place an order? ◦ Why did the transaction fail? • Centralised - ElasticSearch, Splunk • Searchable - Indexed • Correlatable - Common Key (Request Id)
  16. Observability - Tracing • Dissect a request into sub-paths. (Spans)

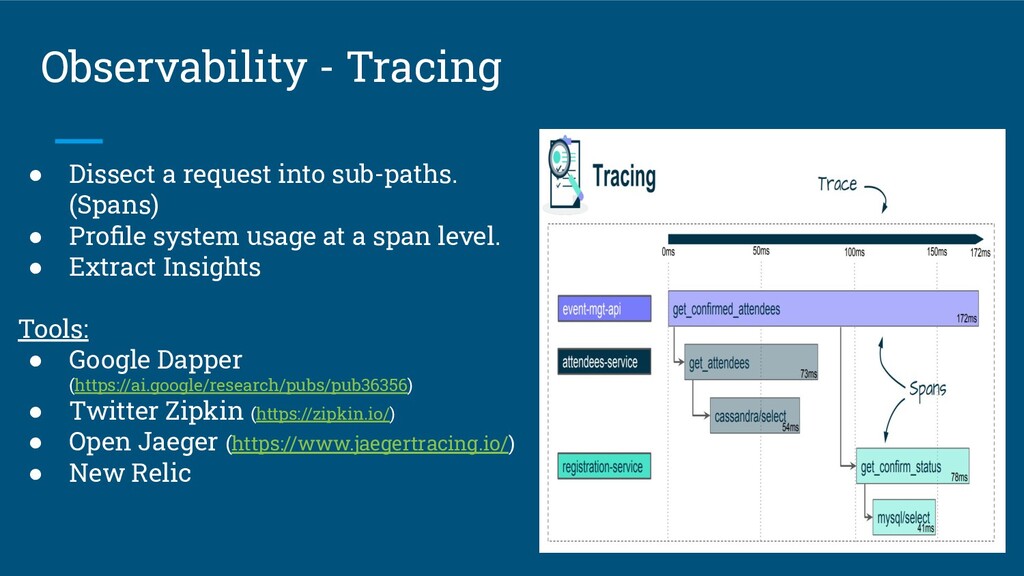
    • Profile system usage at a span level. • Extract Insights Tools: • Google Dapper (https://ai.google/research/pubs/pub36356) • Twitter Zipkin (https://zipkin.io/) • Open Jaeger (https://www.jaegertracing.io/) • New Relic
  17. Service Level Objectives (SLO) * https://landing.google.com/sre/sre-book/chapters/service-level-objectives/ * https://www.youtube.com/watch?v=tEylFyxbDLE • Defines

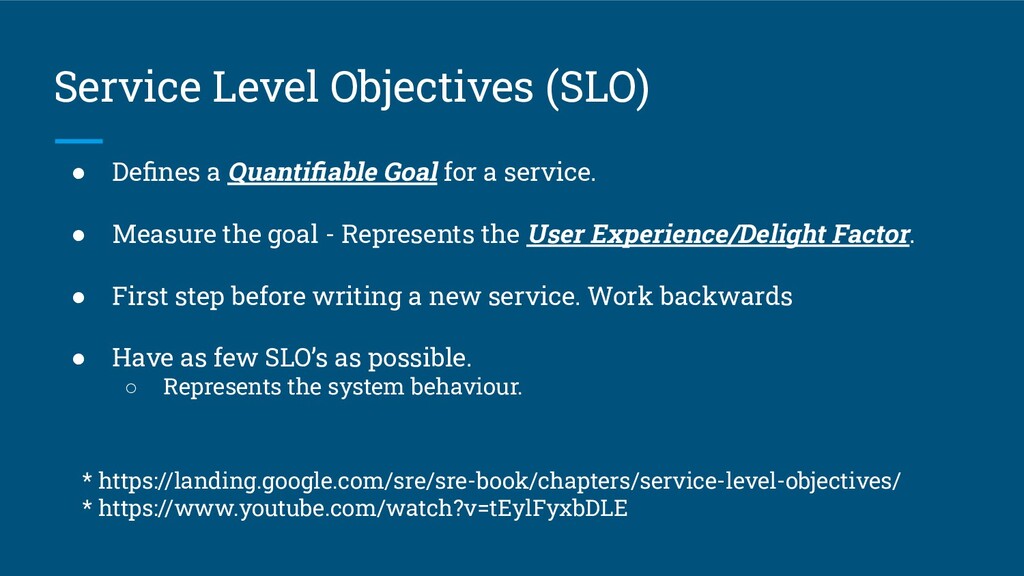
    a Quantifiable Goal for a service. • Measure the goal - Represents the User Experience/Delight Factor. • First step before writing a new service. Work backwards • Have as few SLO’s as possible. ◦ Represents the system behaviour.
  18. Service Level Objectives (SLO) - Exercise • Cart Service •

    Payments Service • Card Generation • Order Management Service • Communication Engine
  19. References • Debugging Production Systems : https://www.youtube.com/watch?v=YlrAakN90D0 • Pierre Vincent

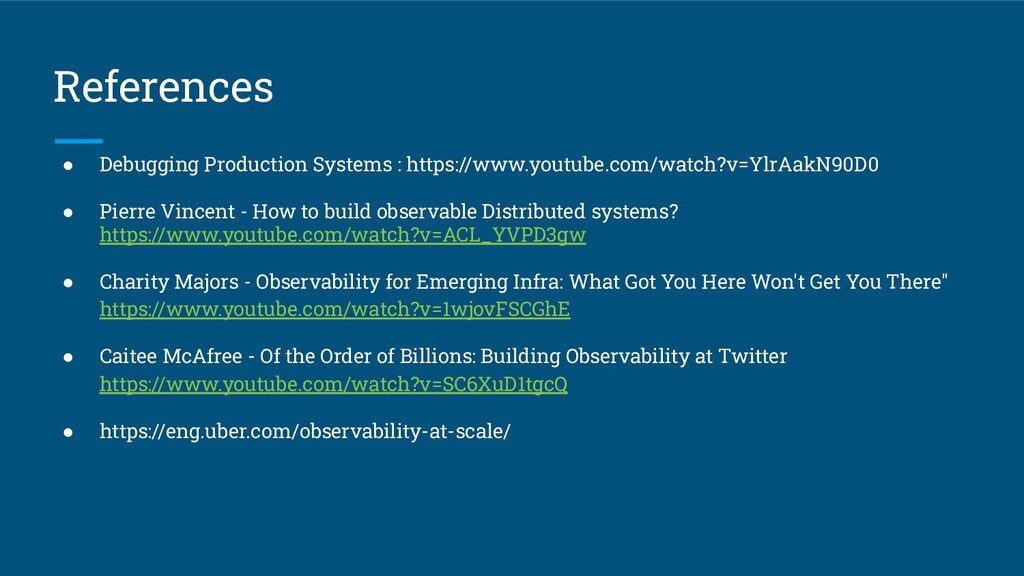
    - How to build observable Distributed systems? https://www.youtube.com/watch?v=ACL_YVPD3gw • Charity Majors - Observability for Emerging Infra: What Got You Here Won't Get You There" https://www.youtube.com/watch?v=1wjovFSCGhE • Caitee McAfree - Of the Order of Billions: Building Observability at Twitter https://www.youtube.com/watch?v=SC6XuD1tgcQ • https://eng.uber.com/observability-at-scale/