Upgrade to Pro — share decks privately, control downloads, hide ads and more …

Cooper—State of the Industry Report

Sponsored · Your Podcast. Everywhere. Effortlessly. Share. Educate. Inspire. Entertain. You do you. We'll handle the rest.

Cooper—State of the Industry Report

Presenter: Geoff Cooper, President & CEO, Renewable Fuels Association
Timing: Wednesday, Feb. 25, 2026 (8:15 am – 8:40 am)
Session: State of the Industry Report

More Decks by 2026 National Ethanol Conference

Transcript

  1. “He’s a warrior. He has come such a long way

    since we got him from Cal. But I still think that he has barely scratched the surface of his potential.”
  2. 0.0 2.0 4.0 6.0 8.0 10.0 12.0 14.0 16.0 1981

    1982 1983 1984 1985 1986 1987 1988 1989 1990 1991 1992 1993 1994 1995 1996 1997 1998 1999 2000 2001 2002 2003 2004 2005 2006 2007 2008 2009 2010 2011 2012 2013 2014 2015 2016 2017 2018 2019 2020 2021 2022 2023 2024 2025 Billion Gallons ANNUAL U.S. FUEL ETHANOL PRODUCTION 16.4 35.2 Million Metric Tons Animal Feed 4.7 Billion Pounds Distillers Corn Oil 3.3 Million Tons Captured CO2
  3. 0.0 0.5 1.0 1.5 2.0 2.5 2006 2007 2008 2009

    2010 2011 2012 2013 2014 2015 2016 2017 2018 2019 2020 2021 2022 2023 2024 2025 Billion Gallons U.S. ETHANOL EXPORTS 2.18  13% of U.S. Output  $4.8 Billion Value  82 Countries
  4. ETHANOL’S ECONOMIC IMPACTS 79,228 Direct Jobs 237,292 Indirect & Induced

    Jobs $50.4 Billion Gross Domestic Product $28.3 Billion Household Income
  5. Scan the QR Code to find contact info for your

    Representative Call the House Switchboard to connect to your Representative (202) 224-3121 OR
  6. “I am trusting Speaker Mike Johnson and Leader John Thune

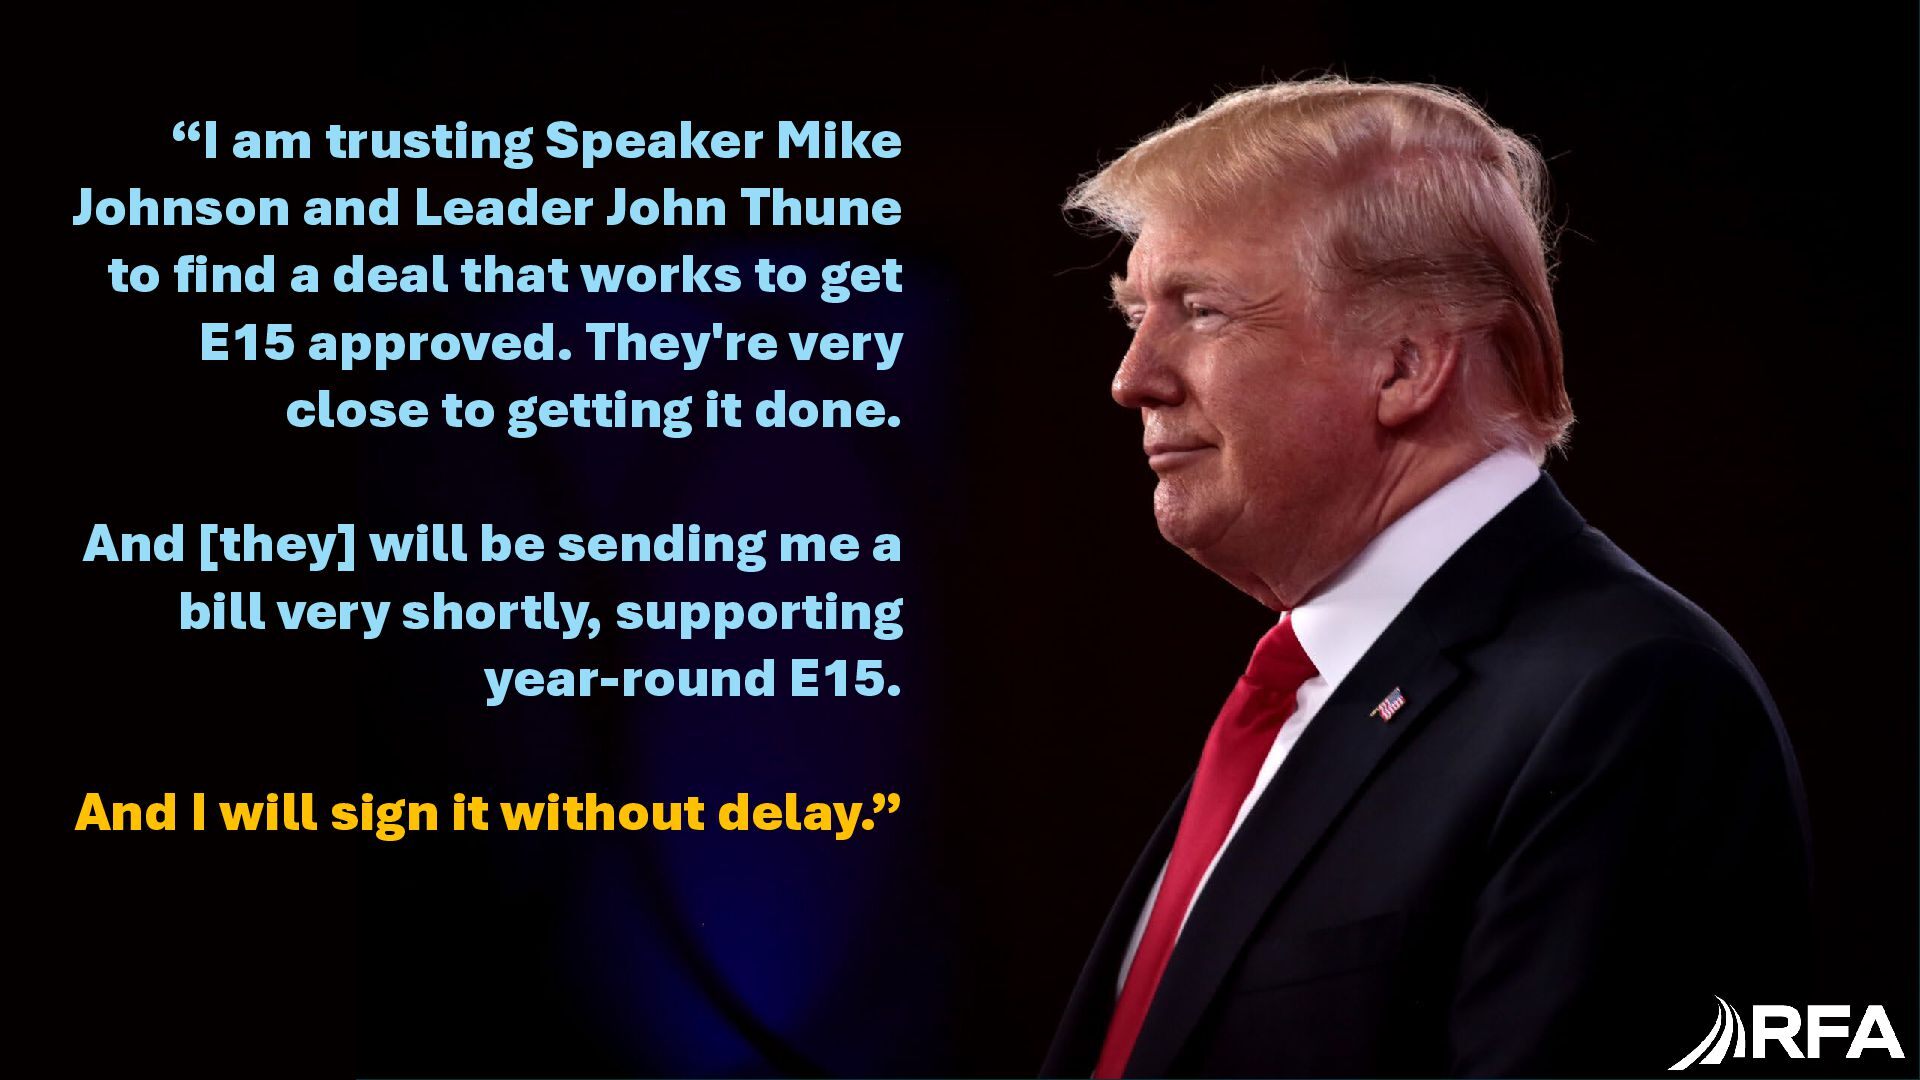
    to find a deal that works to get E15 approved. They're very close to getting it done. And [they] will be sending me a bill very shortly, supporting year-round E15. And I will sign it without delay.”
  7. “There’s massive potential for this to be a win-win for

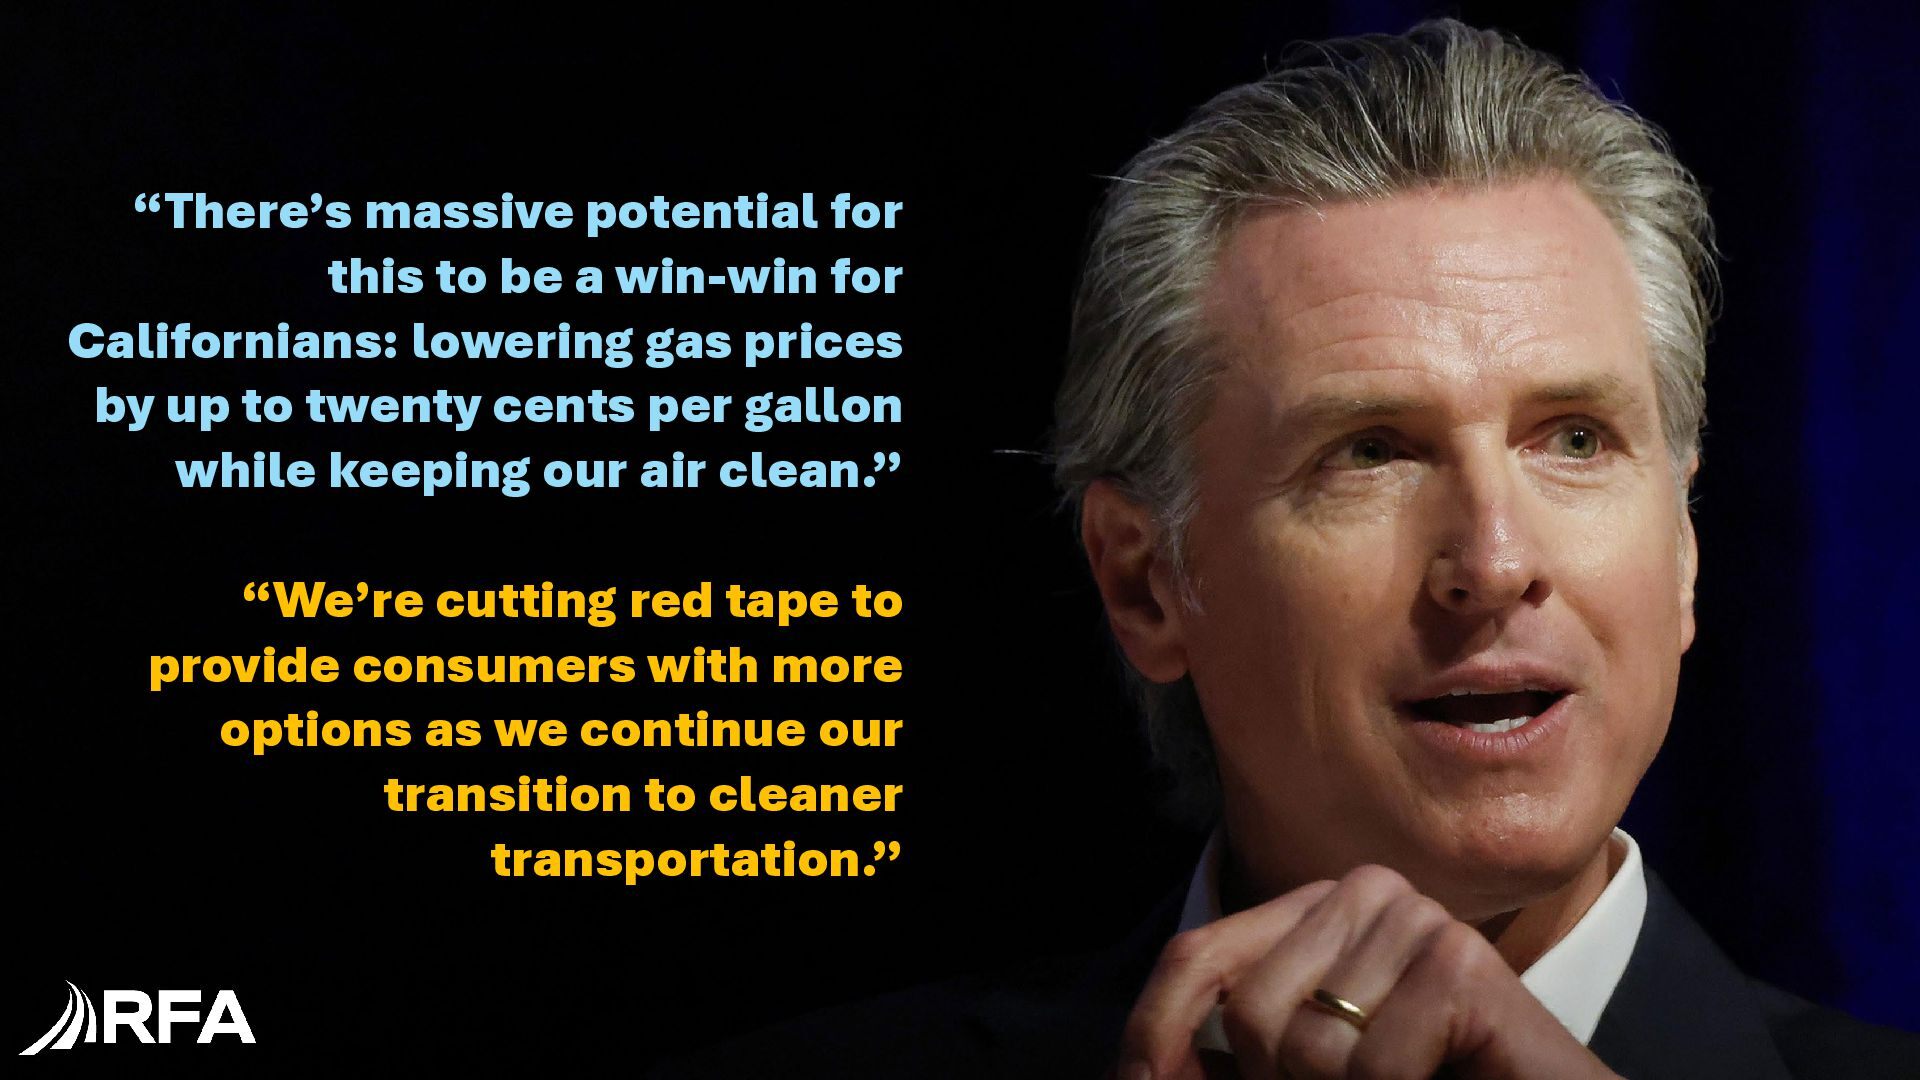
    Californians: lowering gas prices by up to twenty cents per gallon while keeping our air clean.” “We’re cutting red tape to provide consumers with more options as we continue our transition to cleaner transportation.”
  8. 13.79 15.25* 15.25* 15.00 15.00 15.00 15.00 4.49 5.00 5.10

    5.45 6.14 7.72 8.10 0.56 0.63 0.84 1.09 1.19 1.30 1.36 0 5 10 15 20 25 2021 2022 2023 2024 2025 2026P 2027P Billion RINs U.S. RENEWABLE FUEL STANDARD VOLUME OBLIGATIONS Conventional Renewable Fuel Biomass-Bsd Diesel & Oth. Adv. Biofuel Cellulosic Biofuel Proposed *Includes 500-MG remand (ACEI v. EPA)
  9. $- $0.10 $0.20 $0.30 $0.40 $0.50 $0.60 $0.70 $0.80 $0.90

    $1.00 47.5+ 42.5 - 47.4 37.5 - 42.4 32.5 - 37.4 27.5 - 32.4 22.5 - 27.4 17.5 - 22.4 12.5 - 17.4 7.5 - 12.4 2.5 - 7.4 <0 - 2.4 $/Gallon Emissions Rate (kgCO2e/mmBTU) 45Z TAX CREDIT VALUE PER GALLON with Prevailing Wage & Apprenticeship
  10. Canada (36%) United Kingdom (8%) European Union (18%) Philippines (5%)

    S. Korea (4%) Rest of World (5%) India (9%) Mexico (3%) Peru (3%) Colombia (6%) Brazil (2%)
  11. Heavy Fuel Oil, 39.7 Light Fuel Oil, 13.0 Diesel/Gas Oil,

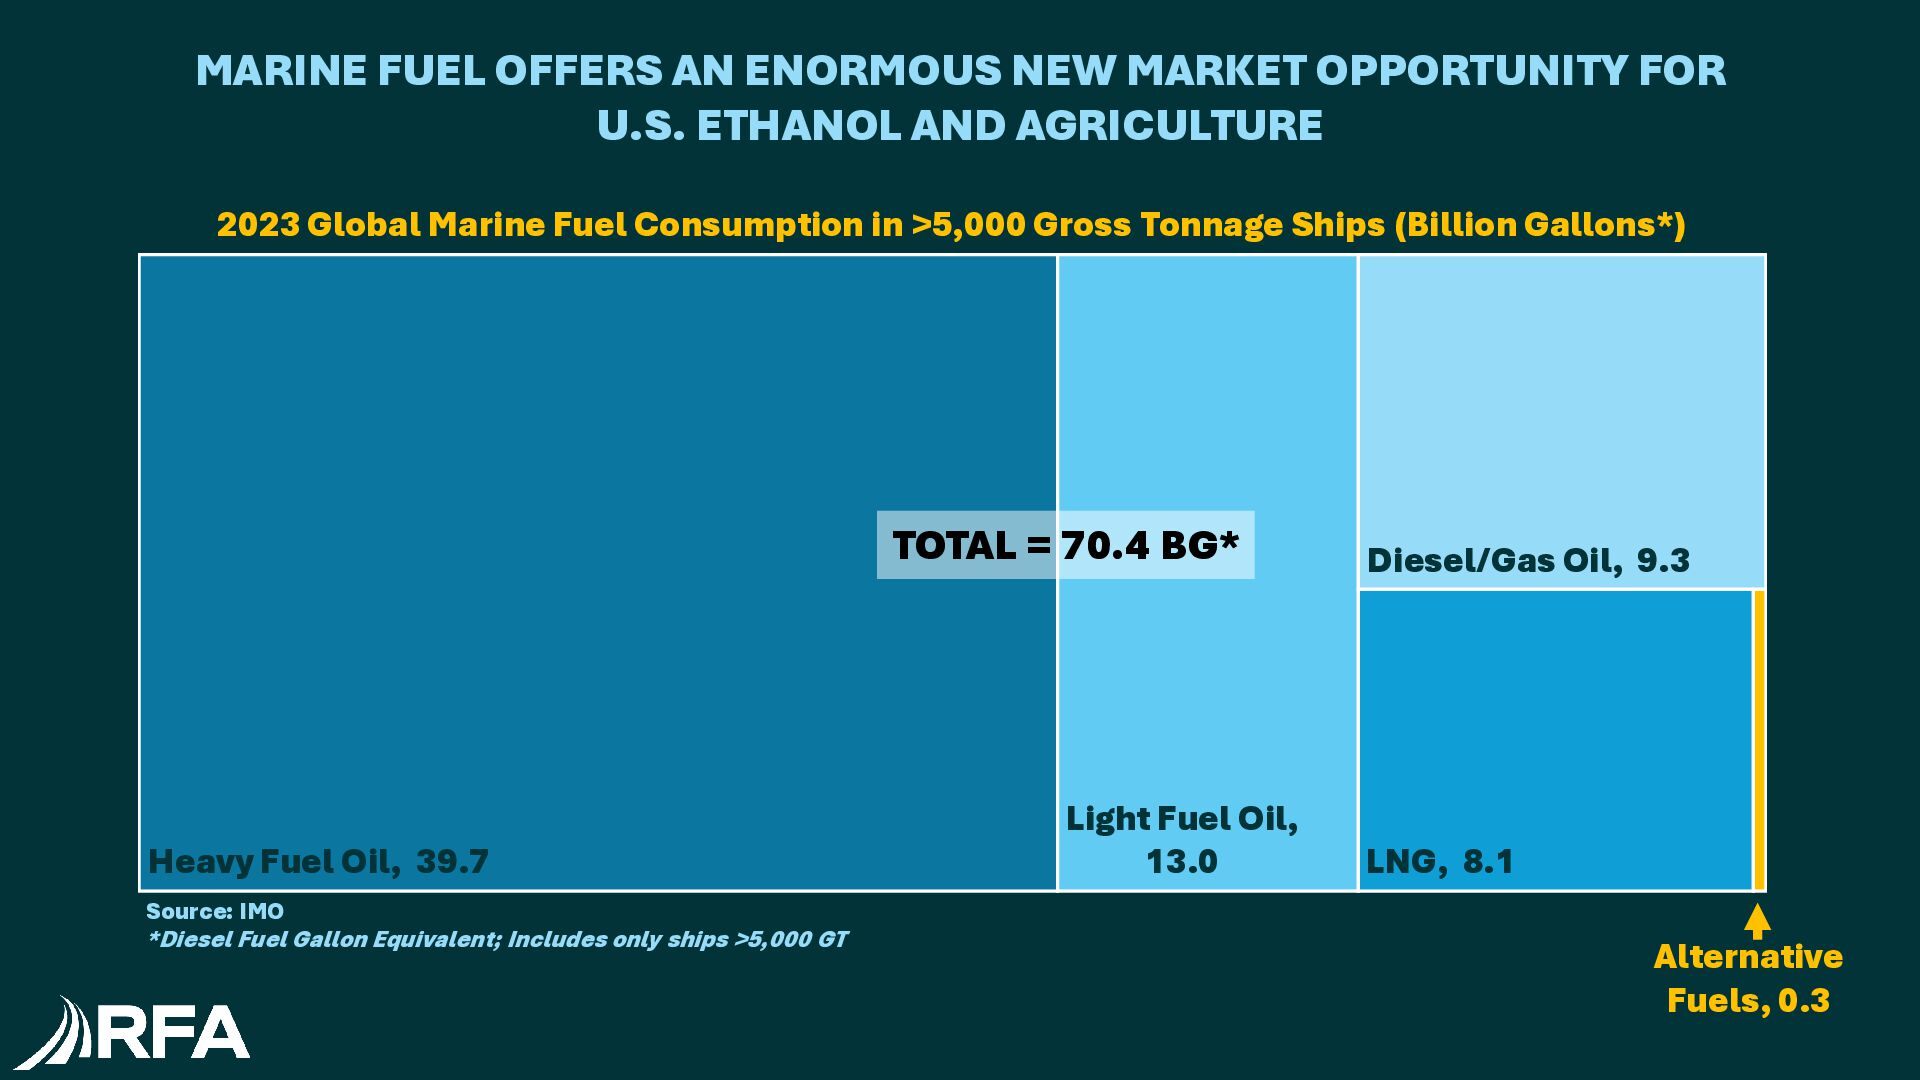
    9.3 LNG, 8.1 2023 Global Marine Fuel Consumption in >5,000 Gross Tonnage Ships (Billion Gallons*) Alternative Fuels, 0.3 Source: IMO *Diesel Fuel Gallon Equivalent; Includes only ships >5,000 GT TOTAL = 70.4 BG* MARINE FUEL OFFERS AN ENORMOUS NEW MARKET OPPORTUNITY FOR U.S. ETHANOL AND AGRICULTURE
  12. “The truth is, you don’t need the most stars, hype

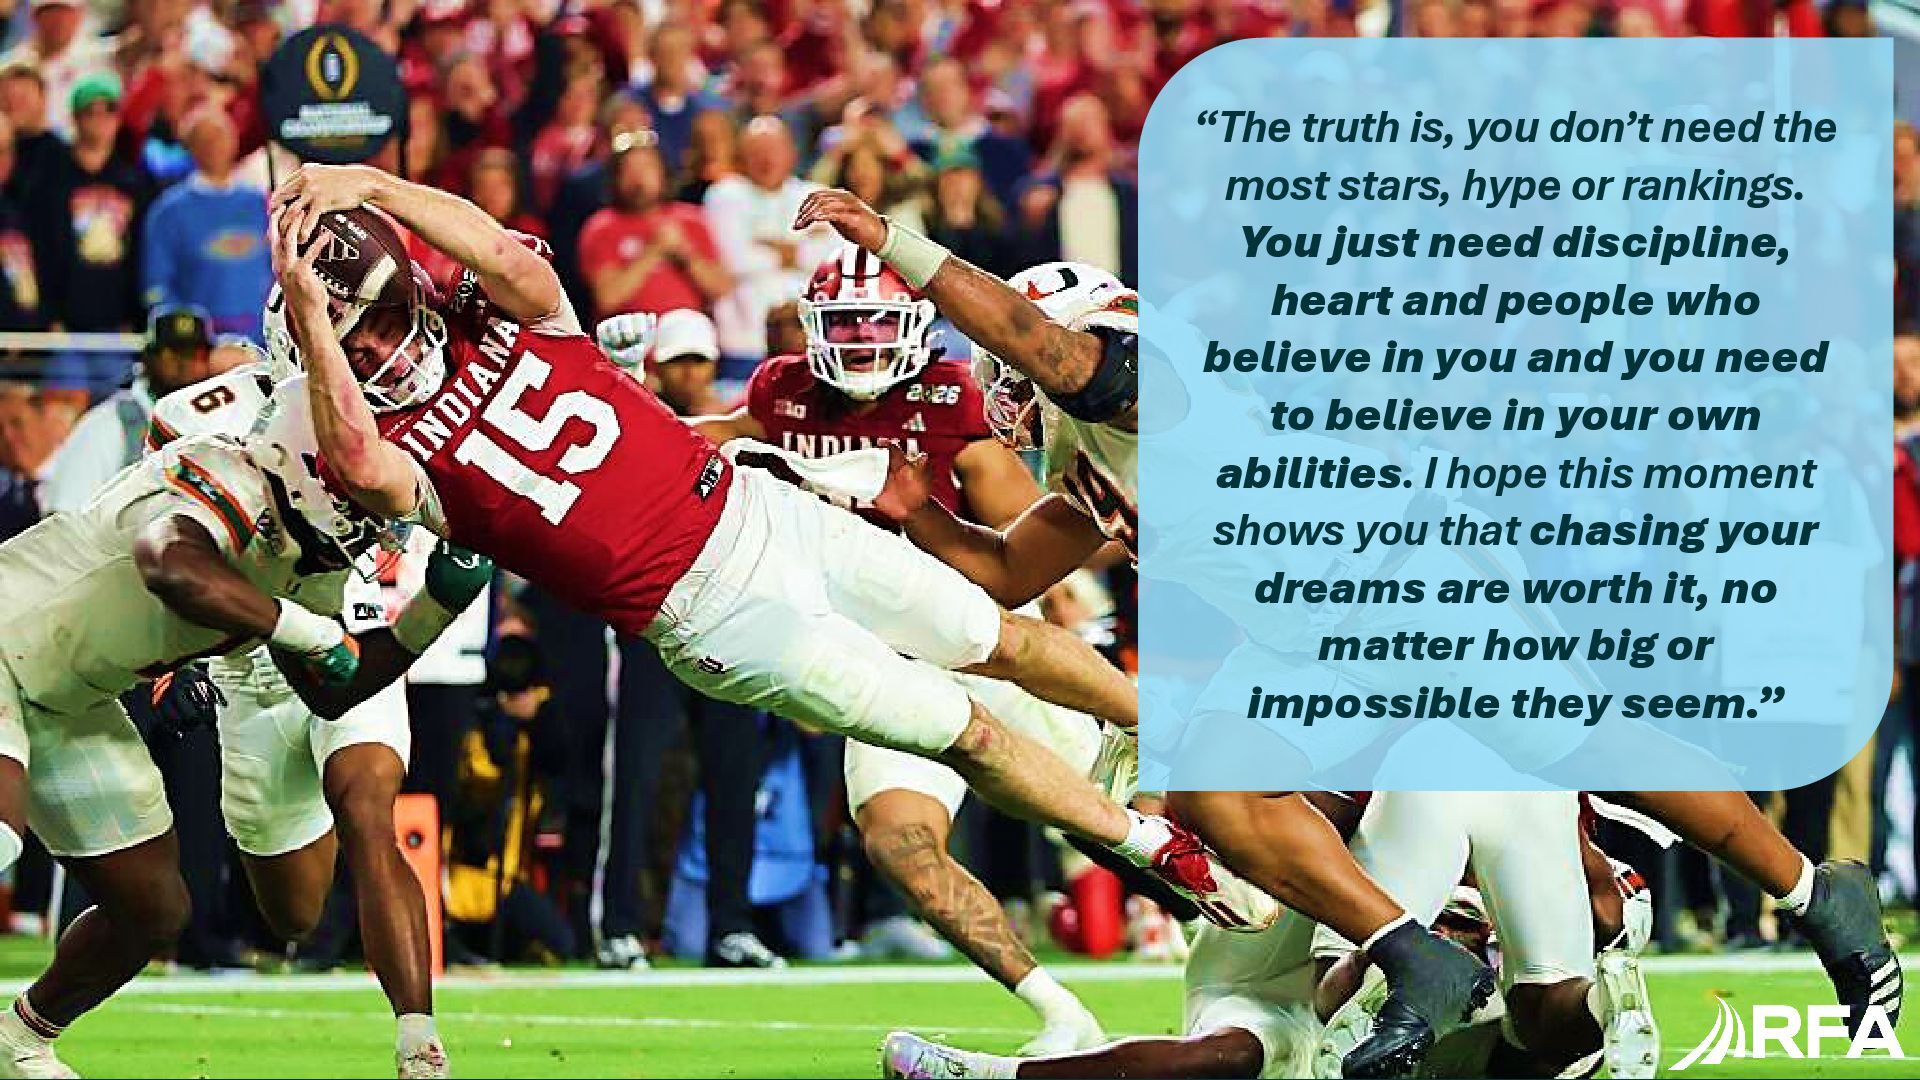
    or rankings. You just need discipline, heart and people who believe in you and you need to believe in your own abilities. I hope this moment shows you that chasing your dreams are worth it, no matter how big or impossible they seem.”