Lock in $30 Savings on PRO—Offer Ends Soon! ⏳

When Traffic Gets Weird: ML for Anomalies & For...

When Traffic Gets Weird: ML for Anomalies & Forecasts

Presentation from Tech SEO Connect 2025. Links to notebooks for your use:
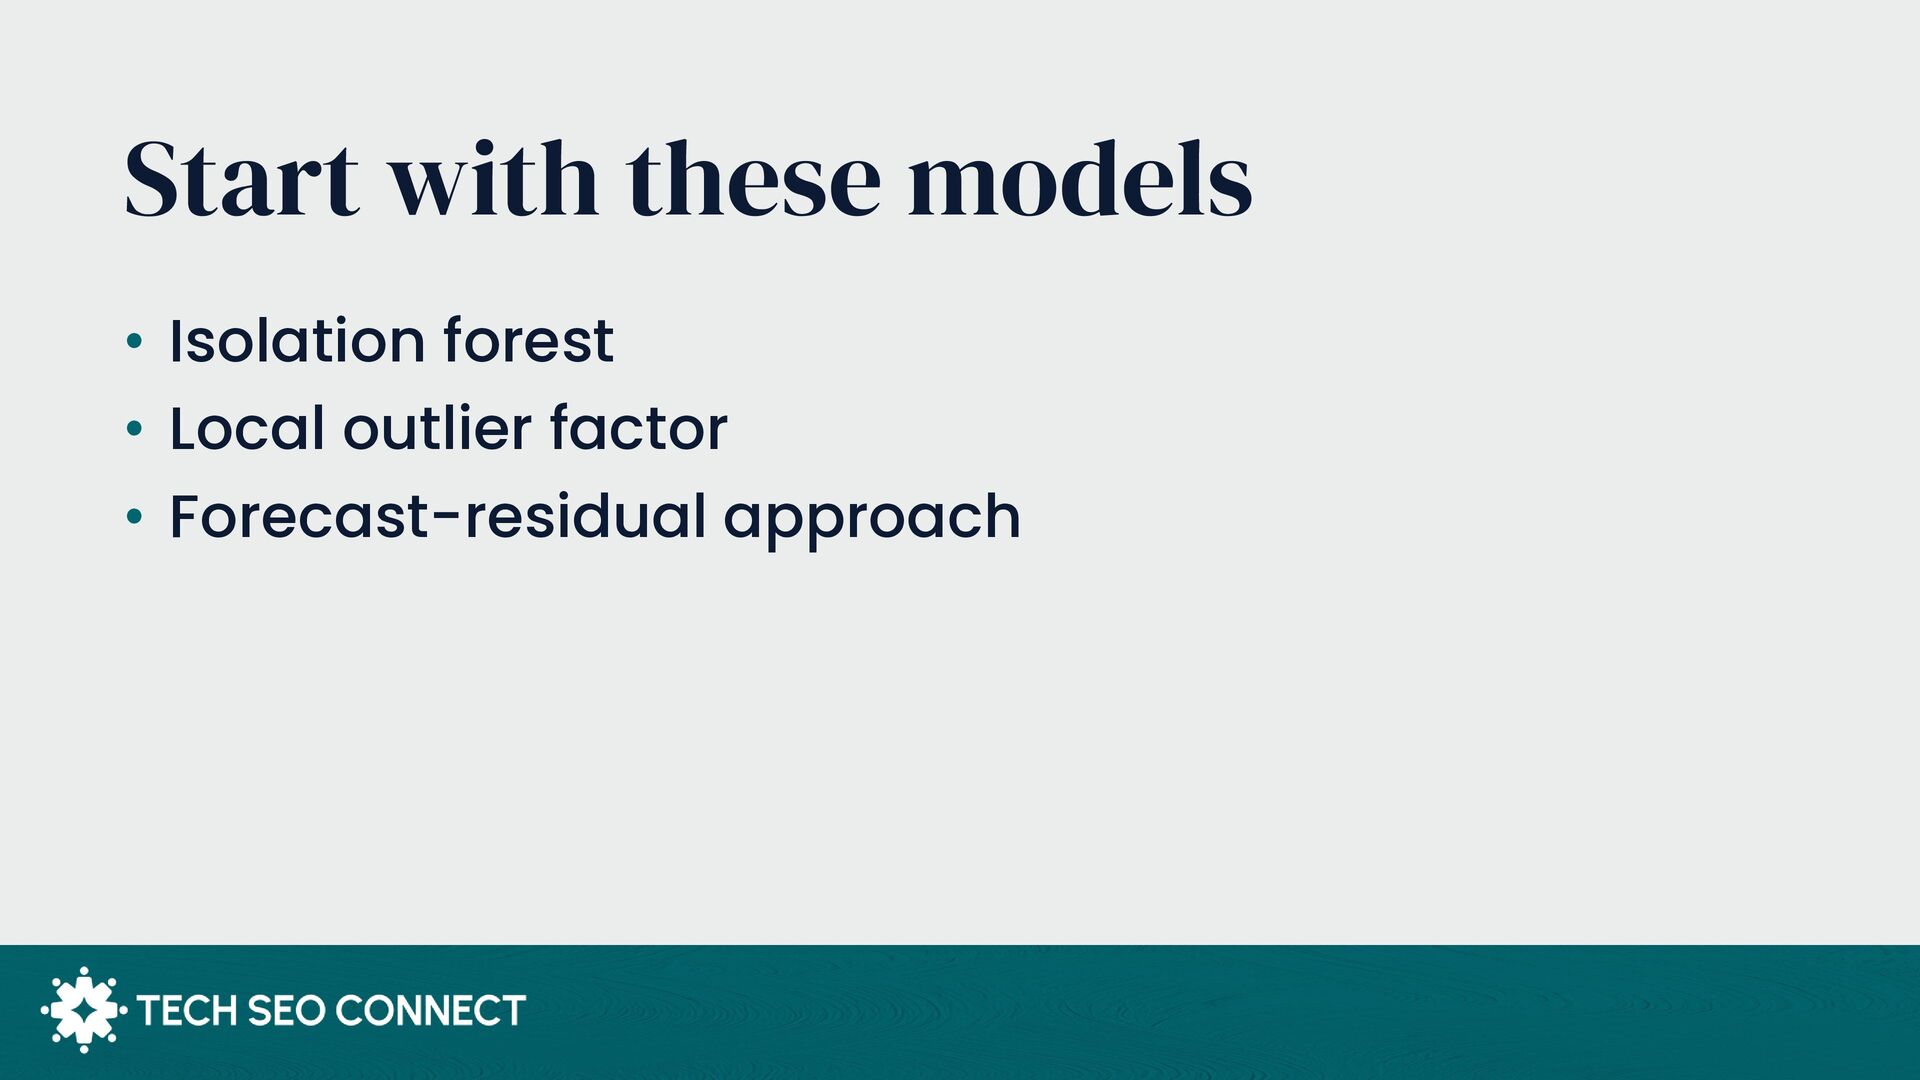
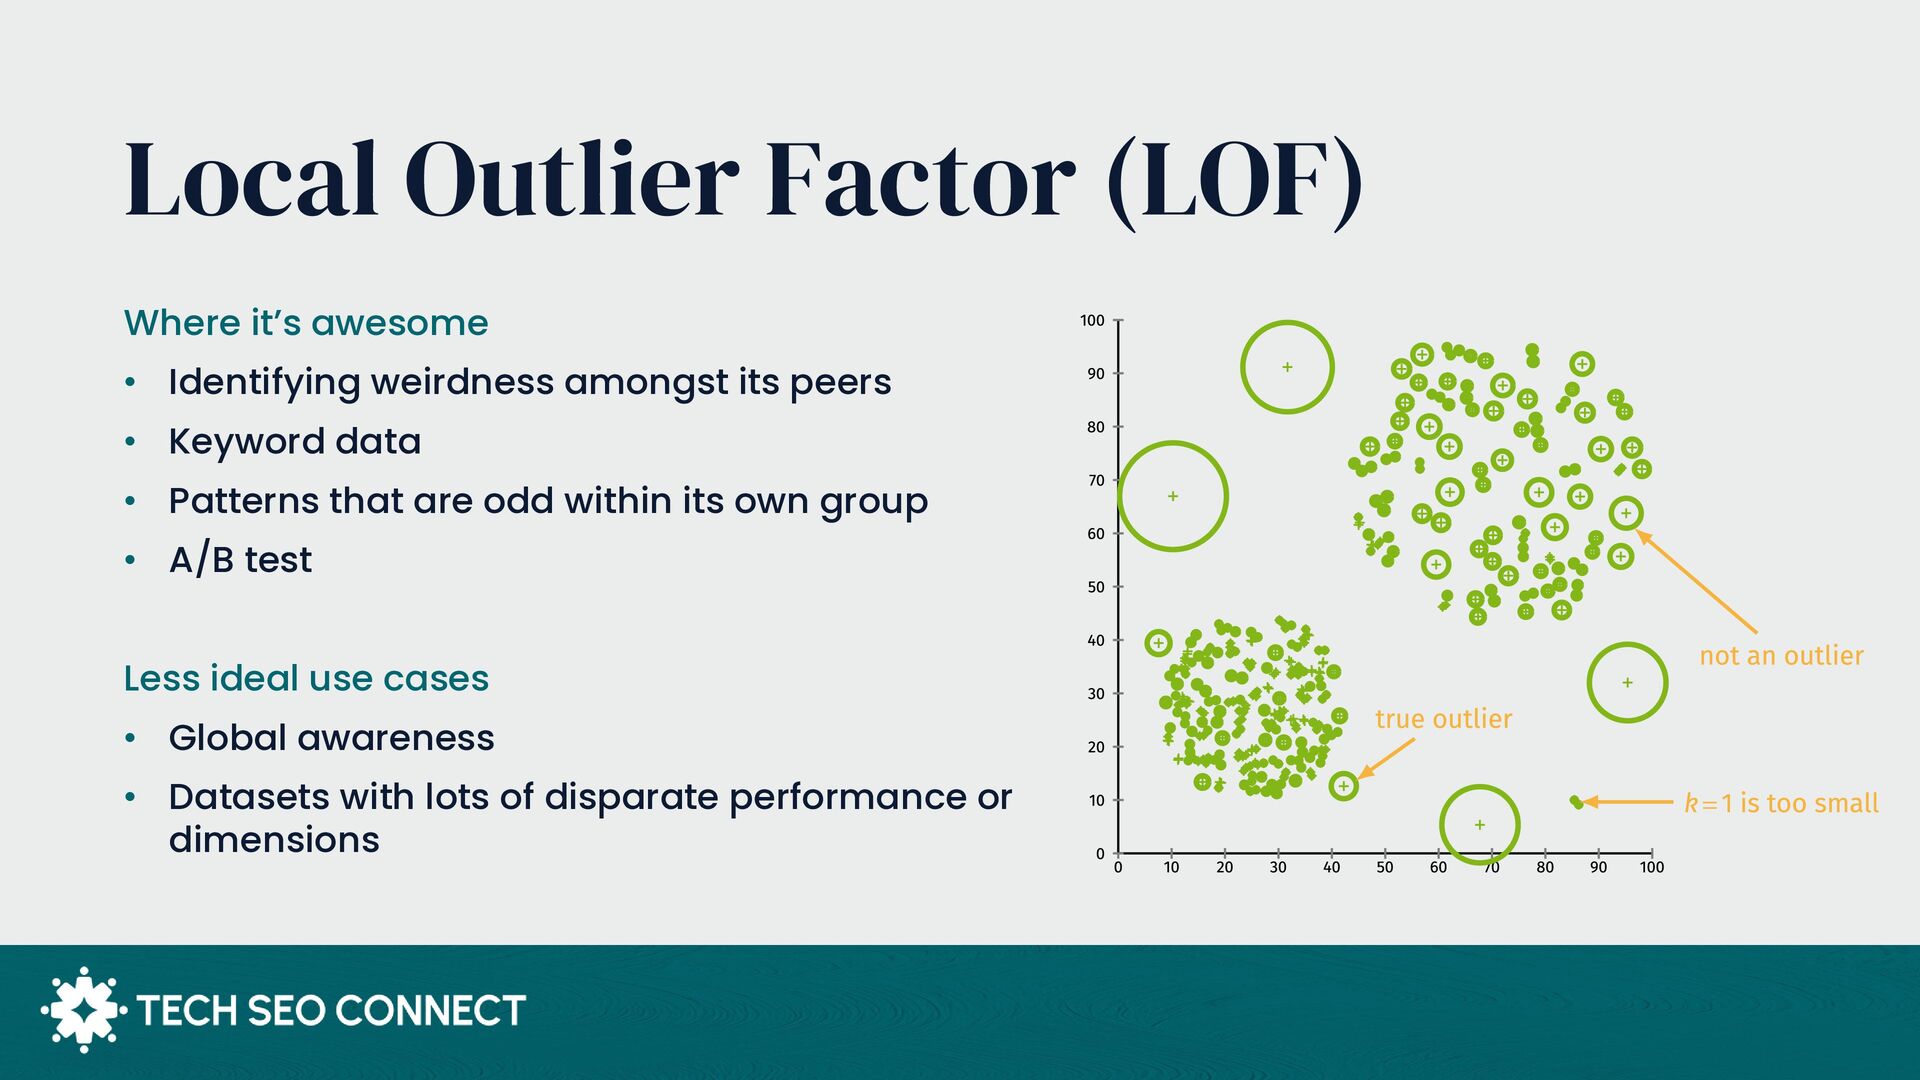
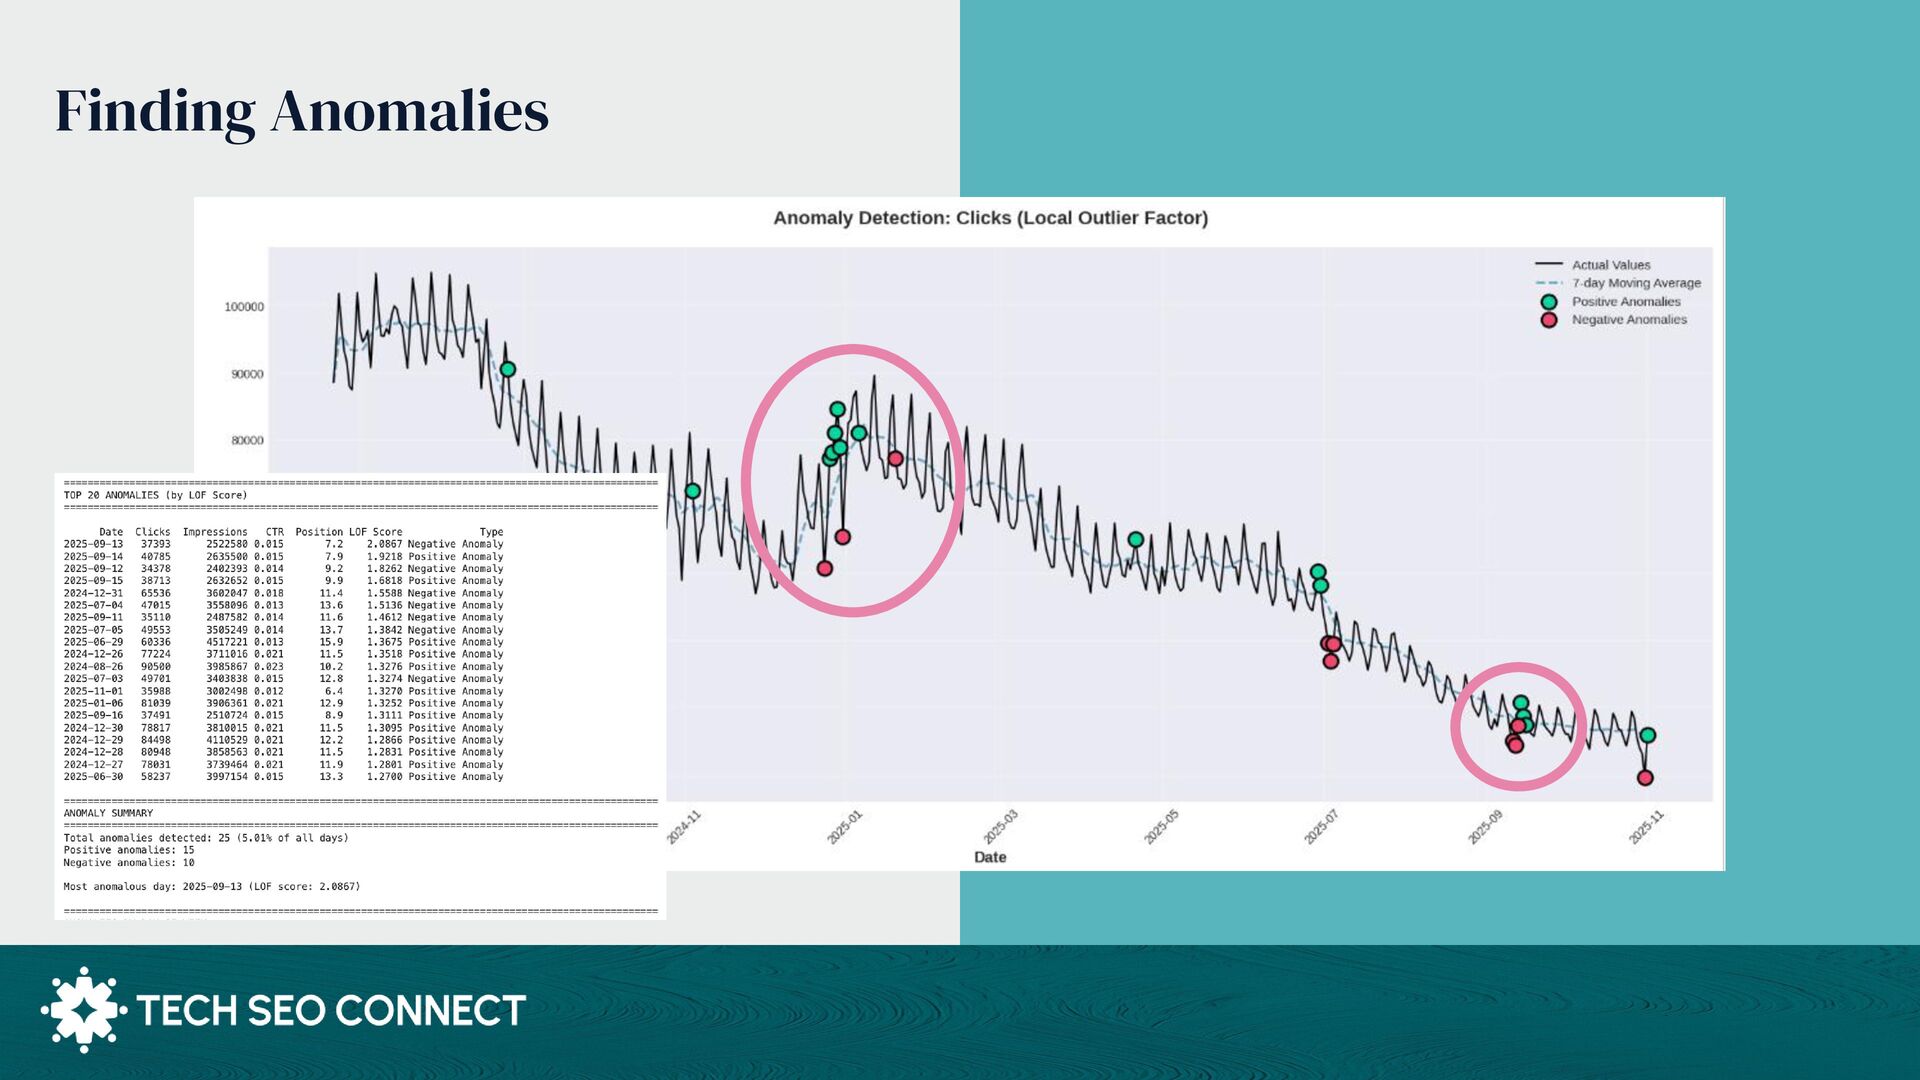
- LOF Colab: This Google Colab notebook allows you to import your GSC data and run a LOF anomaly detection model - https://colab.research.google.com/drive/1aZU-Kr2ghGkS3TInhaoRvNf-q-VFJKy-?usp=sharing
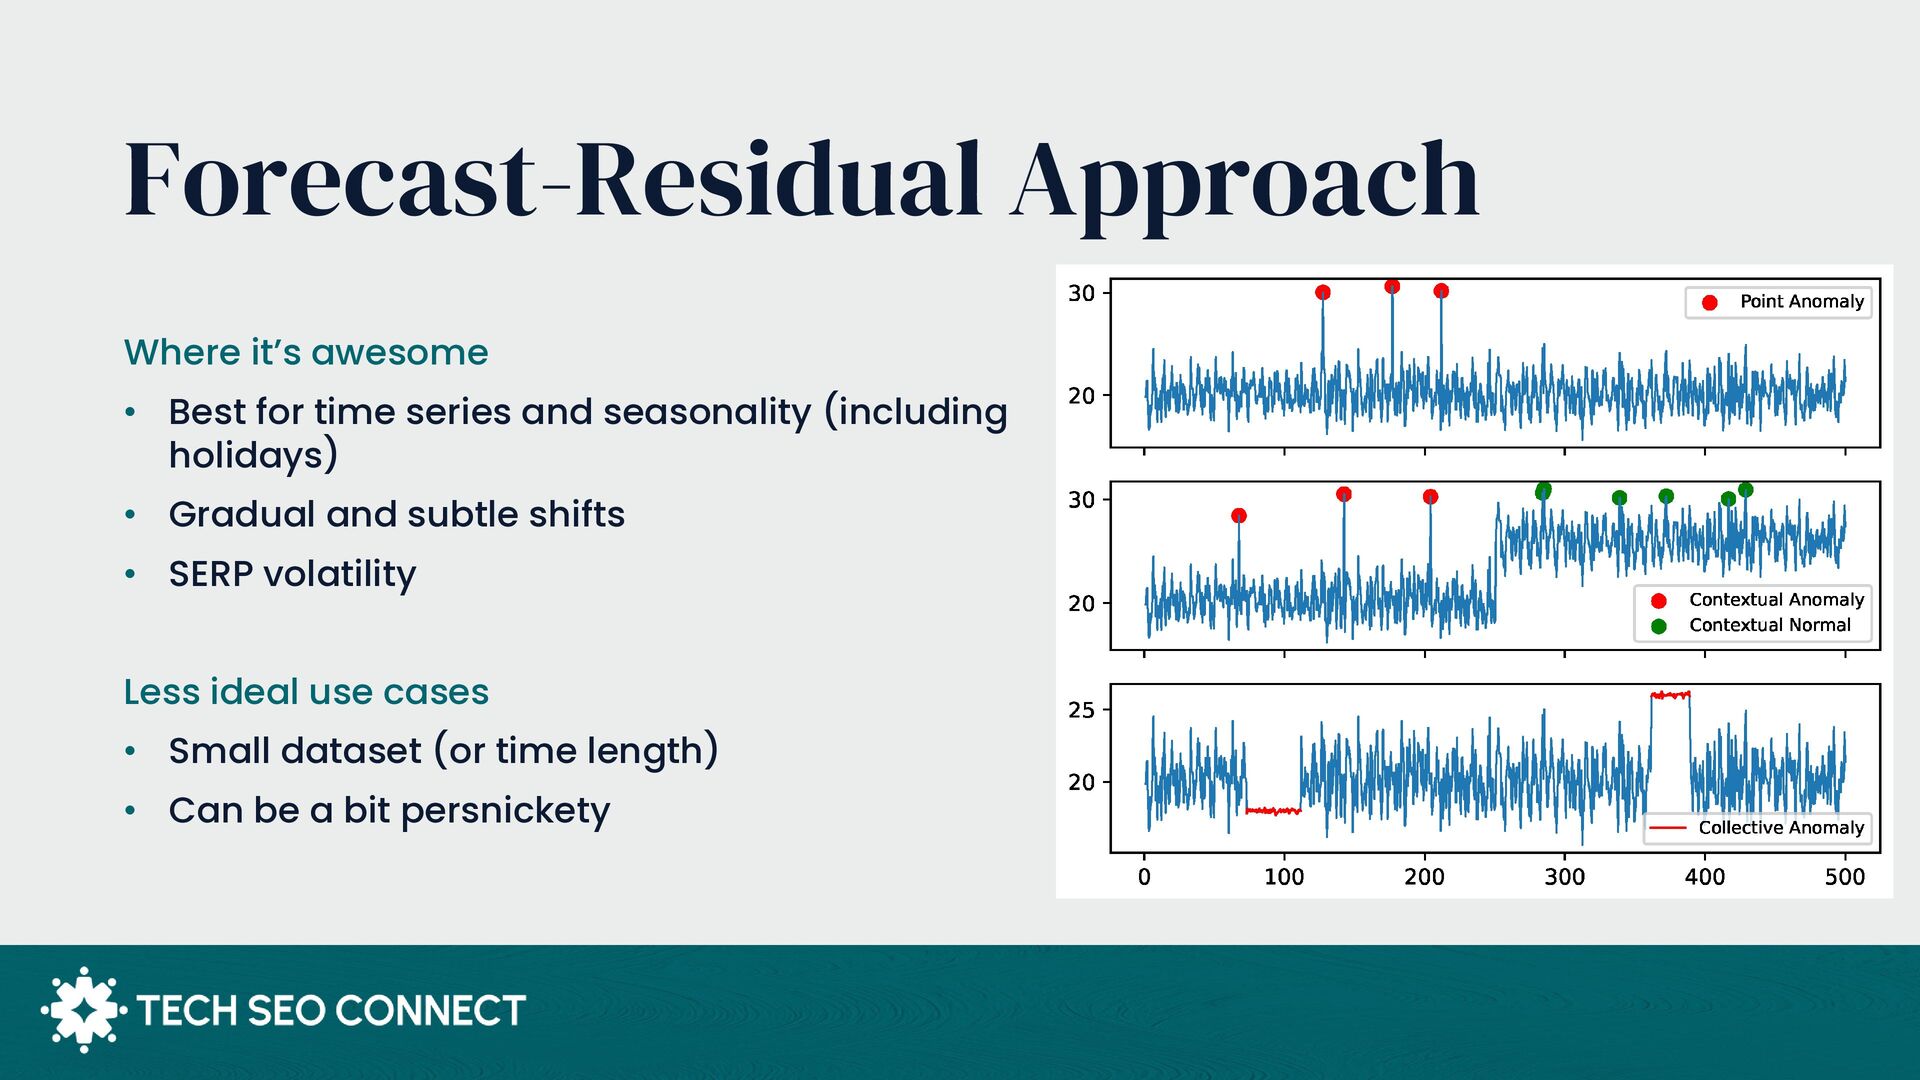
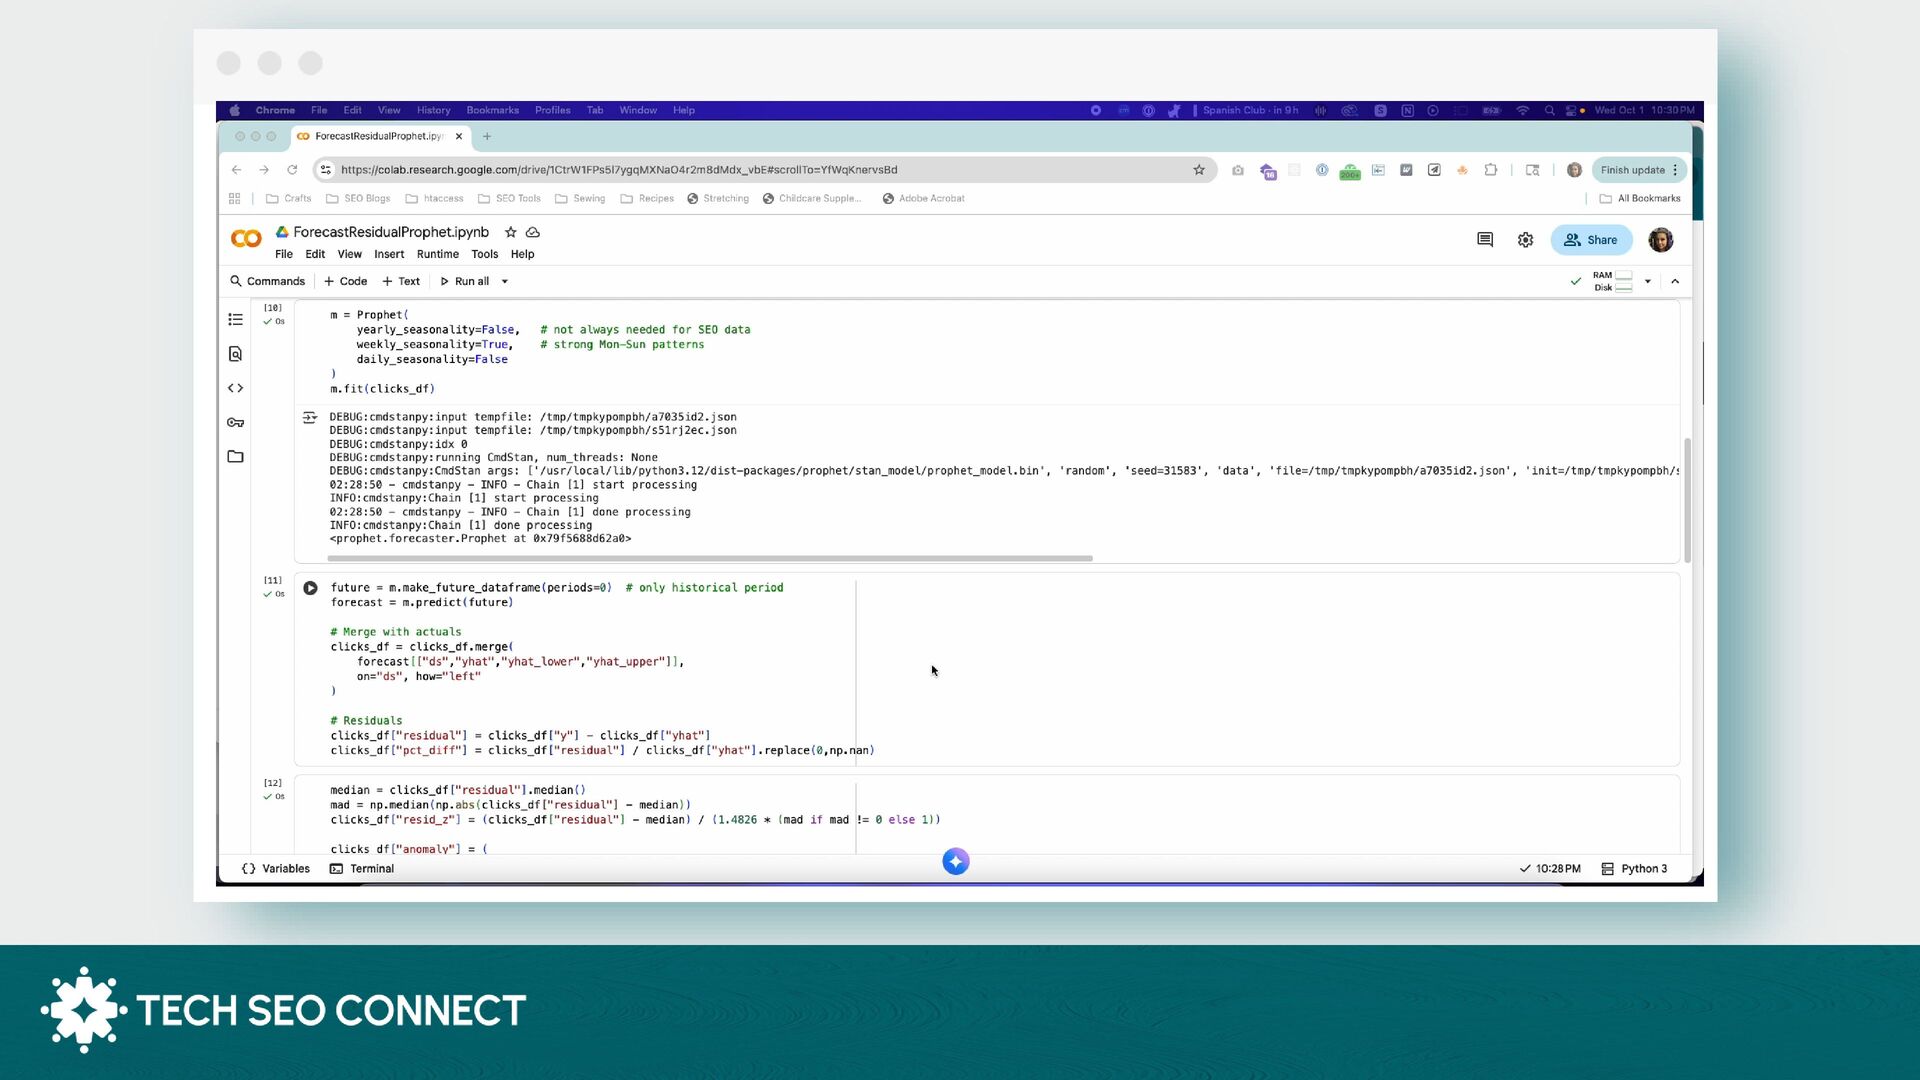
- Forecast Residual Colab: This Google Colab notebook allows you to import your GSC data and run a forecast residual detection model - https://colab.research.google.com/drive/1ZAU5HWDD8iYANkwOHQ2iI28-uBn7AU7p?usp=sharing
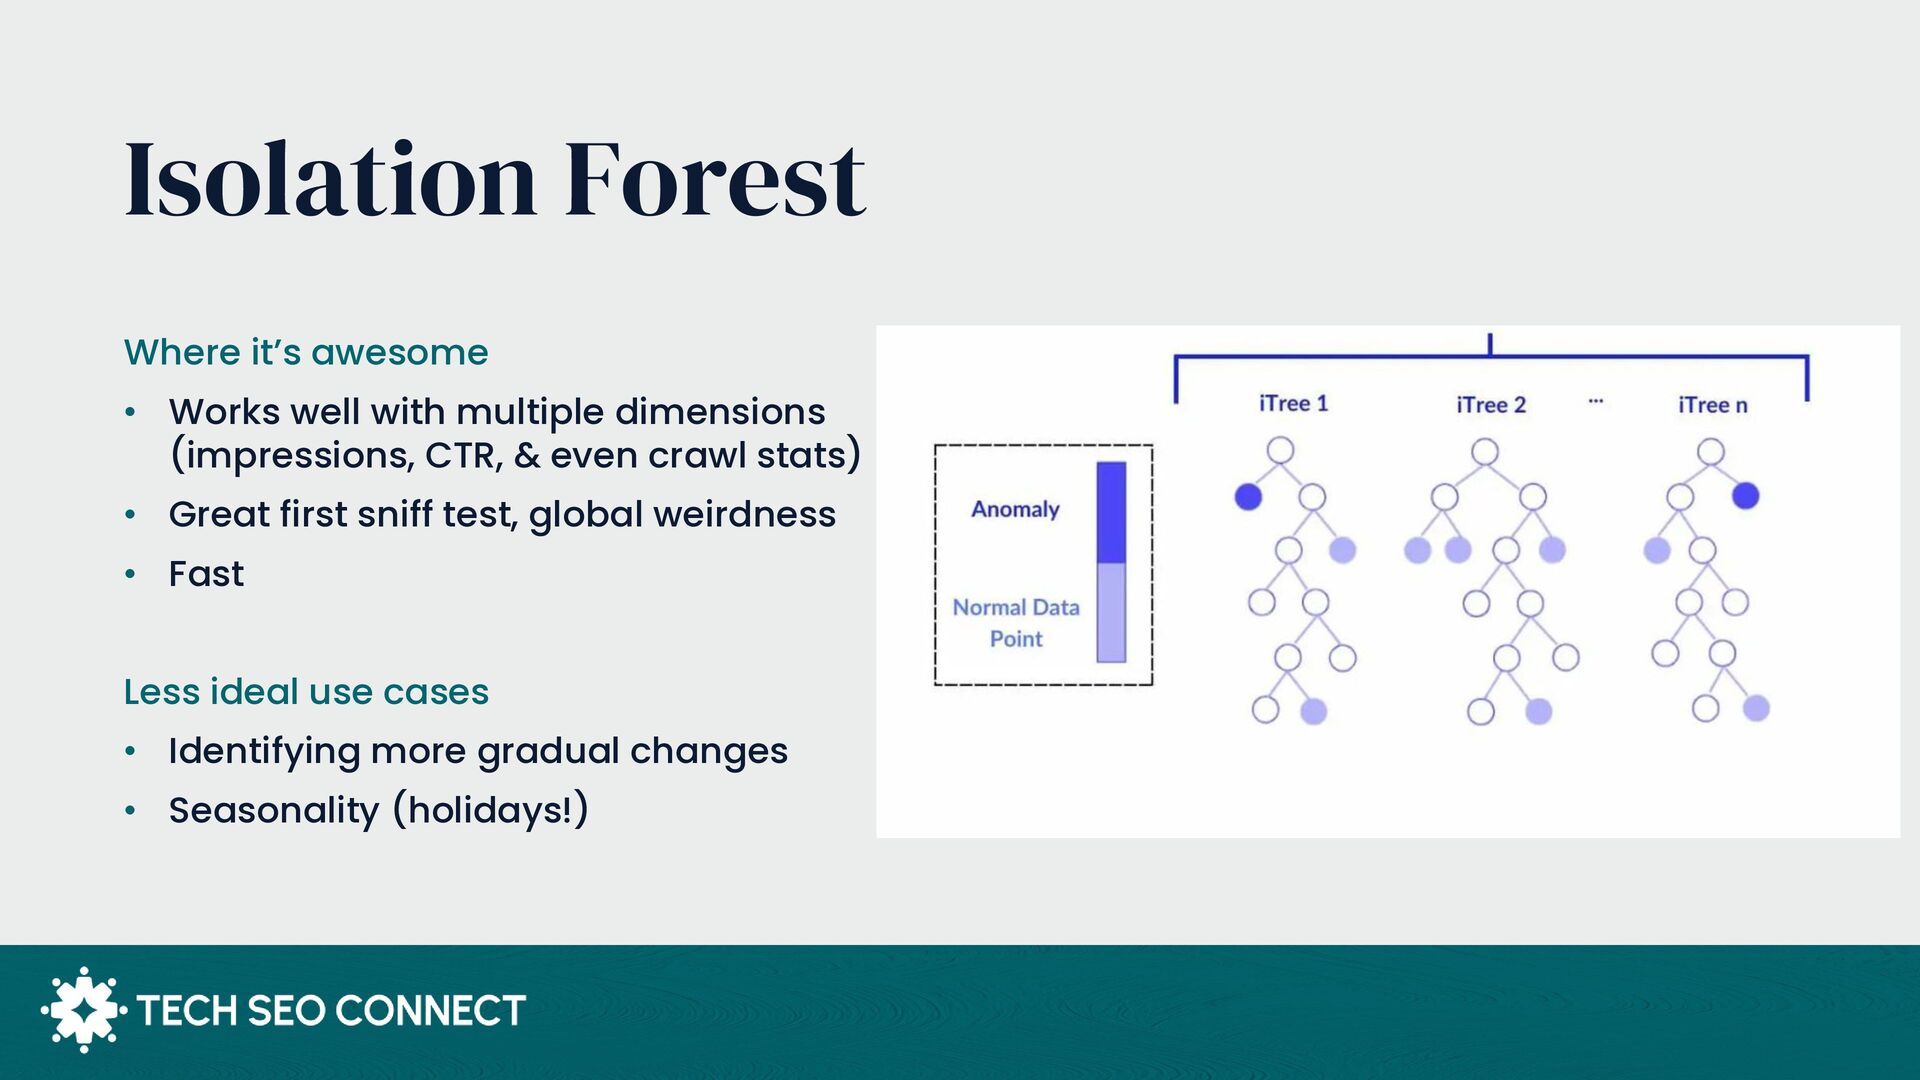
- Isolation Forest Colab: This Google Colab notebook allows you to import your GSC data and run an isolation forest anomaly detection model - https://colab.research.google.com/drive/1RrseWwgUGHyX9fHJtHI1nLKE23kNC1Er?usp=sharing

Avatar for Sam Torres

Sam Torres

December 09, 2025
Tweet

More Decks by Sam Torres

Other Decks in Marketing & SEO

Transcript

  1. Where ML shines • Specialized and built to do specific

    tasks • Pattern recognition • Anything that requires math • Consistent, reproducible results • More efficient • No “Yes and”
  2. What makes Colab special? •Removes setup tasks – start working

    immediately •Easy to share, and is YOURS •Free to use •Great learning environment •Version control
  3. Colab Building Blocks Text cells Add formatted text and documentation

    using Markdown. Code cells Write and execute your code, usually Python. Click play or Shift+Enter to run. File browser Upload files, access data, and mount Google Drive. Menu bar File operations, runtime settings, and sharing options. Top right shows RAM and disk usage.
  4. My ML Workflow 1. What am I trying to do?

    2. What kind of data do I have to get me there? 3. Ask Claude what models may be useful based on this scenario 4. Choose a model 5. Ask Claude to build me a Colab notebook to run this model (or maybe build a notebook for each model recommendation) 6. Troubleshoot (Claude, are you sure?) 7. Ecco! Have cool graphs and look super smart.
  5. What About My Dataset • Size • Data form (numbers,

    tables, time series, images) • Seasonality / holidays • Number of dimensions • Data quality
  6. Plot twist! Anomaly detection and forecasting can use the exact

    same models. The difference is all in the application.
  7. Isolation Forest Where it’s awesome • Works well with multiple

    dimensions (impressions, CTR, & even crawl stats) • Great first sniff test, global weirdness • Fast Less ideal use cases • Identifying more gradual changes • Seasonality (holidays!)
  8. Local Outlier Factor (LOF) Where it’s awesome • Identifying weirdness

    amongst its peers • Keyword data • Patterns that are odd within its own group • A/B test Less ideal use cases • Global awareness • Datasets with lots of disparate performance or dimensions
  9. Forecast-Residual Approach Where it’s awesome • Best for time series

    and seasonality (including holidays) • Gradual and subtle shifts • SERP volatility Less ideal use cases • Small dataset (or time length) • Can be a bit persnickety