Share
Embed
Taurusでお手軽に負荷試験を初めてみる with InfluxDB reporter/Grafana
負荷試験ツールTaurusのチュートリアル
ついでに、InfluxDB reporterとGrafanaを使ってみる
Tutorial of load test tool "Taurus", and tried InfluxDB reporter with Grafana.
sasa
March 18, 2023
Transcript
28 slides
-
自己紹介 佐々木 誠治 - SRE部インフラグループ - 21新卒 AWS/Elixir/Ruby/Pythonあたりをよく触っています 最近の好き -
電子ドラム - 原神v3.5楽しんでます - GCP - AfterEffects 2 -
やってみよう 時間があったらお手元の環境でも動かしてみてね! https://gettaurus.org/docs/Installation/ brew install bzt Mac Linux
sudo apt-get update sudo apt-get install python3 default-jre-headless python3-tk python3-pip python3-dev libxml2-dev libxslt-dev zlib1g-dev net-tools sudo python3 -m pip install bzt docker run -it --rm -v /tmp/my-test:/bzt-configs blazemeter/taurus my-config.yml Docker \お手軽/ 7 -
YAMLファイルの用意 Taurusのドキュメントをもとに作成 - concurrency - 同時ユーザ数 - ramp-up - 同時ユーザ数に到達するまでの時間
- hold-for - 同時ユーザ数を保持する実行時間 execution: - concurrency: 2 ramp-up: 2s hold-for: 20s scenario: Sample scenarios: Sample: default-address: https://blazedemo.com requests: - / example.yml デフォルトで、JMeterのExecuterが利用されます 8 -
CSV形式で出力させる sample.ymlに以下を追記することで、csv形式で結果を出力できます reporting: - module: final-stats summary: true percentiles: true
summary-labels: true failed-labels: false test-duration: true dump-csv: ./perf_result_csv.csv 11 -
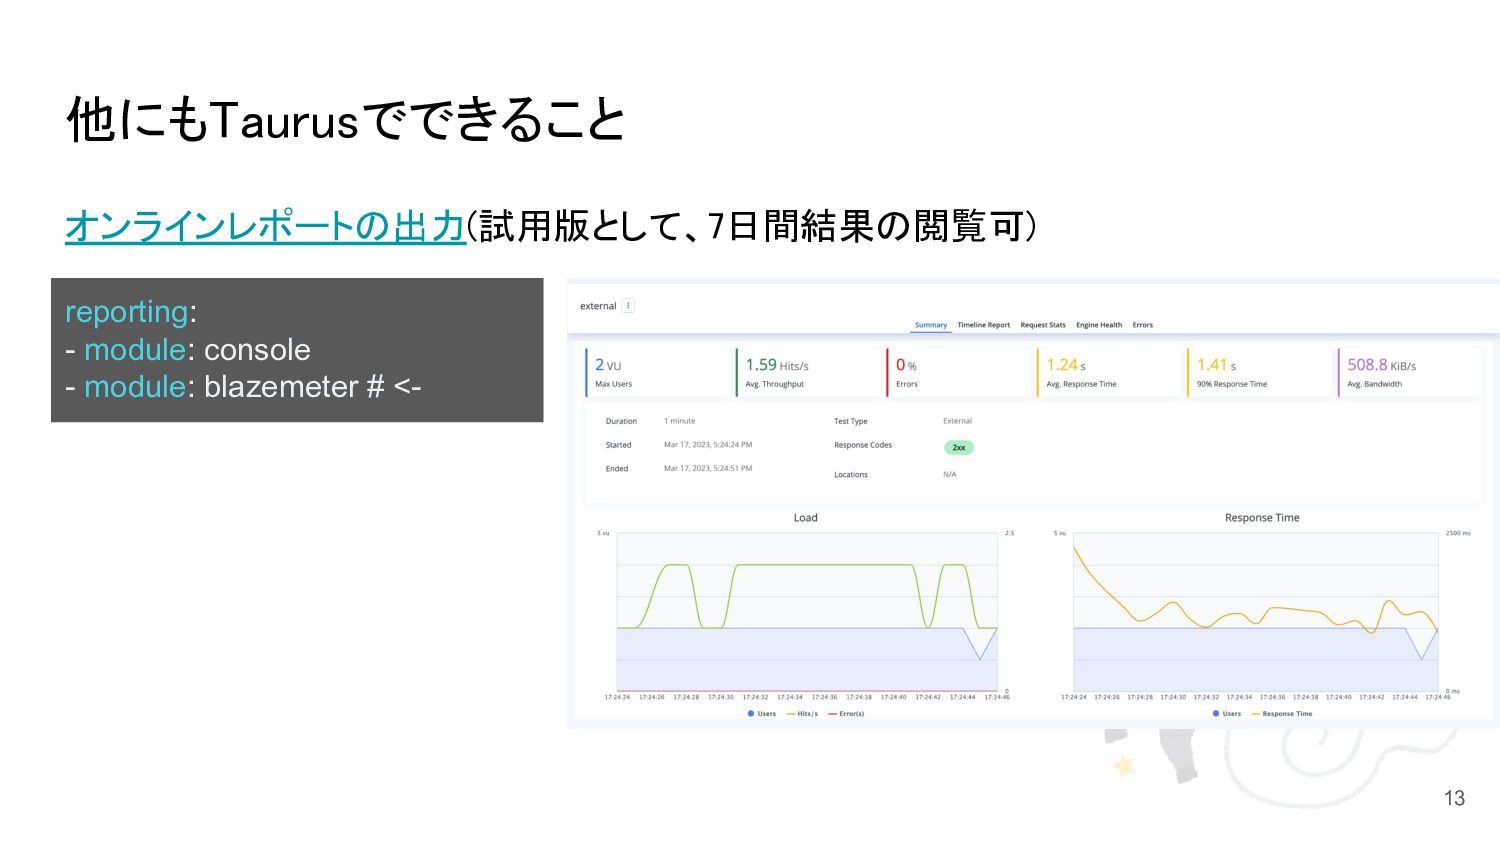
他にもTaurusでできること 実際に負荷試験で使う時は、分散モード(攻撃するサーバを複数台用意)で実行します。 execution: - distributed: - host1.mynet.com - host2.mynet.com -
host3.mynet.com scenario: some_scenario ※workerは自前で立ち上げる必要があります 12 -
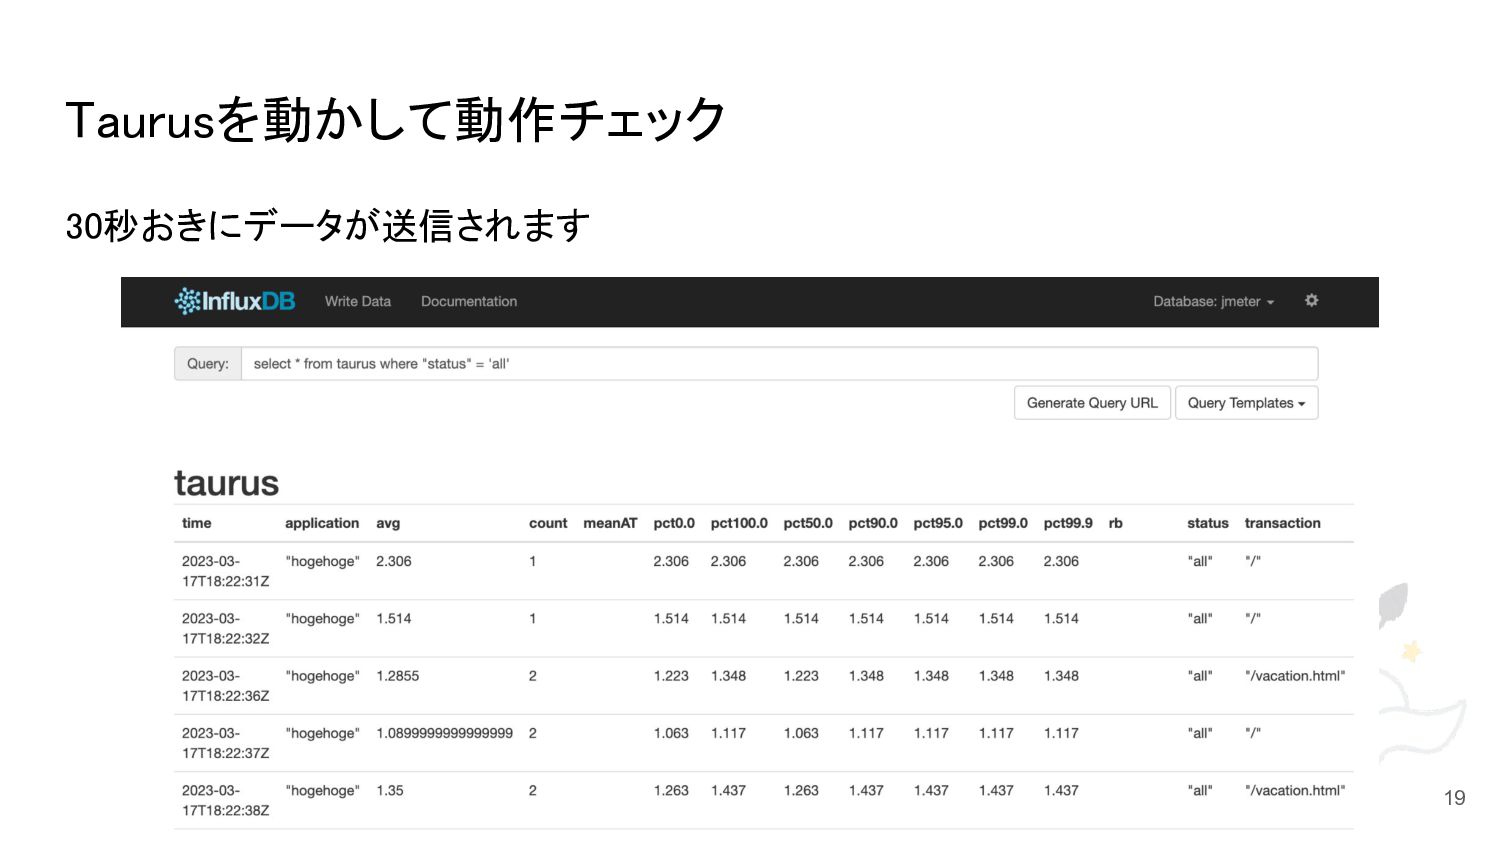
reporting: - module: influxdb-reporter modules: influxdb-reporter: host: localhost # influxdb
address (default: localhost) port: 8086 # port (default: 8086) database: jmeter # the datasource name measurement: taurus # the measurement name username: taurus # username if influxdb authentication enabled password: password # password if influxdb authentication enabled application: hogehoge 結論: 正しく動く設定 16 -
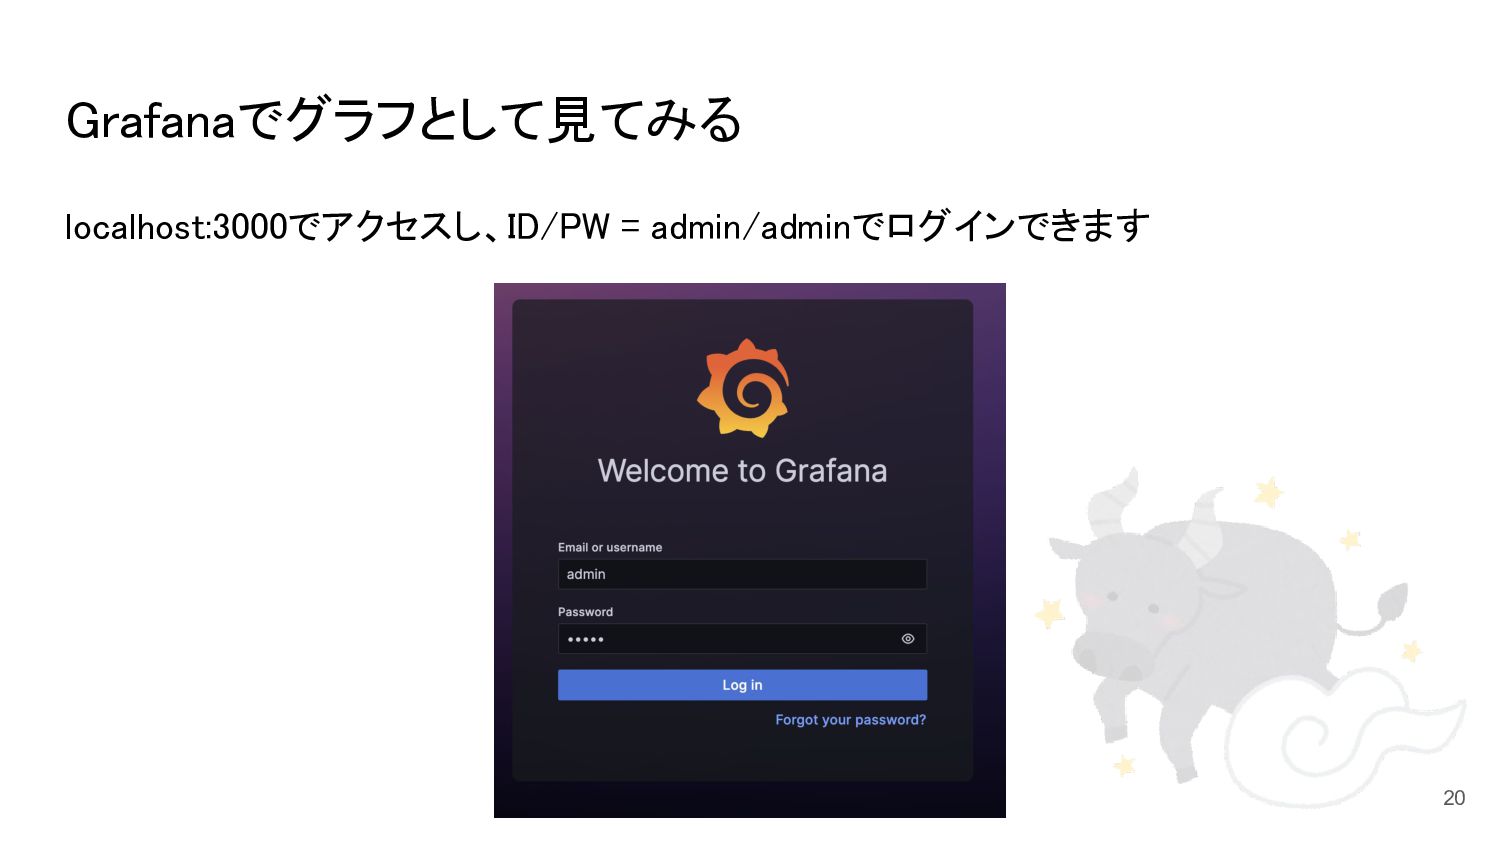
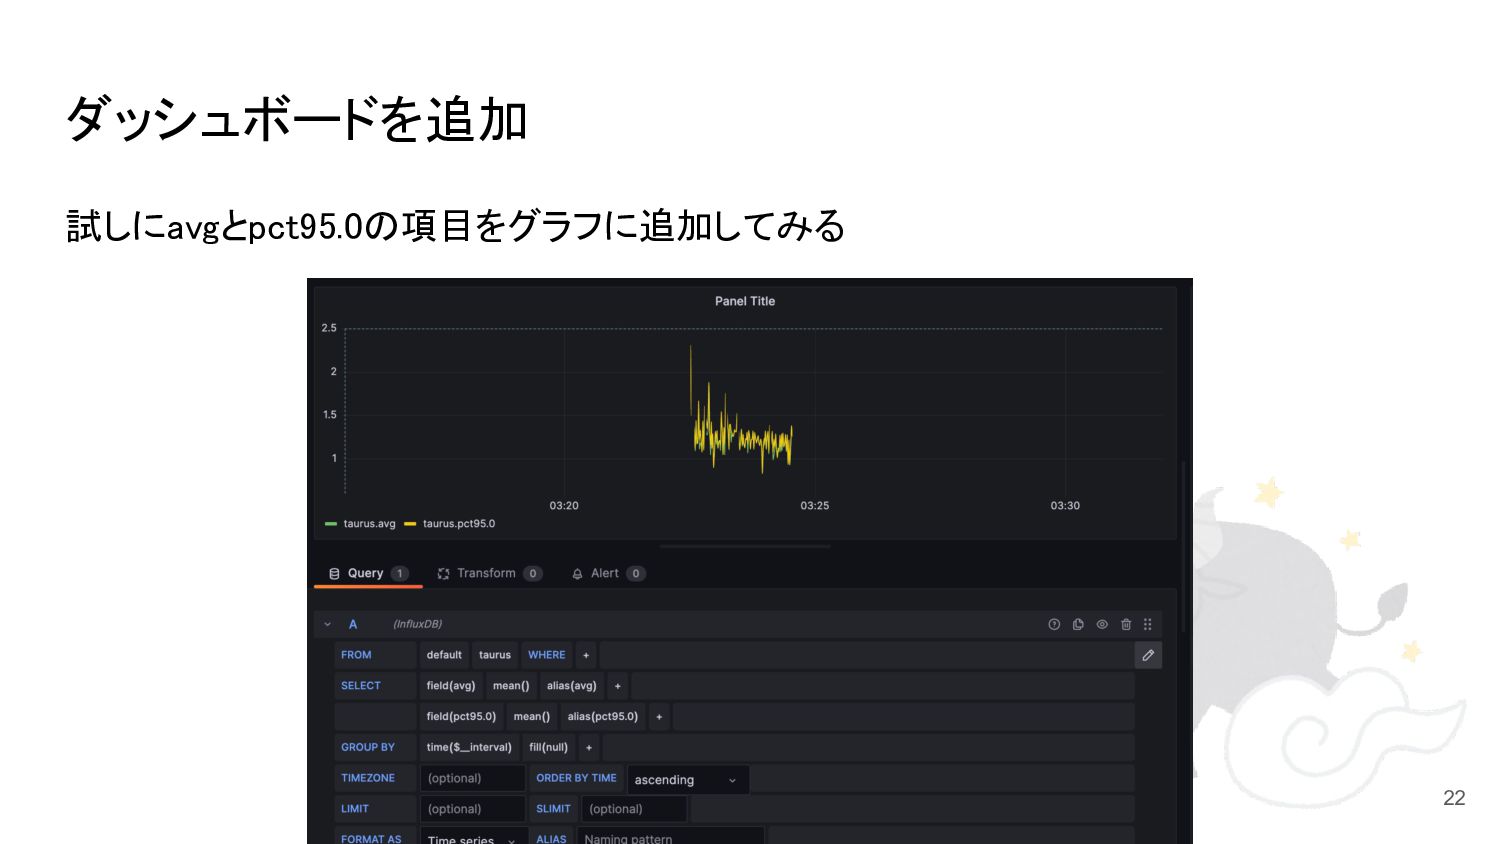
Influxdbの設定 InfluxdbとGrafanaをdocker-composeでざっと立てる version: "3" services: influxdb: image: influxdb:1.2 platform: linux/x86_64
ports: - 8086:8086 - 8083:8083 environment: - INFLUXDB_ADMIN_ENABLED=true networks: - influxdb-networks grafana: image: grafana/grafana platform: linux/arm64/v8 # M1 Macの場合付ける ports: - 3000:3000 depends_on: - influxdb networks: - influxdb-networks networks: influxdb-networks: 組み込み管理UIを利用したいため1.2を指定 8086: InfluxDBのポート 8083: 管理UIのポート 17 -
Influxdbの設定 DBとユーザーの作成 # on influxdb ui(access to http://localhost:8083/) CREATE DATABASE
"jmeter" CREATE USER "taurus" WITH PASSWORD 'password' WITH ALL PRIVILEGES 18 -
java が入っていないことで怒られます `brew install` 経由でインストールしたtaurus実行時に Child Process Error: JavaVM isn't
found, automatic installation isn't implemented エラーが出た時 For the system Java wrappers to find this JDK, symlink it with sudo ln -sfn /opt/homebrew/opt/openjdk/libexec/openjdk.jdk /Library/Java/JavaVirtualMachines/openjdk.jdk openjdk is keg-only, which means it was not symlinked into /opt/homebrew, because macOS provides similar software and installing this software in parallel can cause all kinds of trouble. If you need to have openjdk first in your PATH, run: echo 'export PATH="/opt/homebrew/opt/openjdk/bin:$PATH"' >> ~/.zshrc For compilers to find openjdk you may need to set: export CPPFLAGS="-I/opt/homebrew/opt/openjdk/include" $ brew install java # bew した結果に表示された通りコマンドを実行してみる $ sudo ln -sfn /opt/homebrew/opt/openjdk/libexec/openjdk.jdk /Library/Java/JavaVirtualMachines/openjdk.jdk $echo 'export PATH="/opt/homebrew/opt/openjdk/bin:$PATH"' >> ~/.zshrc 26 `brew install java` 実行時に出てくる文章 -
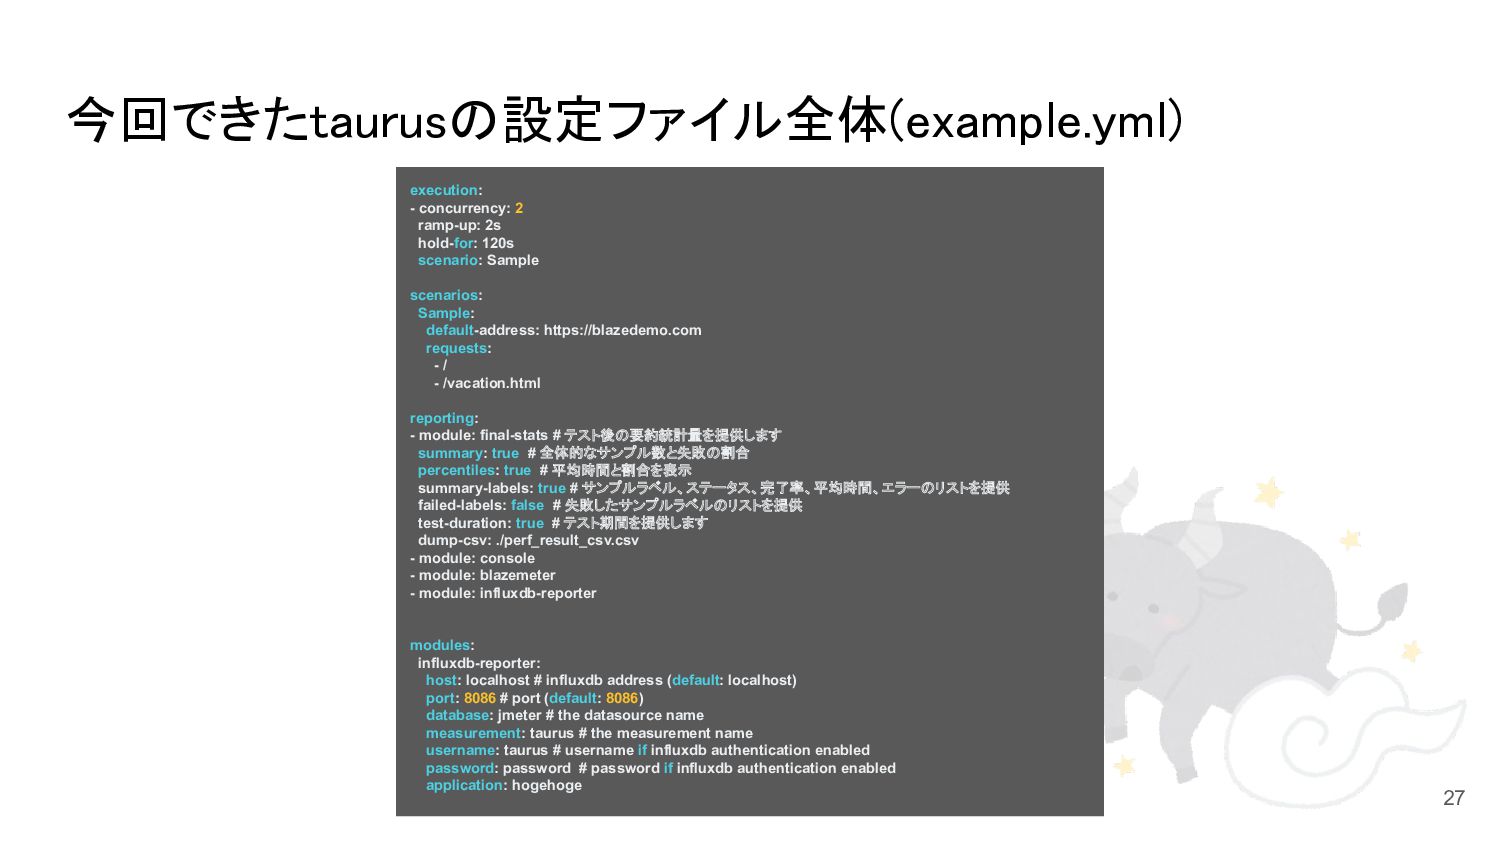
今回できたtaurusの設定ファイル全体(example.yml) execution: - concurrency: 2 ramp-up: 2s hold-for: 120s scenario:
Sample scenarios: Sample: default-address: https://blazedemo.com requests: - / - /vacation.html reporting: - module: final-stats # テスト後の要約統計量を提供します summary: true # 全体的なサンプル数と失敗の割合 percentiles: true # 平均時間と割合を表示 summary-labels: true # サンプルラベル、ステータス、完了率、平均時間、エラーのリストを提供 failed-labels: false # 失敗したサンプルラベルのリストを提供 test-duration: true # テスト期間を提供します dump-csv: ./perf_result_csv.csv - module: console - module: blazemeter - module: influxdb-reporter modules: influxdb-reporter: host: localhost # influxdb address (default: localhost) port: 8086 # port (default: 8086) database: jmeter # the datasource name measurement: taurus # the measurement name username: taurus # username if influxdb authentication enabled password: password # password if influxdb authentication enabled application: hogehoge 27