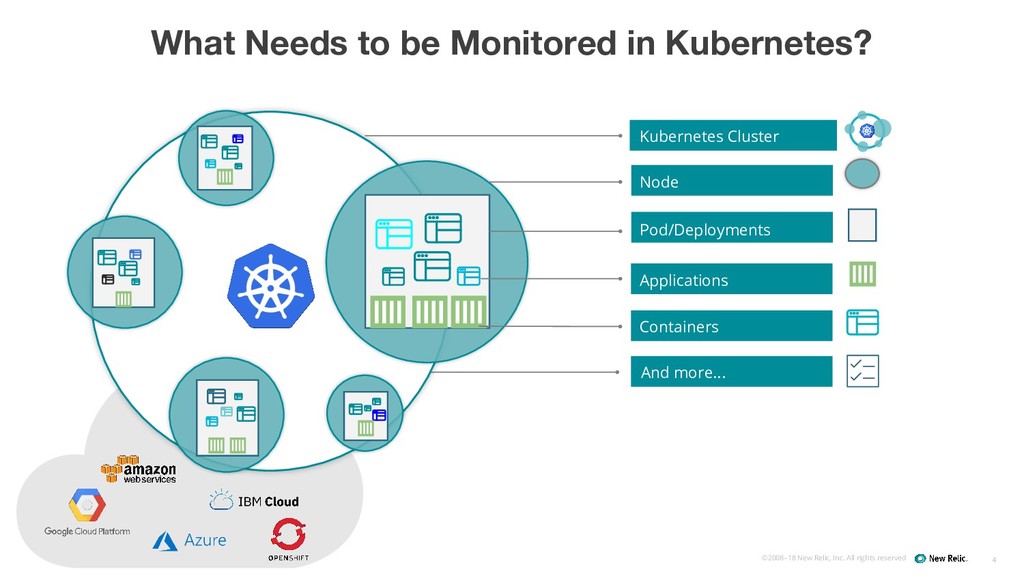
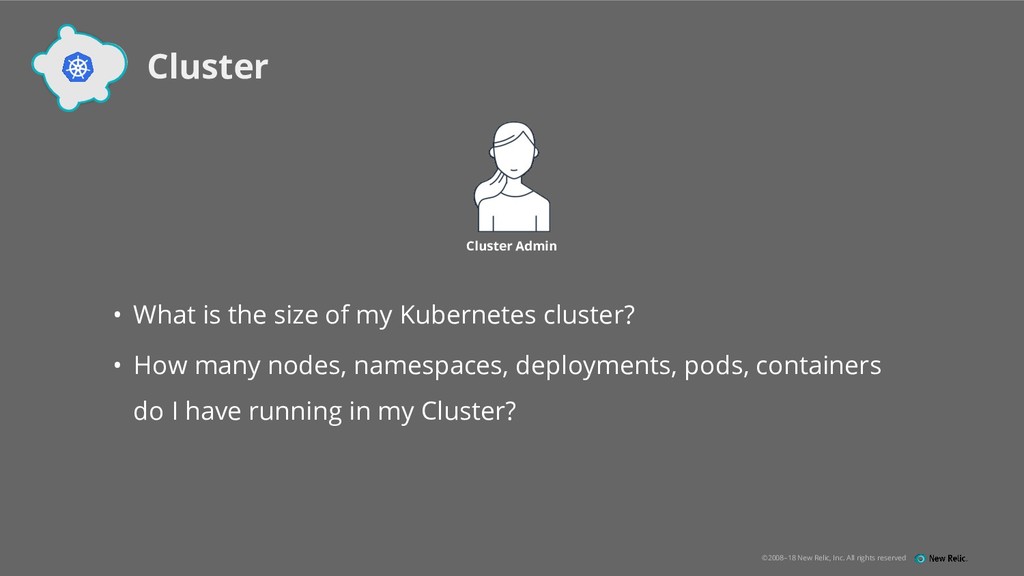
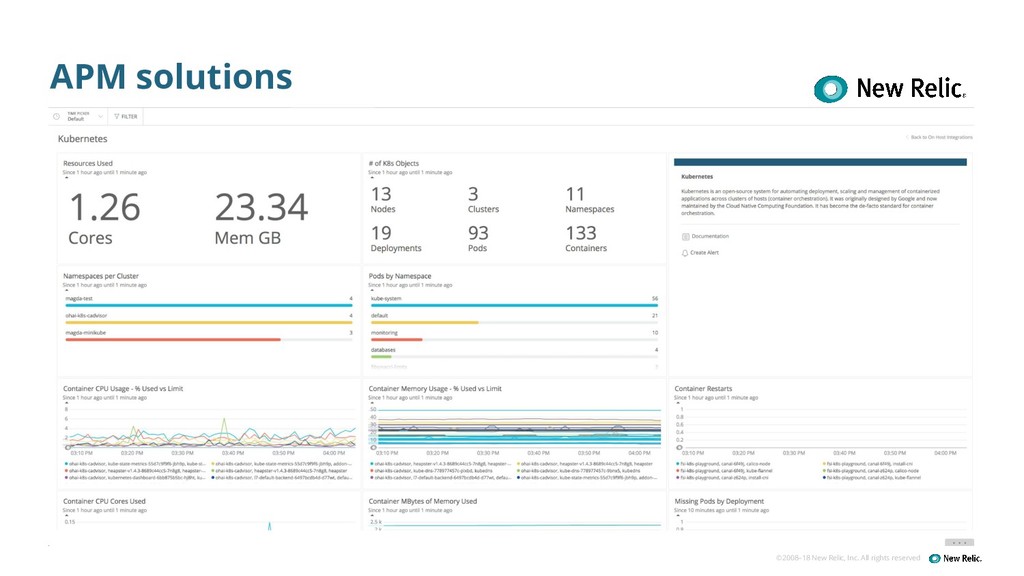
MONITORING FOR: Cluster Overview • What is the size of my Kubernetes cluster? • How many nodes, namespaces, deployments, pods, containers do I have running in my Cluster? Cluster Admin WHAT • Snapshot of what objects are included in a Cluster WHY • Kubernetes is managed by various teams including SREs, SysAdmin, Developers so it can be difficult to keep track of the current state of a Cluster
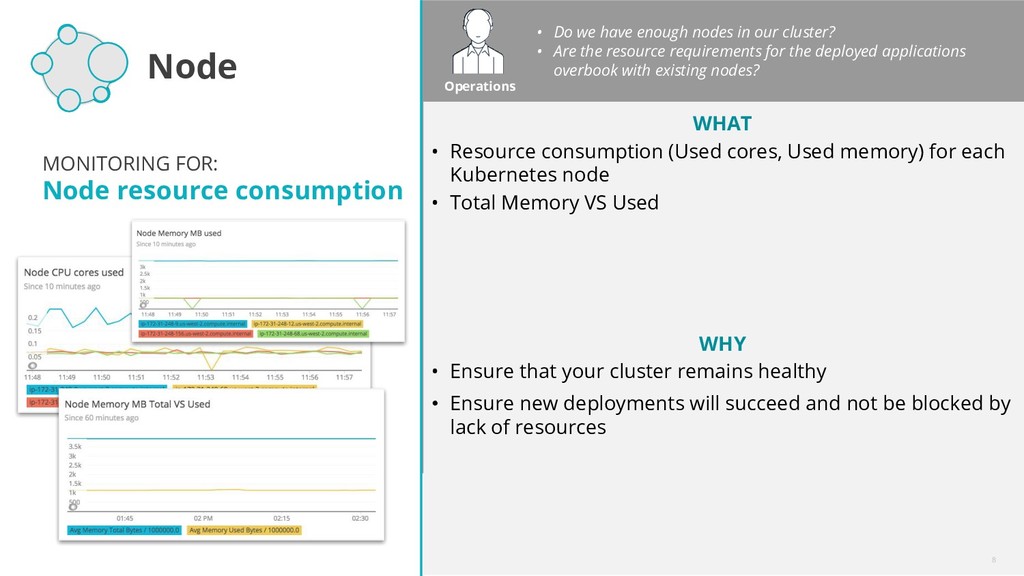
MONITORING FOR: Node resource consumption WHAT • Resource consumption (Used cores, Used memory) for each Kubernetes node • Total Memory VS Used WHY • Ensure that your cluster remains healthy • Ensure new deployments will succeed and not be blocked by lack of resources • Do we have enough nodes in our cluster? • Are the resource requirements for the deployed applications overbook with existing nodes? Operations
FOR: Pods not running WHY • Missing pods may indicate: ◦ Insufficient resources to schedule a pod ◦ Unhealthy pods: Liveness probe, readinessProbe, etc. ◦ Others • Are things working the way I expect them to? • Are my apps running and healthy? Operations Pods/ Deployment WHAT • Number of current pods in a Deployment should be the same as desired.
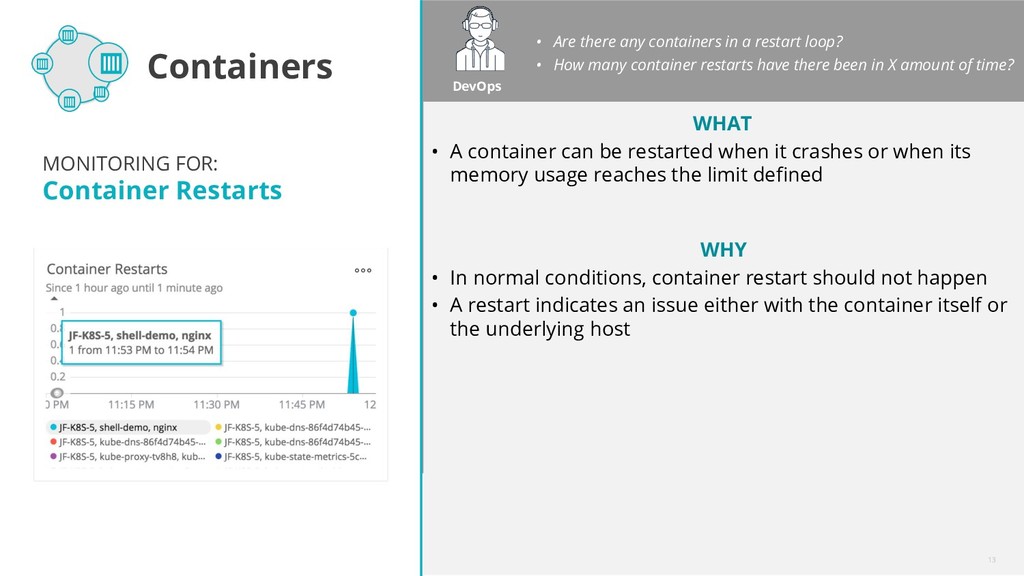
containers hitting their resource limits and affecting application performance? • Are there spikes in resource consumption? • Are there any containers in a restart loop? • How many container restarts have there been in X amount of time? Containers DevOps
FOR: Container Resources Usage WHY • If a container hits the limit of CPU usage, the application’s performances will be affected • If a container hits the limit of memory usage, K8s might terminate it or restart it • Are my containers hitting their resource limits and affecting application performance? • Are there spikes in resource consumption? DevOps Containers WHAT • Resource Request: minimum amount of resource which will be guaranteed by the scheduler • Resource Limit: is the maximum amount of the resource that the container will be allowed to consume
FOR: Container Restarts WHY • In normal conditions, container restart should not happen • A restart indicates an issue either with the container itself or the underlying host • Are there any containers in a restart loop? • How many container restarts have there been in X amount of time? DevOps Containers WHAT • A container can be restarted when it crashes or when its memory usage reaches the limit defined
how many services does my cluster have? • Which is the current status of my Horizontal Pod Autoscalers? • Are my Persistent Volumes well provisioned? • Etc Others You
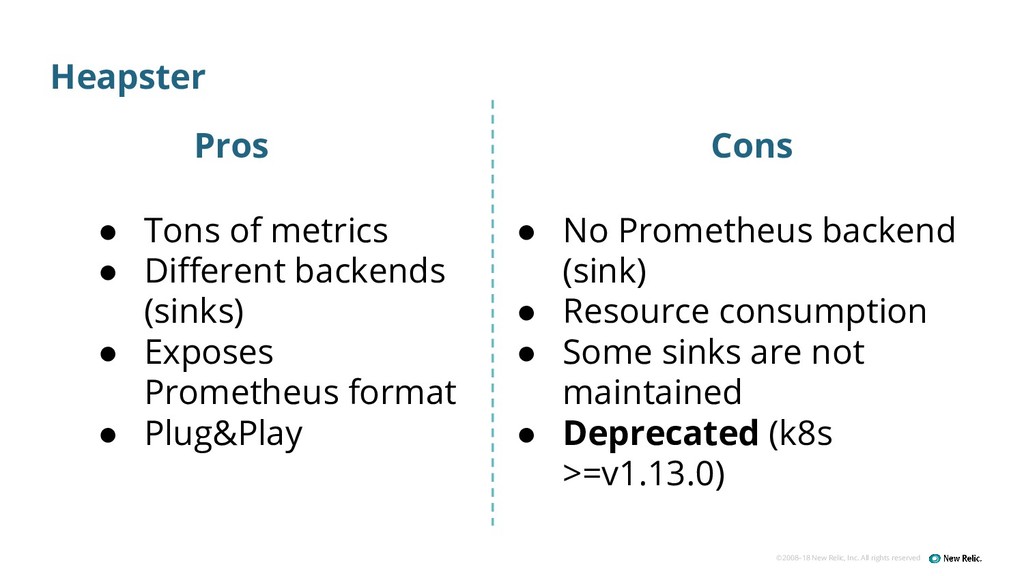
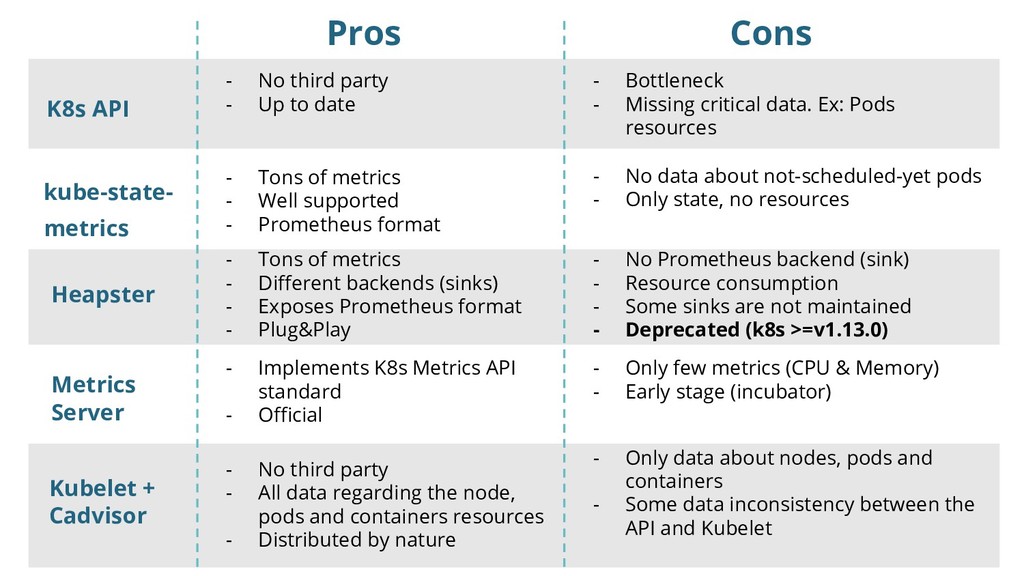
of metrics • Different backends (sinks) • Exposes Prometheus format • Plug&Play • No Prometheus backend (sink) • Resource consumption • Some sinks are not maintained • Deprecated (k8s >=v1.13.0) Pros Cons
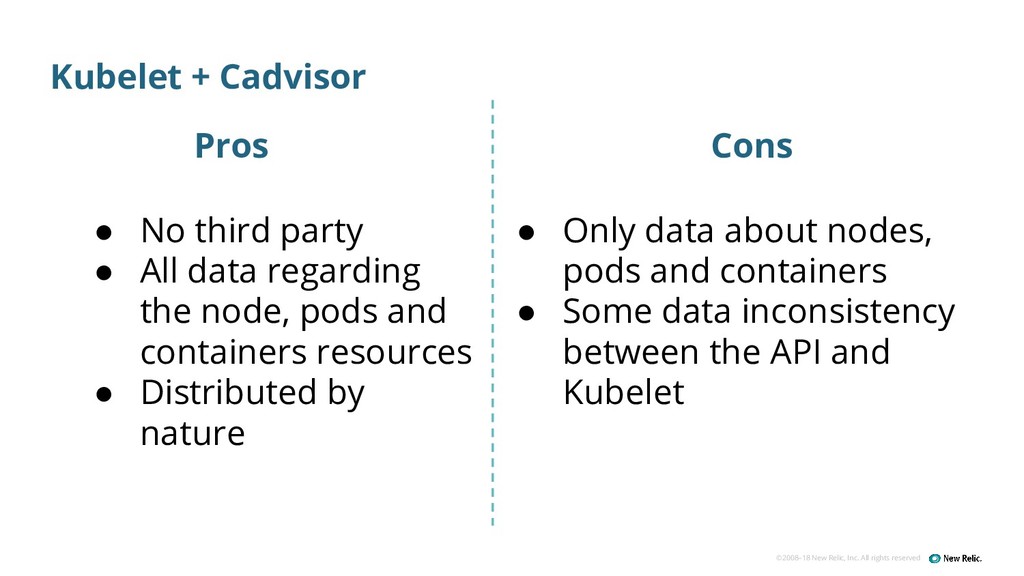
• No third party • All data regarding the node, pods and containers resources • Distributed by nature • Only data about nodes, pods and containers • Some data inconsistency between the API and Kubelet Pros Cons
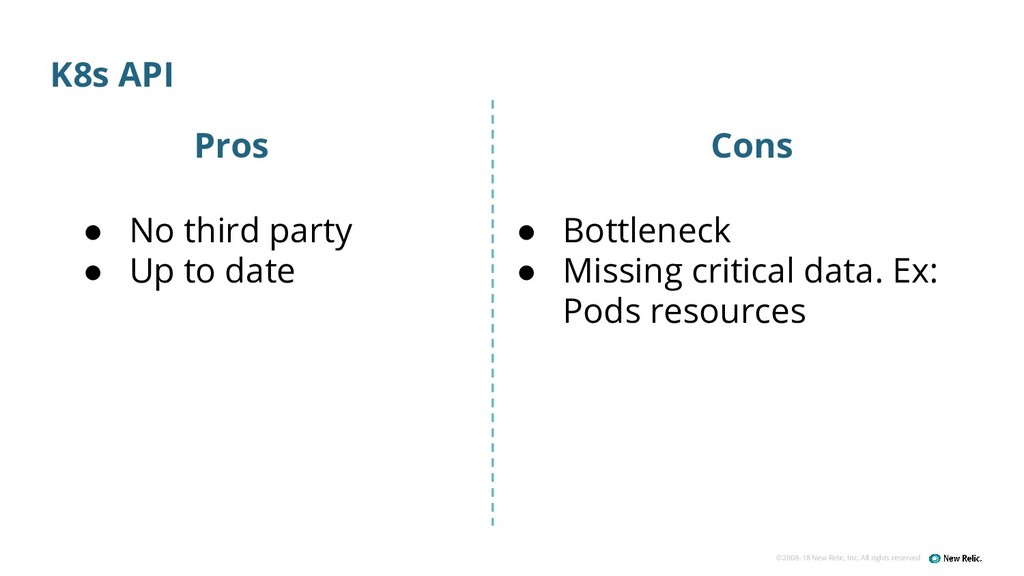
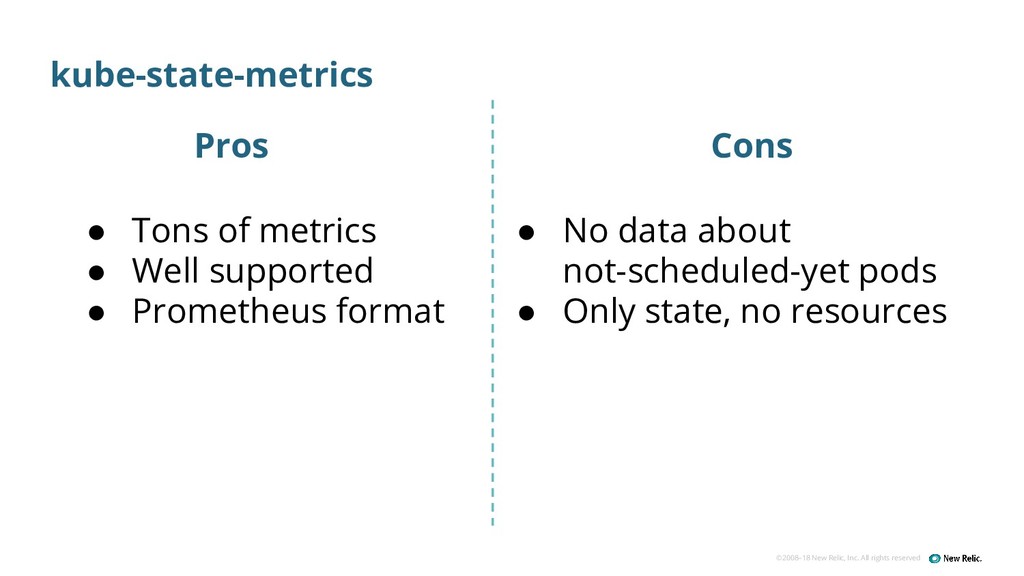
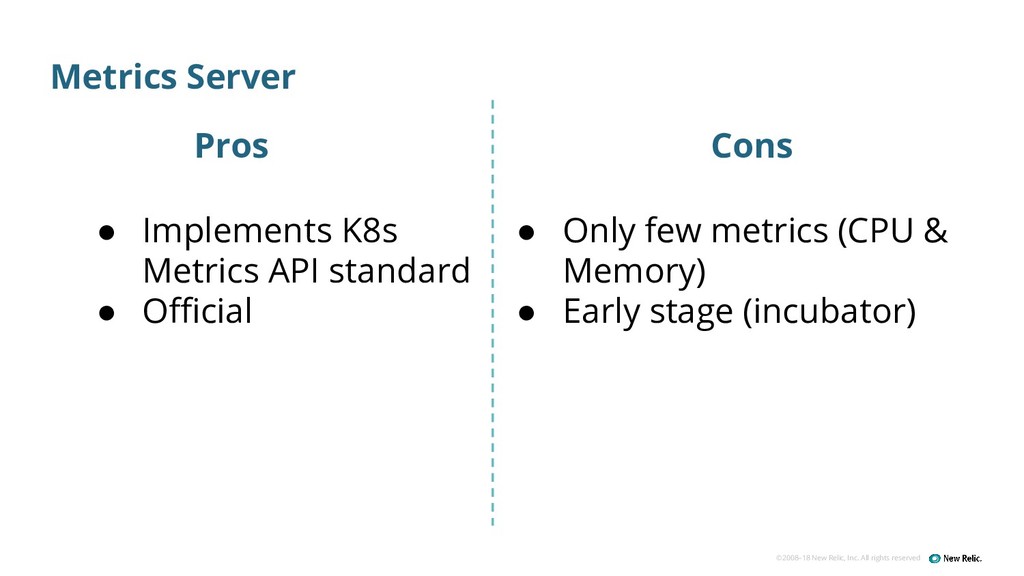
- No third party - Up to date - Bottleneck - Missing critical data. Ex: Pods resources Cons kube-state- metrics - Tons of metrics - Well supported - Prometheus format - No data about not-scheduled-yet pods - Only state, no resources Heapster - Tons of metrics - Different backends (sinks) - Exposes Prometheus format - Plug&Play - No Prometheus backend (sink) - Resource consumption - Some sinks are not maintained - Deprecated (k8s >=v1.13.0) Metrics Server - Implements K8s Metrics API standard - Official - Only few metrics (CPU & Memory) - Early stage (incubator) Kubelet + Cadvisor - No third party - All data regarding the node, pods and containers resources - Distributed by nature - Only data about nodes, pods and containers - Some data inconsistency between the API and Kubelet
Deployment of pods fetching metrics from any of the sources. • Daemonset fetching metrics the Kubelet + Cadvisor (node) • Combination of both • Others?