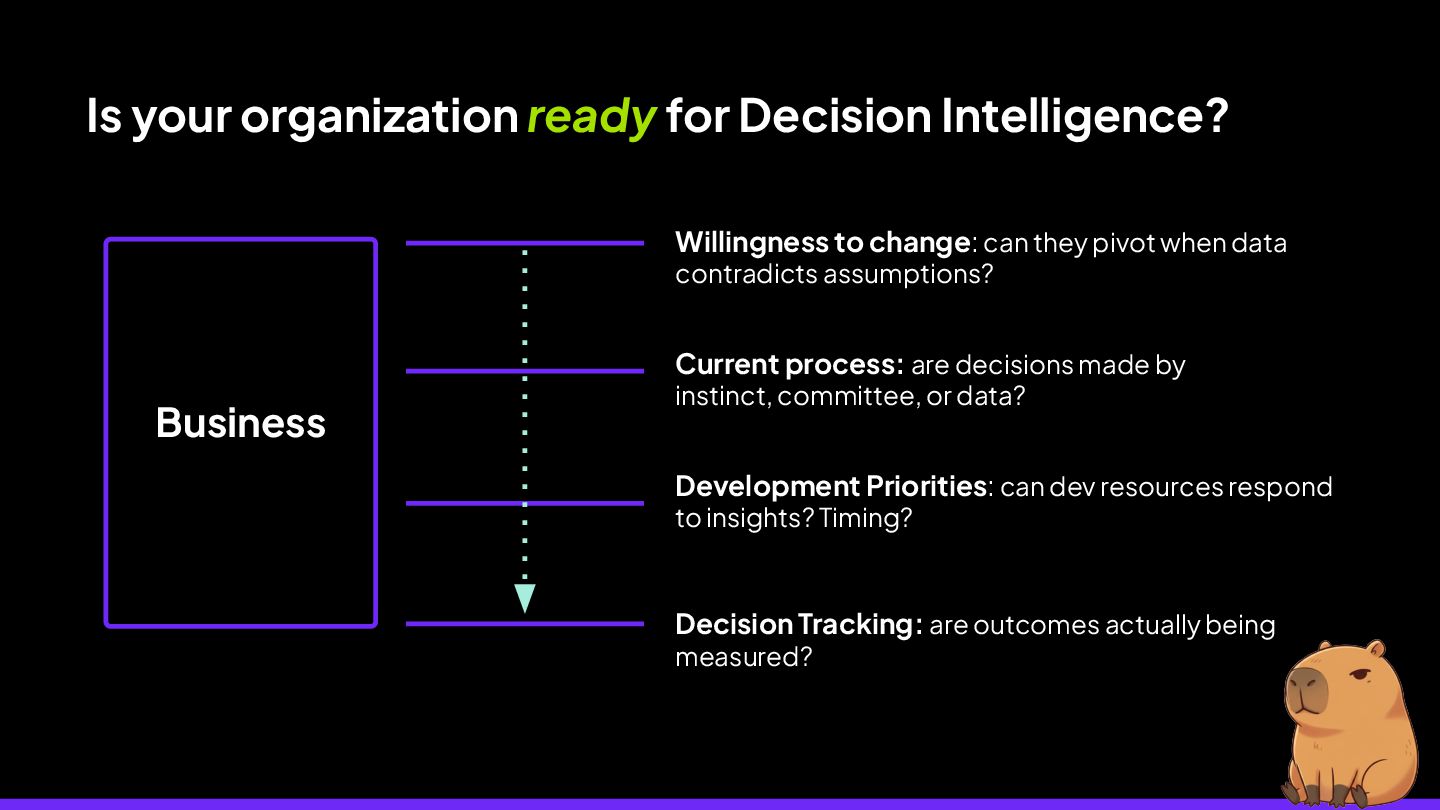
change: can they pivot when data contradicts assumptions? Current process: are decisions made by instinct, committee, or data? Decision Tracking: are outcomes actually being measured? Development Priorities: can dev resources respond to insights? Timing?
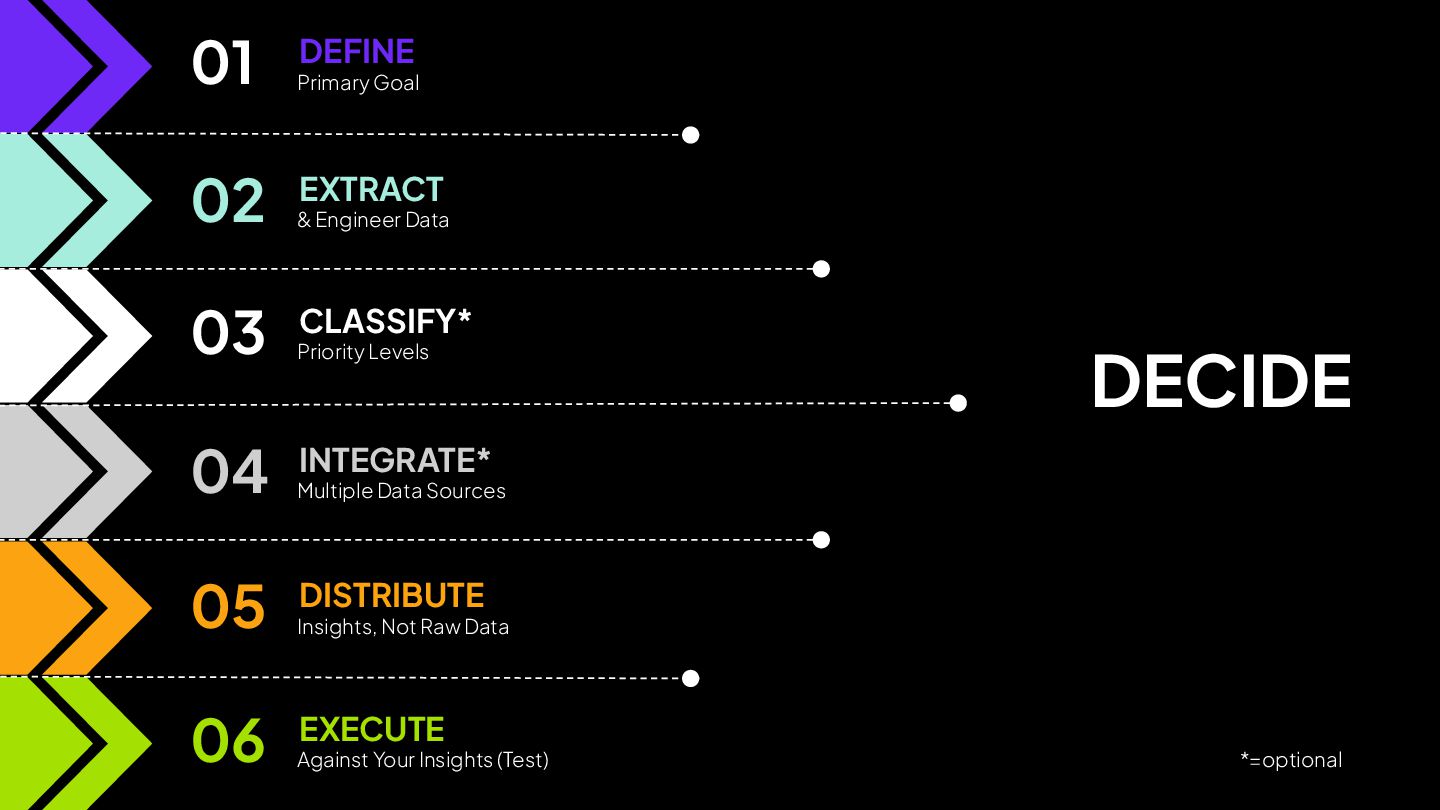
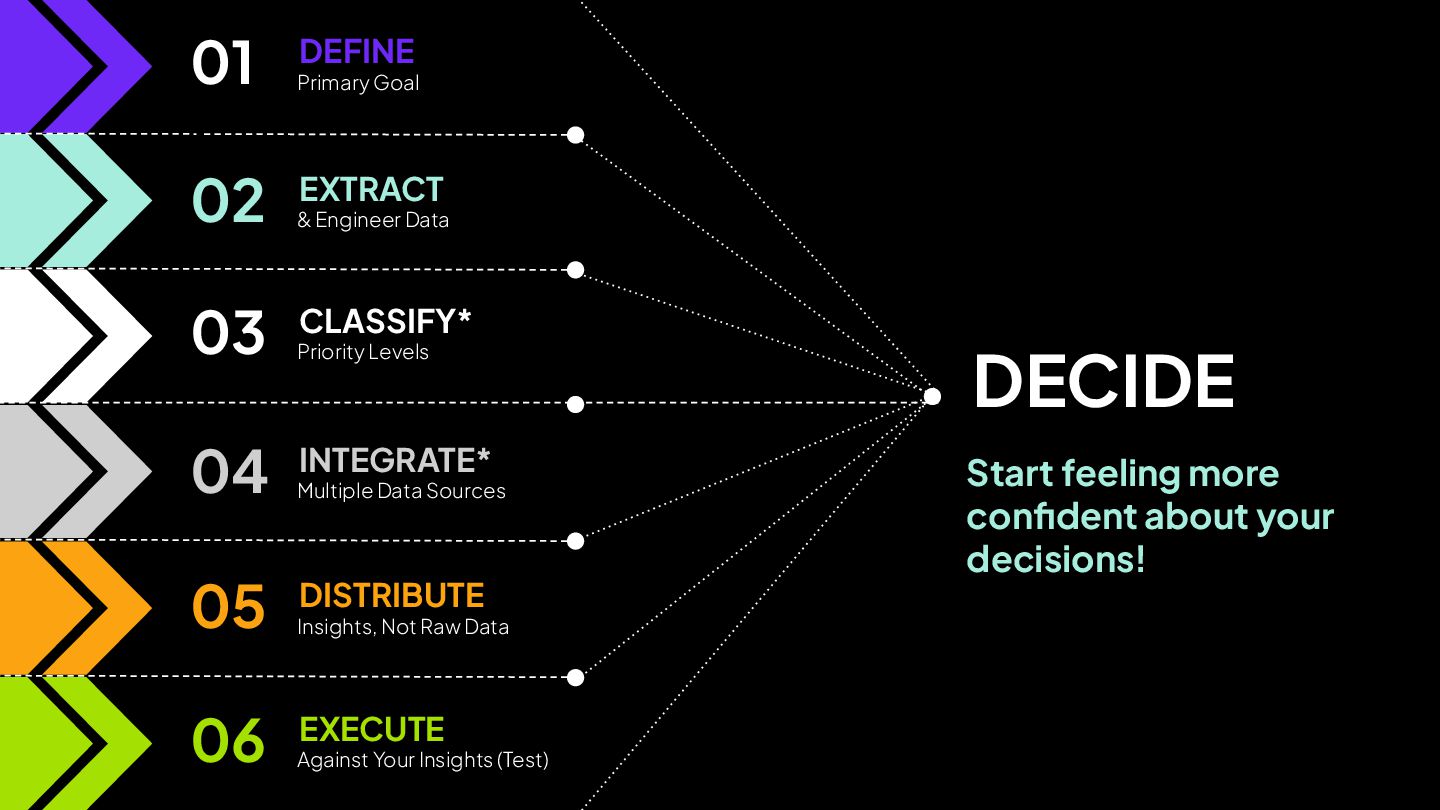
Data 03 CLASSIFY* Priority Levels 04 INTEGRATE* Multiple Data Sources 05 DISTRIBUTE Insights, Not Raw Data 06 EXECUTE Against Your Insights (Test) *=optional
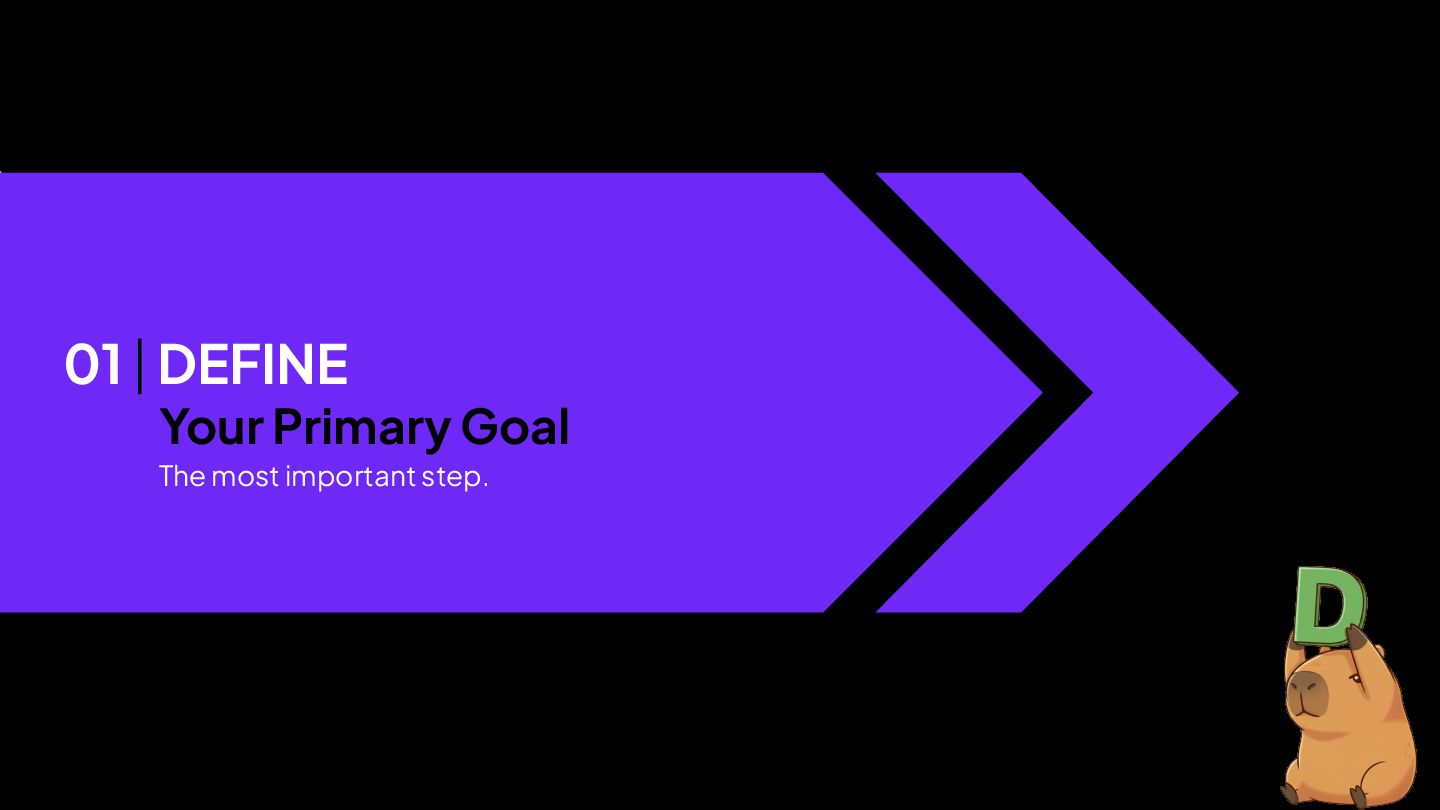
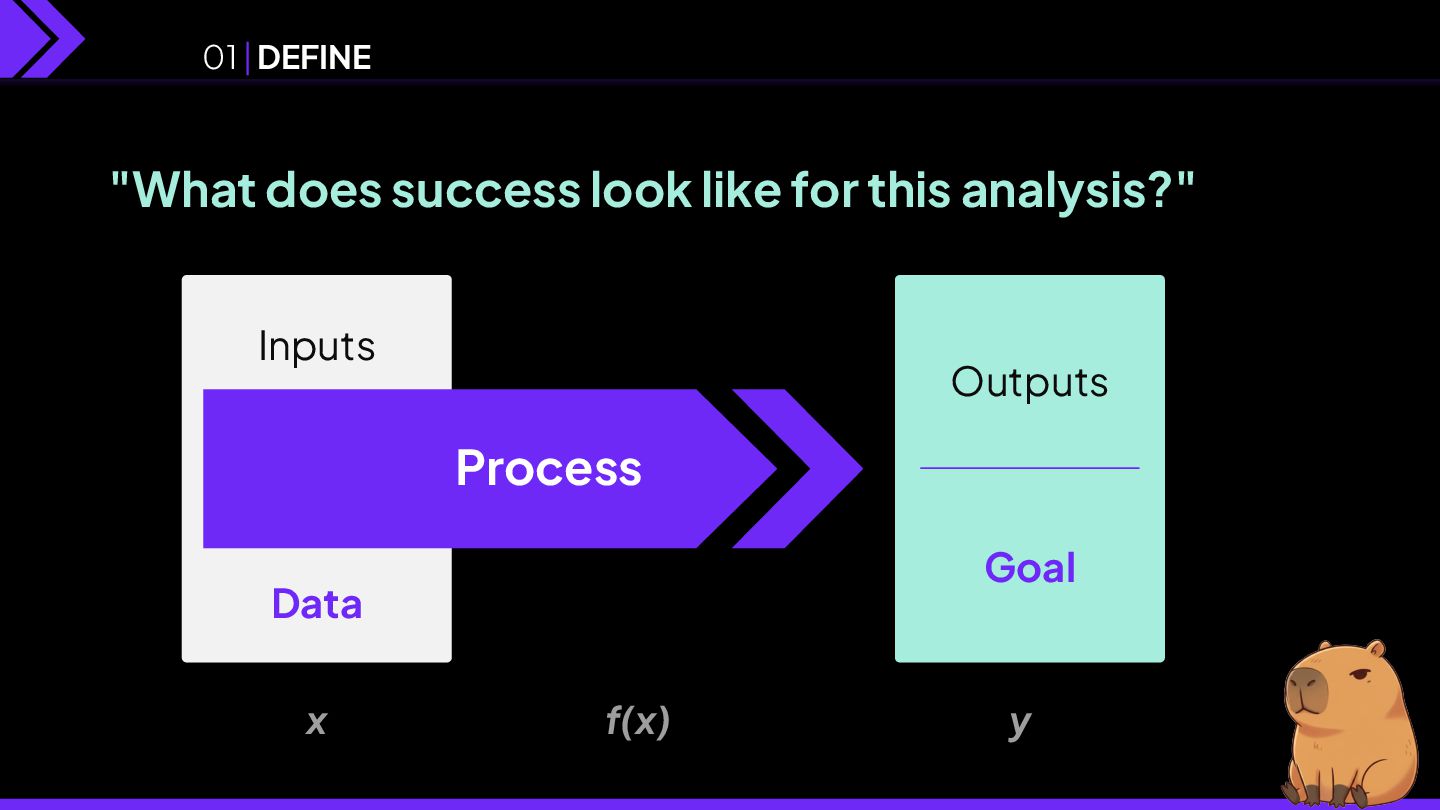
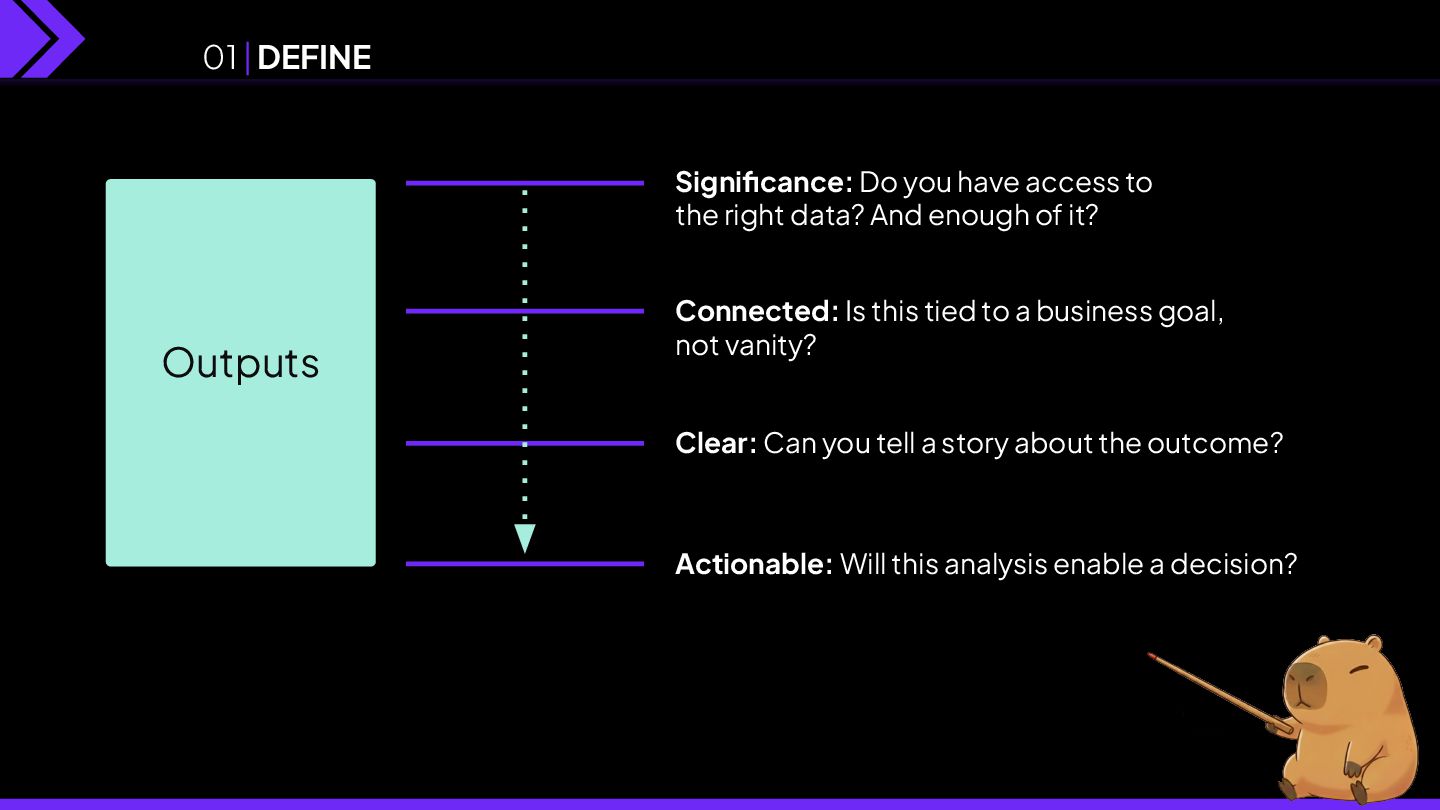
And enough of it? Connected: Is this tied to a business goal, not vanity? Clear: Can you tell a story about the outcome? Actionable: Will this analysis enable a decision? 01 | DEFINE
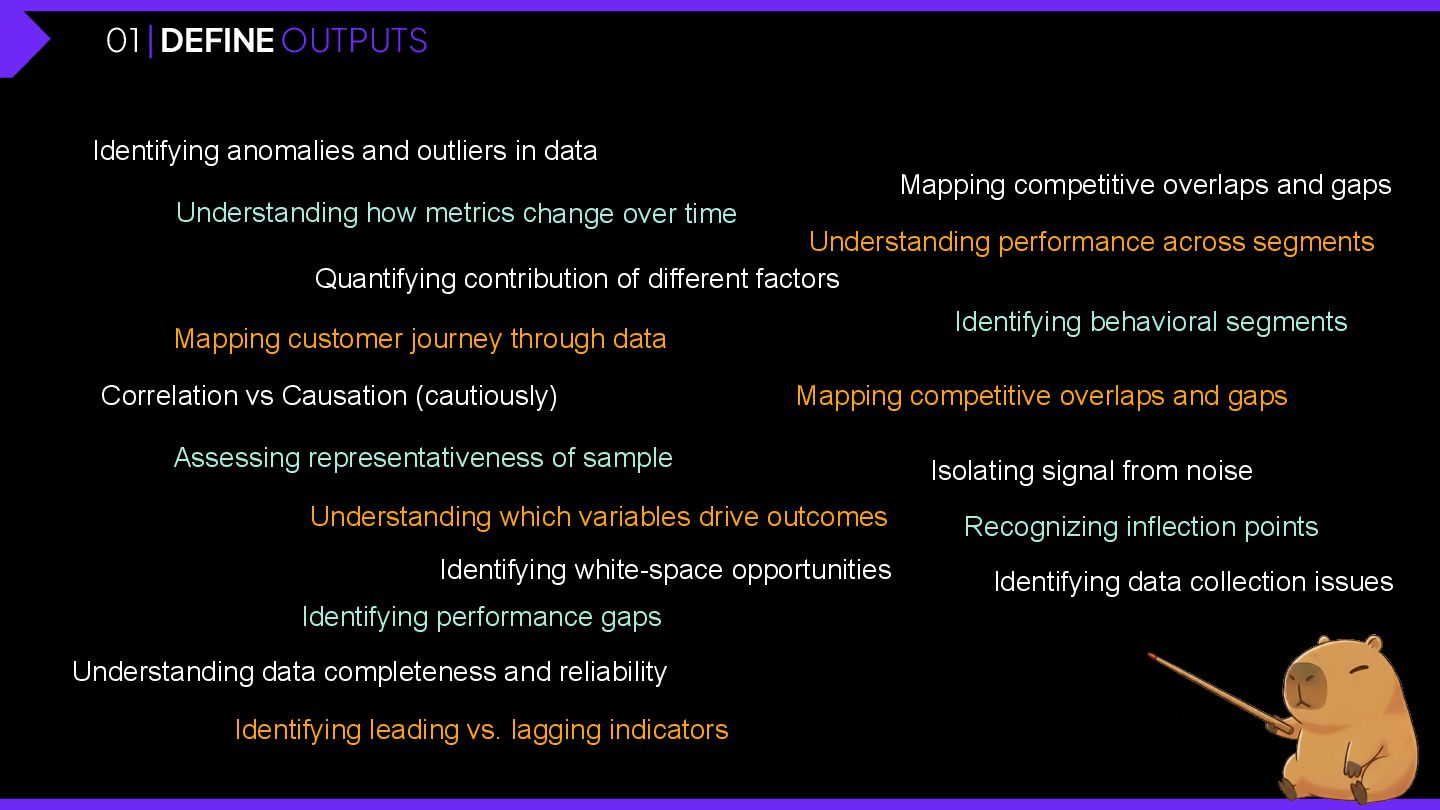
Understanding performance across segments Identifying performance gaps Isolating signal from noise Quantifying contribution of different factors Identifying white-space opportunities Mapping competitive overlaps and gaps Understanding how metrics change over time Identifying leading vs. lagging indicators Mapping customer journey through data Identifying behavioral segments Understanding which variables drive outcomes • Mapping competitive overlaps and gaps Understanding data completeness and reliability Assessing representativeness of sample Recognizing inflection points • Identifying data collection issues 01 | DEFINE OUTPUTS
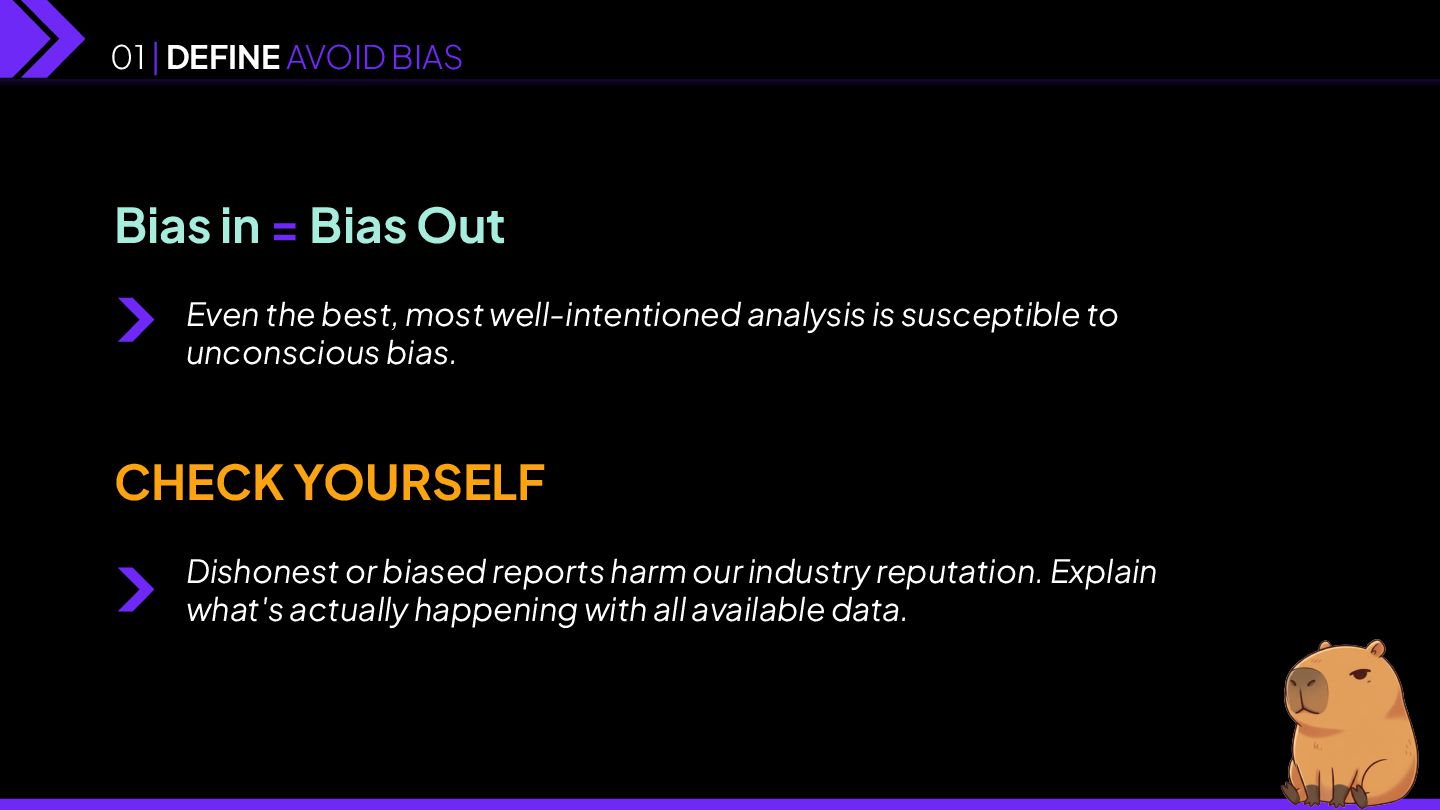
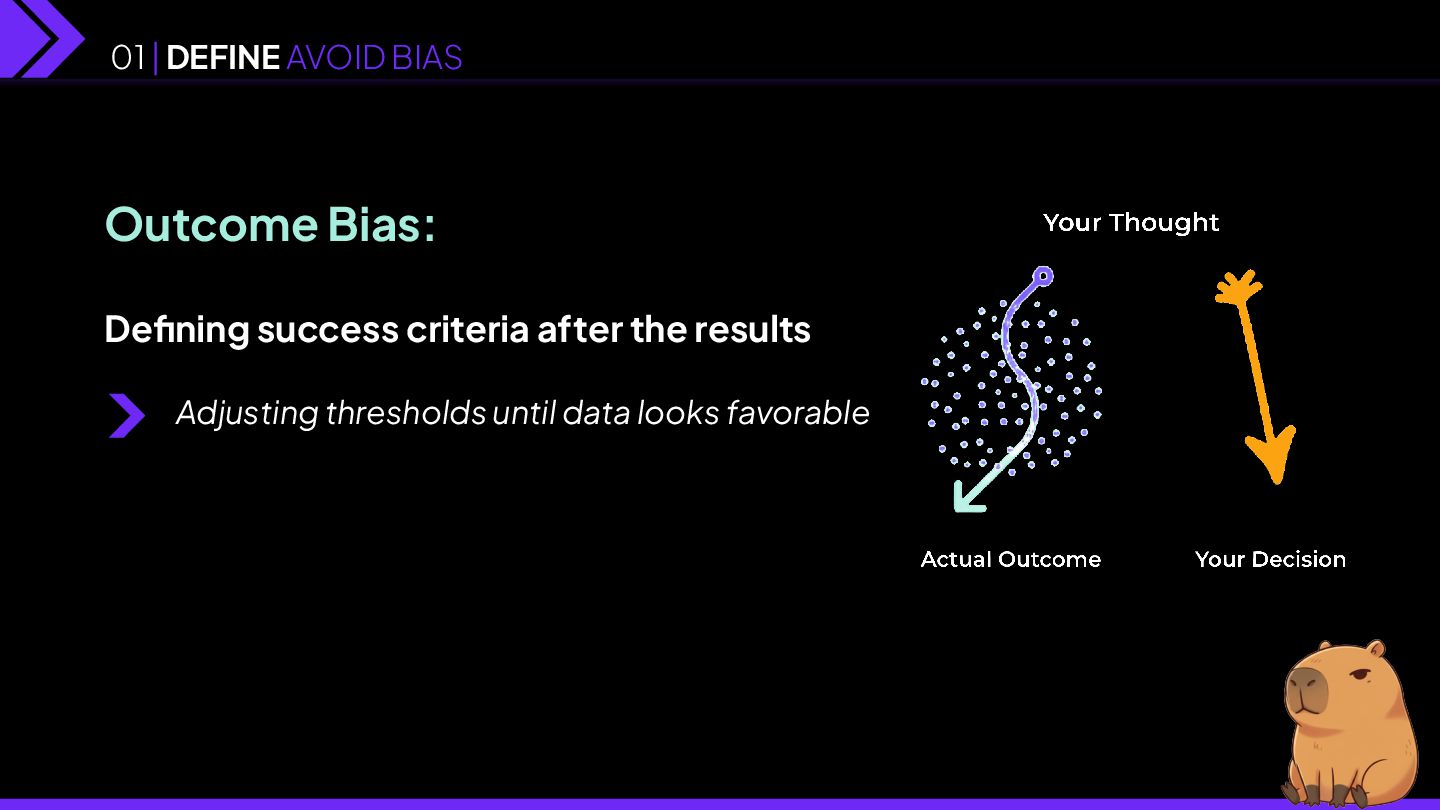
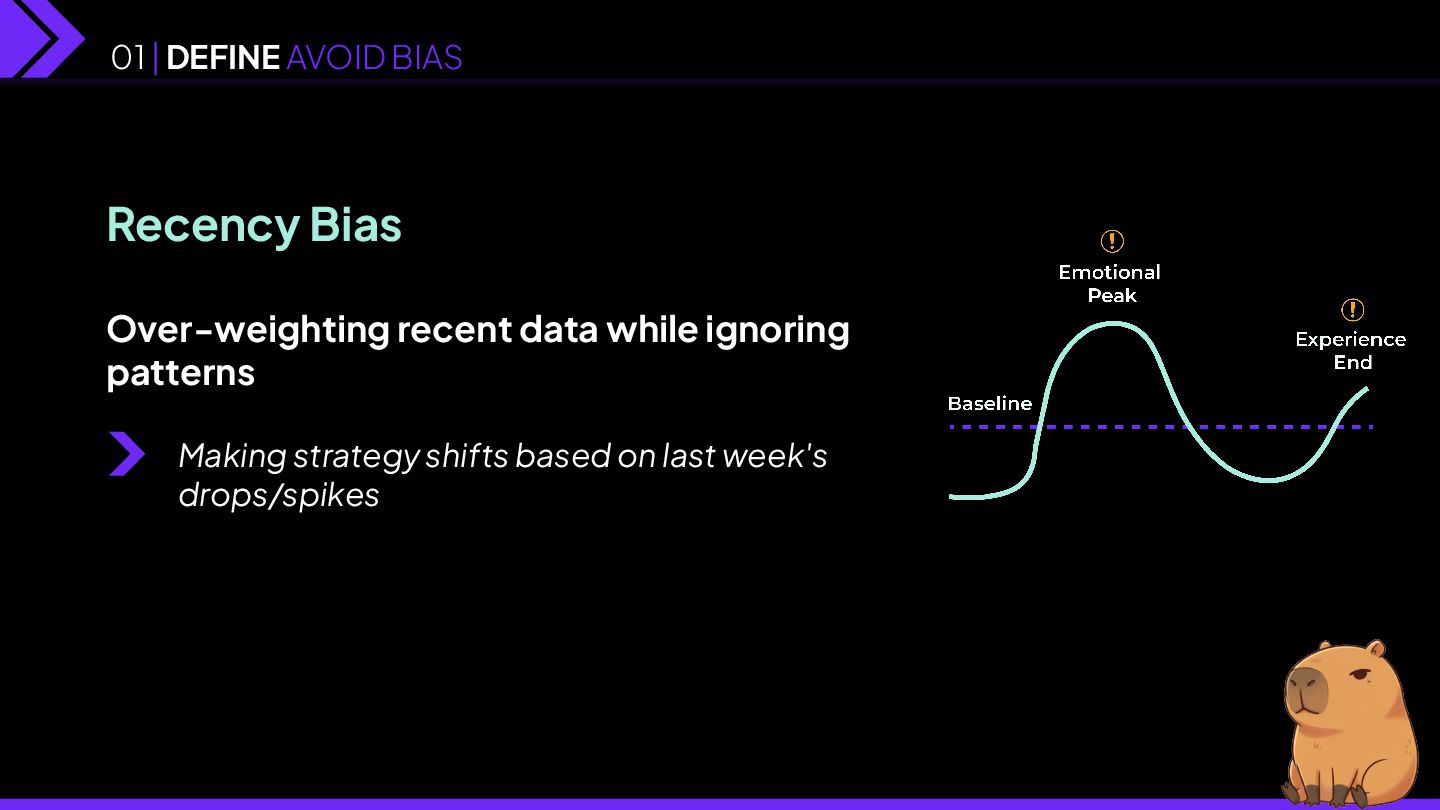
analysis is susceptible to unconscious bias. CHECK YOURSELF Dishonest or biased reports harm our industry reputation. Explain what's actually happening with all available data. 01 | DEFINE AVOID BIAS
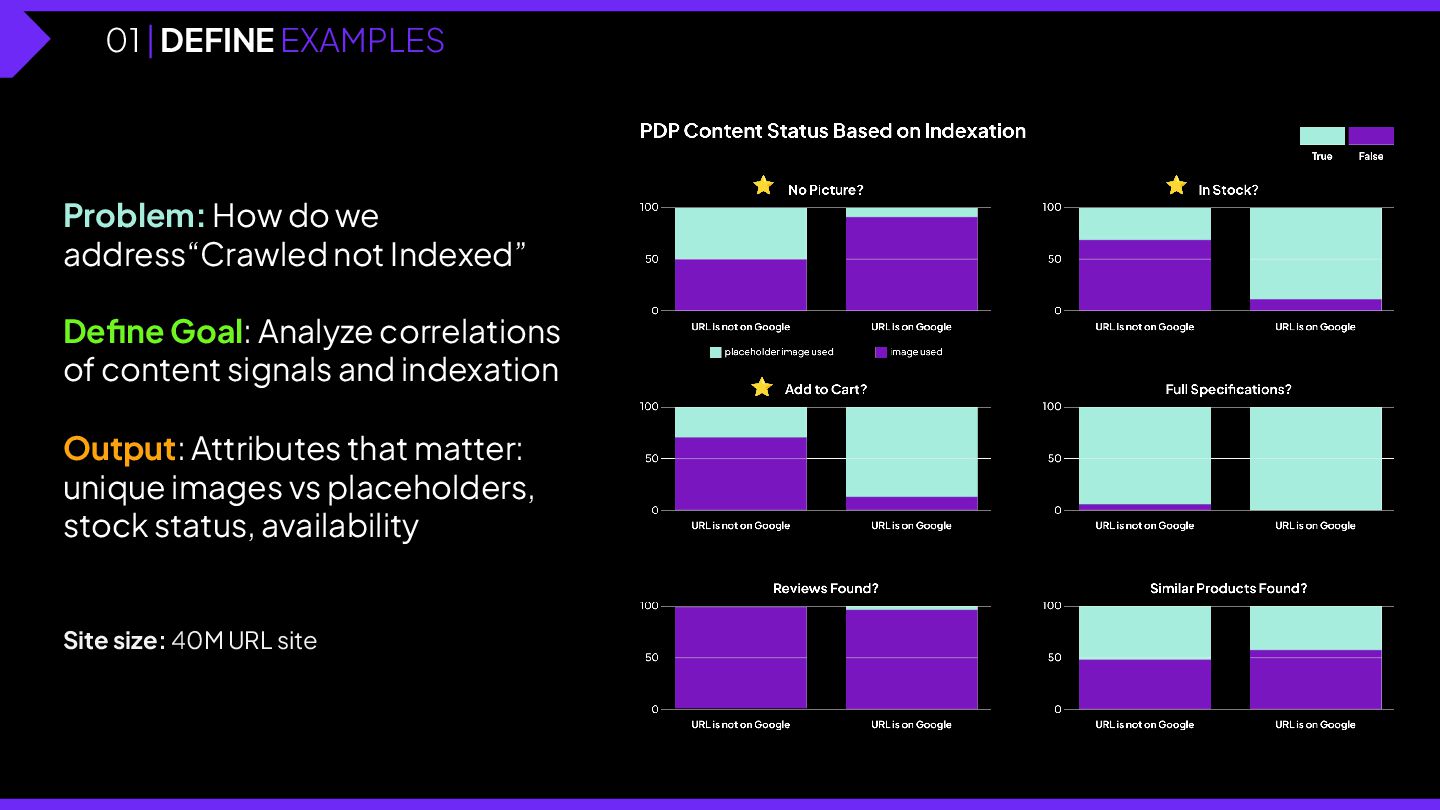
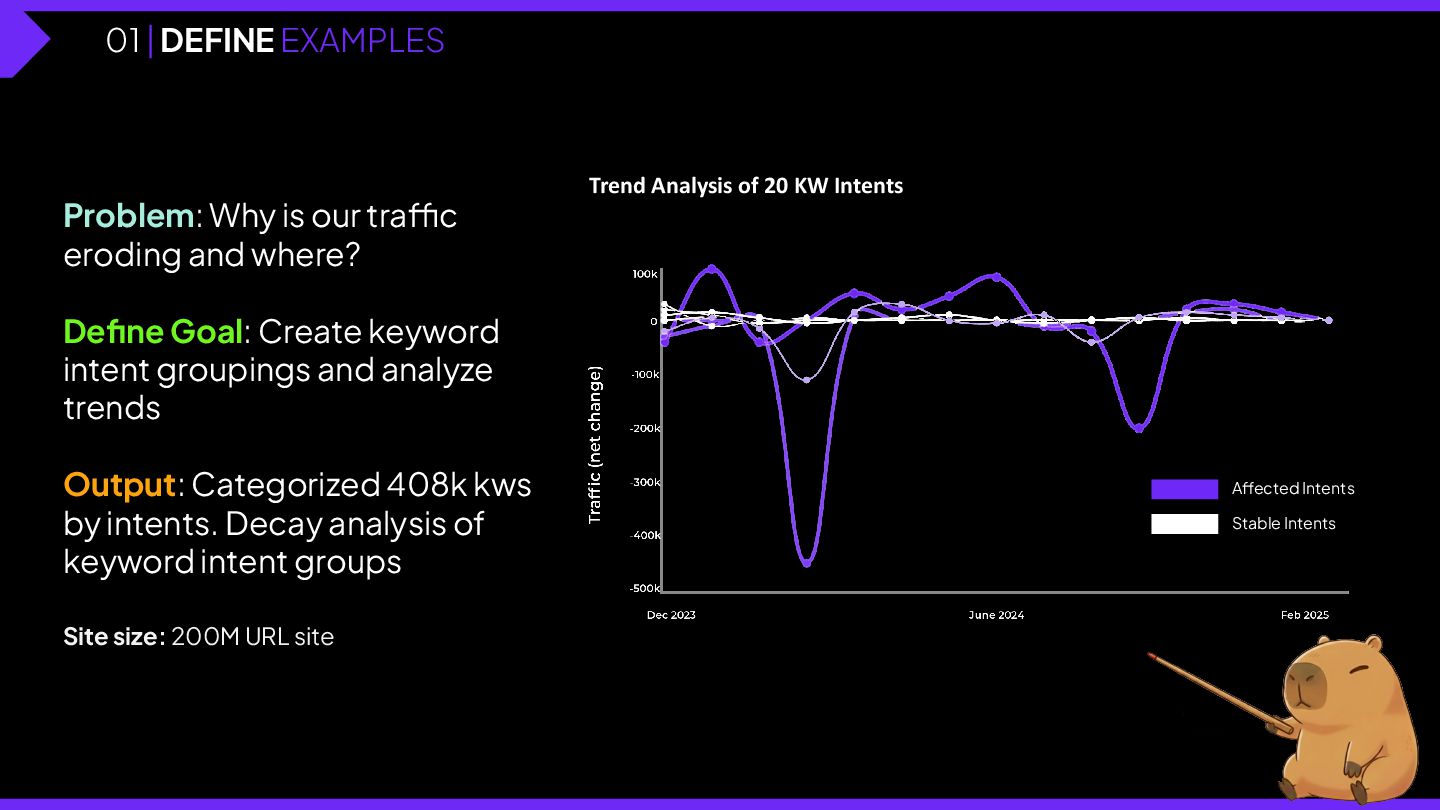
correlations of content signals and indexation Output: Attributes that matter: unique images vs placeholders, stock status, availability Site size: 40M URL site ⭐ ⭐ ⭐ 01 | DEFINE EXAMPLES
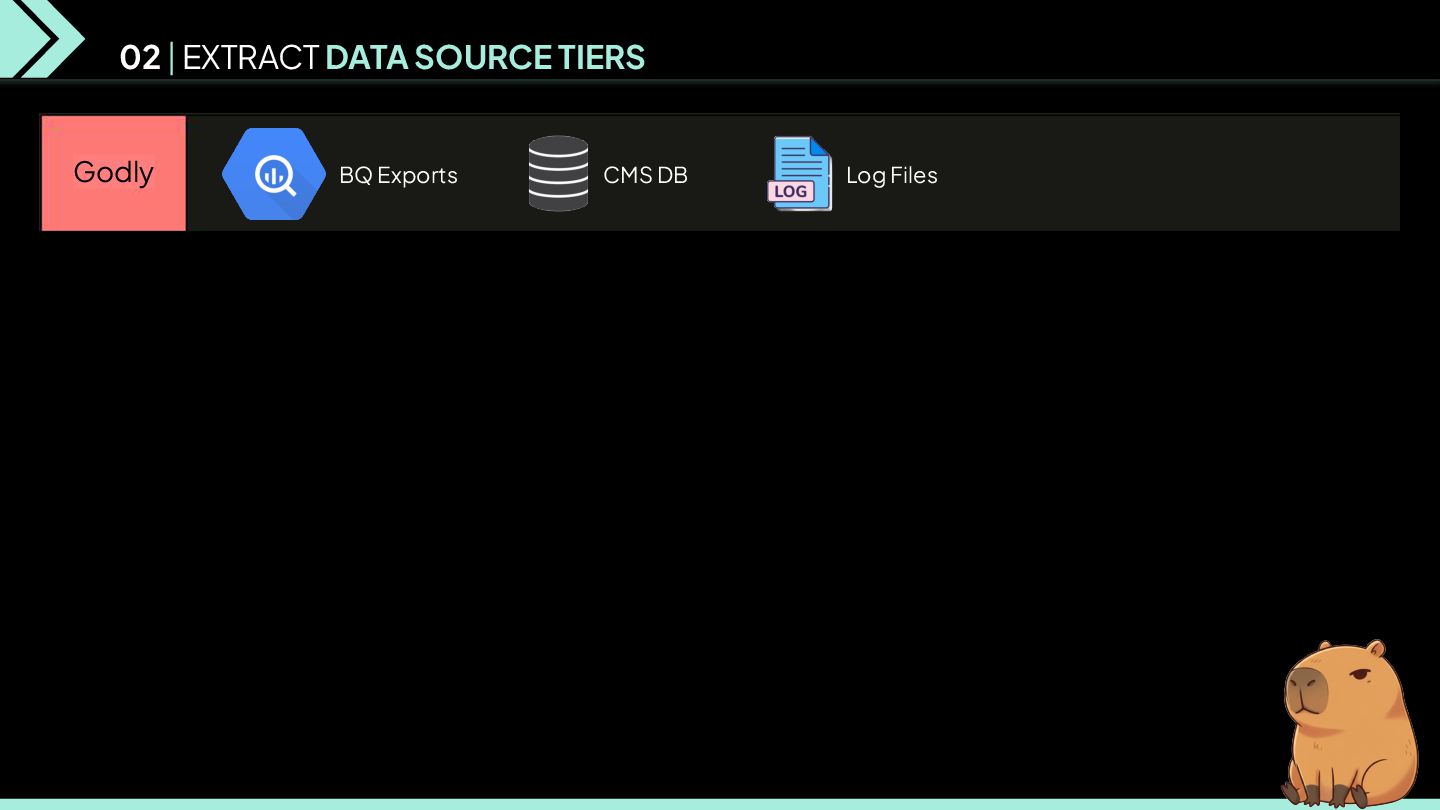
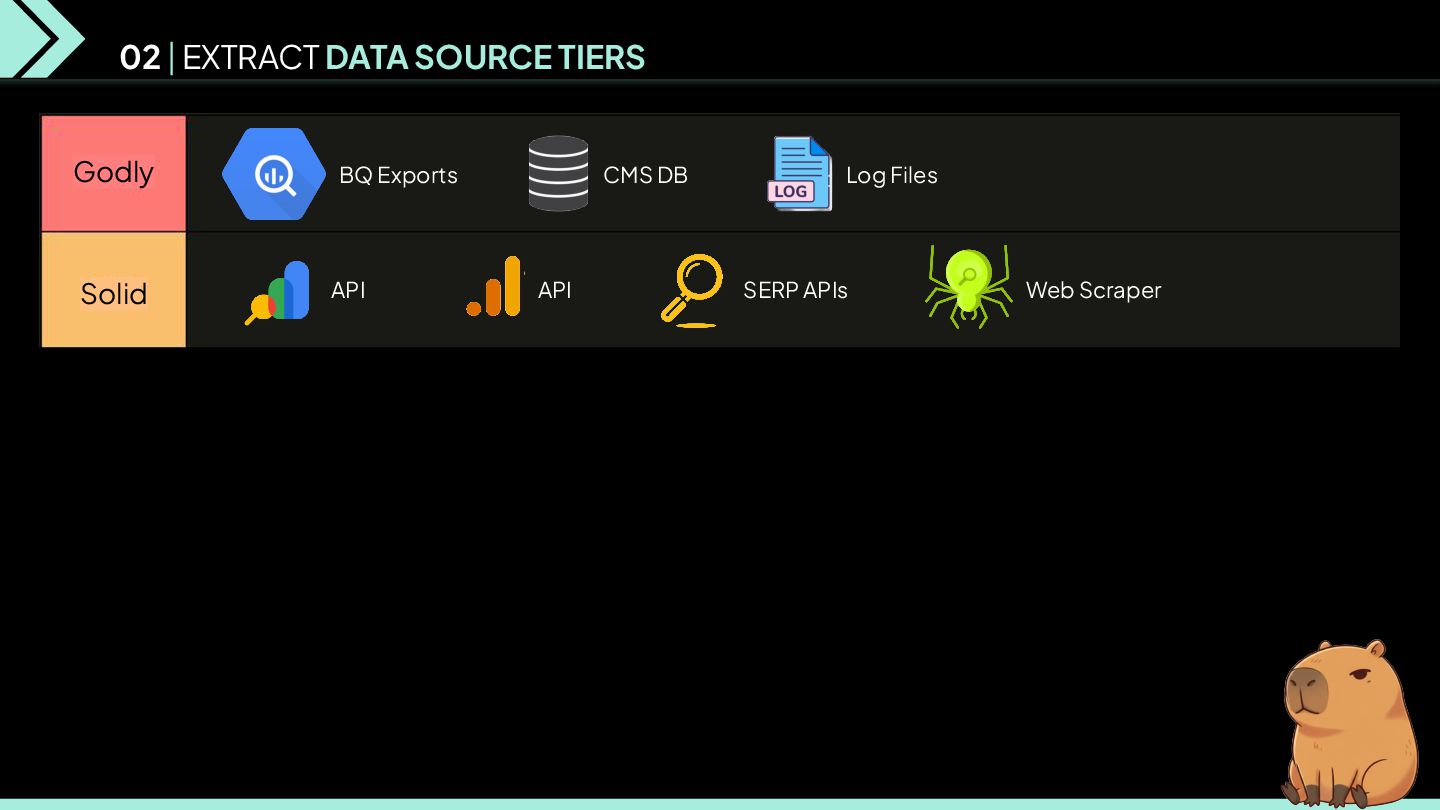
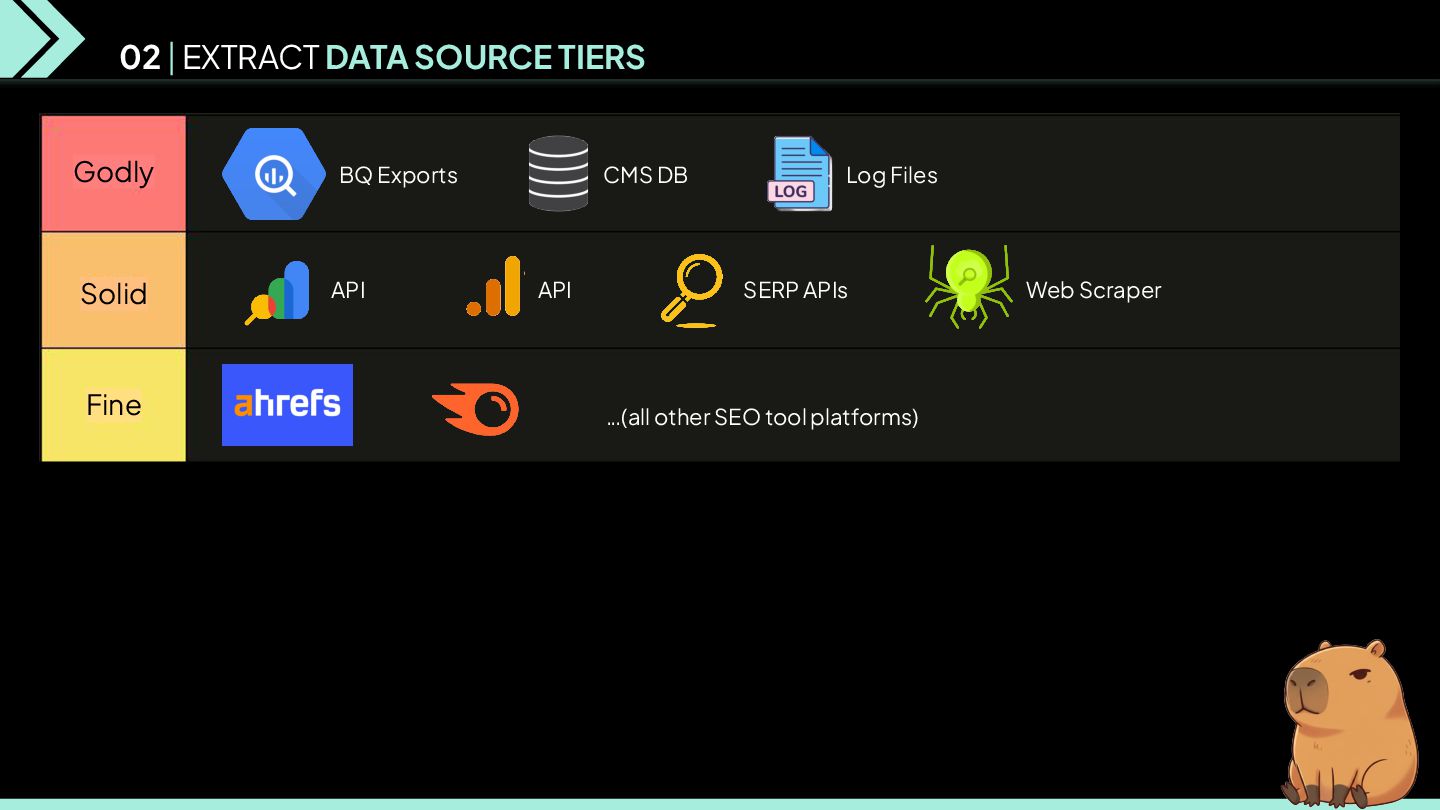
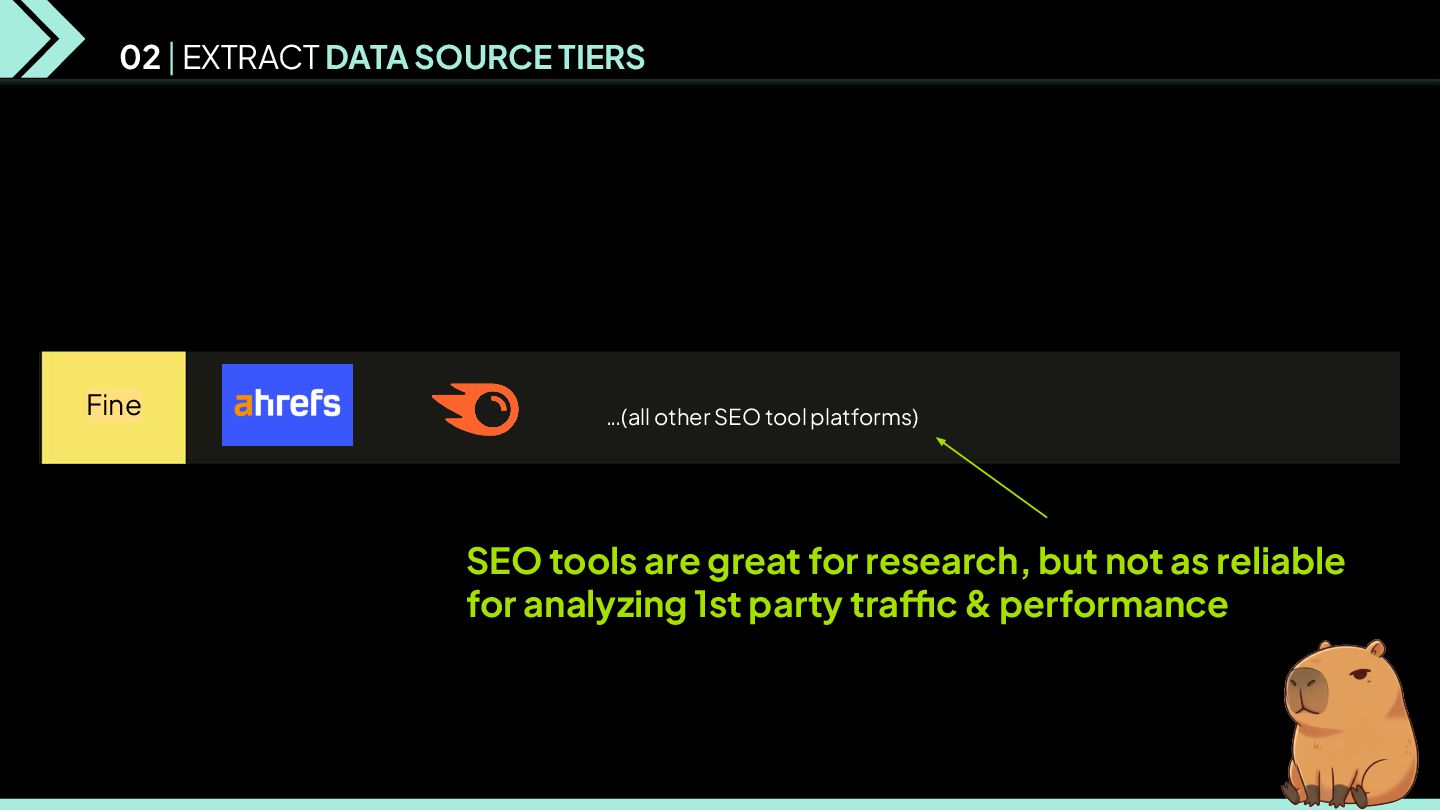
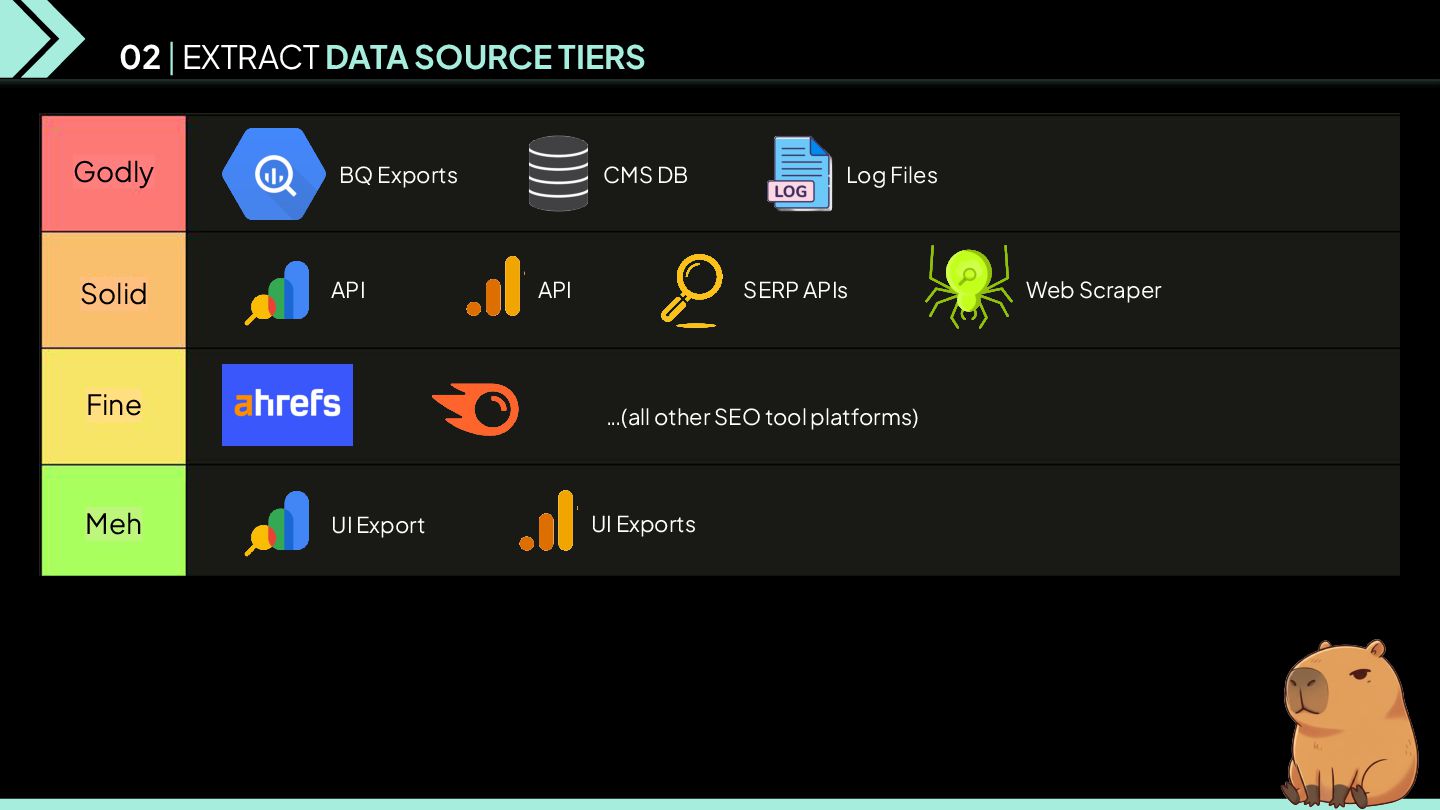
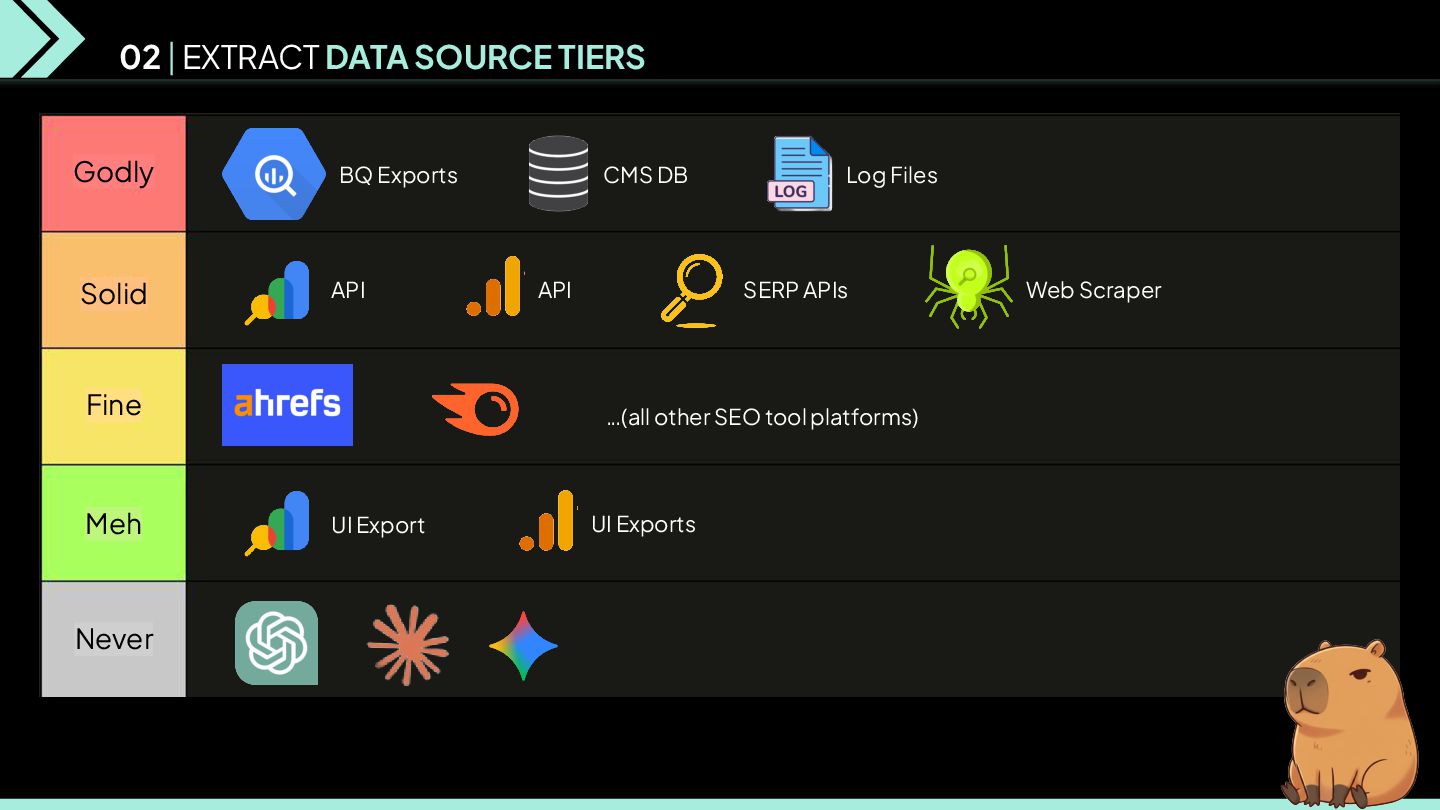
DB UI Export UI Exports Log Files SERP APIs Web Scraper …(all other SEO tool platforms) SEO tools are great for research, but not as reliable for analyzing 1st party traffic & performance 02 | EXTRACT DATA SOURCE TIERS
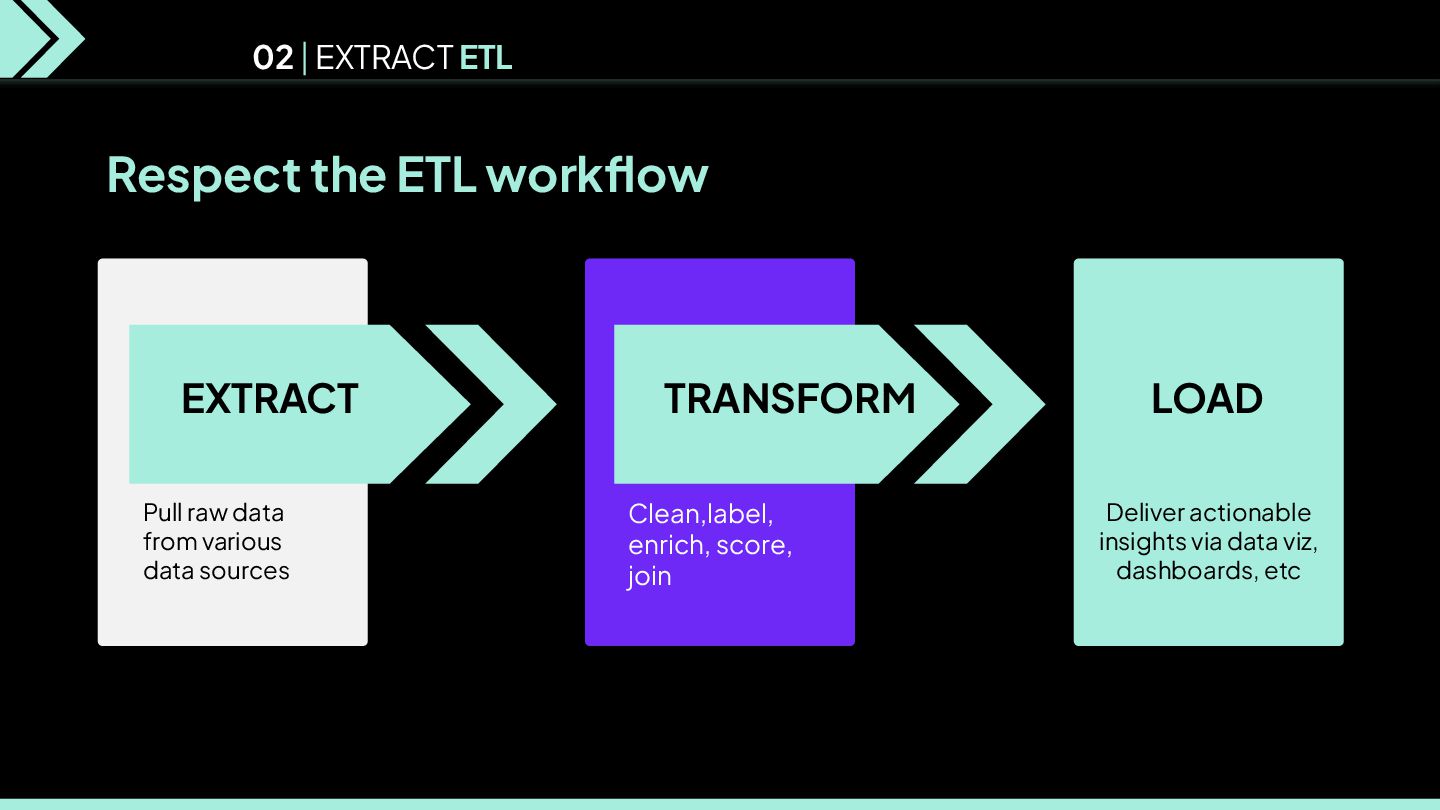
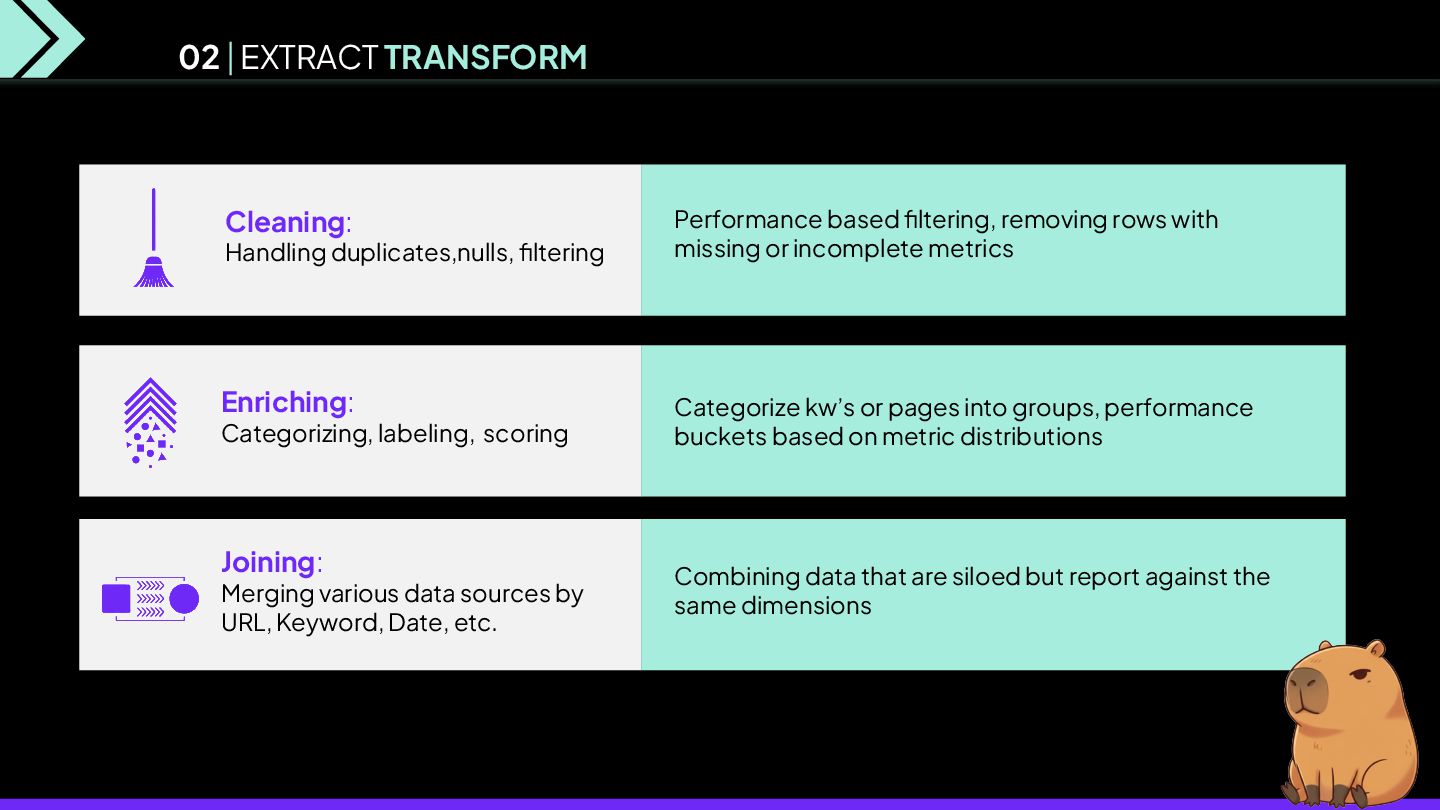
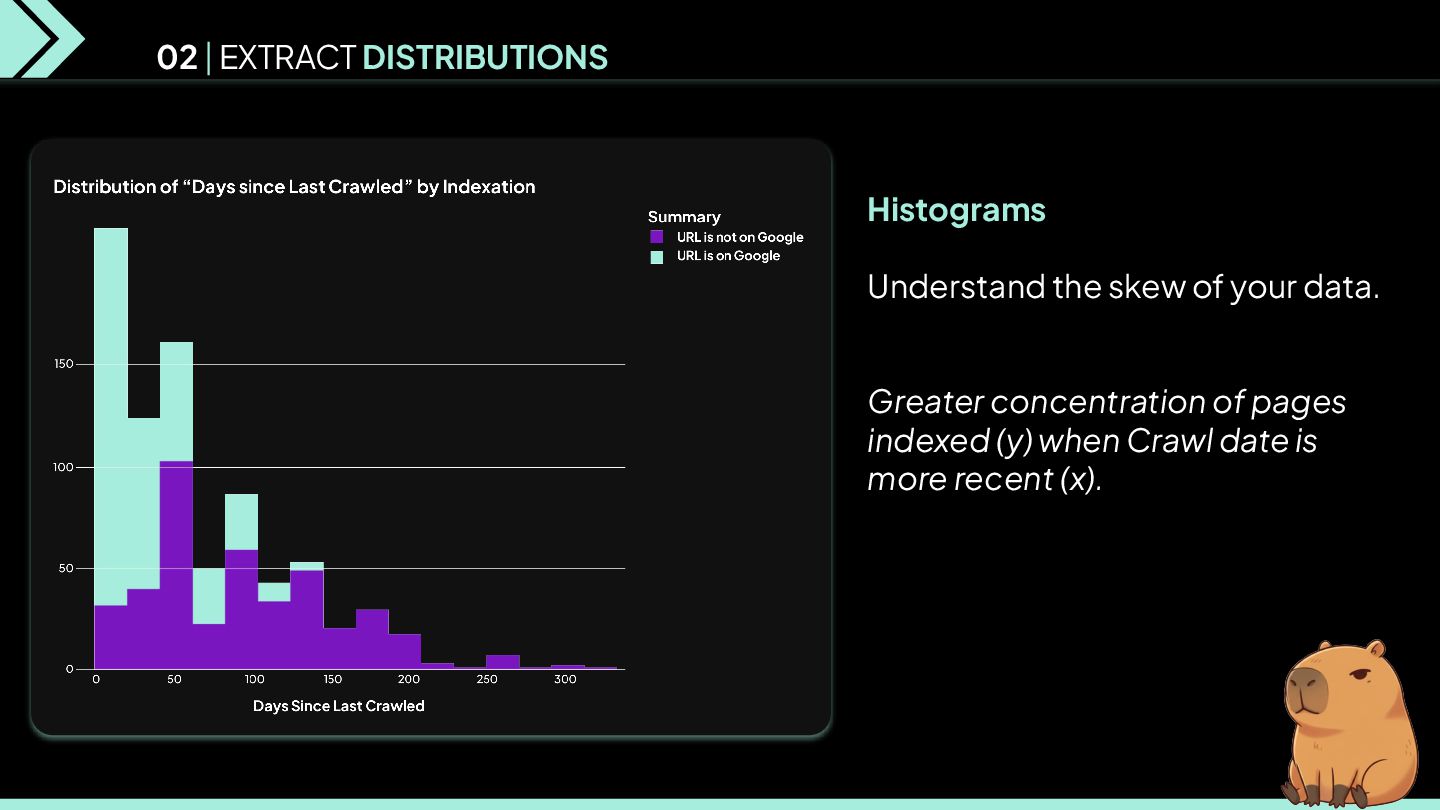
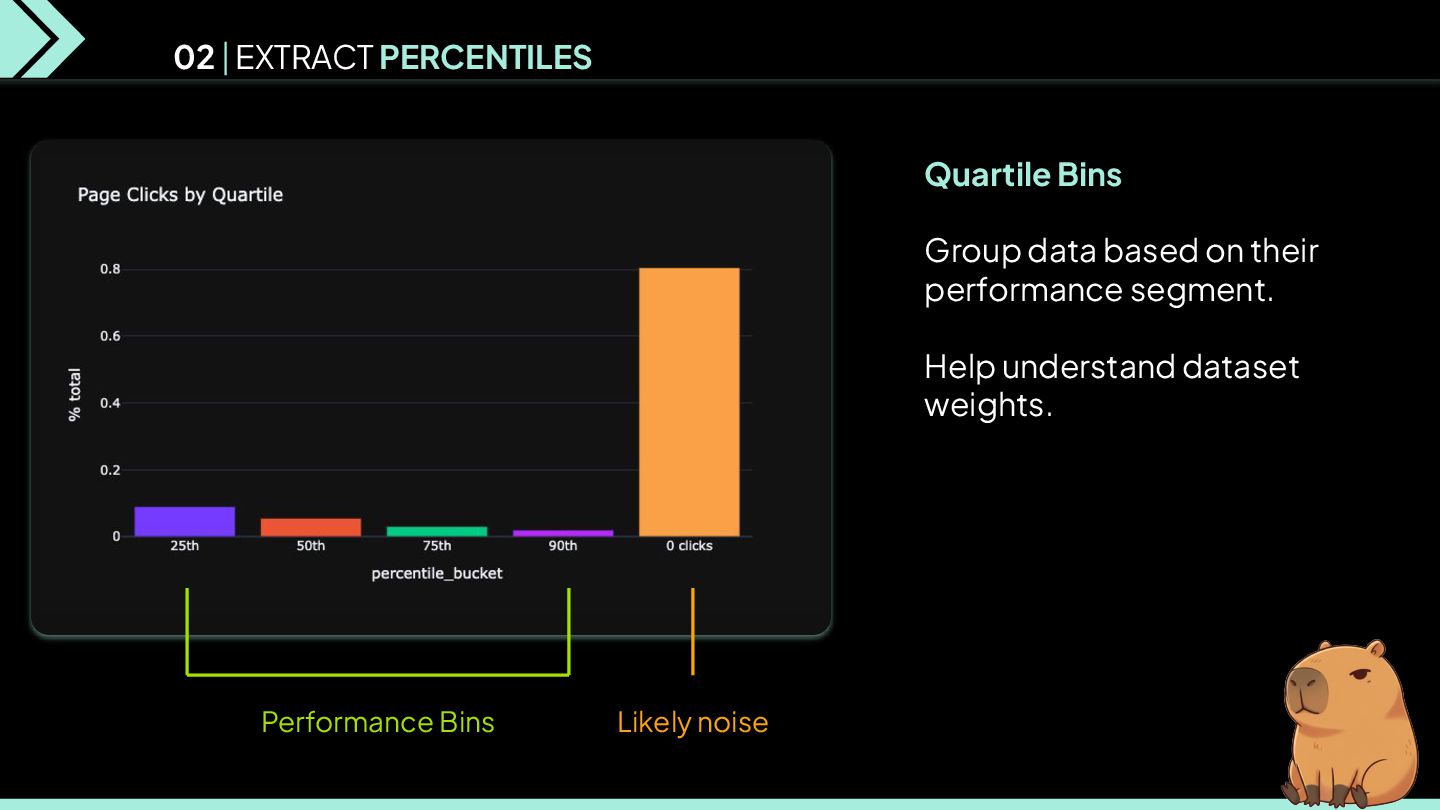
various data sources by URL, Keyword, Date, etc. Performance based filtering, removing rows with missing or incomplete metrics Categorize kw’s or pages into groups, performance buckets based on metric distributions Combining data that are siloed but report against the same dimensions 02 | EXTRACT TRANSFORM
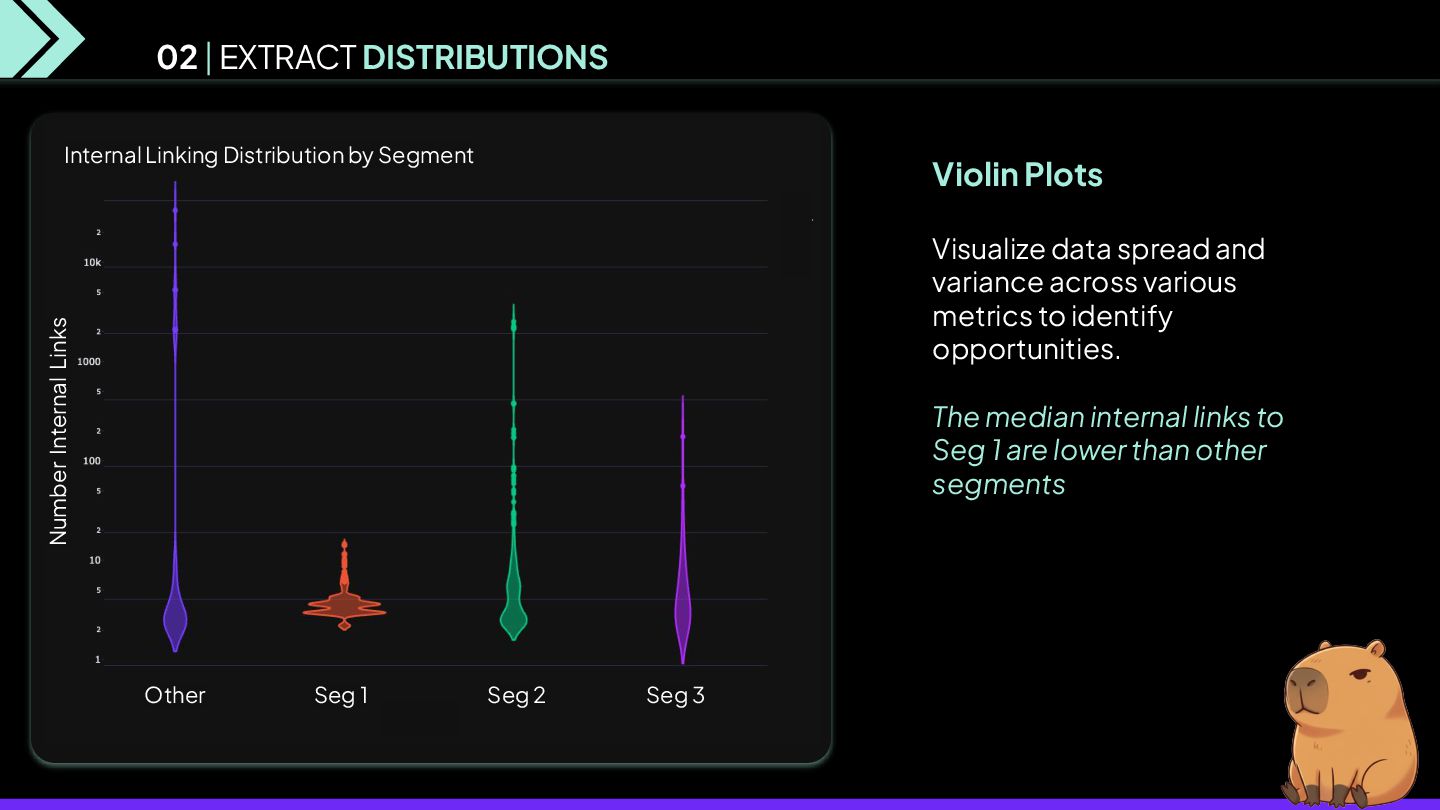
to identify opportunities. The median internal links to Seg 1 are lower than other segments 02 | EXTRACT DISTRIBUTIONS Other Seg 1 Seg 2 Seg 3 Number Internal Links Internal Linking Distribution by Segment
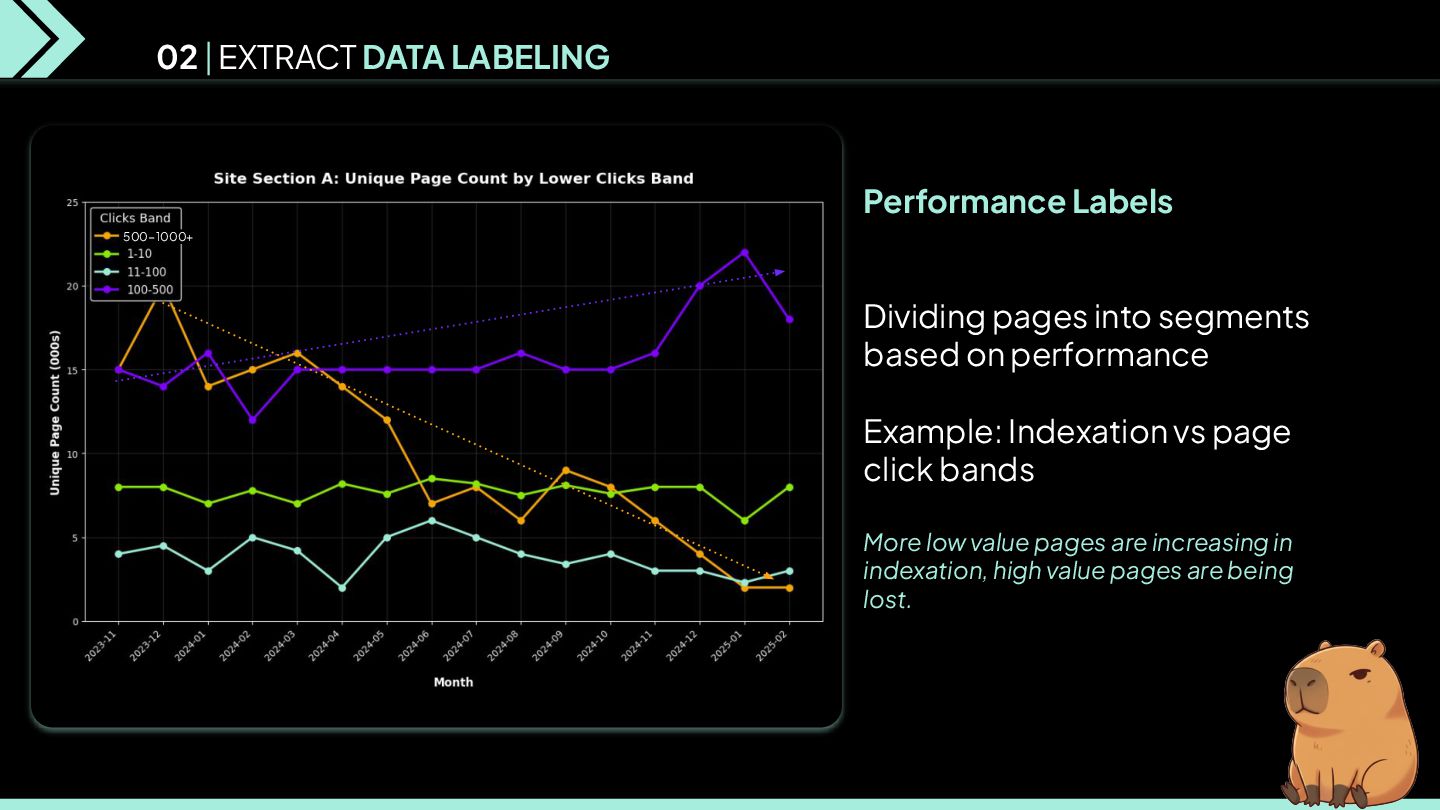
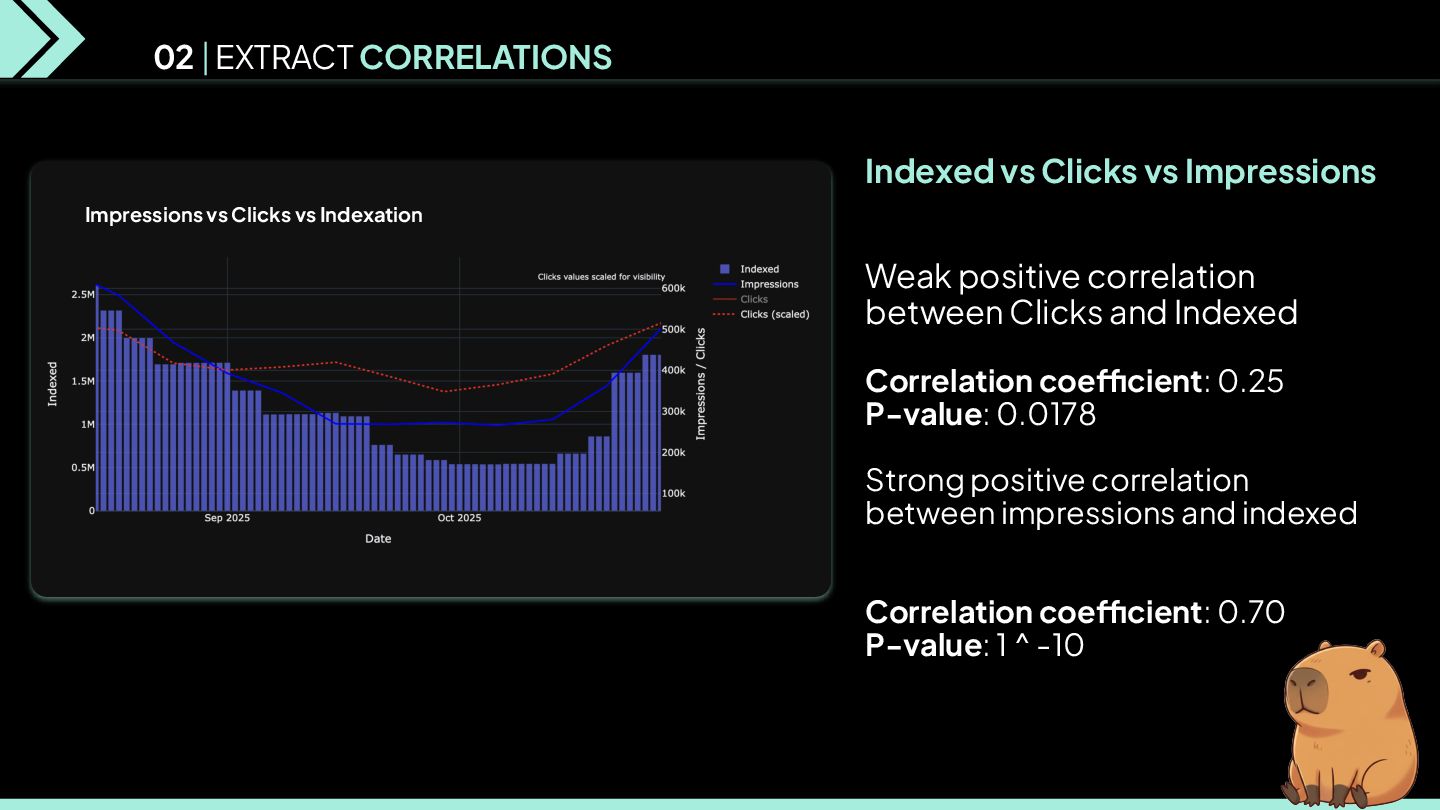
Indexation vs page click bands More low value pages are increasing in indexation, high value pages are being lost. 02 | EXTRACT DATA LABELING 500−1000+
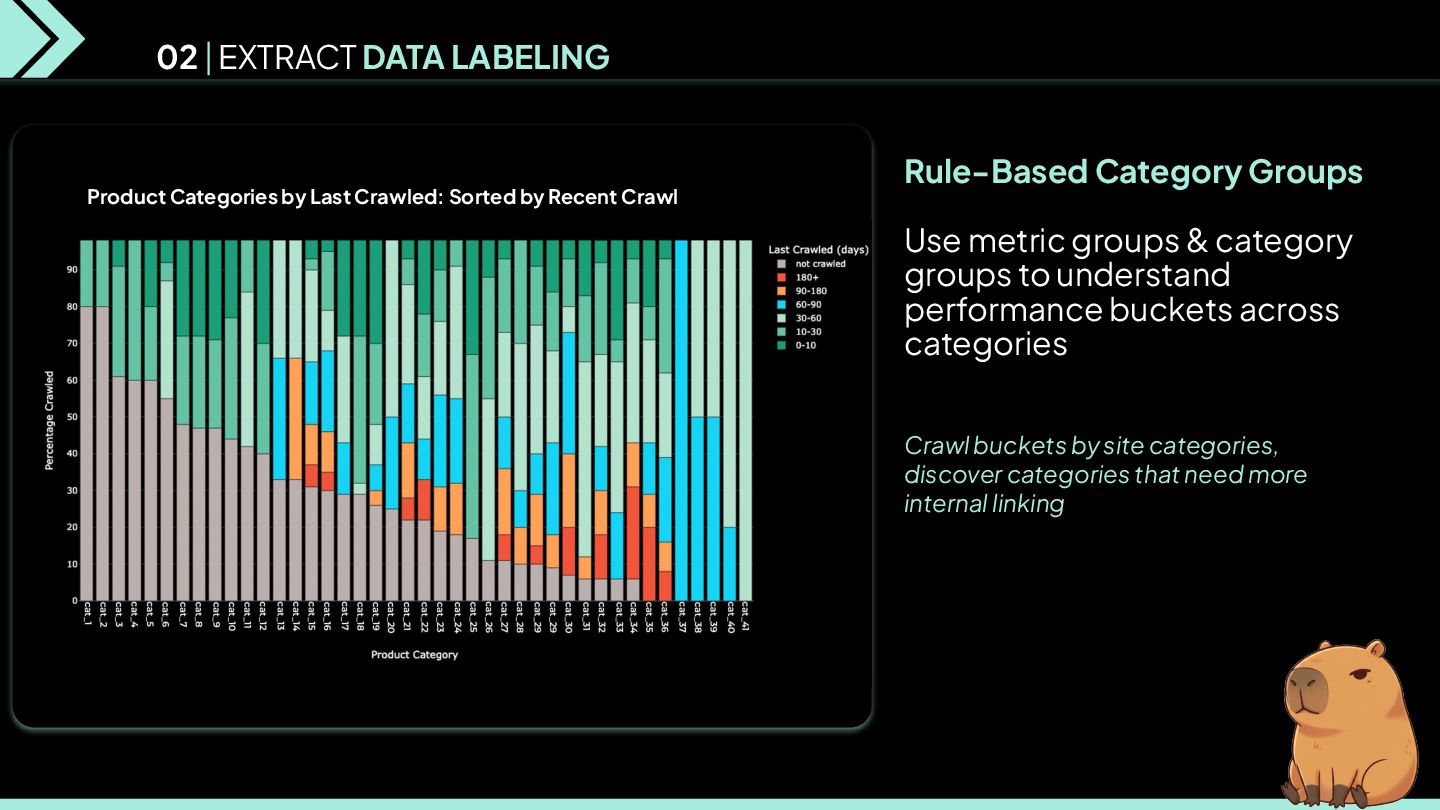
understand performance buckets across categories Crawl buckets by site categories, discover categories that need more internal linking 02 | EXTRACT DATA LABELING Product Categories by Last Crawled: Sorted by Recent Crawl
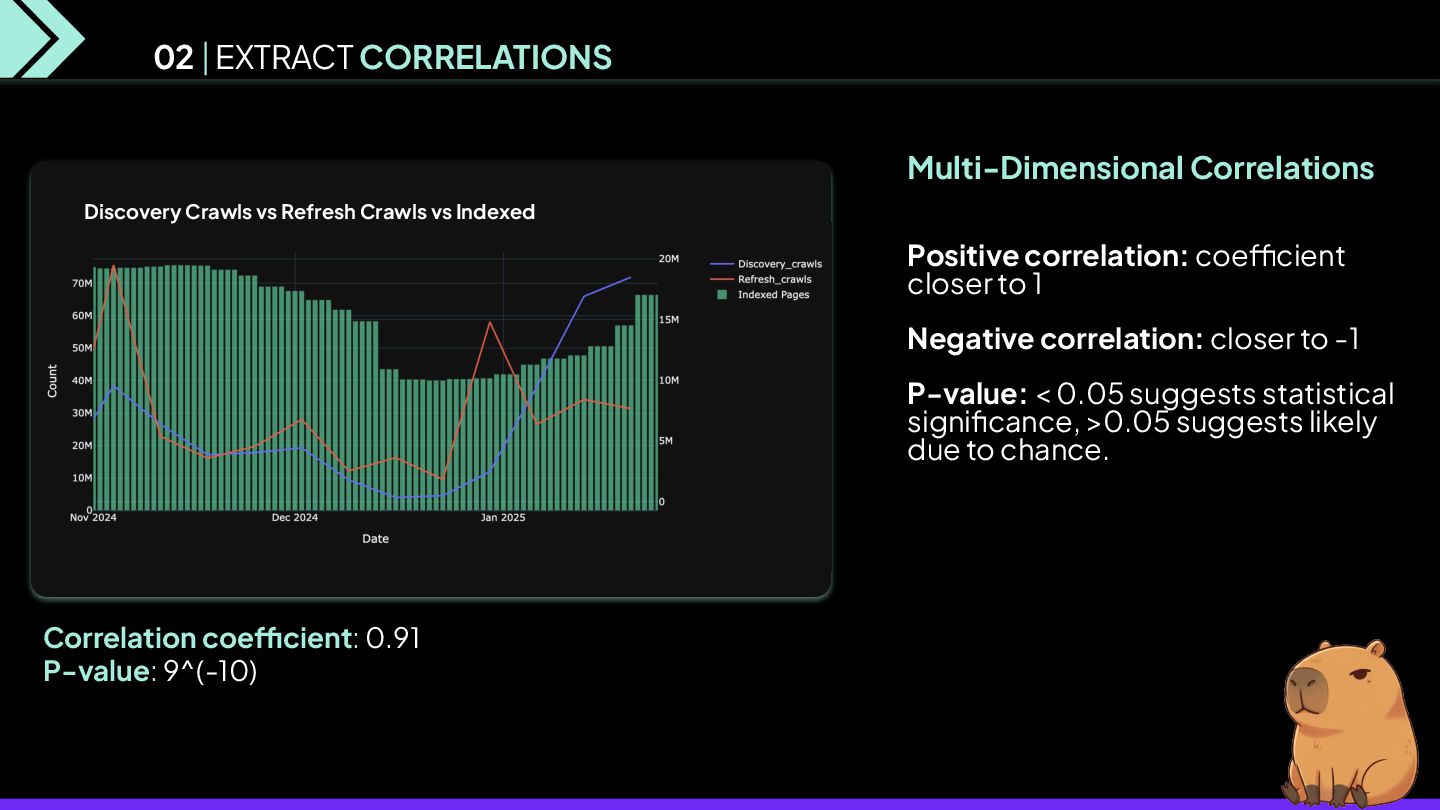
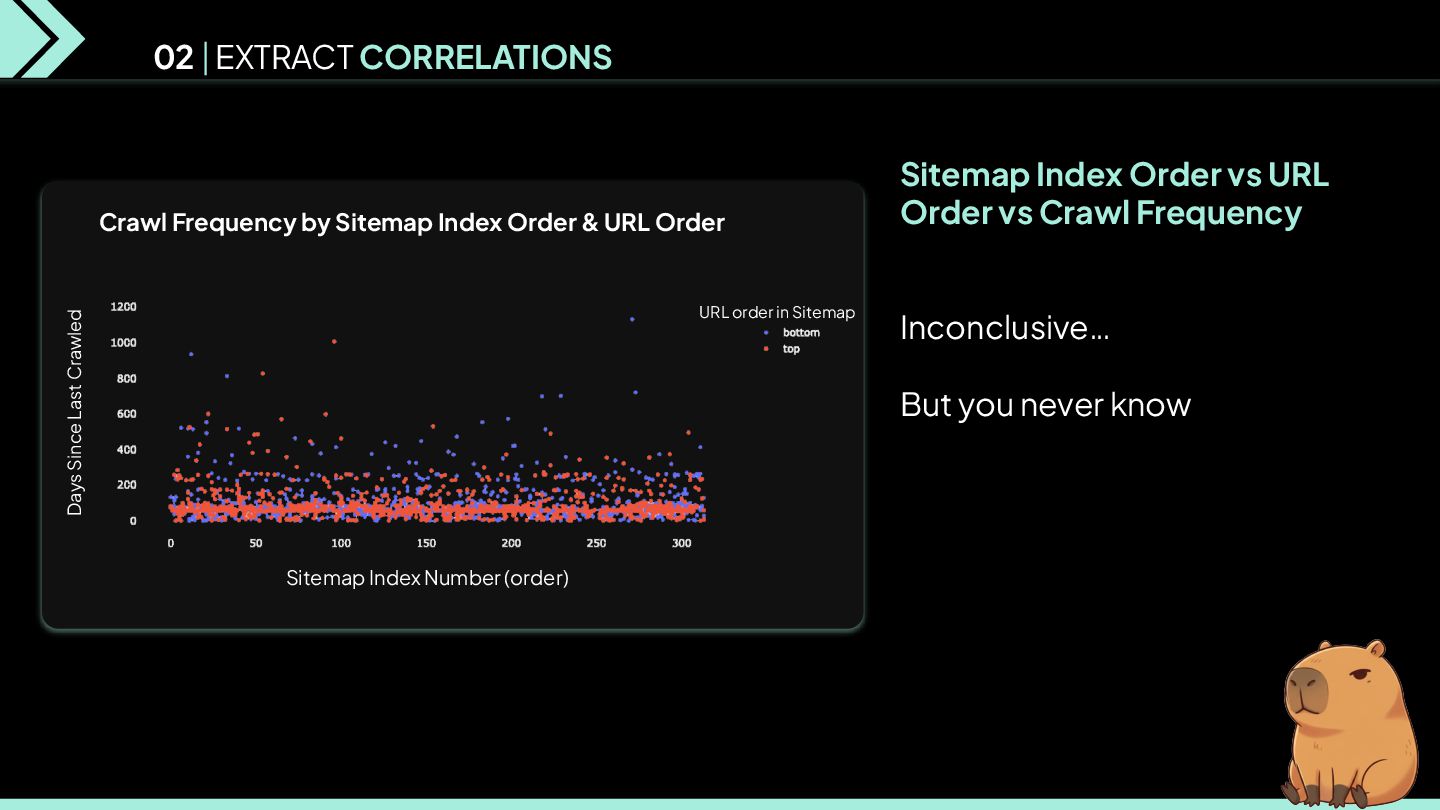
But you never know 02 | EXTRACT CORRELATIONS Crawl Frequency by Sitemap Index Order & URL Order Sitemap Index Number (order) Days Since Last Crawled URL order in Sitemap
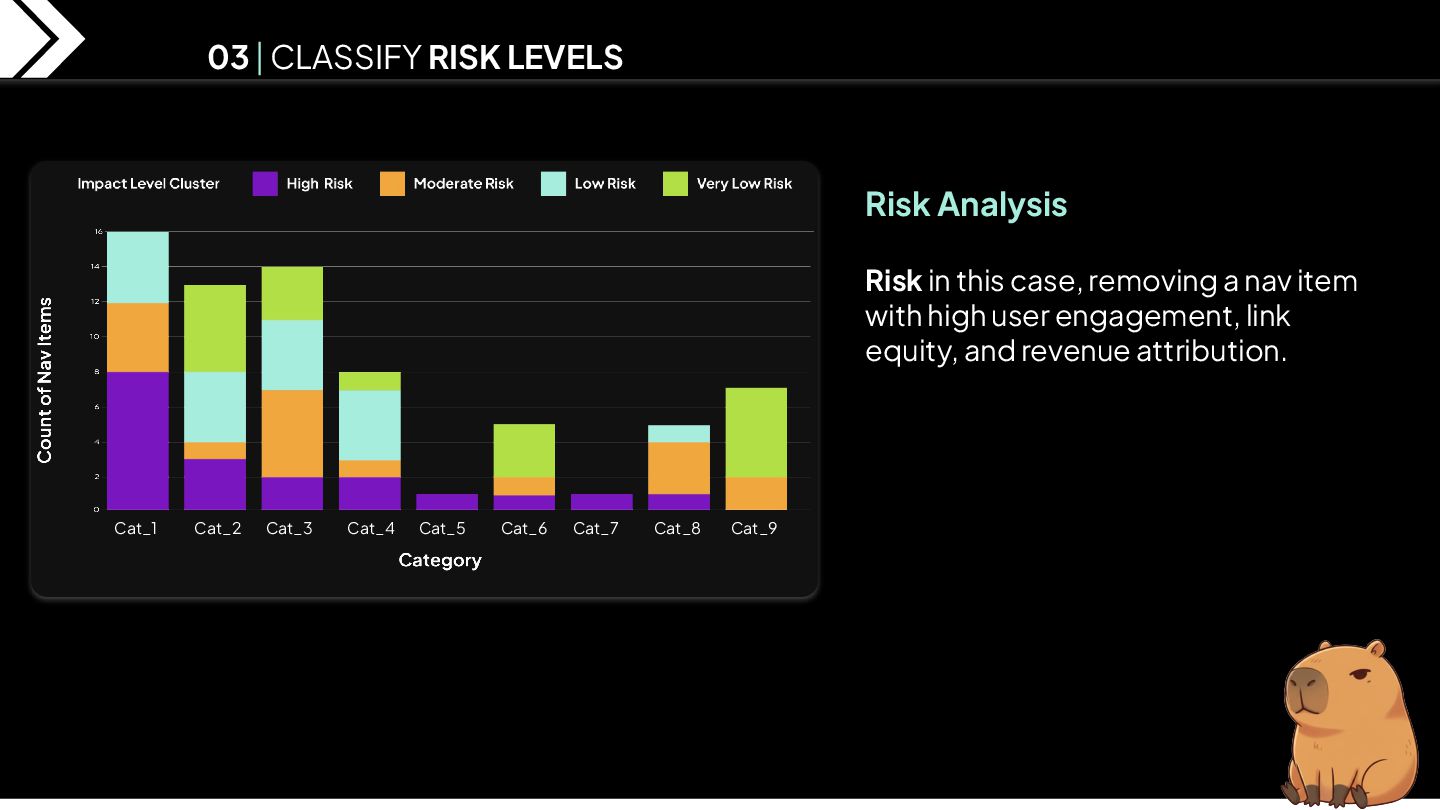
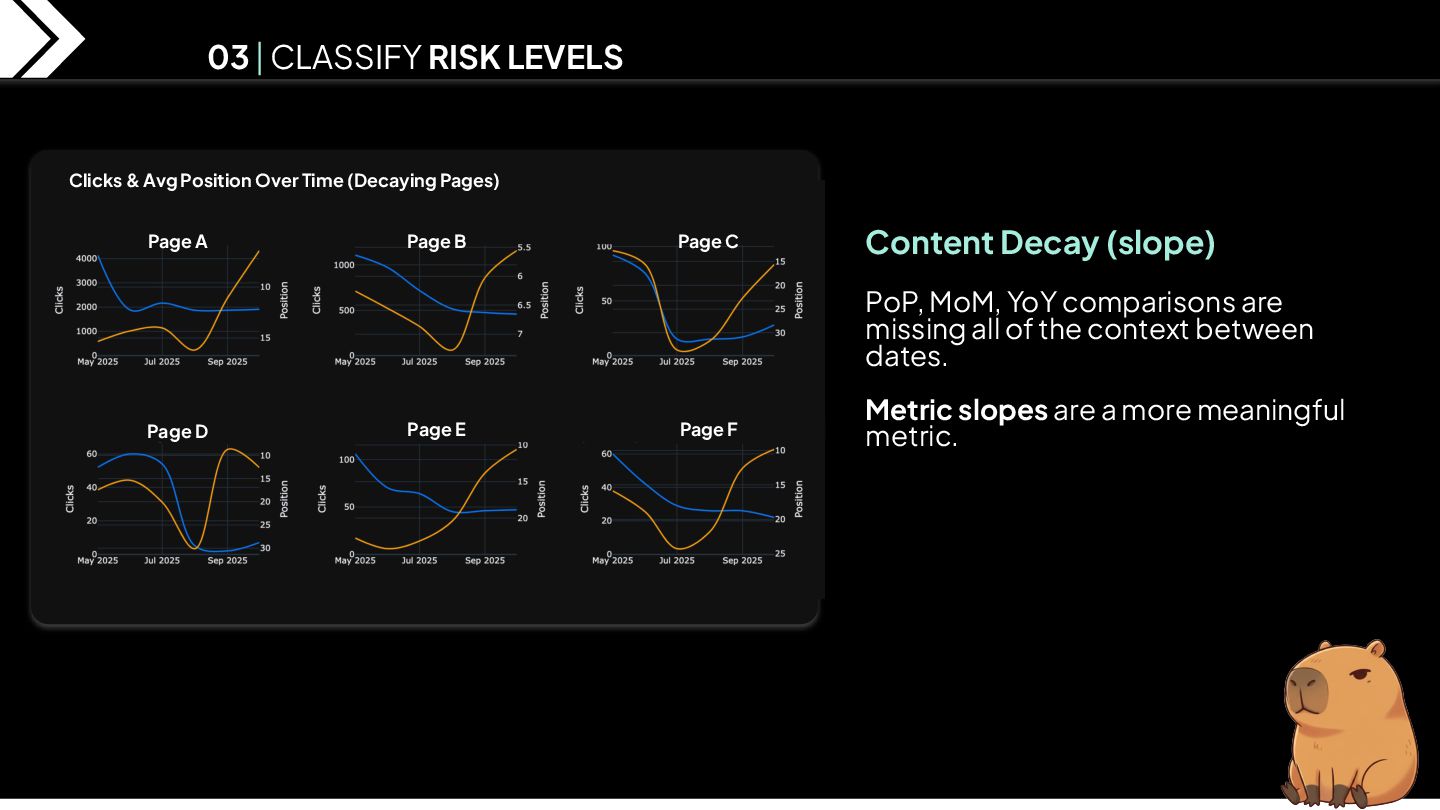
of the context between dates. Metric slopes are a more meaningful metric. 03 | CLASSIFY RISK LEVELS Page B Page A Page C Page D Page E Page F Clicks & Avg Position Over Time (Decaying Pages)
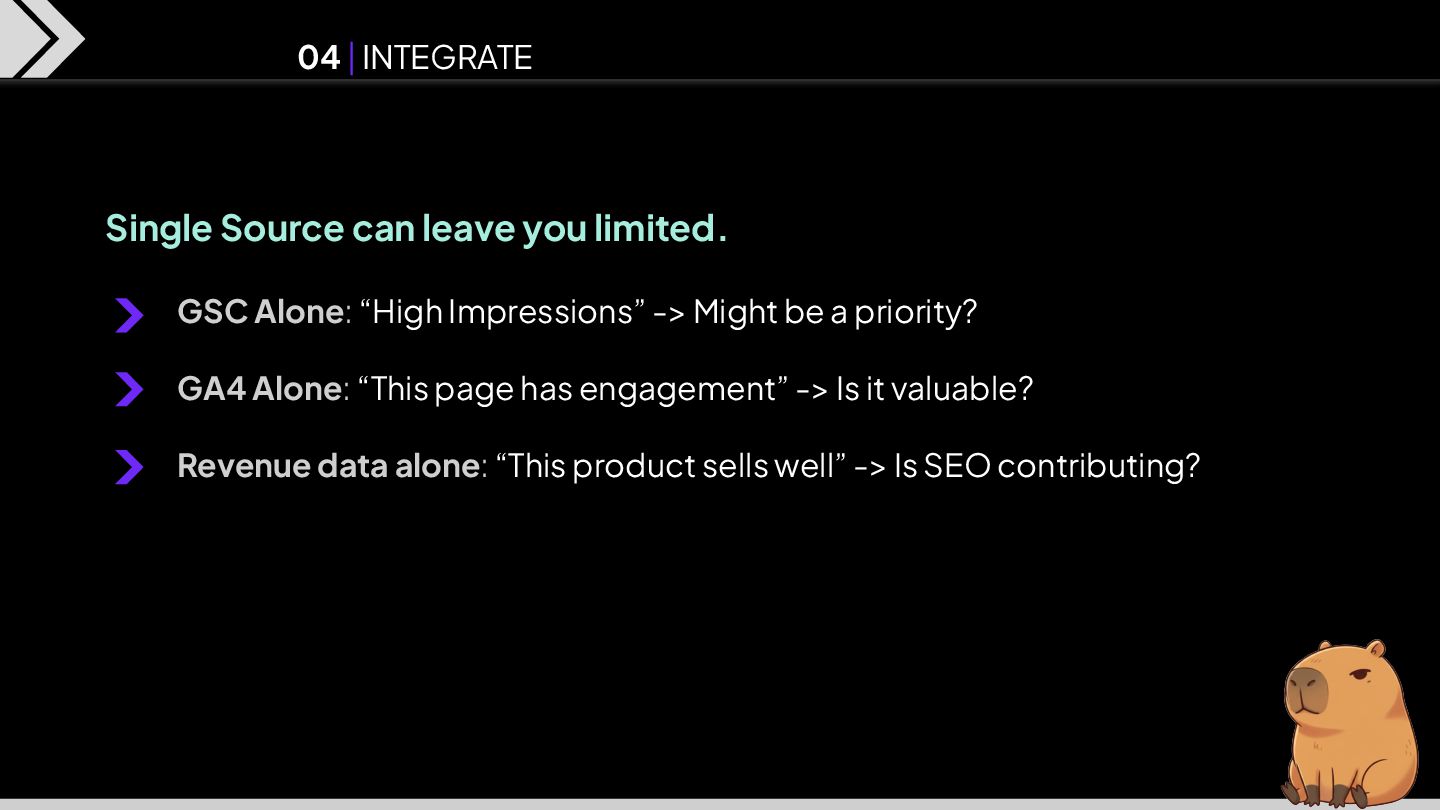
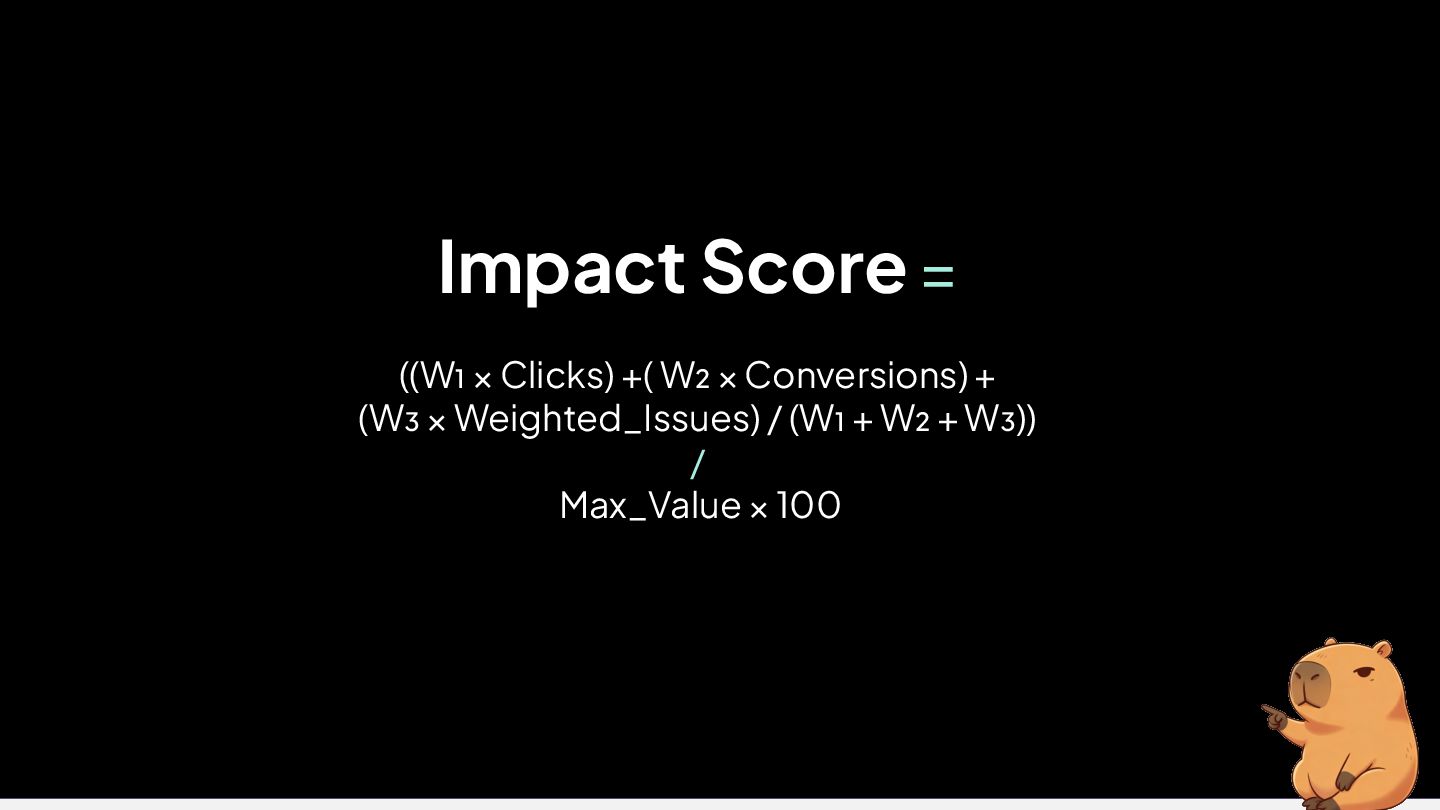
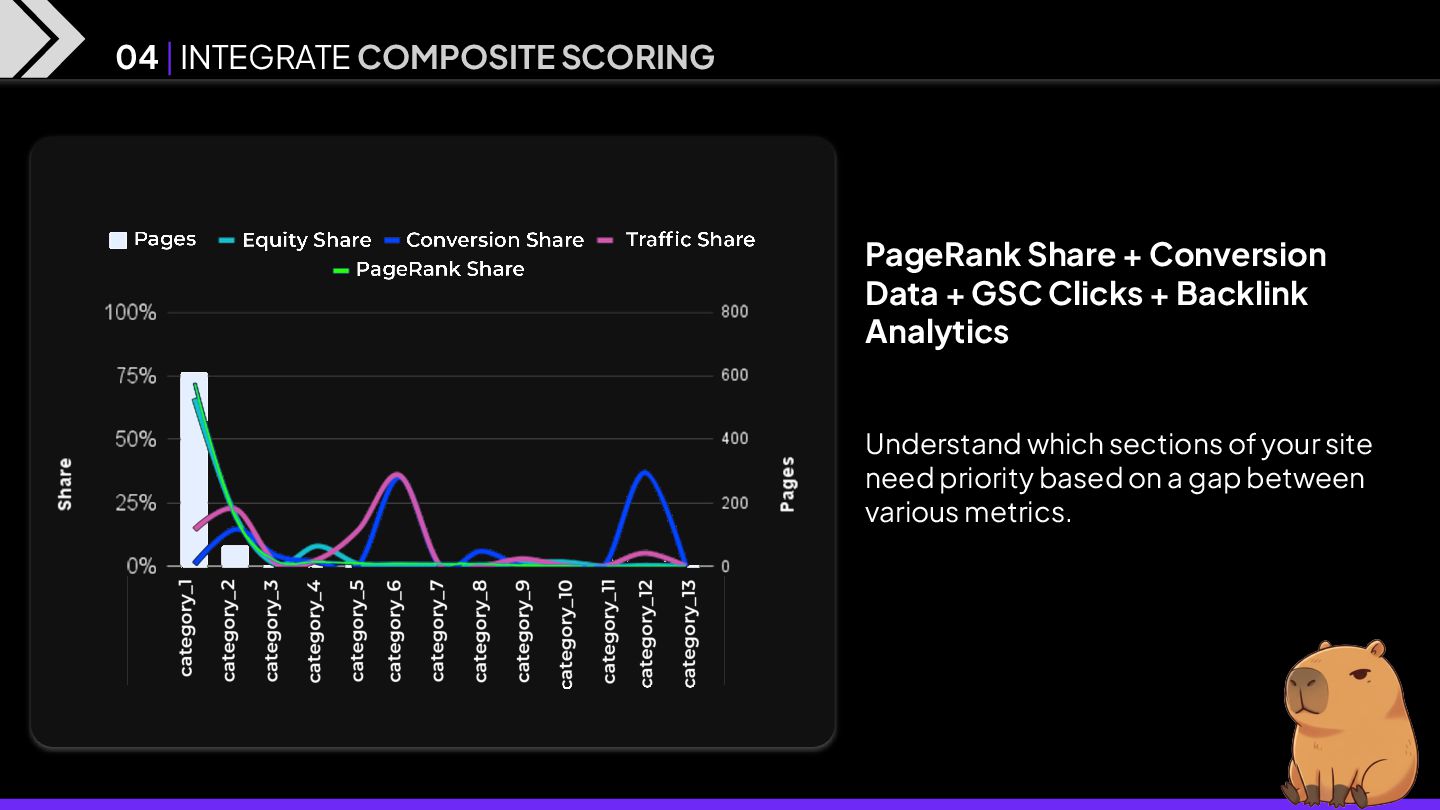
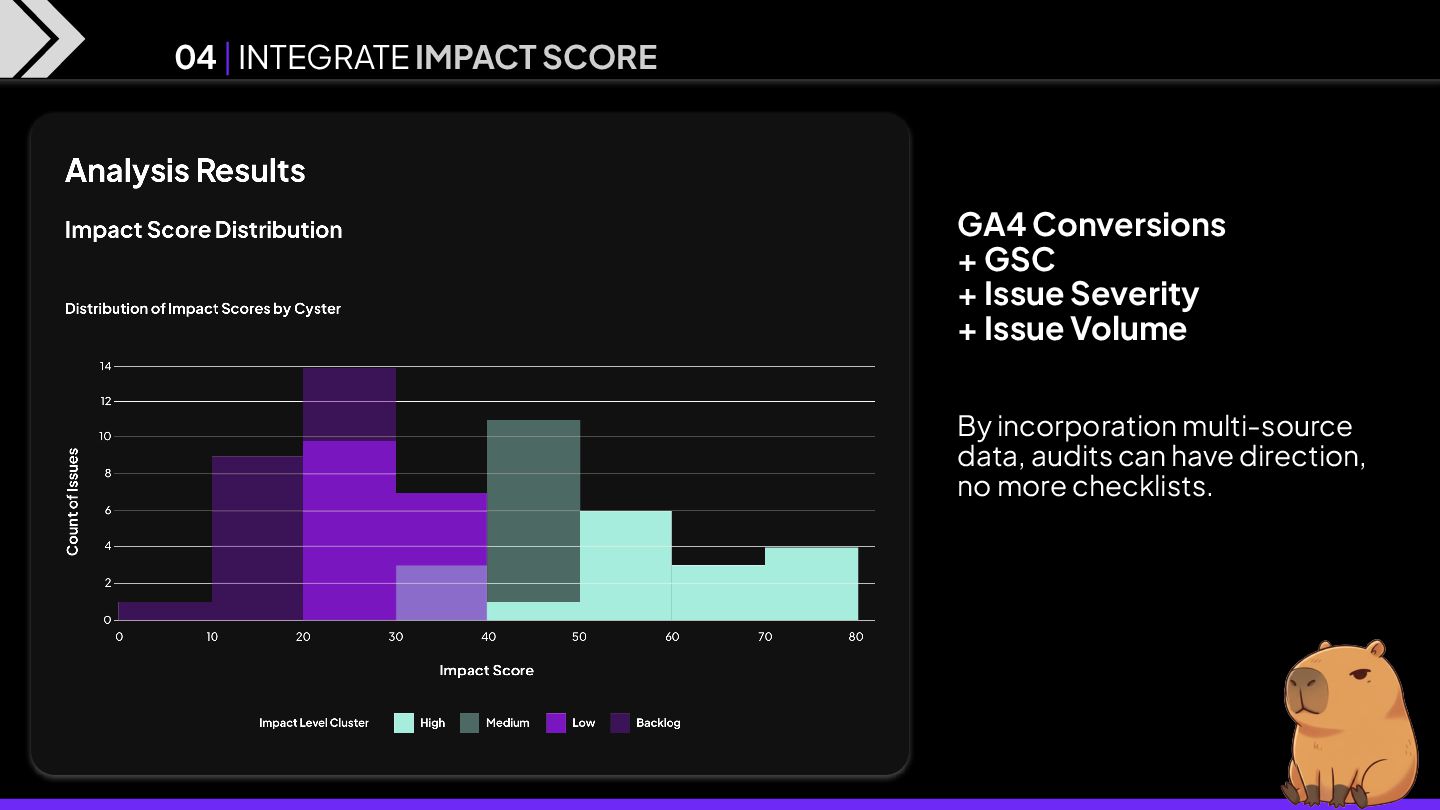
-> Might be a priority? GA4 Alone: “This page has engagement” -> Is it valuable? Revenue data alone: “This product sells well” -> Is SEO contributing? 04 | INTEGRATE
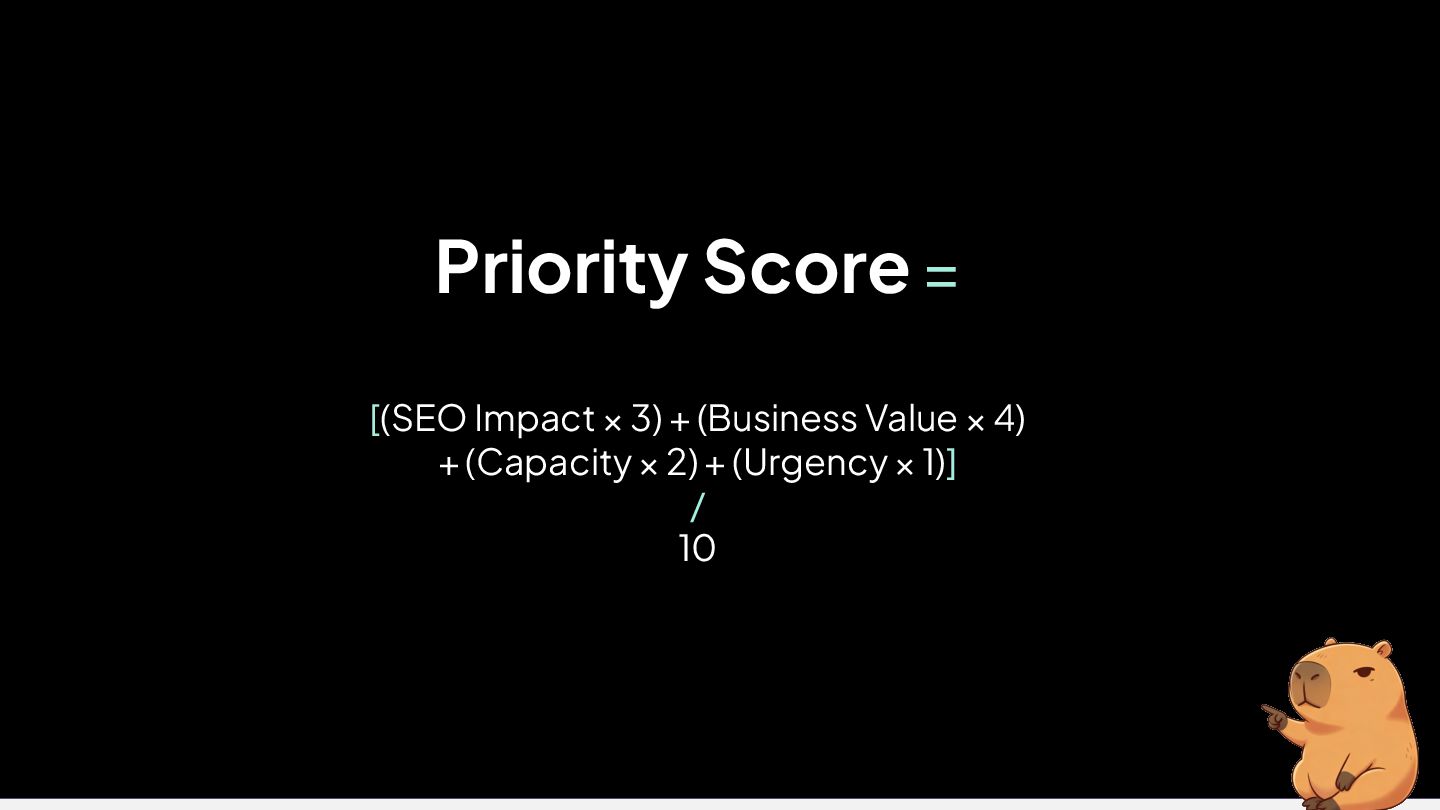
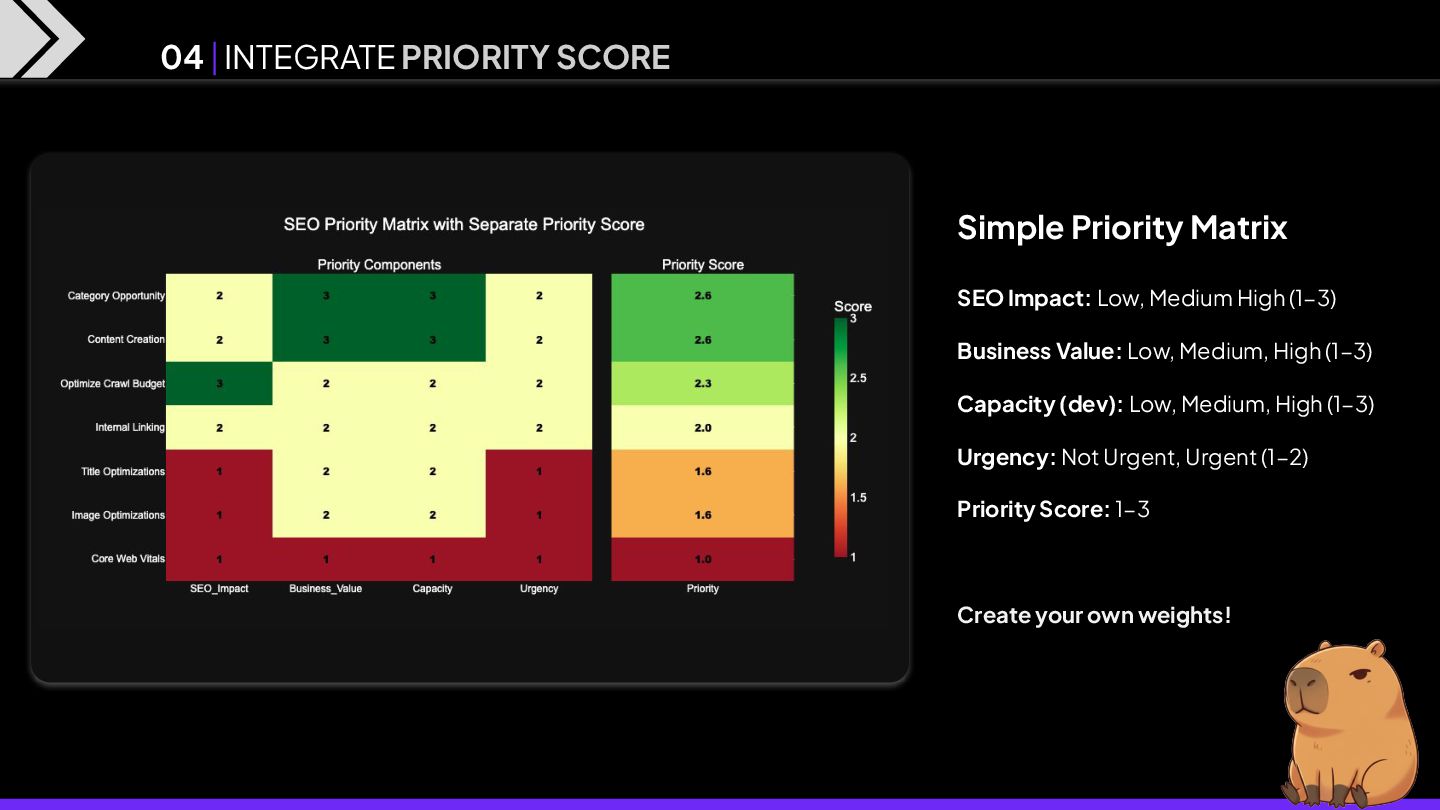
Business Value: Low, Medium, High (1−3) Capacity (dev): Low, Medium, High (1−3) Urgency: Not Urgent, Urgent (1−2) Priority Score: 1−3 Create your own weights! 04 | INTEGRATE PRIORITY SCORE
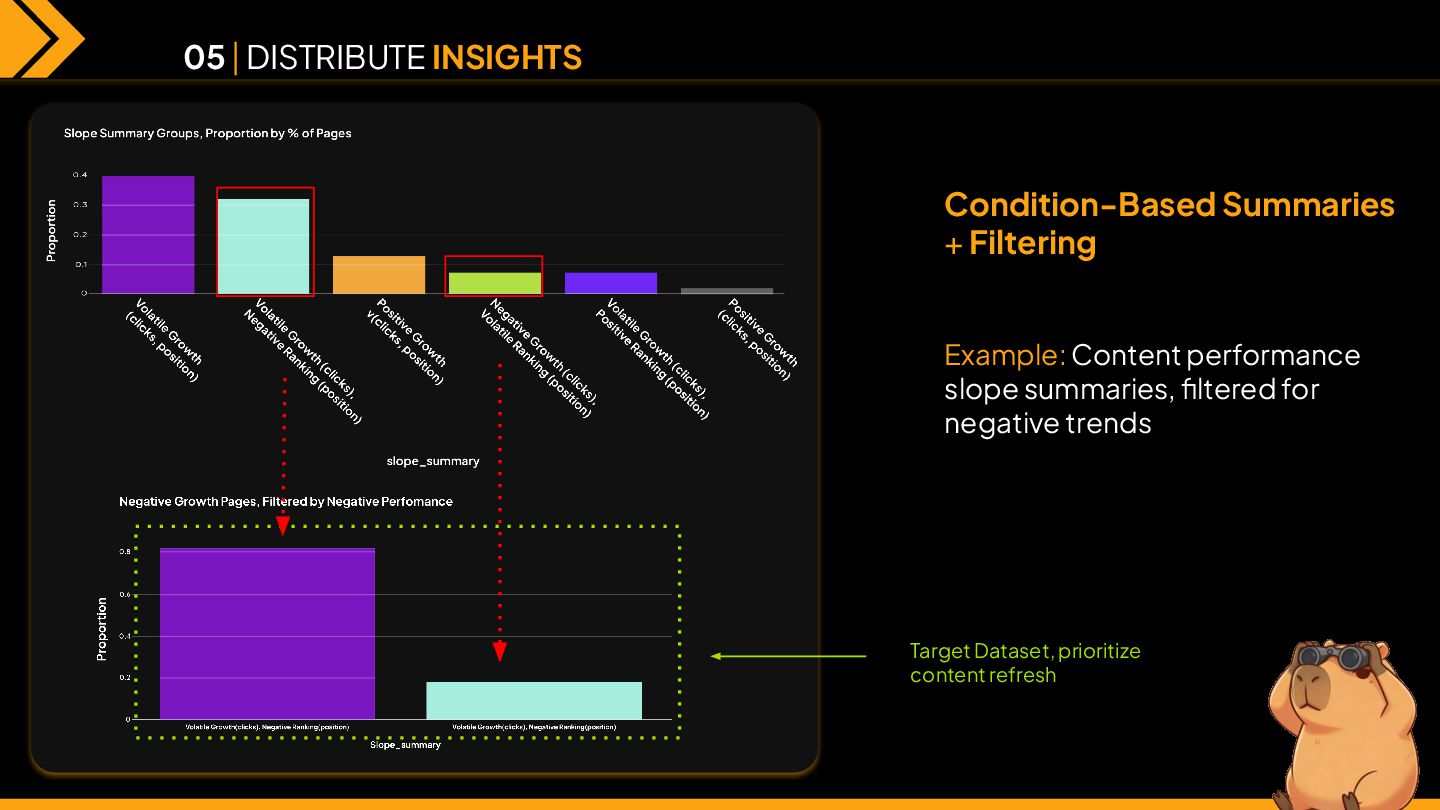
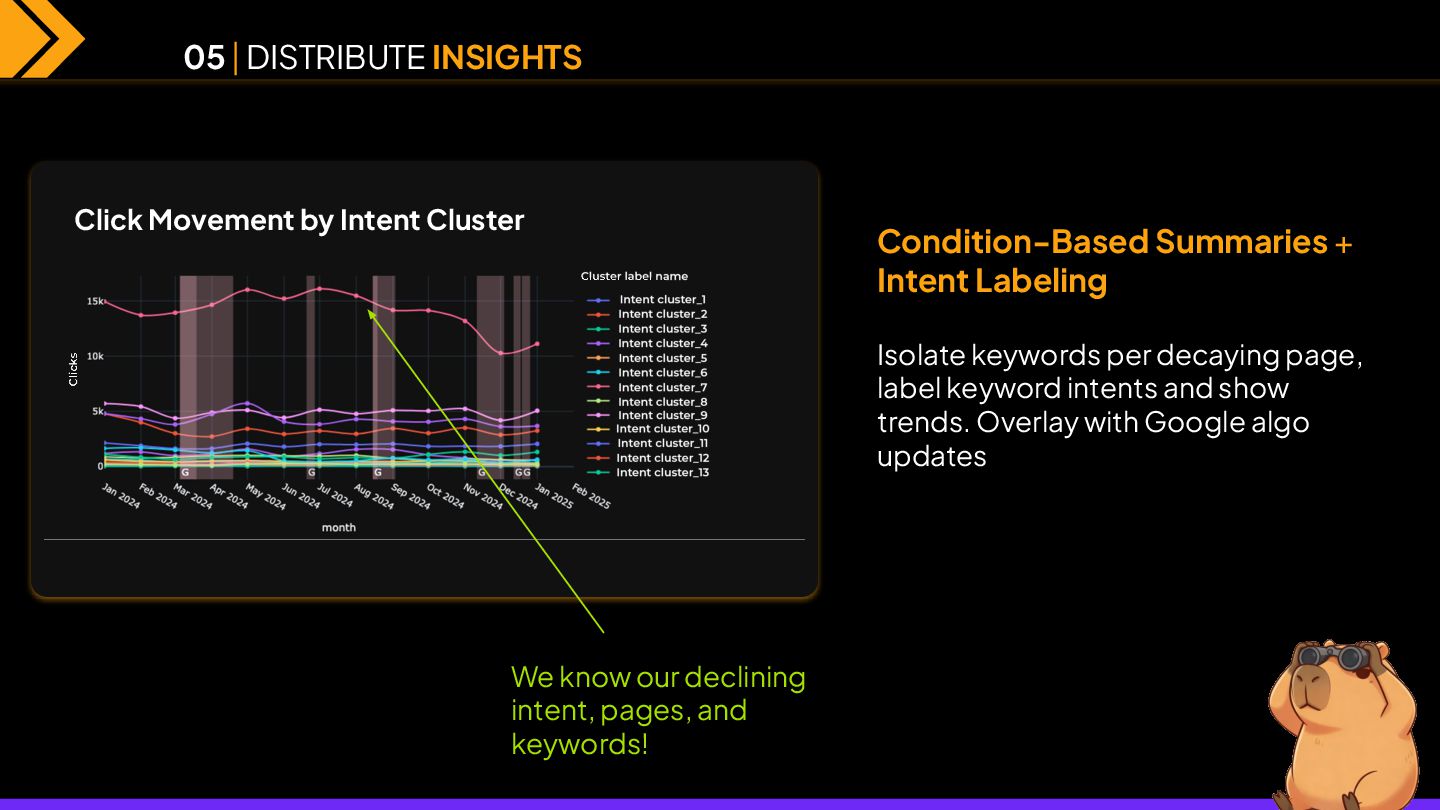
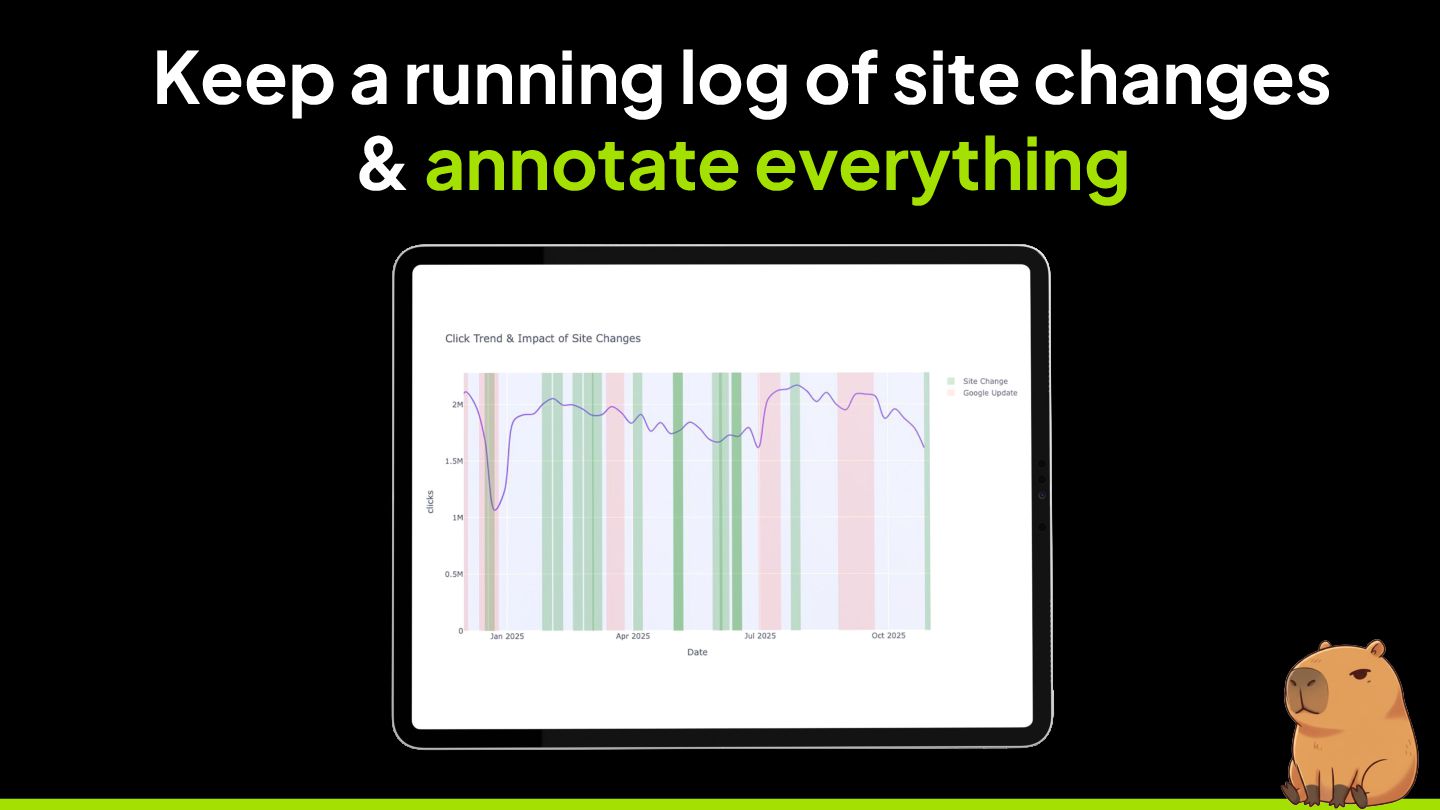
label keyword intents and show trends. Overlay with Google algo updates We know our declining intent, pages, and keywords! 05 | DISTRIBUTE INSIGHTS Click Movement by Intent Cluster
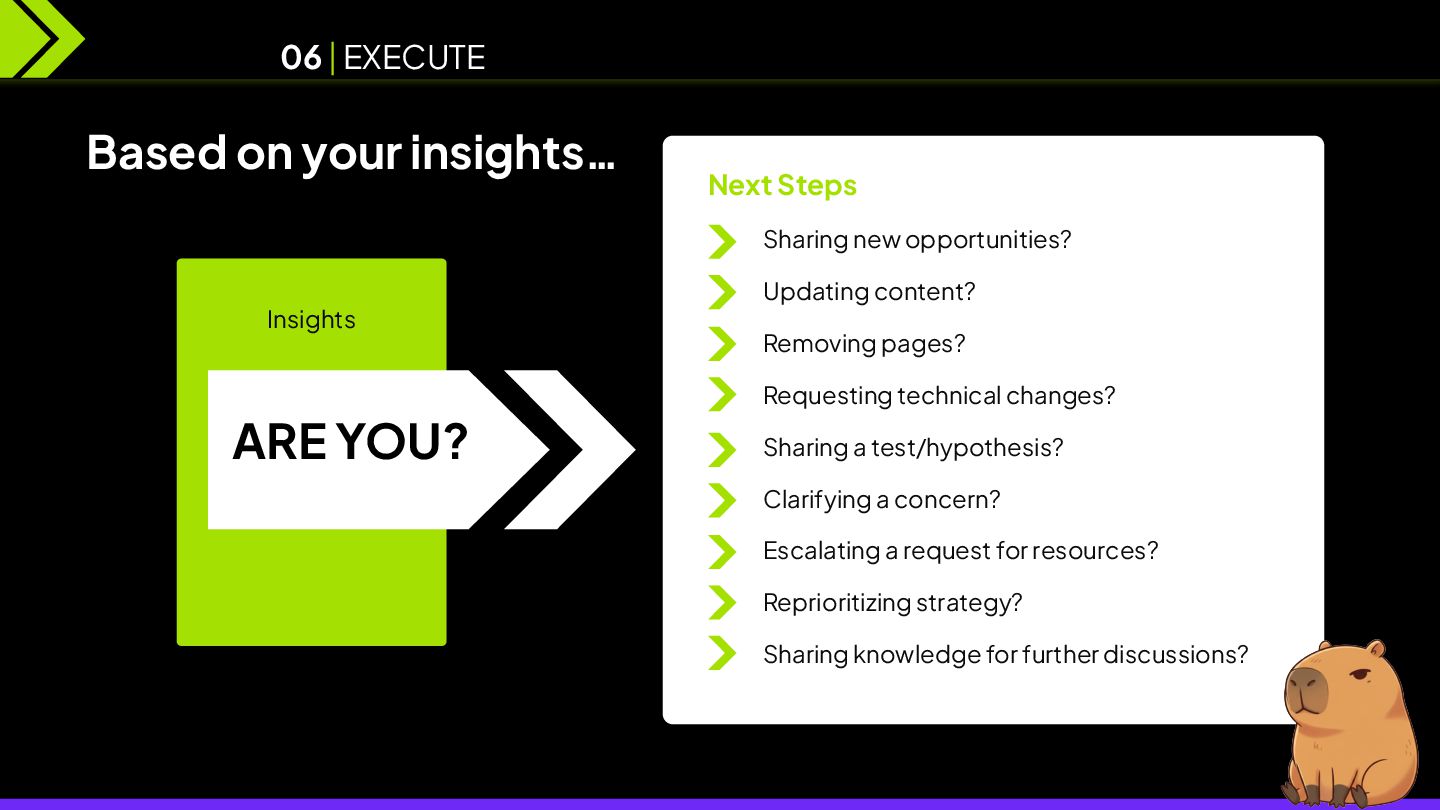
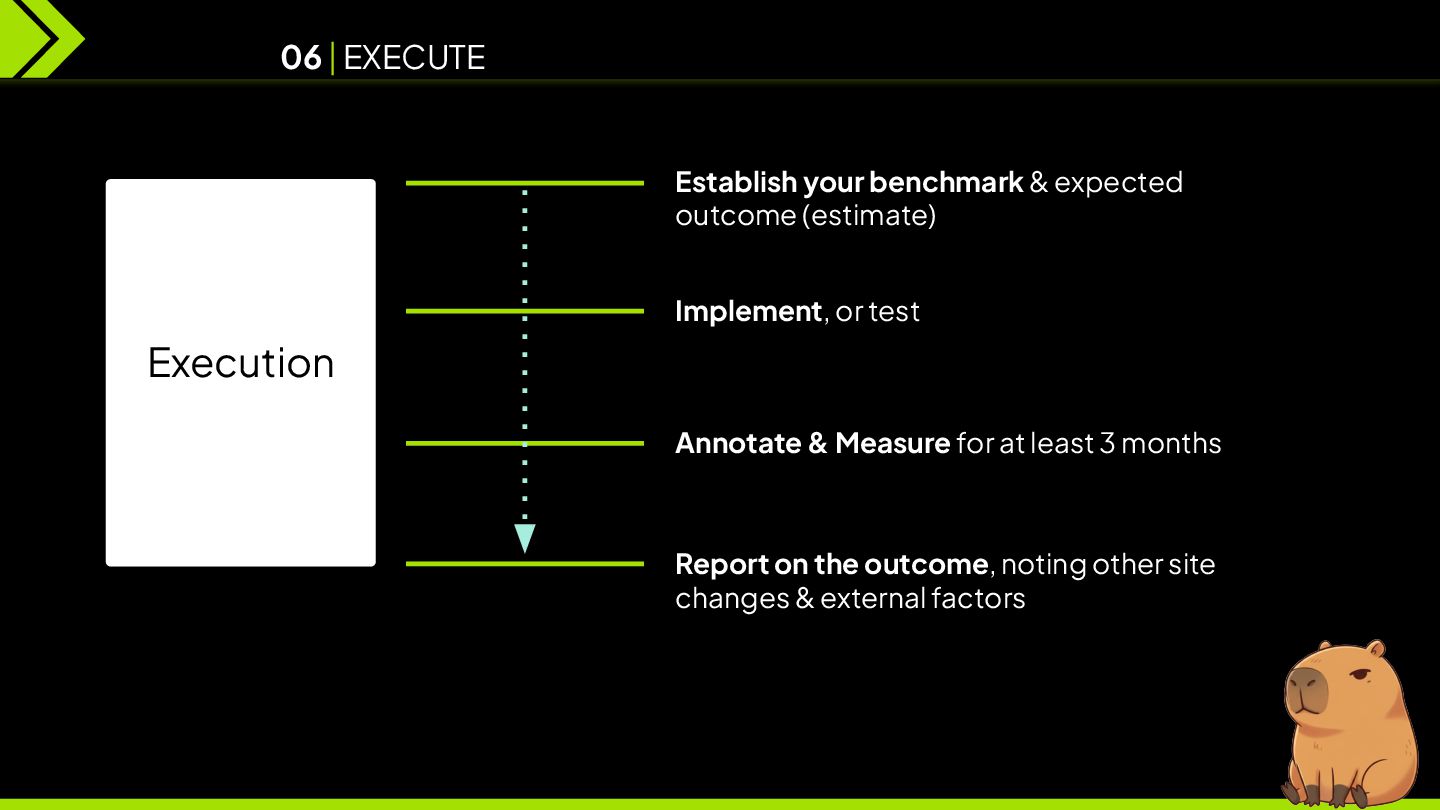
Sharing a test/hypothesis? Clarifying a concern? Escalating a request for resources? Reprioritizing strategy? Sharing knowledge for further discussions? Based on your insights… Next Steps 06 | EXECUTE ARE YOU? Insights
DEFINE Primary Goal 02 EXTRACT & Engineer Data 03 CLASSIFY* Priority Levels 04 INTEGRATE* Multiple Data Sources 05 DISTRIBUTE Insights, Not Raw Data 06 EXECUTE Against Your Insights (Test)