Upgrade to Pro — share decks privately, control downloads, hide ads and more …

Learning D3

Avatar for Scott Murray Scott Murray
February 21, 2013

Learning D3

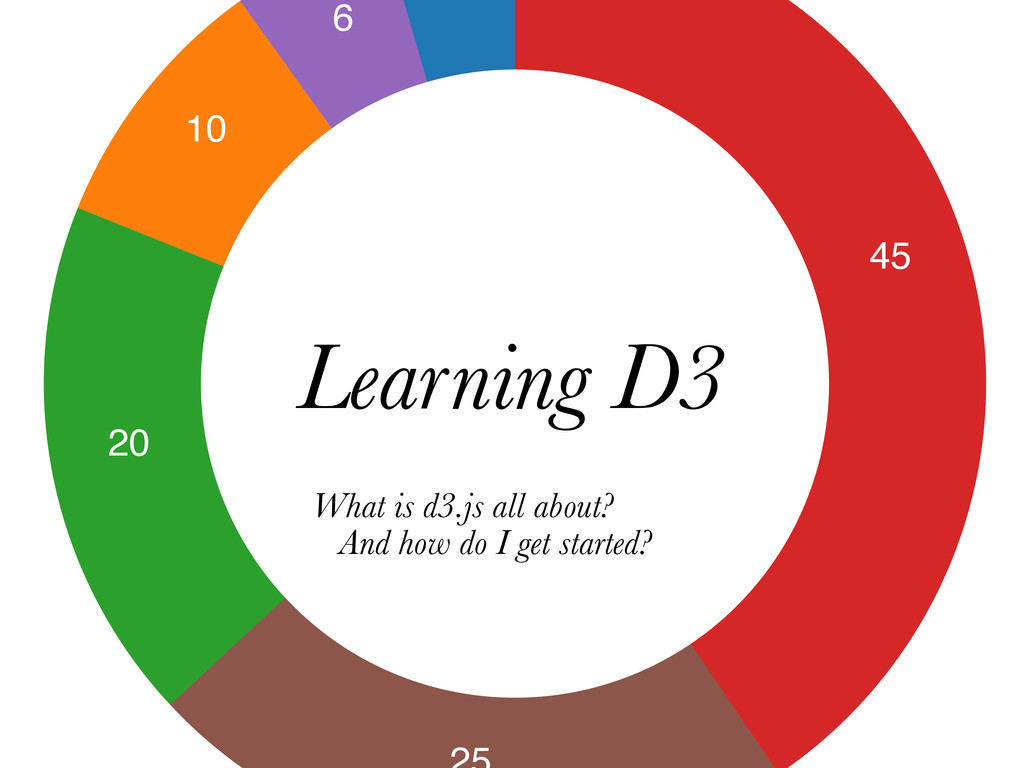
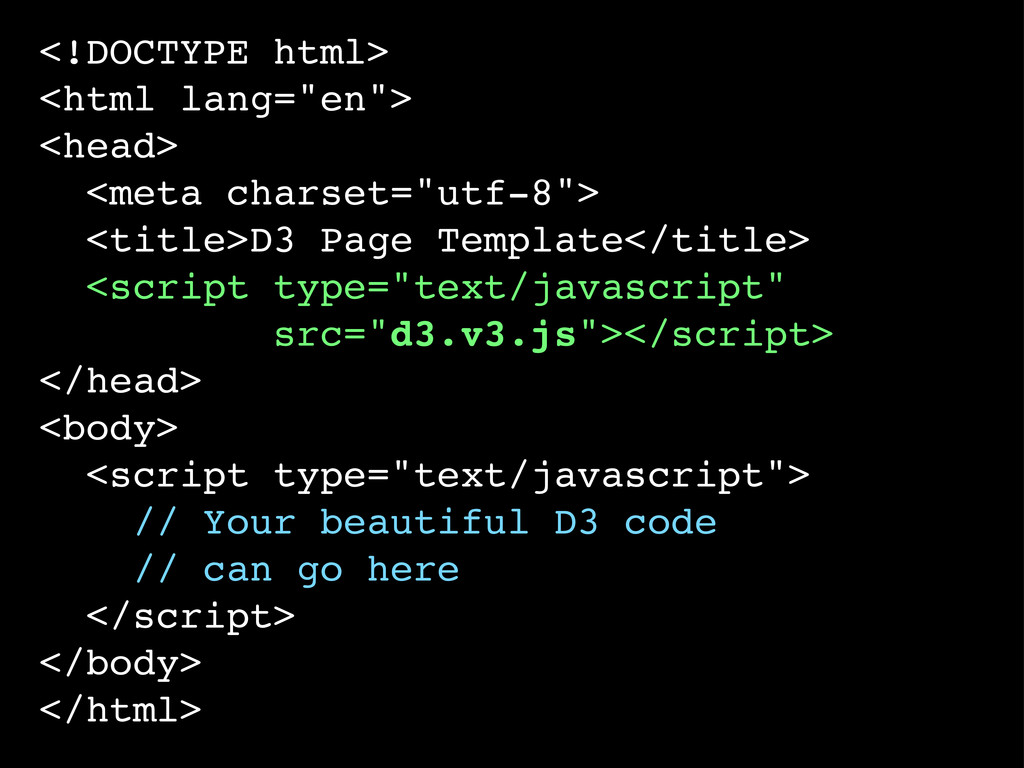
A very brief introduction to d3.js. What D3 is and what it can do for you, plus a handful of thoughts on the learning process.
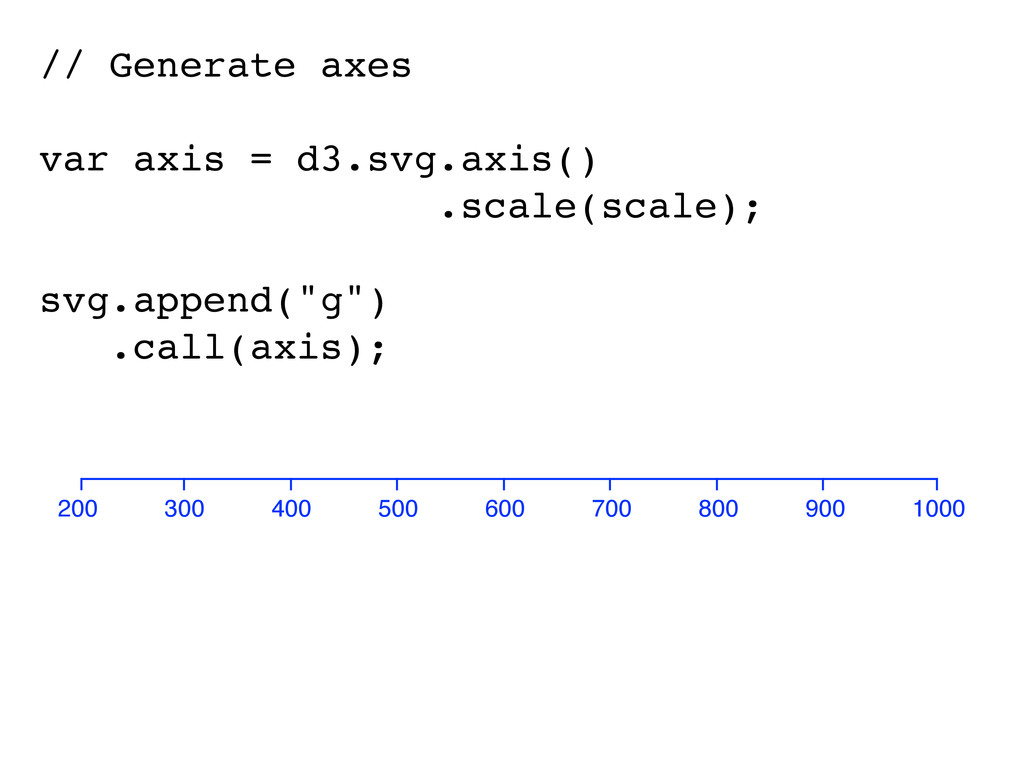
Avatar for Scott Murray

Scott Murray

February 21, 2013
Tweet

More Decks by Scott Murray

Other Decks in Programming

Transcript

  1. 10 20 45 6 Learning D3 What is d3.js all

    about? And how do I get started?
  2. <!DOCTYPE html> <html lang="en"> <head> <meta charset="utf-8"> <title>D3 Page Template</title>

    <script type="text/javascript" src="d3.v3.js"></script> </head> <body> <script type="text/javascript"> // Your beautiful D3 code // can go here </script> </body> </html>
  3. HTML CSS JS SVG DOM Hypertext Markup Language Cascading Style

    Sheets JavaScript Scalable Vector Graphics The Document Object Model all of the above == web standards
  4. HTML CSS JS SVG DOM Hypertext Markup Language Cascading Style

    Sheets JavaScript Scalable Vector Graphics The Document Object Model Learning D3 is a process of “learning the web”
  5. // Data joins! var dataset = [ 5, 10, 20,

    15, 18 ]; d3.select(“svg”).selectAll(“circle”) .data(dataset) .enter() .append(“circle”);
  6. // Data joins! var dataset = [ 5, 10, 20,

    15, 18 ]; d3.select(“svg”).selectAll(“circle”) .data(dataset) .enter() .append(“circle”);
  7. // Data joins! var dataset = [ 5, 10, 20,

    15, 18 ]; d3.select(“svg”).selectAll(“circle”) .data(dataset) .enter() .append(“circle”); ? (empty selection)
  8. // Data joins! var dataset = [ 5, 10, 20,

    15, 18 ]; d3.select(“svg”).selectAll(“circle”) .data(dataset) .enter() .append(“circle”); = 5 10 15 20 18 - 5 values 0 circles Room for 5 new circles!
  9. // Data joins! var dataset = [ 5, 10, 20,

    15, 18 ]; d3.select(“svg”).selectAll(“circle”) .data(dataset) .enter() .append(“circle”); 18 15 20 10 5
  10. // Data joins! var dataset = [ 5, 10, 20,

    15, 18 ]; d3.select(“svg”).selectAll(“circle”) .data(dataset) .enter() .append(“circle”); 18 15 20 10 5 18 15 20 10 5
  11. 18 15 20 10 5 // Binding data to elements

    // 1. Lets you reference values later // 2. Prevents need to “redraw” elements
  12. // Scale values var scale = d3.scale.linear() .domain([200, 1000]) .range([0,

    500]); scale(600); // Returns 250 200 1000 0 500 600 250
  13. Thanks! Questions? @alignedleft alignedleft.com An Introduction to Designing With D3

    Scott Murray Interactive Data Visualization for the Web