Upgrade to Pro
— share decks privately, control downloads, hide ads and more …
Speaker Deck
Features
Speaker Deck
PRO
Sign in
Sign up for free
Search
Search
Debugging and profiling jvm applications
Search
Bhuvan Rawal
September 13, 2017
Technology
1.5k
1
Share
Embed
Copy iframe code
Copy JS code
Copy link
Start on current slide
Debugging and profiling jvm applications
Bhuvan Rawal
September 13, 2017
Other Decks in Technology
See All in Technology
第67回コンピュータビジョン勉強会CVPR2026読会前編
tsukamotokenji
0
160
大量データに対しても、生成AIを用いてリーズナブルにデータ加工をしたい!Databricksのai_queryについて調べてみた
kamoshika
1
230
壊して学ぶAWS CDK: そのcdk deployで消えるもの、残るもの
k_adachi_01
1
440
OPENLOGI Company Profile for engineer
hr01
1
74k
そのドキュメント、自動化しませんか?
yuksew
1
340
Genie Ontologyは銀の弾丸かを考える / Is Genie Ontology a Silver Bullet?
nttcom
0
420
Kaggleで成長するために意識したこと
prgckwb
2
430
AIが当たり前の組織で エンジニアはどう育つか
nishihira
1
290
探索・可視化・自動化を一本化 Amazon Quickでデータ活用スピードを上げる方法
koheiyoshikawa
0
120
Multicaで30個のミニプロジェクトをAIエージェント運用して見えてきたこと
eiei114
0
490
AI、CDK と協働する Full TypeScript アプリケーション開発 / Full TypeScript Application with AI and CDK
geekplus_tech
2
430
Alphaモジュール使っていいのかい!?いけないのかい!?どっちなんだいっ!?
watany
1
300
Featured
See All Featured
The Illustrated Children's Guide to Kubernetes
chrisshort
51
53k
The Director’s Chair: Orchestrating AI for Truly Effective Learning
tmiket
1
220
Designing Dashboards & Data Visualisations in Web Apps
destraynor
231
55k
Getting science done with accelerated Python computing platforms
jacobtomlinson
2
330
The Psychology of Web Performance [Beyond Tellerrand 2023]
tammyeverts
49
3.5k
Automating Front-end Workflow
addyosmani
1370
210k
The innovator’s Mindset - Leading Through an Era of Exponential Change - McGill University 2025
jdejongh
PRO
1
220
Evolving SEO for Evolving Search Engines
ryanjones
0
240
A Modern Web Designer's Workflow
chriscoyier
698
190k
Agile Leadership in an Agile Organization
kimpetersen
PRO
0
190
A Soul's Torment
seathinner
6
3.1k
End of SEO as We Know It (SMX Advanced Version)
ipullrank
3
4.3k
Transcript
Debugging JVM Applications
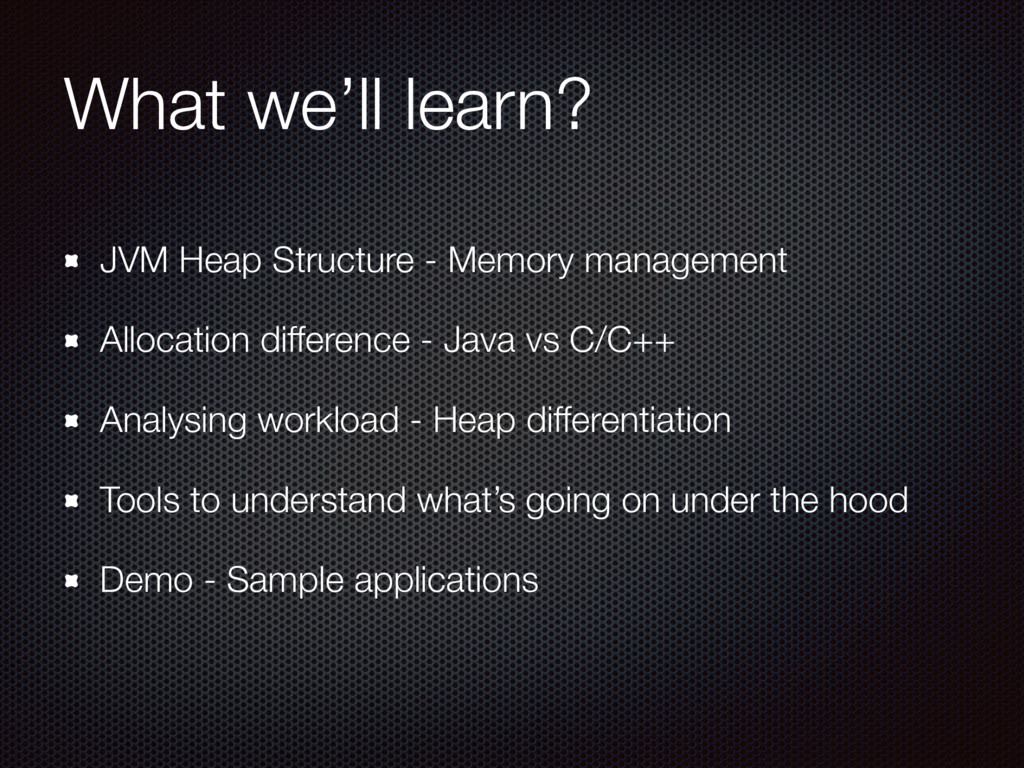
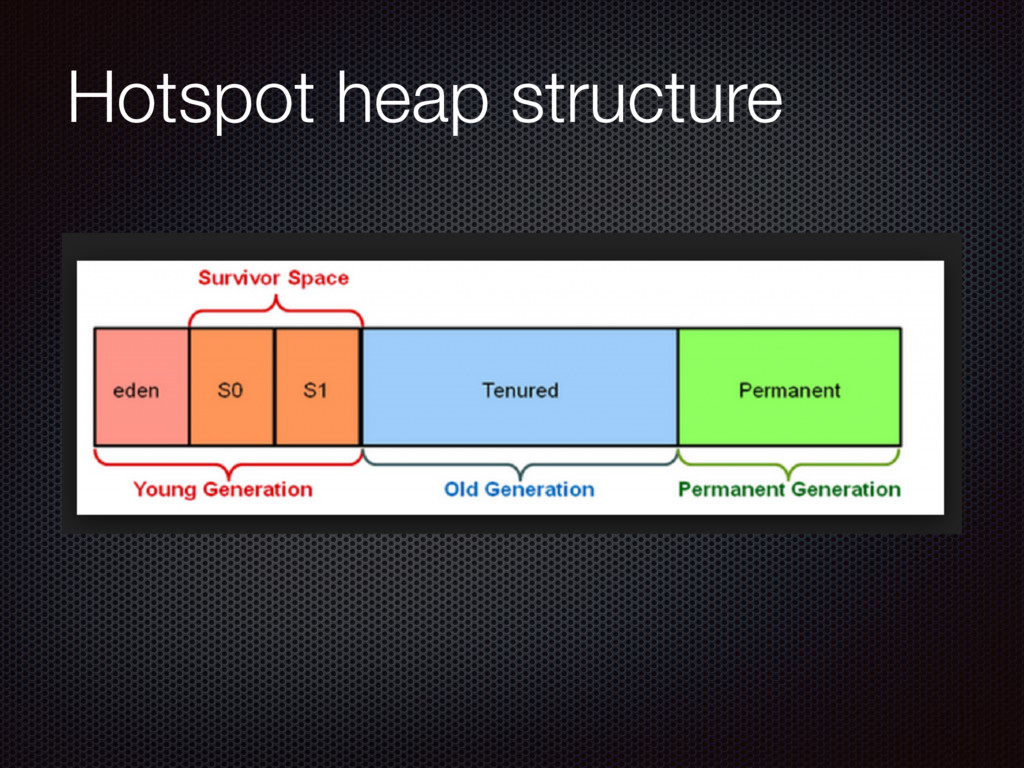
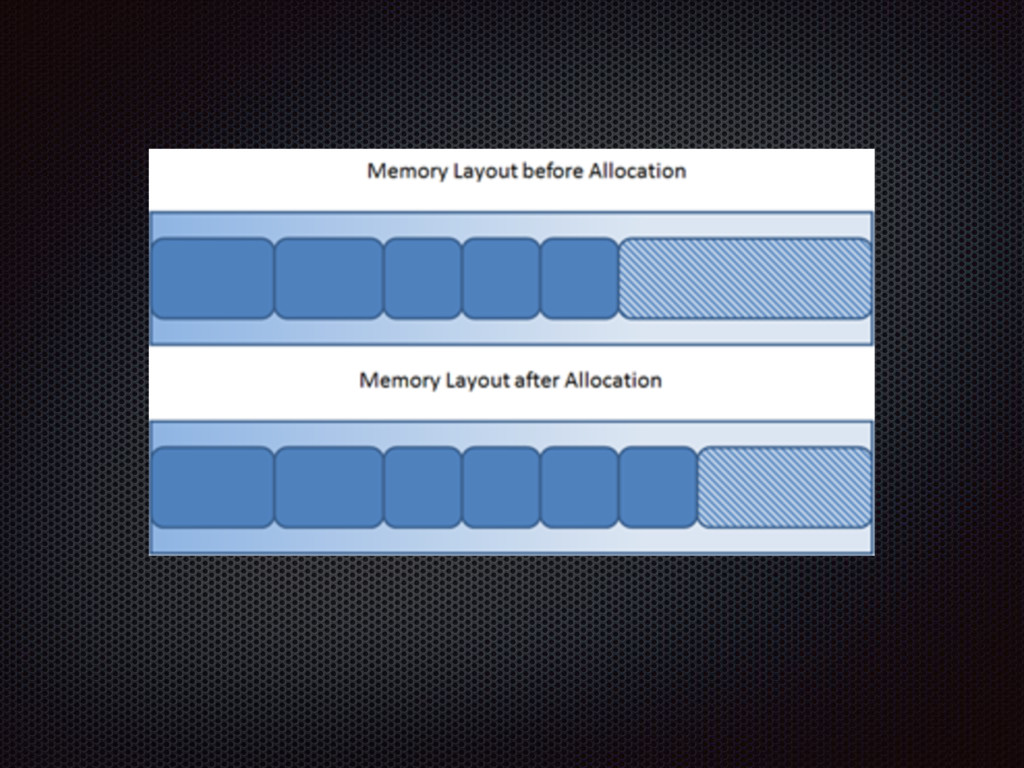
What we’ll learn? JVM Heap Structure - Memory management Allocation
difference - Java vs C/C++ Analysing workload - Heap differentiation Tools to understand what’s going on under the hood Demo - Sample applications
None
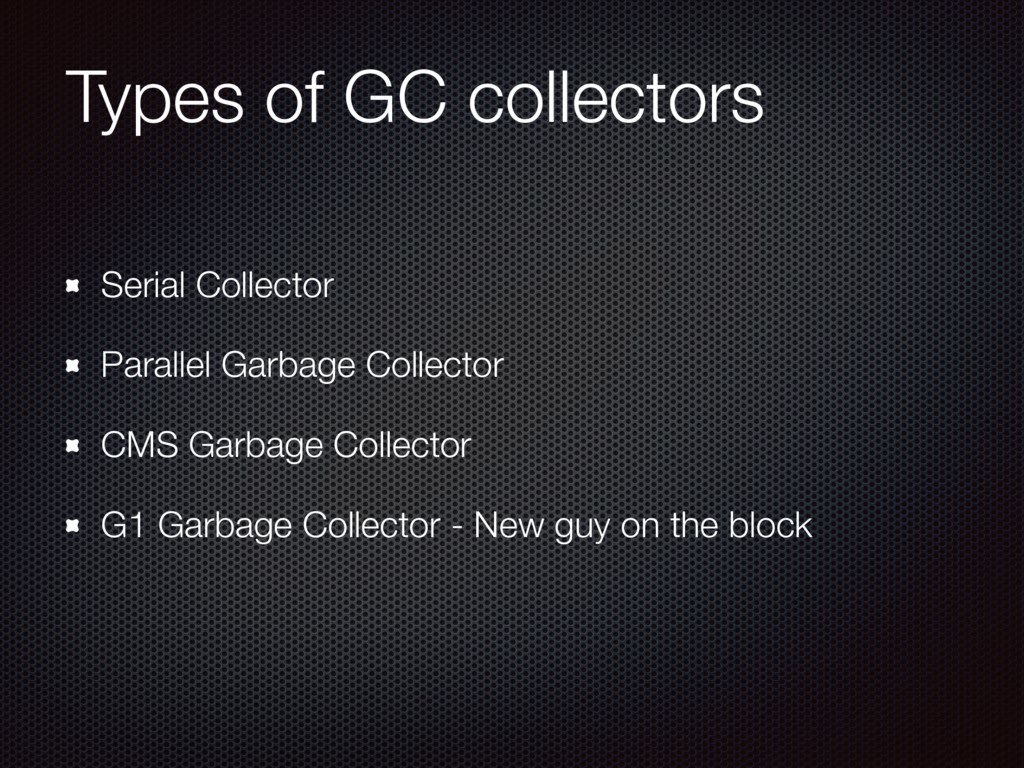
Types of GC collectors Serial Collector Parallel Garbage Collector CMS
Garbage Collector G1 Garbage Collector - New guy on the block
Hotspot heap structure
None
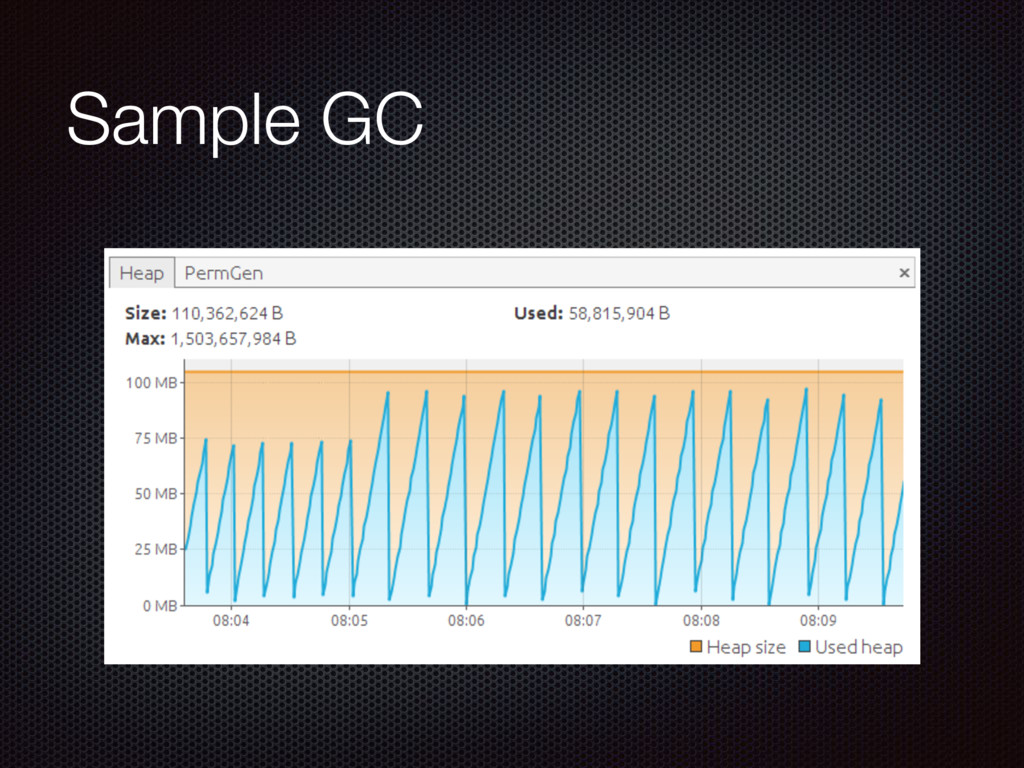
Sample GC
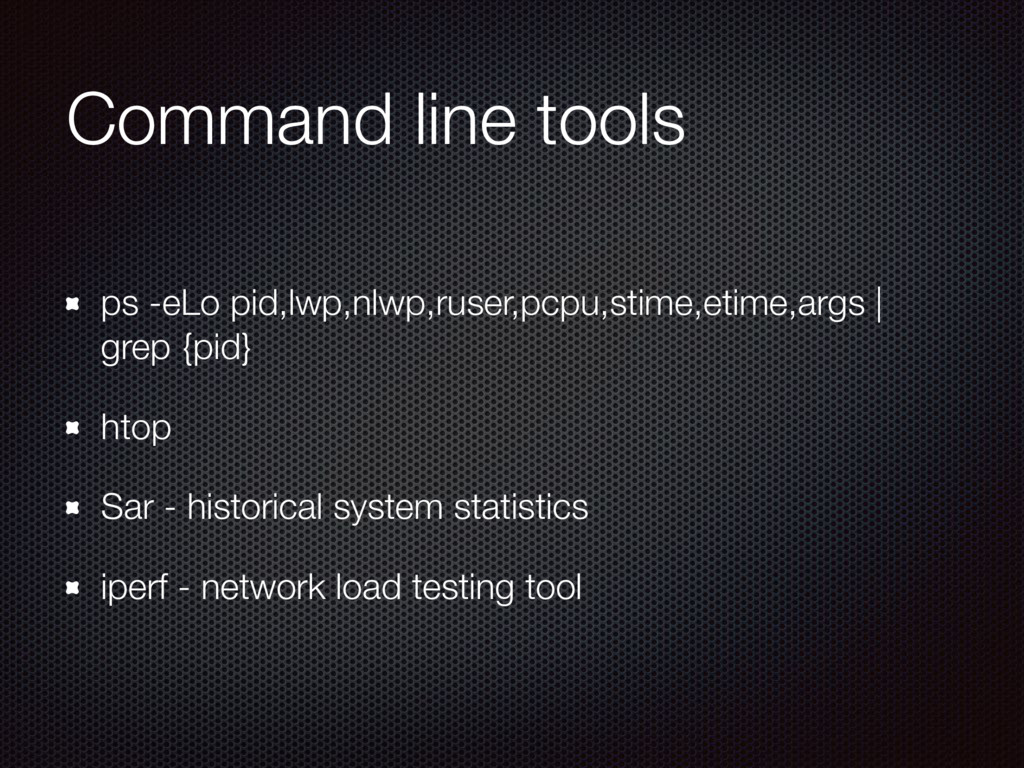
Command line tools ps -eLo pid,lwp,nlwp,ruser,pcpu,stime,etime,args | grep {pid} htop
Sar - historical system statistics iperf - network load testing tool
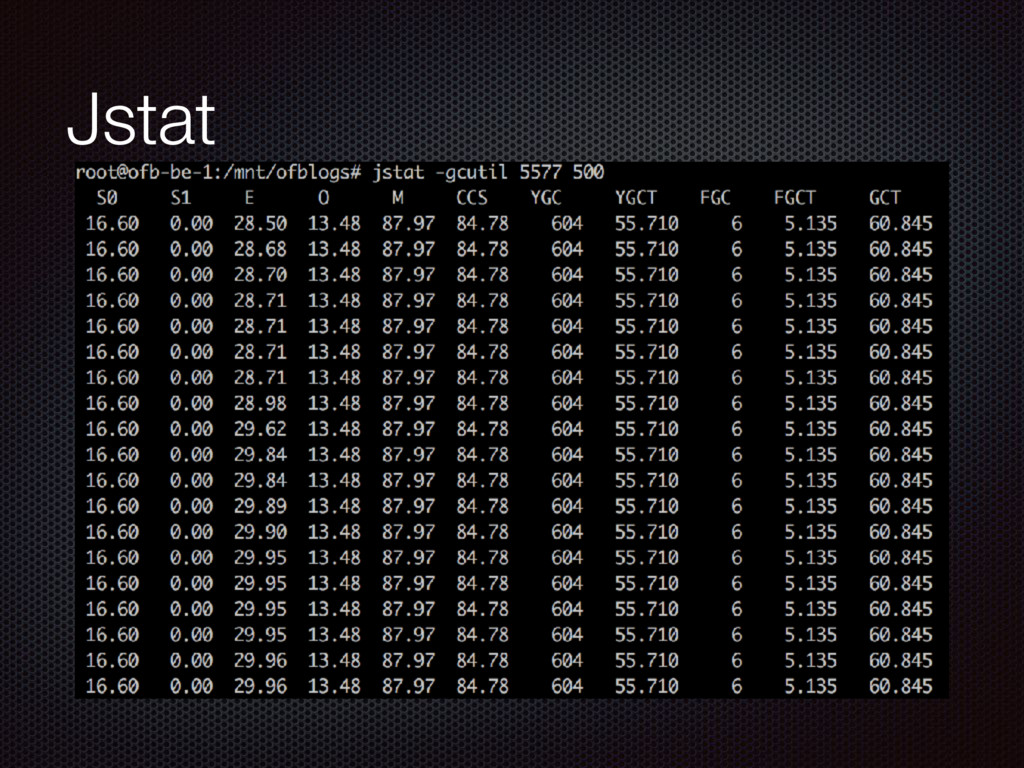
Jstat
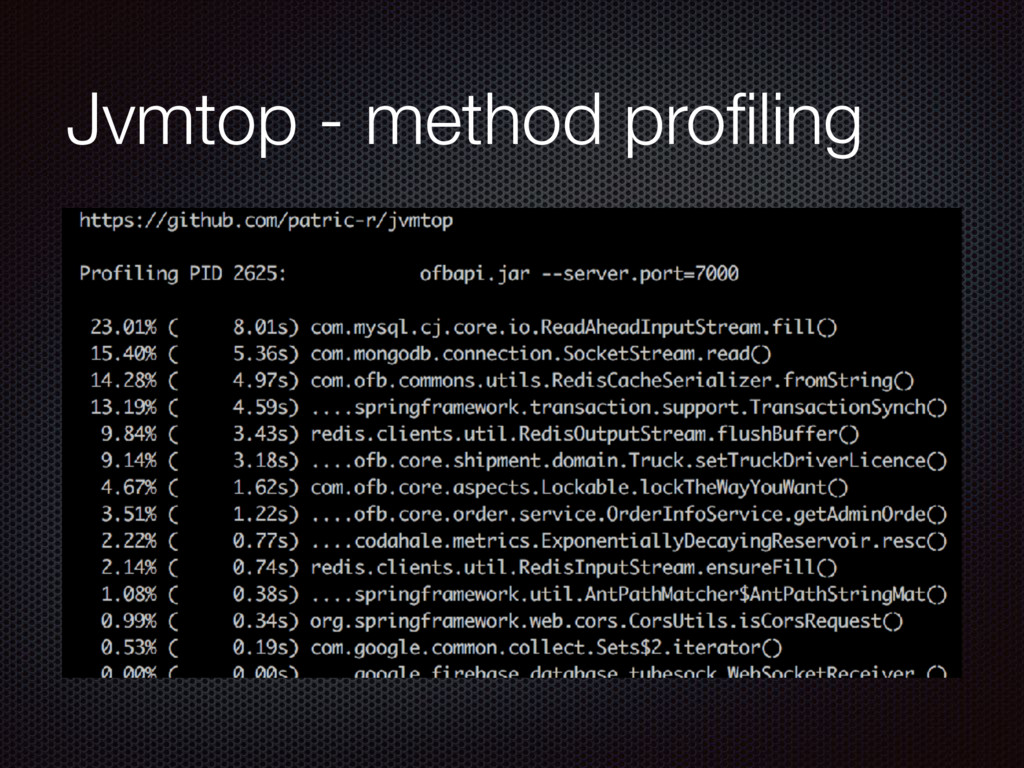
Jvmtop - method profiling
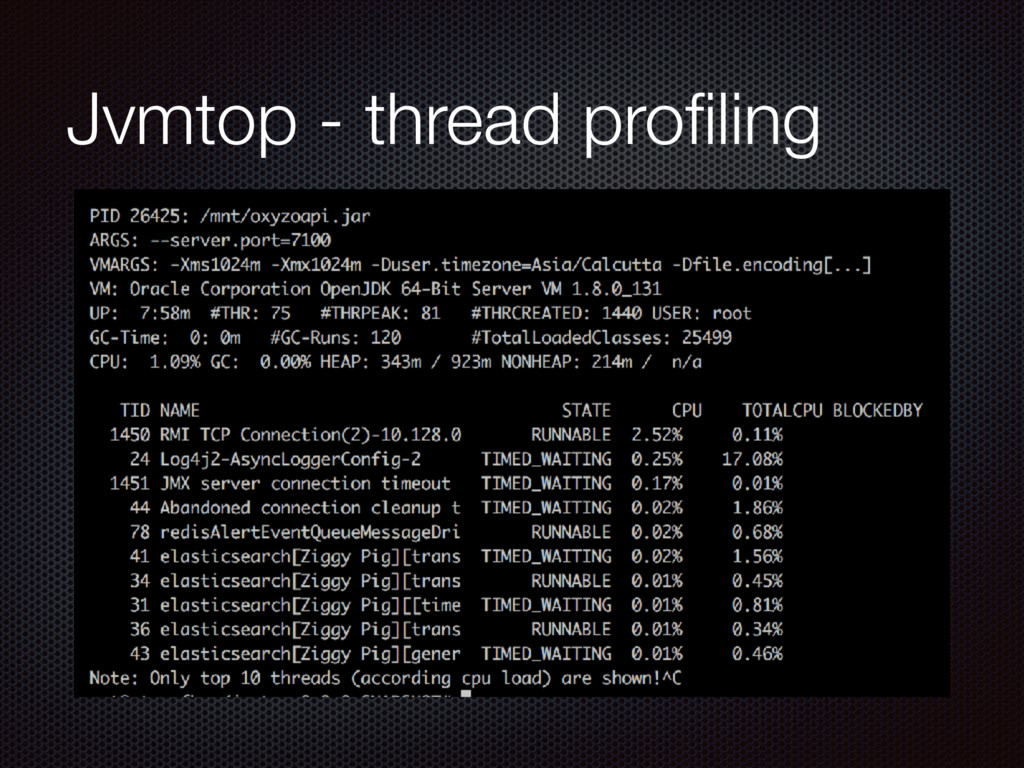
Jvmtop - thread profiling
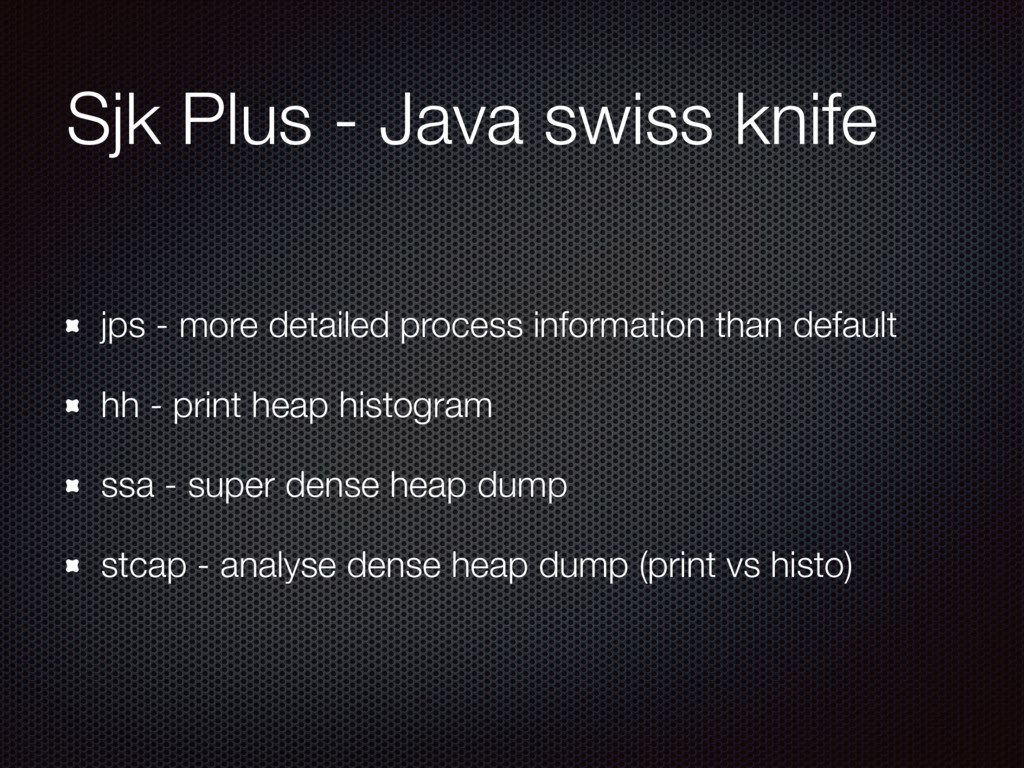
Sjk Plus - Java swiss knife jps - more detailed
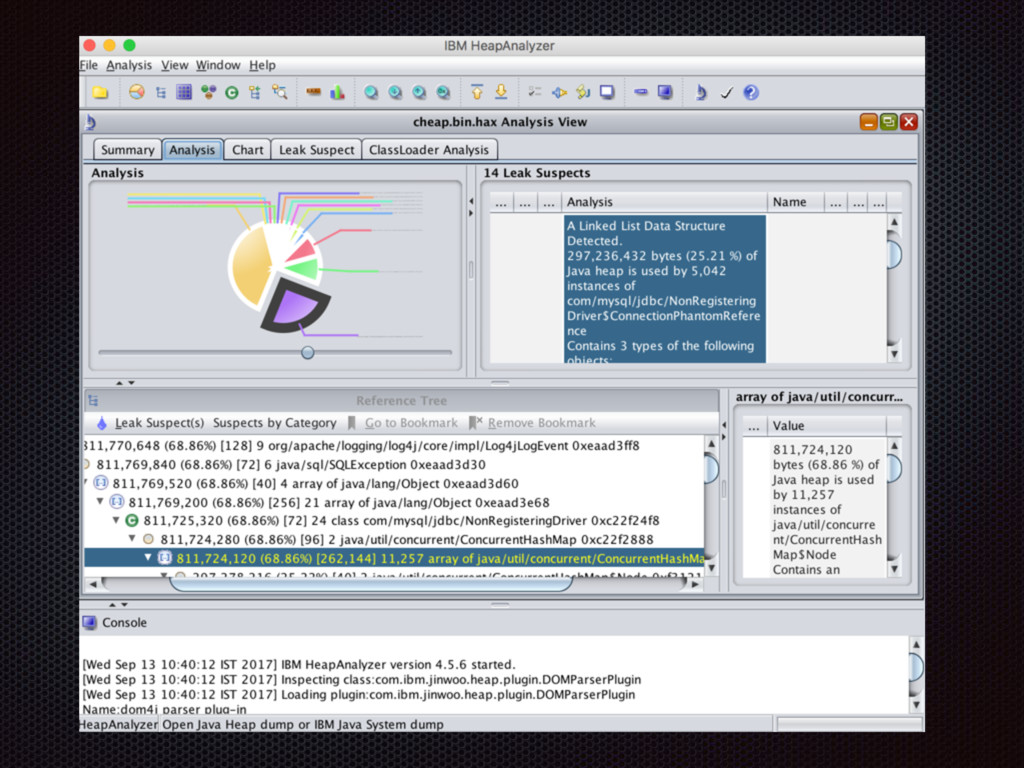
process information than default hh - print heap histogram ssa - super dense heap dump stcap - analyse dense heap dump (print vs histo)
None
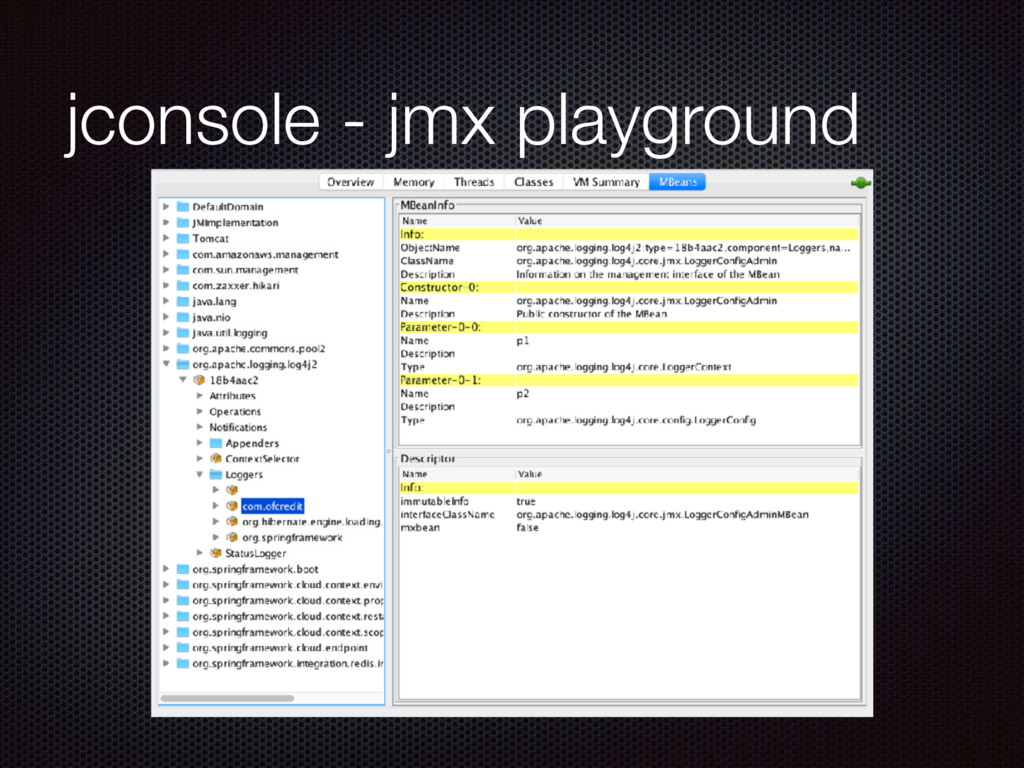
jconsole - jmx playground
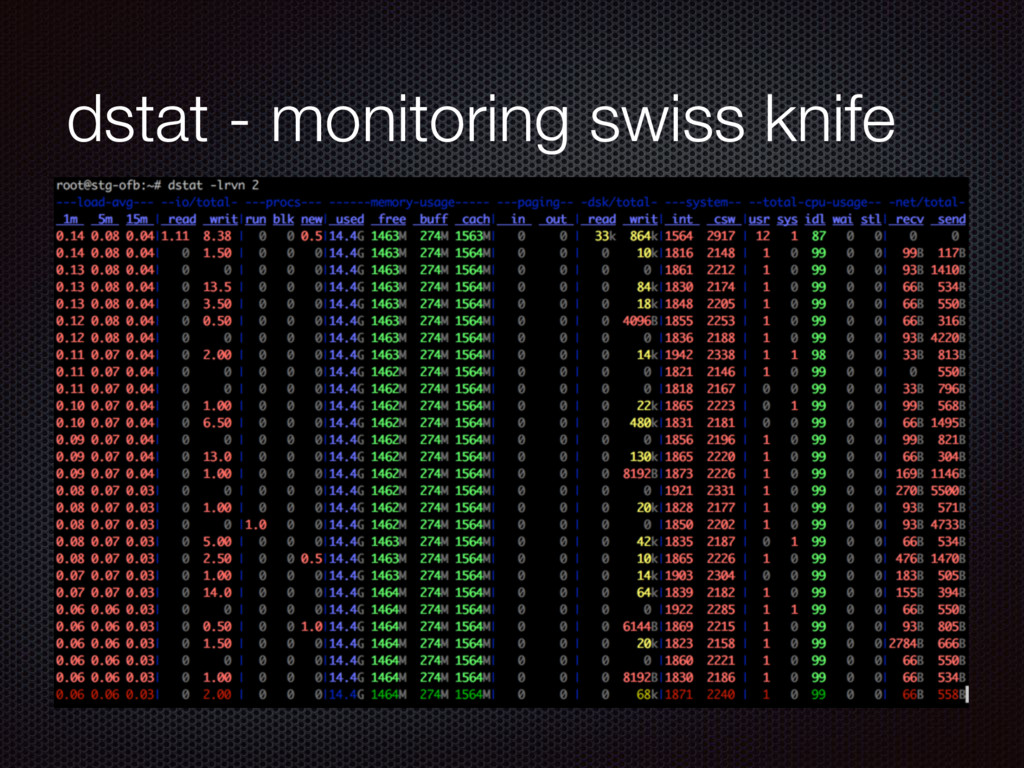
dstat - monitoring swiss knife
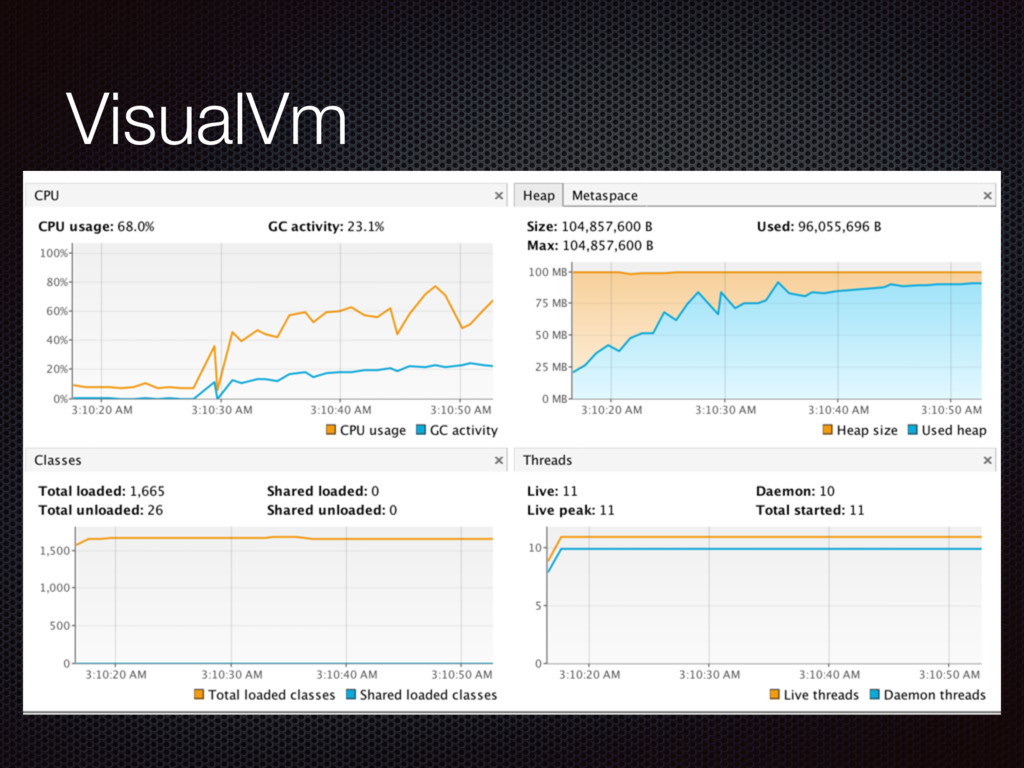
VisualVm
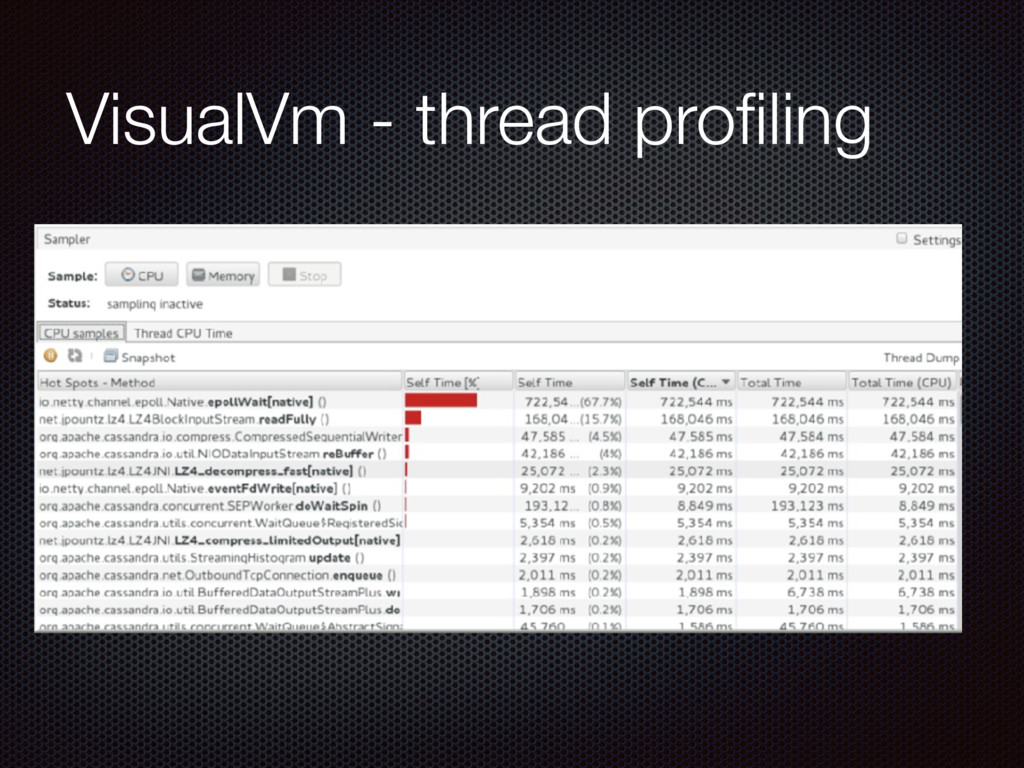
VisualVm - thread profiling
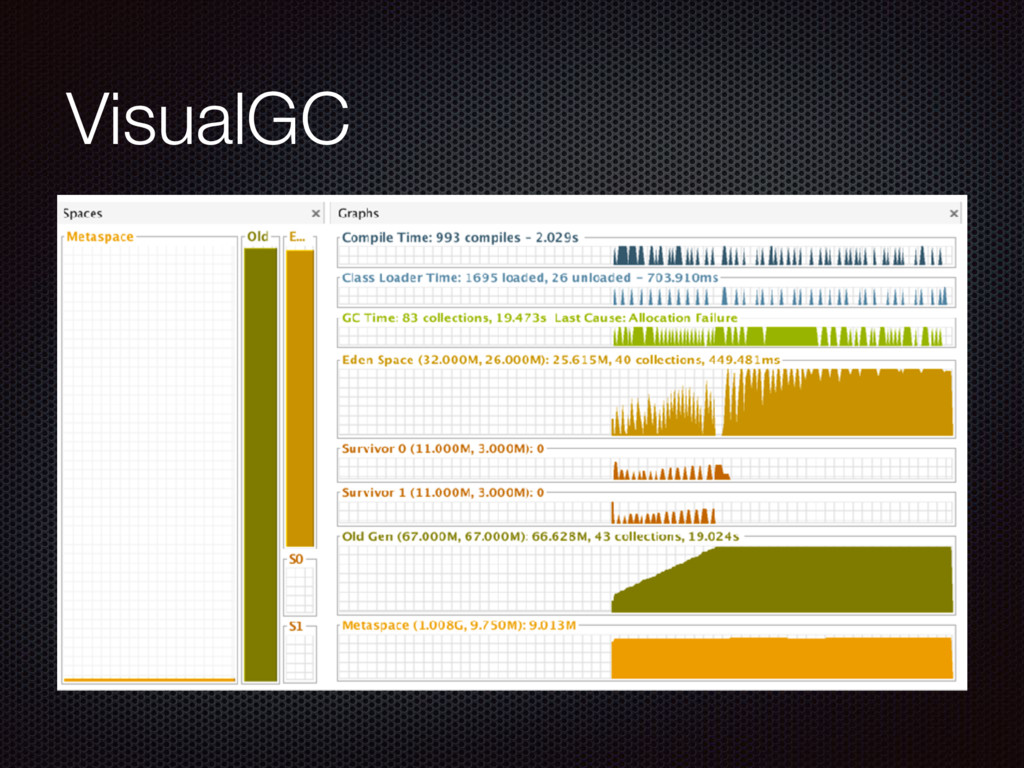
VisualGC
Demo Normal new gen demo Normal new+oldgen demo OOM demo
Sample with locking Demo of deadlock
Thank you!