Upgrade to Pro
— share decks privately, control downloads, hide ads and more …
Speaker Deck
Features
Speaker Deck
PRO
Sign in
Sign up for free
Search
Search
Visibility for web developers
Search
Bruno Renié
May 13, 2014
Technology
480
3
Share
Embed
Copy iframe code
Copy JS code
Copy link
Start on current slide
Visibility for web developers
Bruno Renié
May 13, 2014
More Decks by Bruno Renié
See All by Bruno Renié
Decentralization & real-time with PubSubHubbub
brutasse
1
190
Deployability of Python Web Applications
brutasse
17
2.4k
Stop writing settings files
brutasse
21
2.6k
Class-based Views: patterns and anti-patterns
brutasse
9
1.7k
Packager son projet Django
brutasse
4
590
Staticfiles : tout ce qu'il faut savoir, rien que ce qu'il faut savoir
brutasse
4
590
Introduction to Django
brutasse
3
460
Other Decks in Technology
See All in Technology
ローカルLLMとLINE Botの組み合わせ その3 / LINE DC Generative AI Meetup #8
you
PRO
0
130
「早く出す」より「事業に効く」 ── 顧客の業務サイクルから逆算するAI時代の二重ループ開発と「変化の設計者」 / devsumi2026
rakus_dev
1
190
勉強会企画をアプリで構造化してみた 〜そこで見えた、AIとの付き合い方〜 / I've structured a study group plan using an app.
pauli
0
340
【Claude Code】鹿野さんに聞く 私の推しの並行開発環境 大公開 / claude-code-parallel-2026-07-15
tonkotsuboy_com
10
6.4k
AI Agent SaaS を支える自社仮想化基盤への挑戦と実運用 / ai-agent-saas-virtualization
flatt_security
2
3.8k
Zoom2Youtube.Claude
kawaguti
PRO
3
490
地域 SRE コミュニティ最前線 / SRE NEXT 2026 Discussion Night Track C
muziyoshiz
0
210
誤解だらけの開発生産性 / Myths and Misconceptions about Developer Productivity
i35_267
1
220
ソニー銀行におけるビジネスアジリティ向上のためのクラウドシフト戦略
srenext
0
130
Claude Code公式skillで 自分の仕事を少しずつ手放そう!(Claude Code開発ノウハウ大公開スペシャル by クラスメソッド)
kaym
0
140
Oracle Base Database Service 技術詳細
oracle4engineer
PRO
15
110k
Text-to-SQLをAgentCoreで実現し、生成されるSQLの精度を定量的に評価する
yakumo
2
820
Featured
See All Featured
How Software Deployment tools have changed in the past 20 years
geshan
0
34k
New Earth Scene 8
popppiees
3
2.4k
Getting science done with accelerated Python computing platforms
jacobtomlinson
2
260
The Web Performance Landscape in 2024 [PerfNow 2024]
tammyeverts
12
1.2k
Un-Boring Meetings
codingconduct
0
340
How to Think Like a Performance Engineer
csswizardry
28
2.7k
The Illustrated Guide to Node.js - THAT Conference 2024
reverentgeek
1
410
The Straight Up "How To Draw Better" Workshop
denniskardys
239
140k
Rebuilding a faster, lazier Slack
samanthasiow
85
9.6k
Product Roadmaps are Hard
iamctodd
55
12k
XXLCSS - How to scale CSS and keep your sanity
sugarenia
249
1.3M
Designing for humans not robots
tammielis
254
26k
Transcript
Visibility for Web Developers Bruno Renié Django Island 2014
Working with ops & support staff Large infrastructure, lots of
moving parts whoami: lead dev @ exoscale
People need to know what's going on, anytime Not everyone
is a developer SSH, grep and tail not acceptable
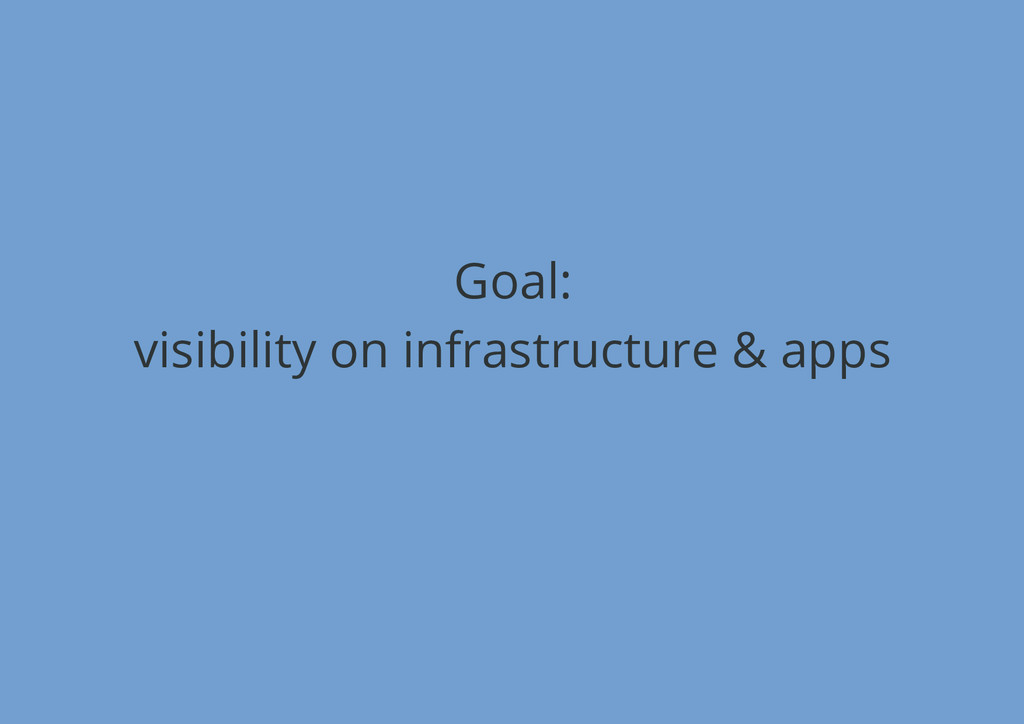
Goal: visibility on infrastructure & apps
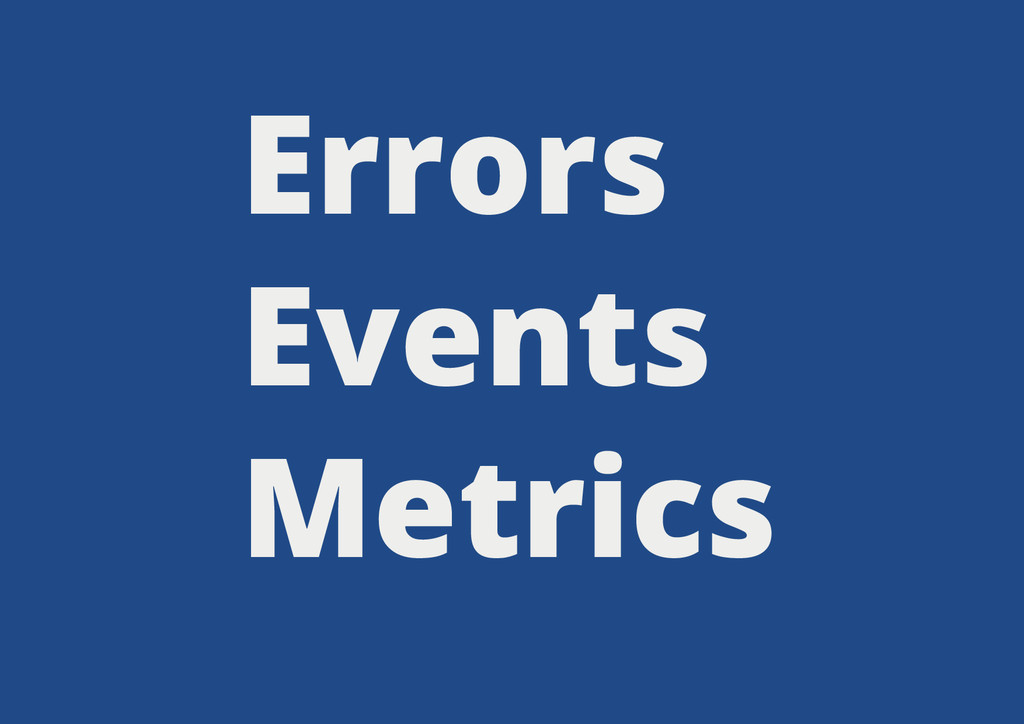
Errors Events Metrics
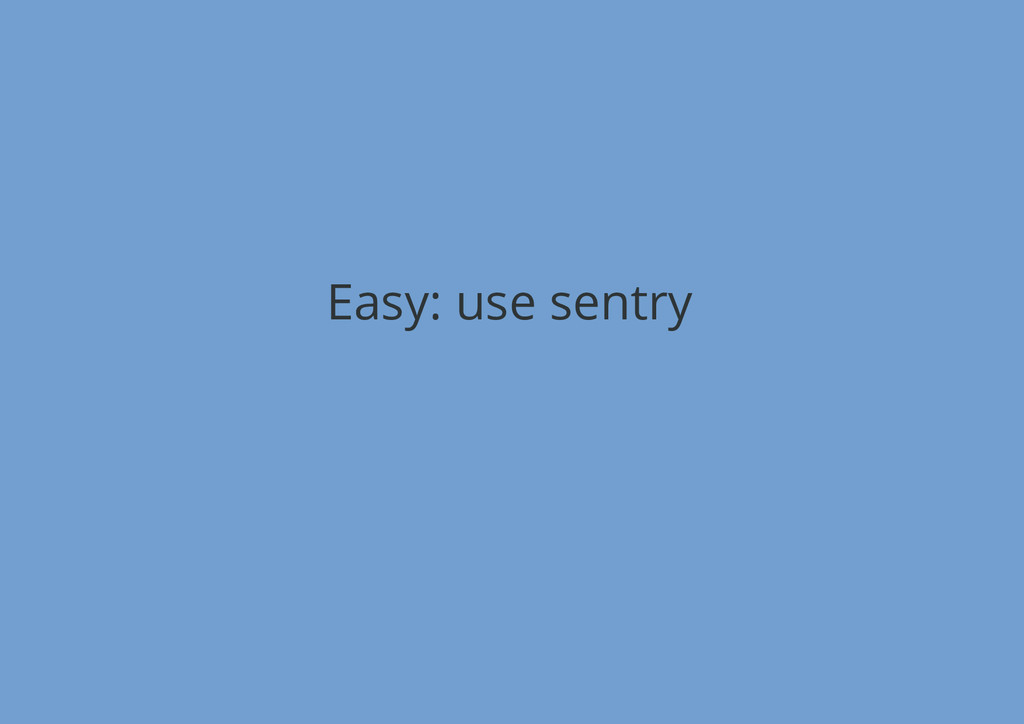
Errors
Easy: use sentry
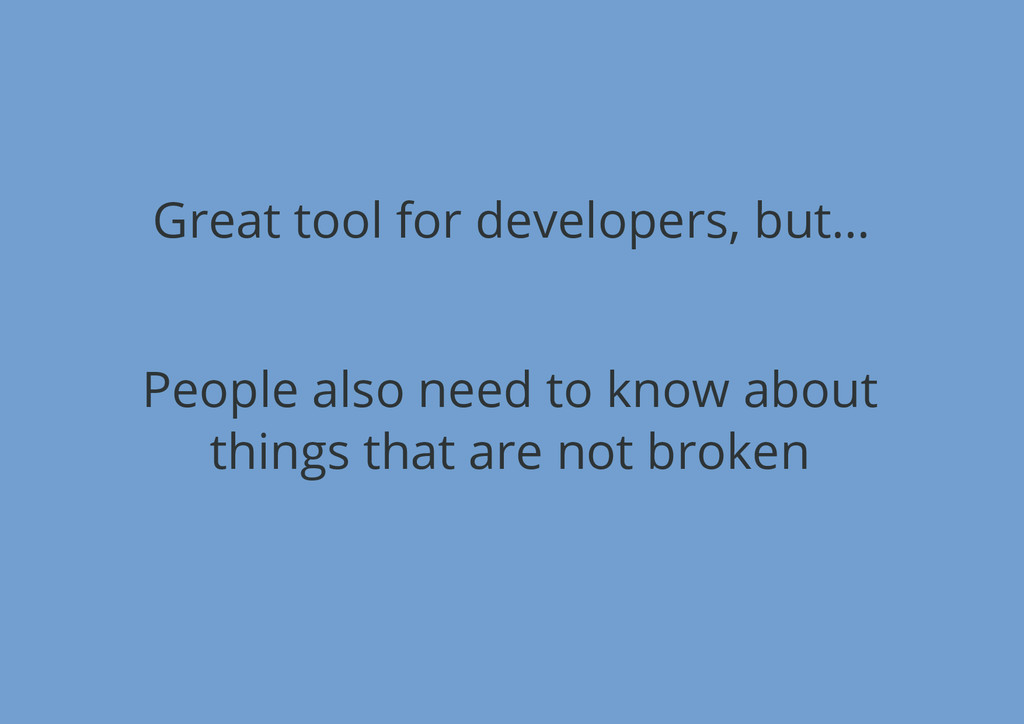
Great tool for developers, but… People also need to know
about things that are not broken
Events
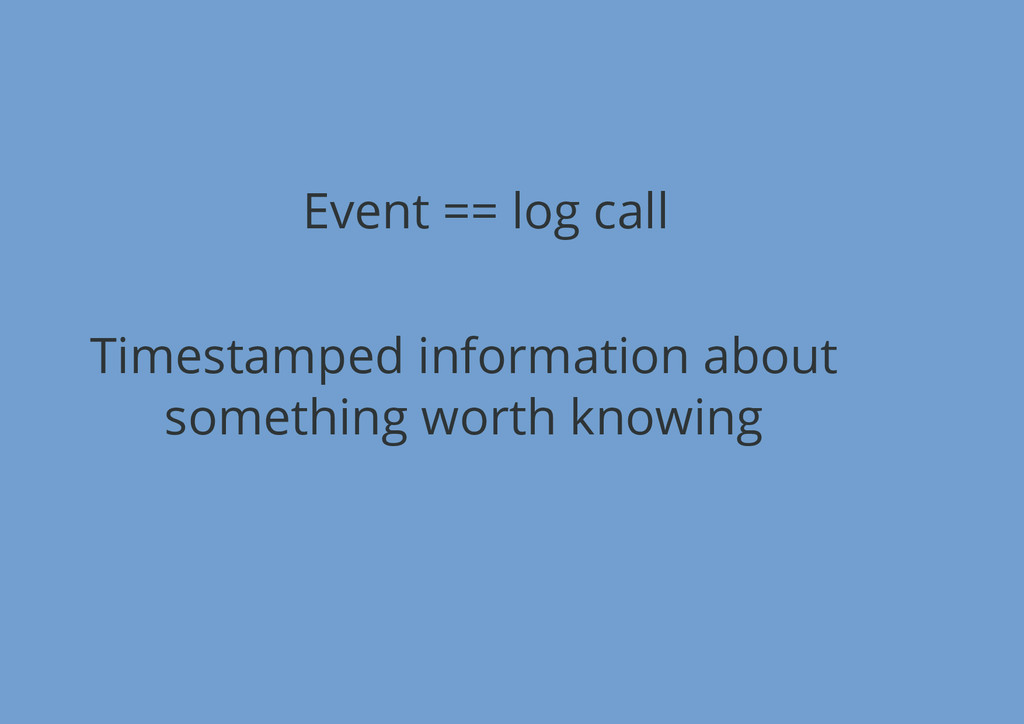
Event == log call Timestamped information about something worth knowing
Easy to emit logs Searching on remote machines, not so
much
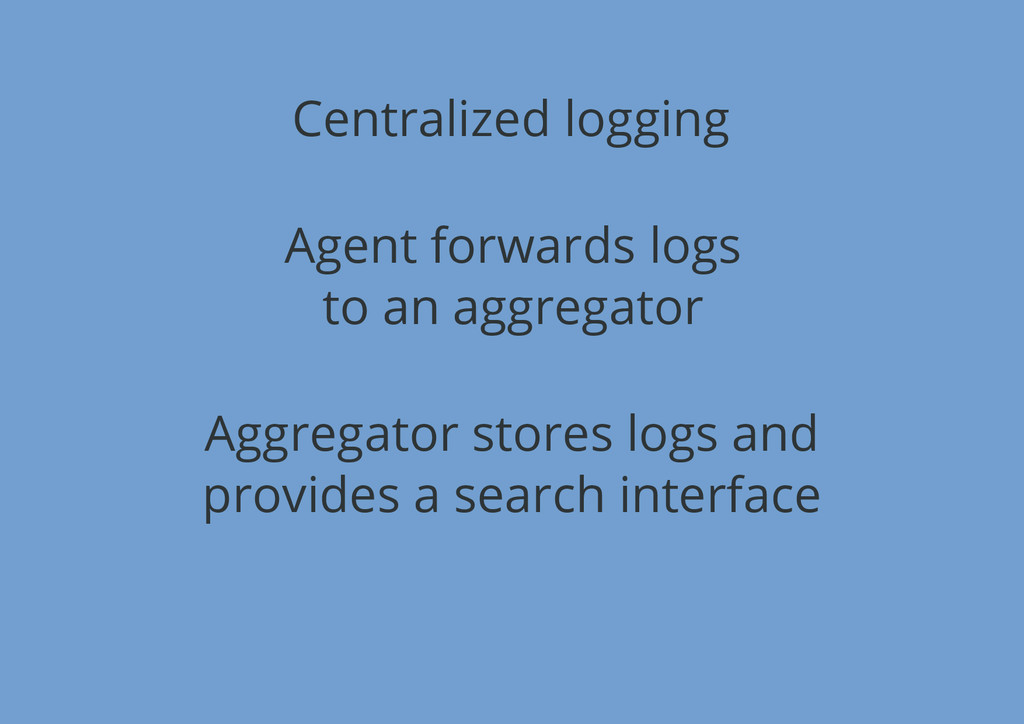
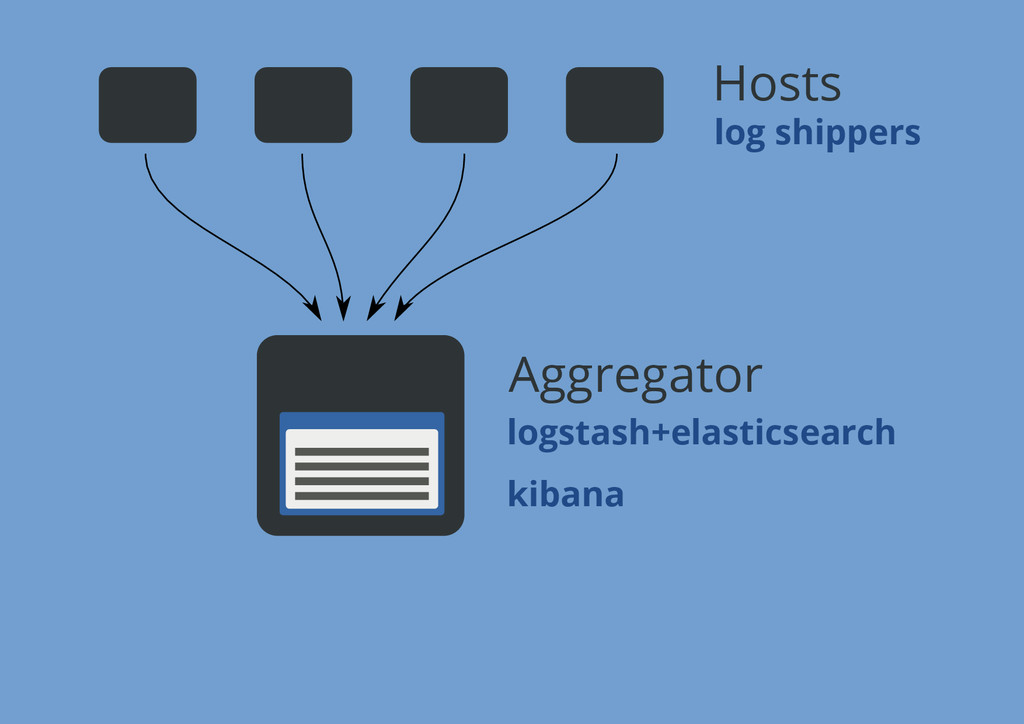
Centralized logging Agent forwards logs to an aggregator Aggregator stores
logs and provides a search interface
Aggregator Hosts logstash+elasticsearch kibana log shippers
Collecting logs rsyslog / syslog-ng logstash-forwarder (lumberjack) logstash
In Python logging.handlers.SyslogHandler
Centralizing isn't enough
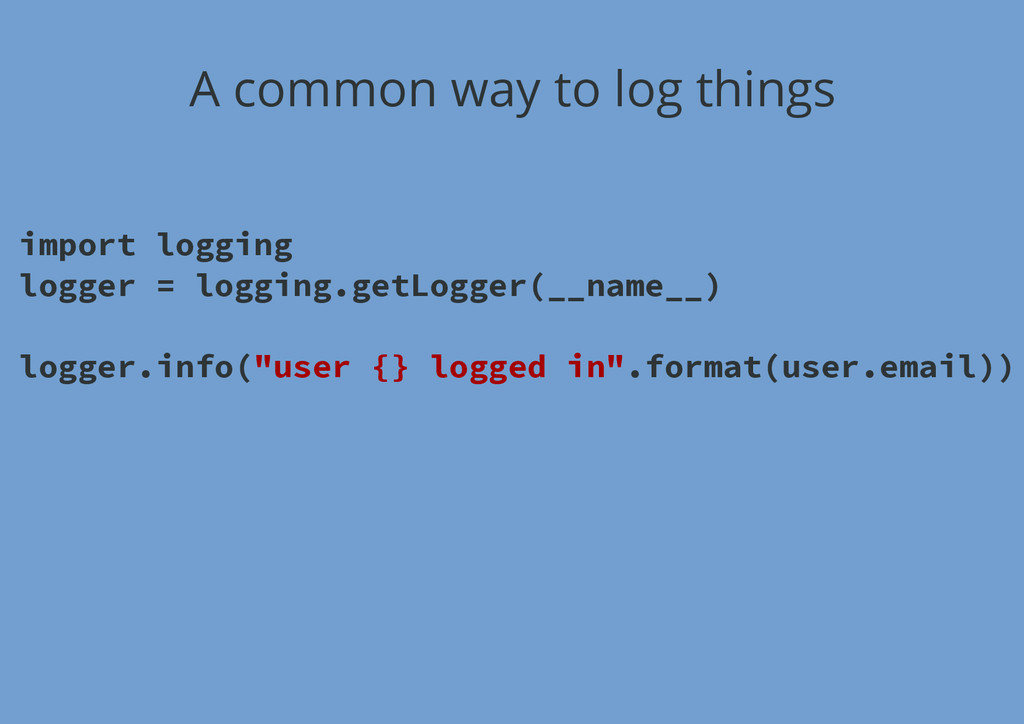
A common way to log things import logging logger =
logging.getLogger(__name__) logger.info("user {} logged in".format(user.email))
Not much information No structure
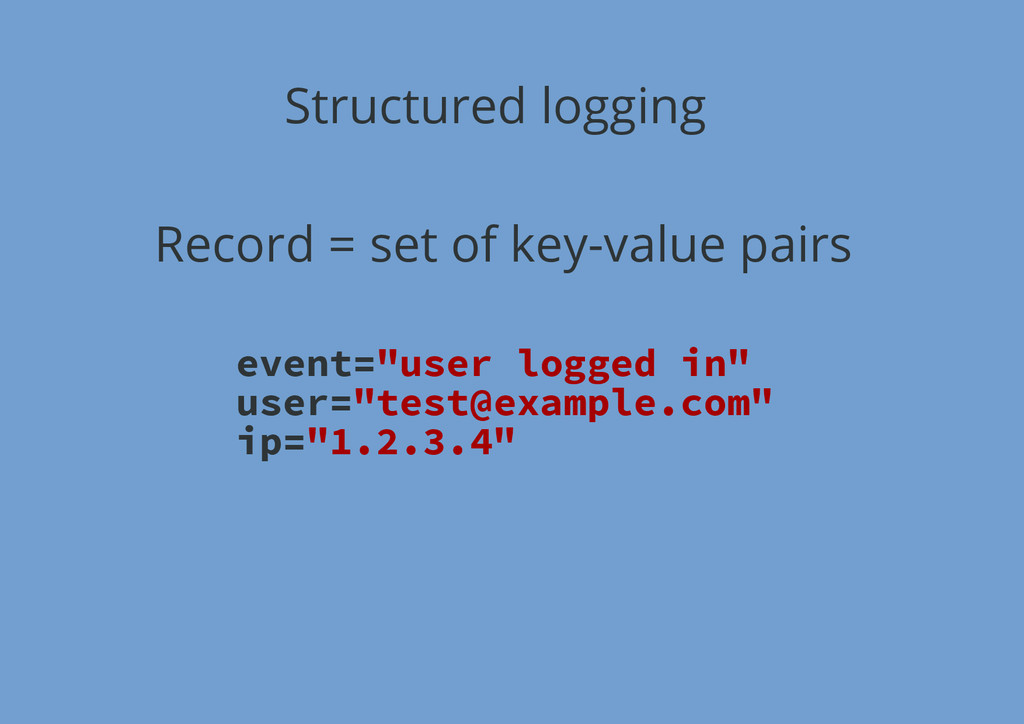
Structured logging Record = set of key-value pairs event="user logged
in" user="
[email protected]
" ip="1.2.3.4"
In Python: pip install structlog Hynek Schlawack logger = structlog.get_logger()
logger.info("user logged in", user="
[email protected]
" ip="1.2.3.4") {"event": "user.login", "user": "
[email protected]
", "host": "1.2.3.4"}
Contextual loggers log = logger.bind(user=request.user.email) log.info("payment", amount=120, currency="CHF") {"event": "payment",
"user": "
[email protected]
", "amount": 120, "currency": "CHF"}
structlog JSON elasticsearch Rich data for building dashboards
Demo
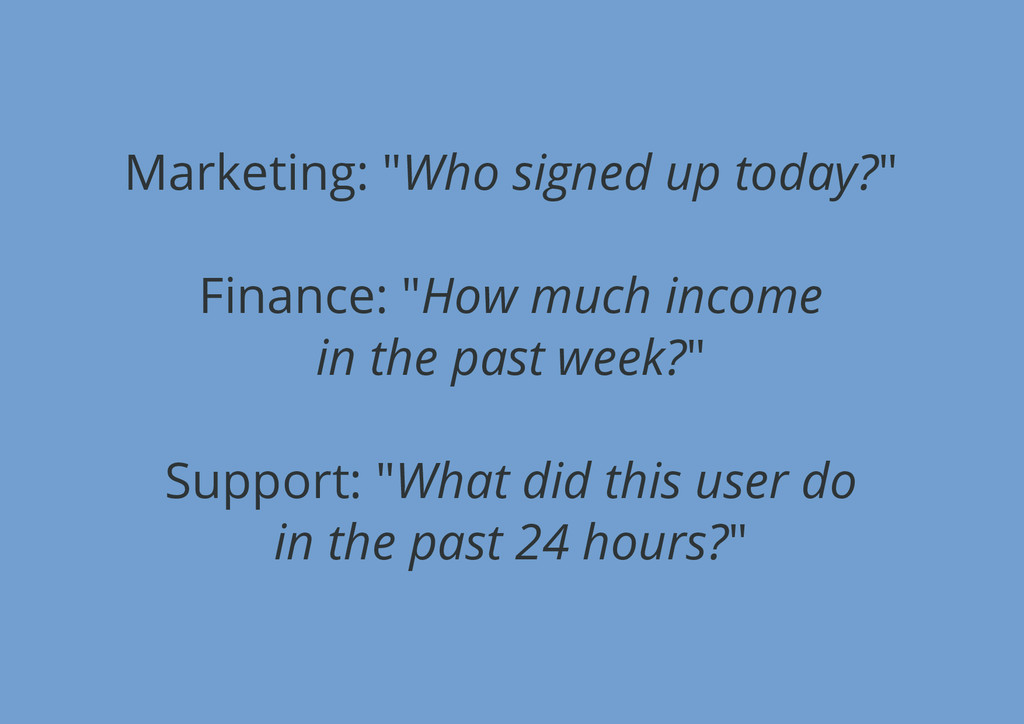
Marketing: "Who signed up today?" Finance: "How much income in
the past week?" Support: "What did this user do in the past 24 hours?"
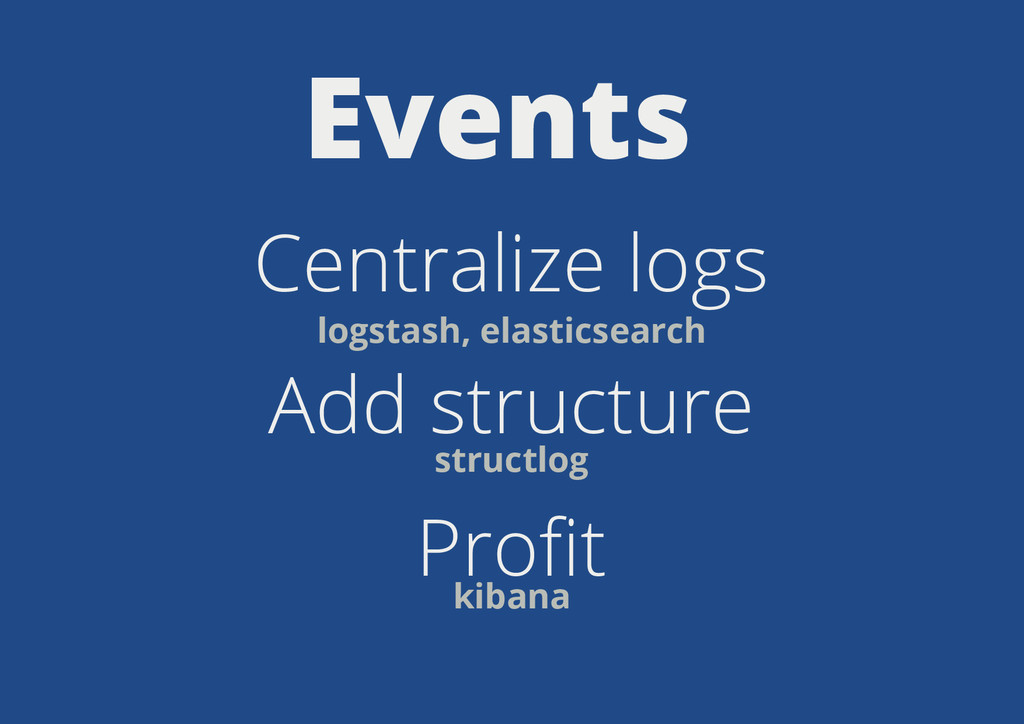
Events Centralize logs Add structure Profit logstash, elasticsearch structlog kibana
Metrics
Time series data Continuous, regular intervals Big player: graphite ecosystem
carbon whisper graphite
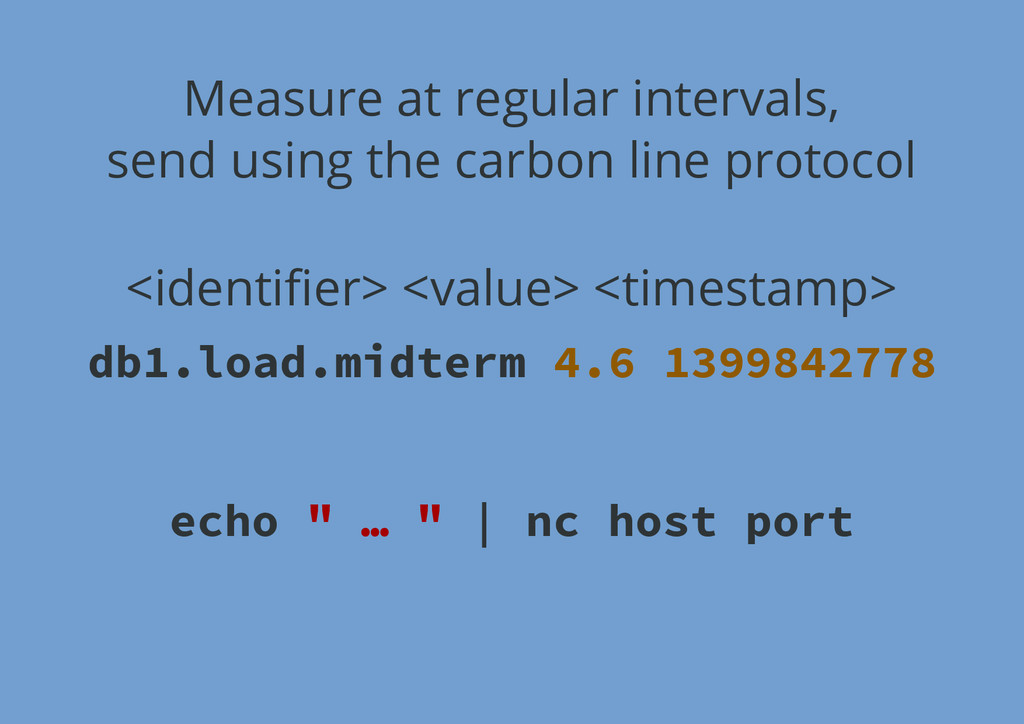
<identifier> <value> <timestamp> db1.load.midterm 4.6 1399842778 Measure at regular intervals,
send using the carbon line protocol echo " … " | nc host port
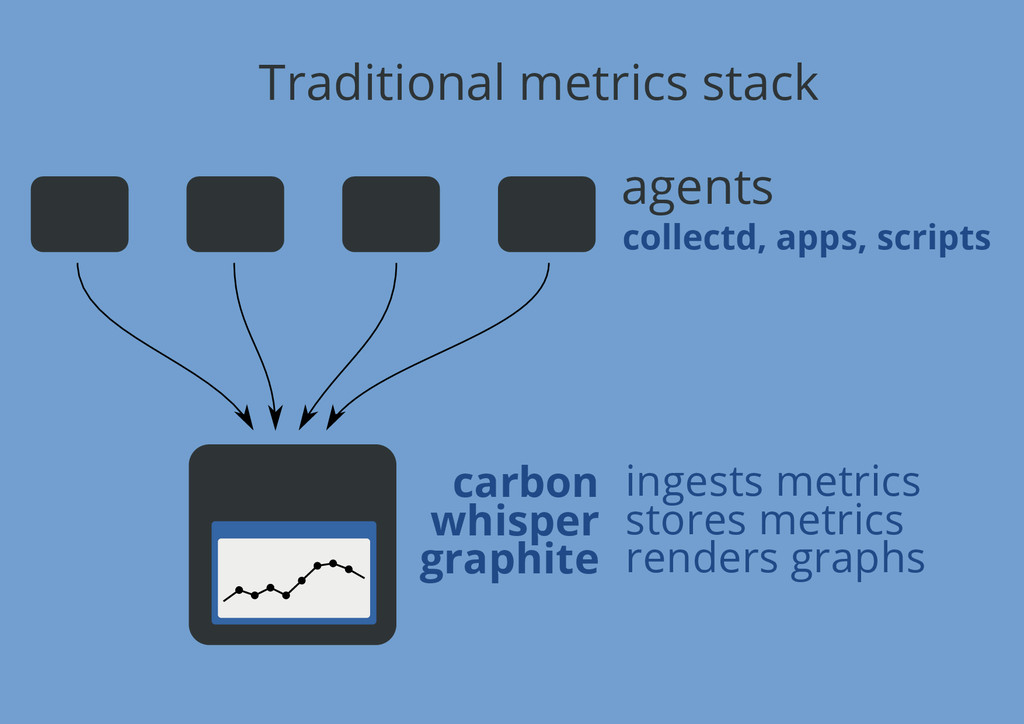
Traditional metrics stack agents collectd, apps, scripts carbon whisper graphite
ingests metrics stores metrics renders graphs
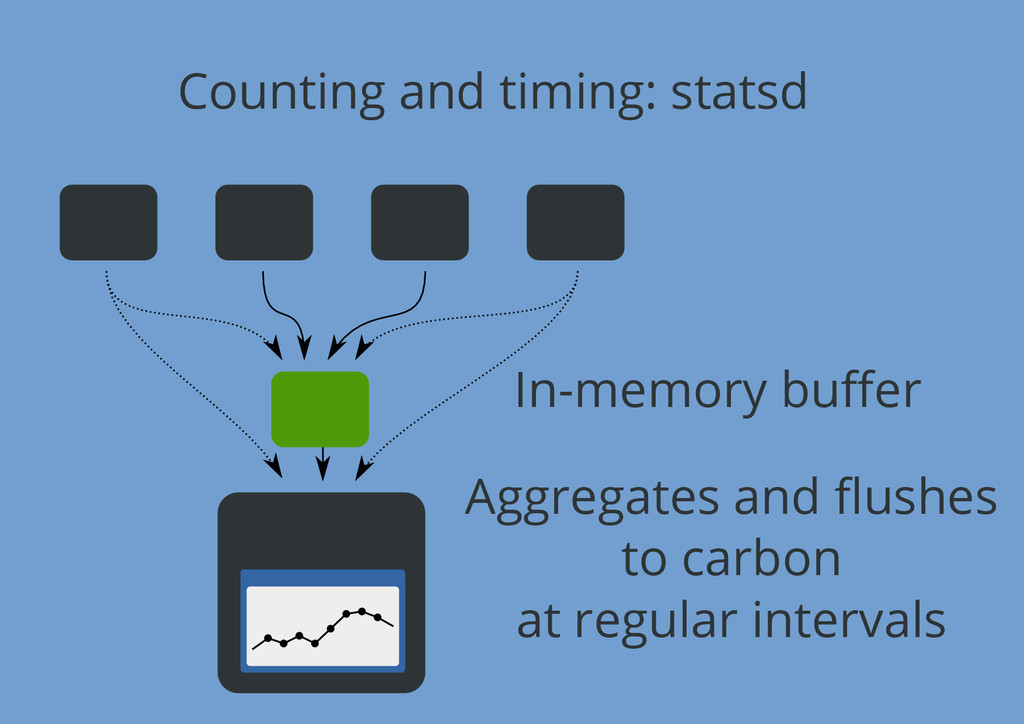
Counting and timing: statsd In-memory buffer Aggregates and flushes to
carbon at regular intervals
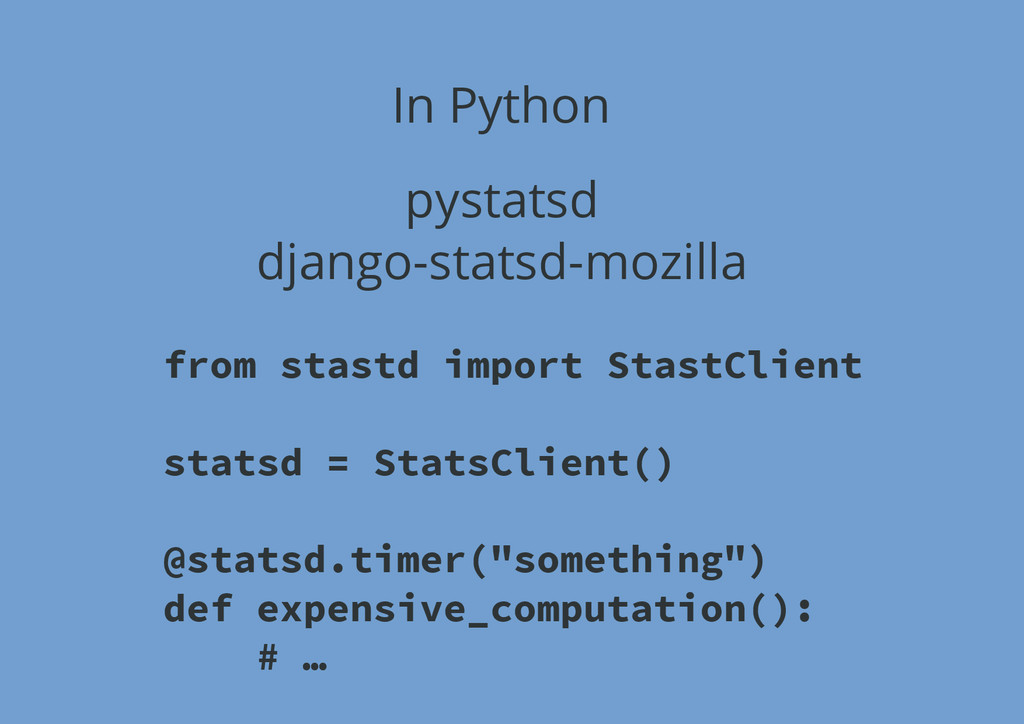
In Python pystatsd django-statsd-mozilla from stastd import StastClient statsd =
StatsClient() @statsd.timer("something") def expensive_computation(): # …
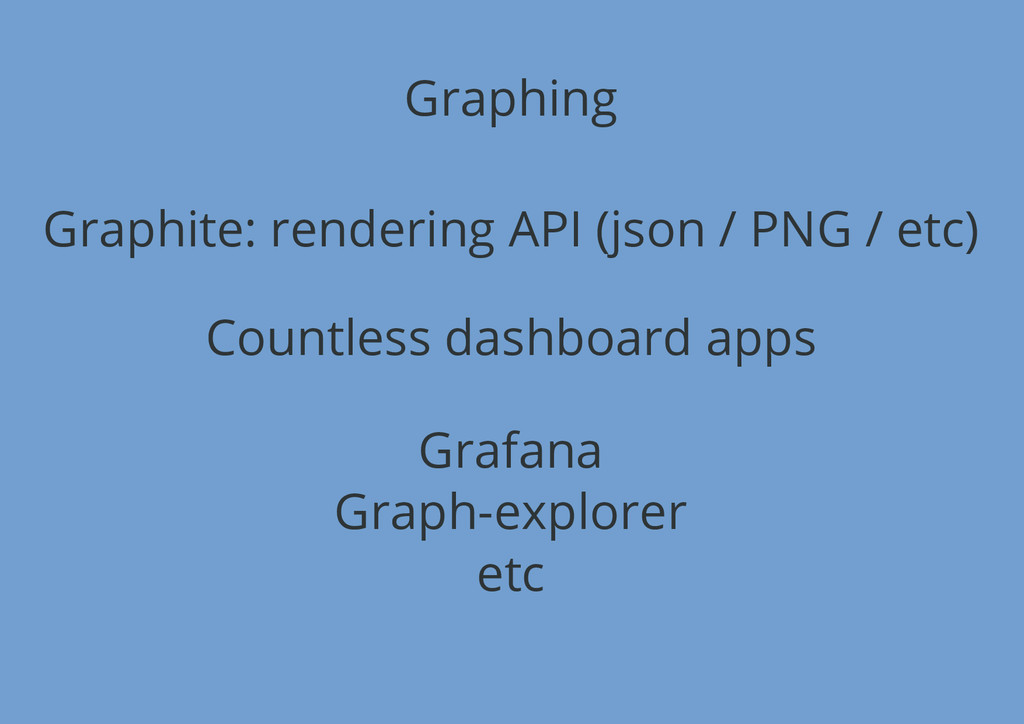
Graphing Graphite: rendering API (json / PNG / etc) Countless
dashboard apps Grafana Graph-explorer etc
Demo
What about alerts? Riemann: metrics hub/proxy App server overloaded, full
disk, etc Analyzes metrics computes aggregates notifies
Demo
we are hiring! Questions! @brutasse Image credits: http://en.wikipedia.org/wiki/Explosion
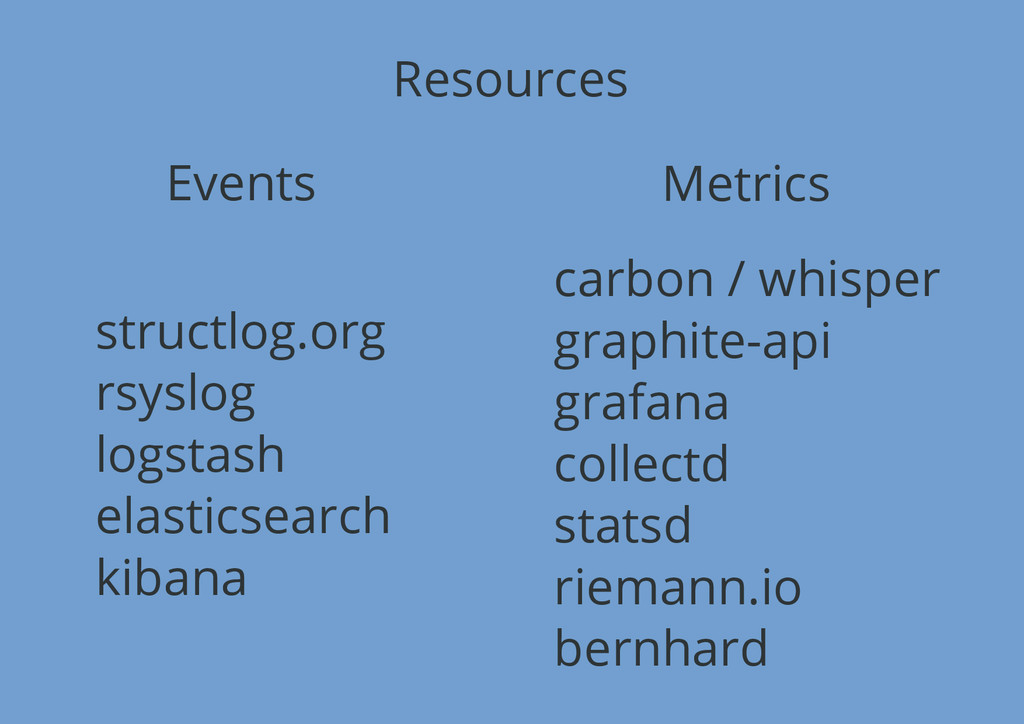
Resources Events Metrics structlog.org rsyslog logstash elasticsearch kibana carbon /
whisper graphite-api grafana collectd statsd riemann.io bernhard
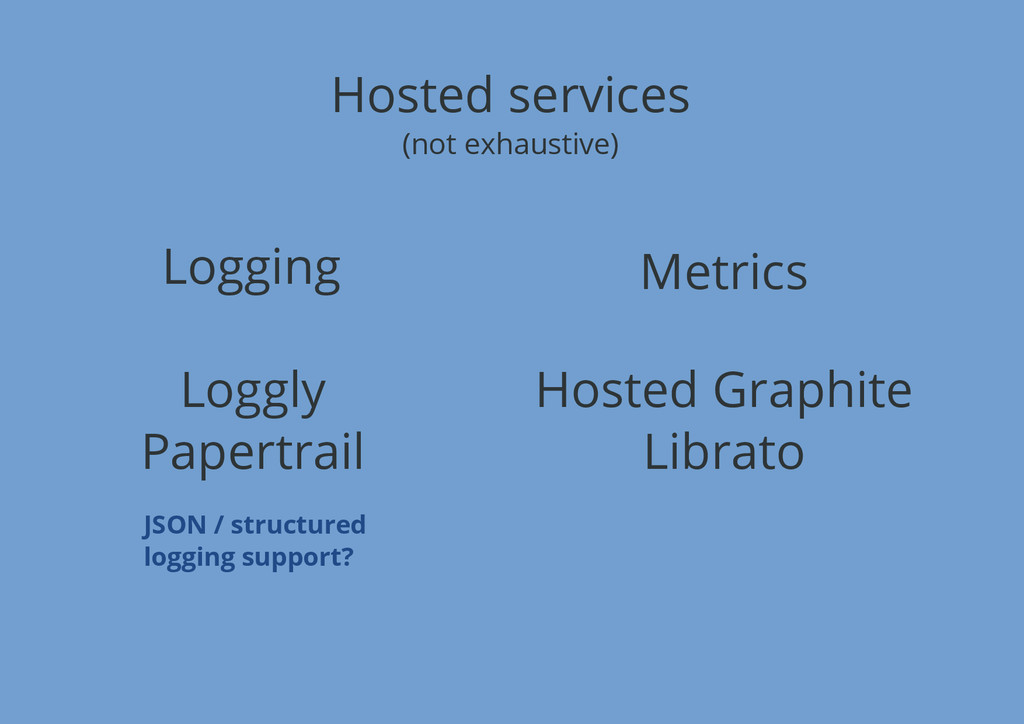
Hosted services (not exhaustive) Logging Metrics Loggly Papertrail Hosted Graphite
Librato JSON / structured logging support?