Team-Meetings. May 21st
Summary:
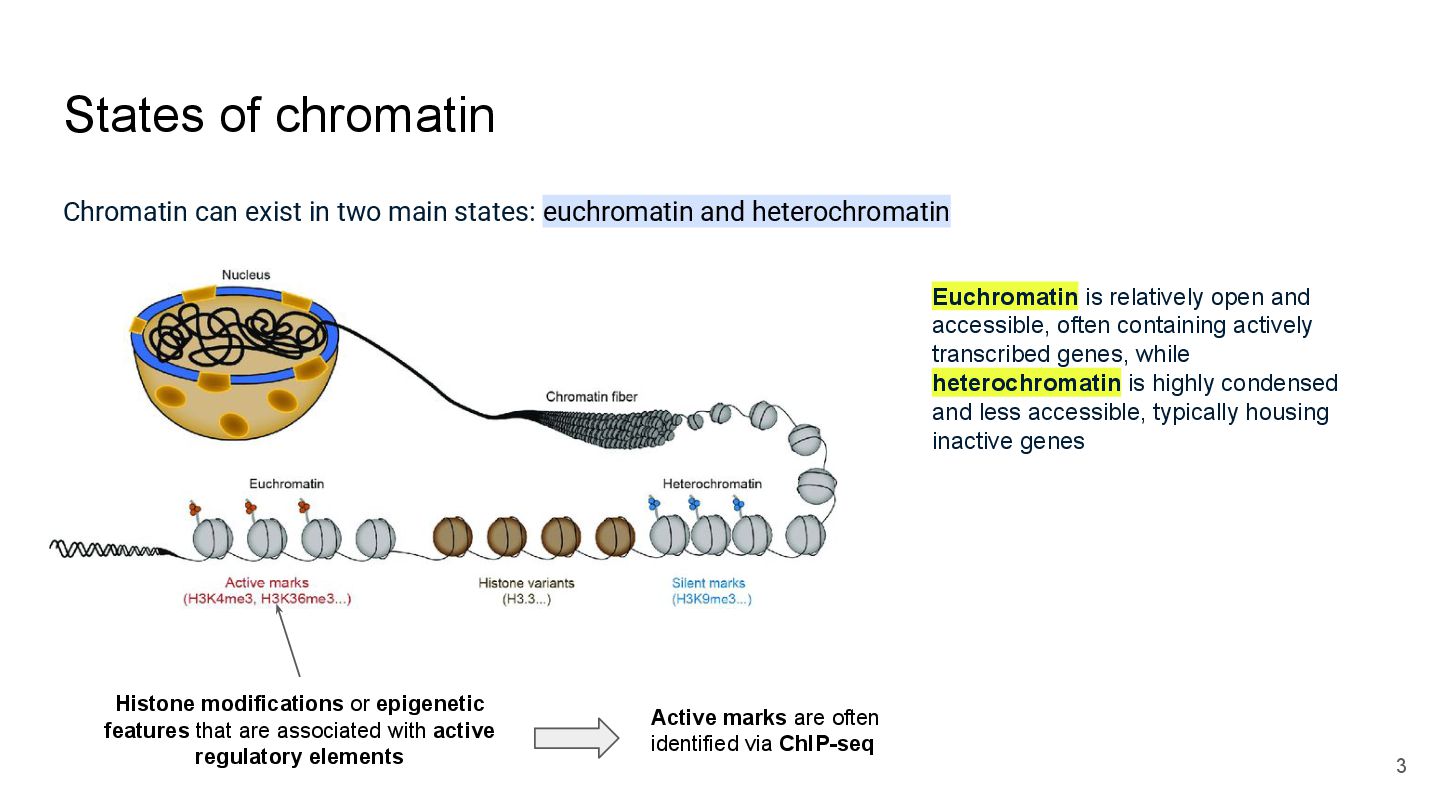
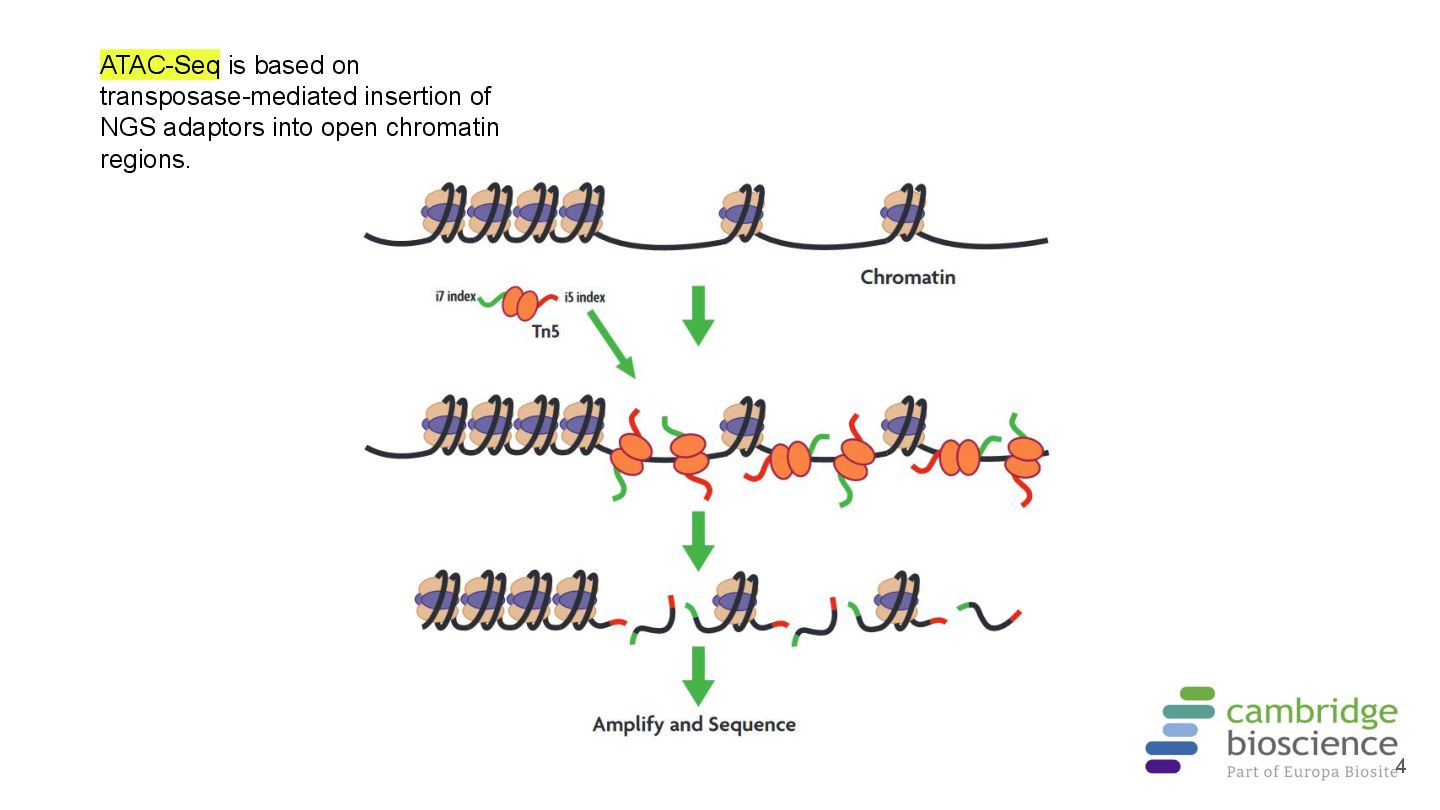
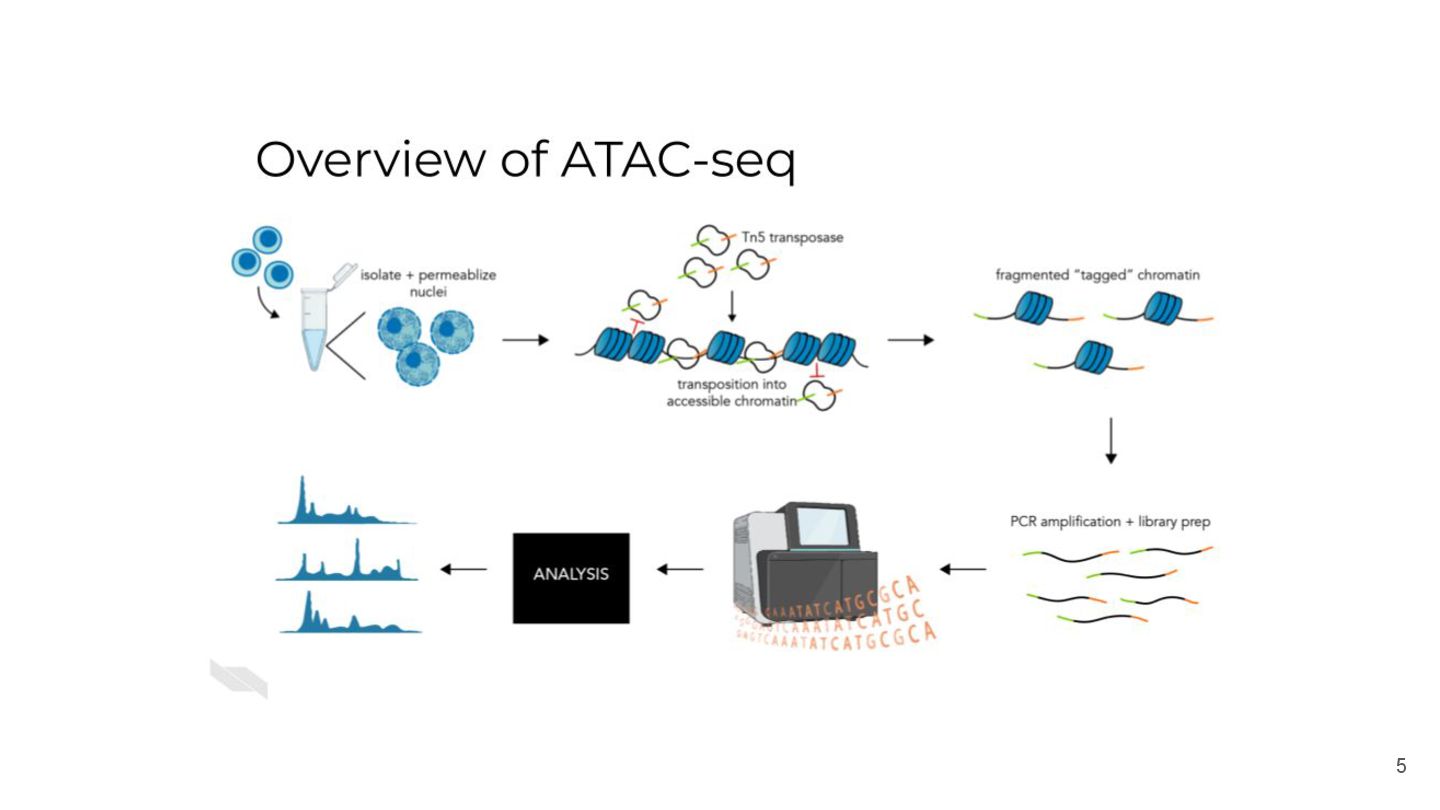
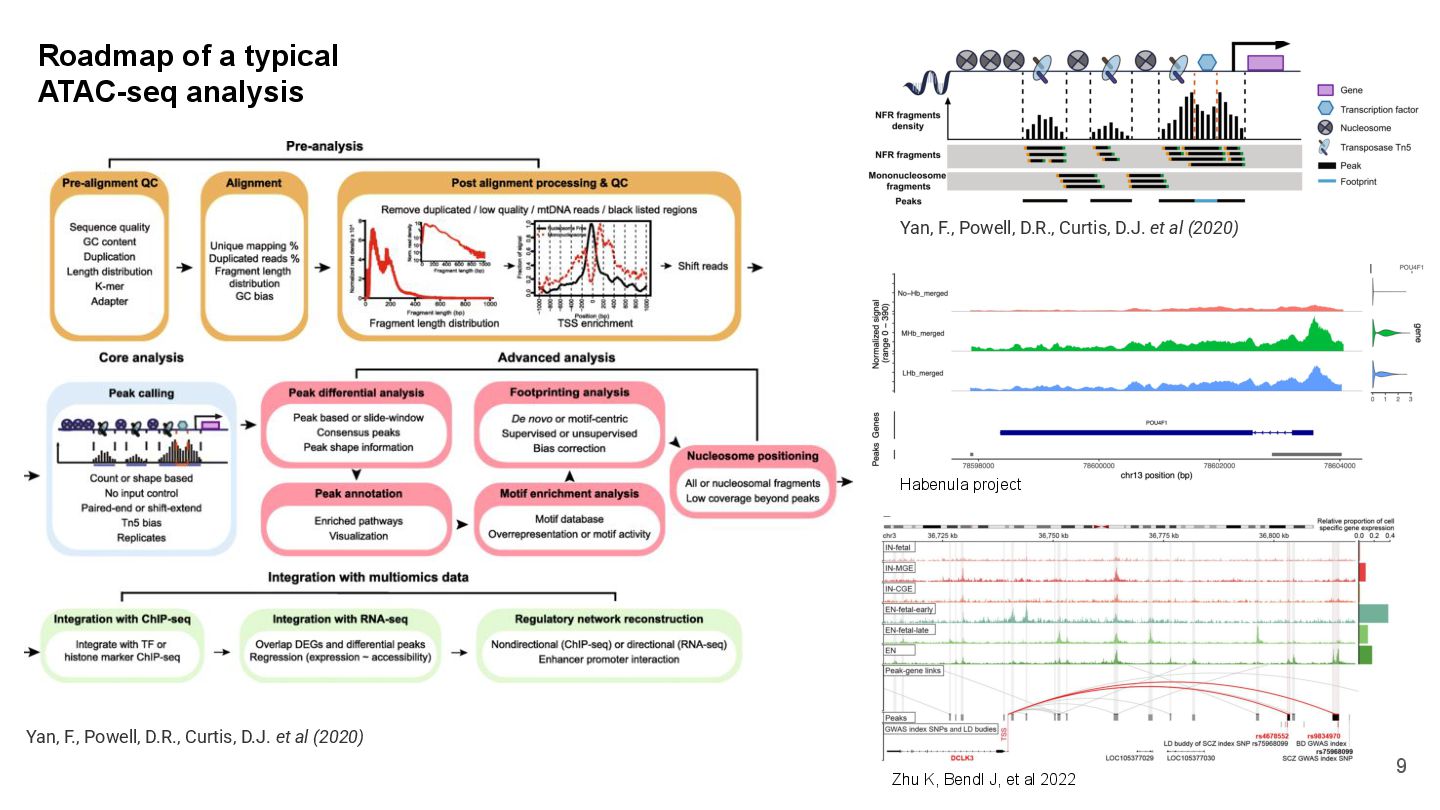
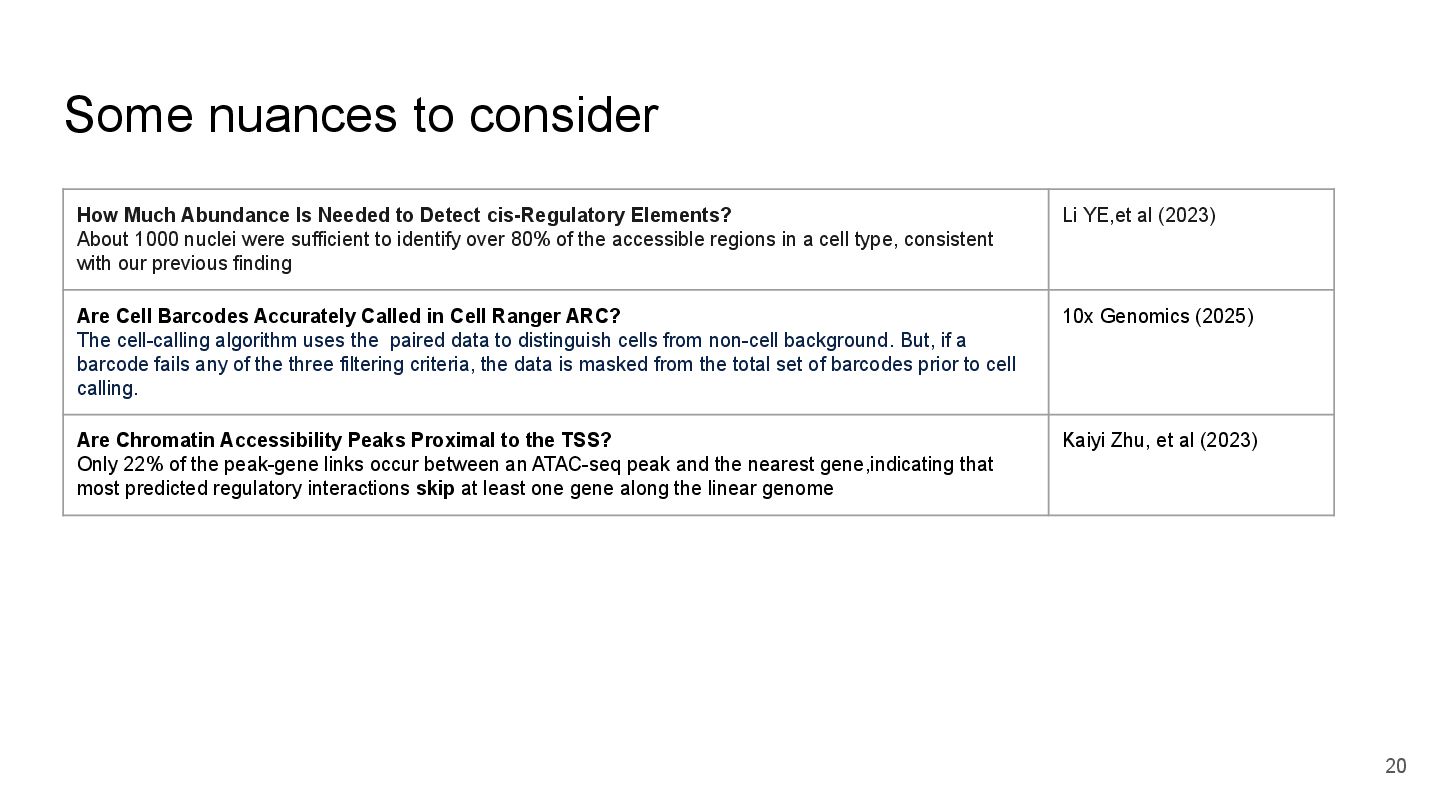
scATAC-seq enables the discovery of regulatory landscapes by profiling chromatin accessibility at single-cell resolution, revealing cell-specific regulatory mechanisms.
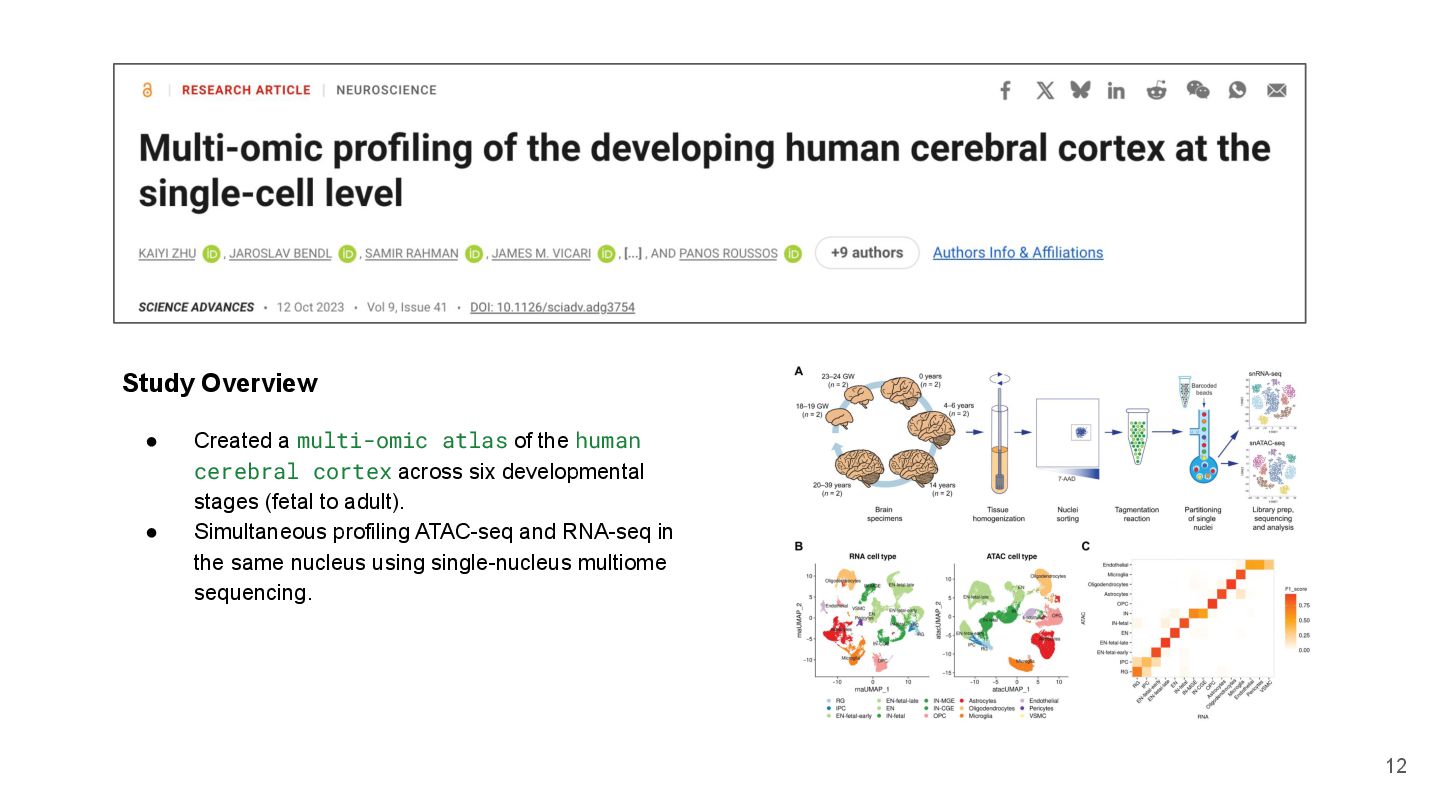
Multi-omic approaches, which integrate chromatin accessibility and gene expression from the same nucleus, provide enhanced biological insights. In contrast, separate analyses offer greater flexibility in experimental design and tool selection.
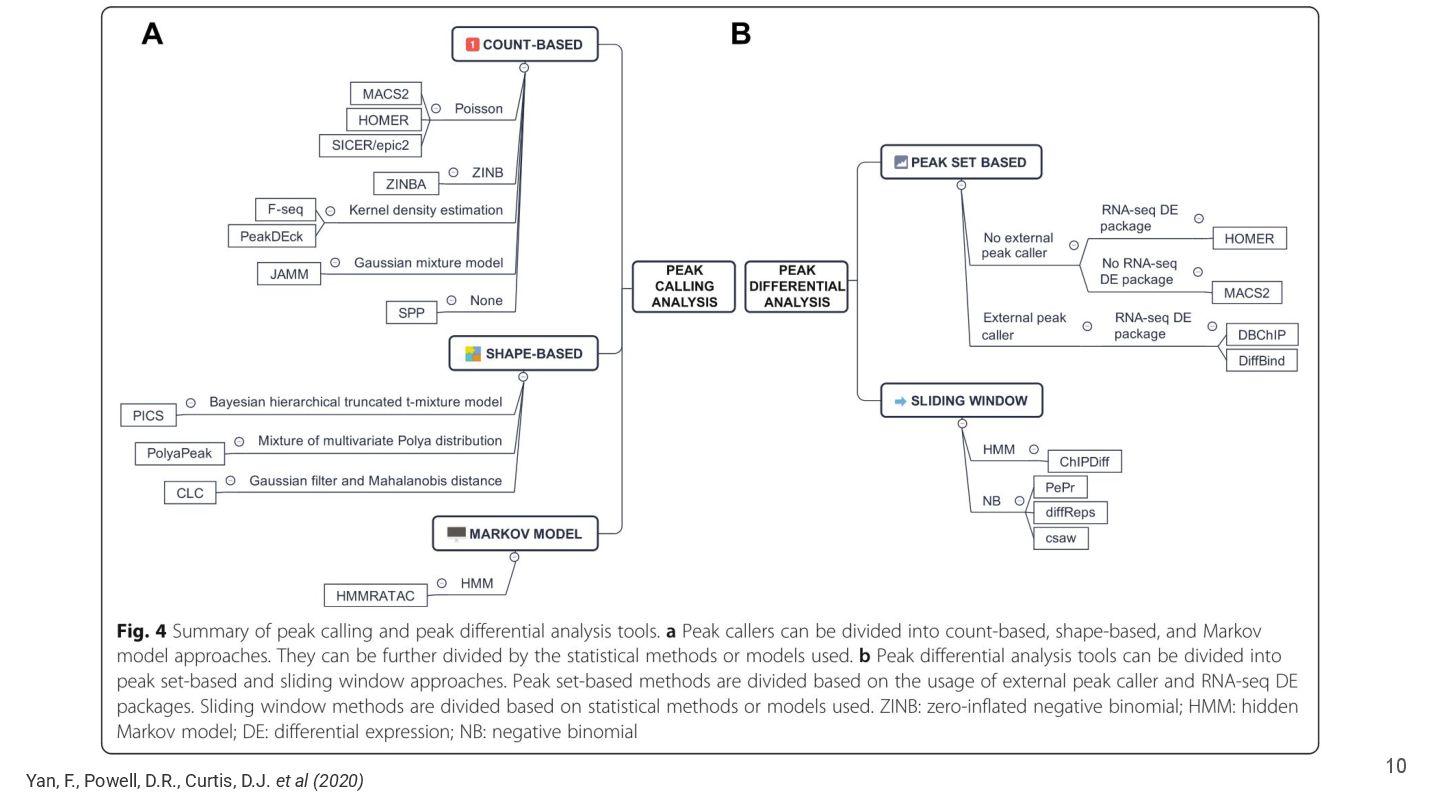
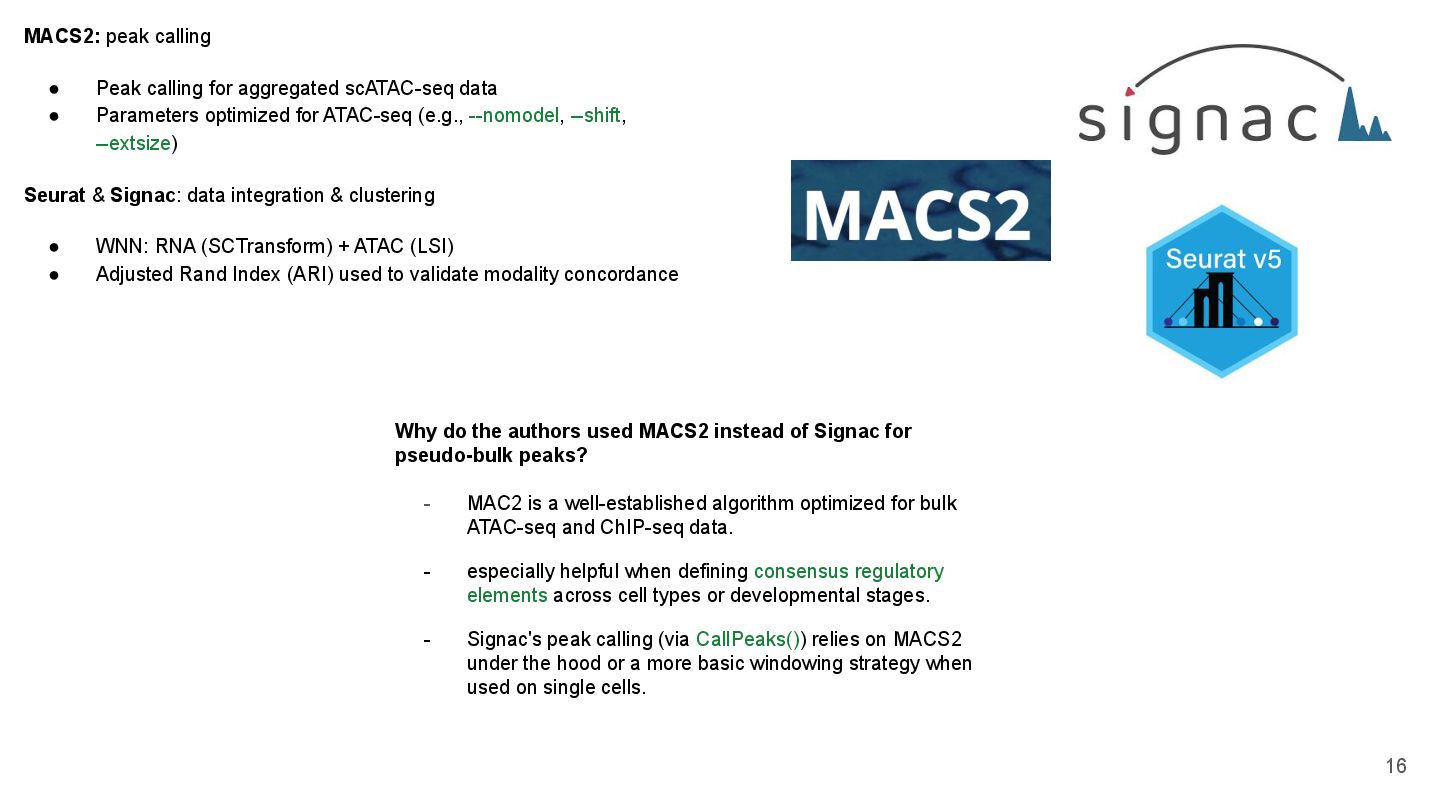
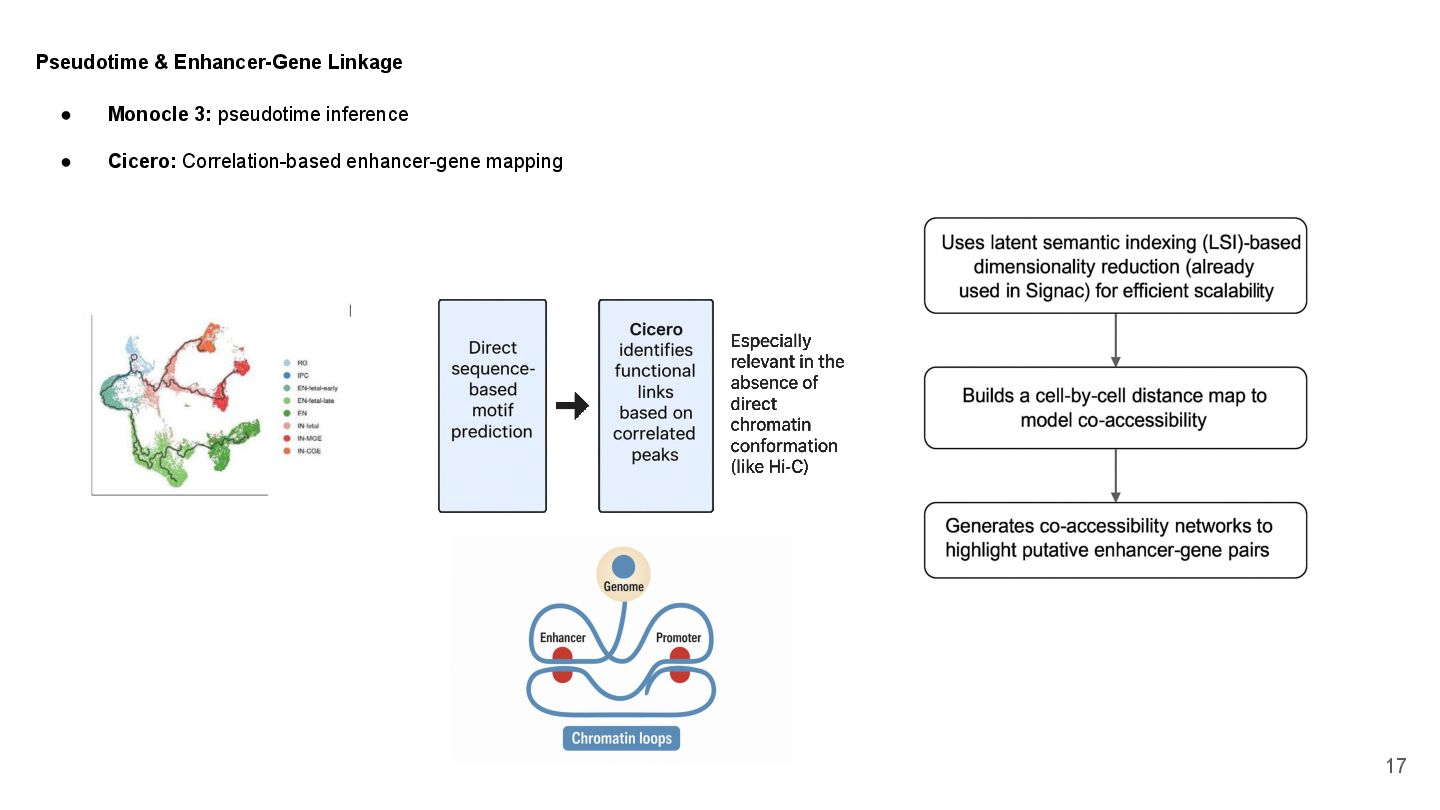
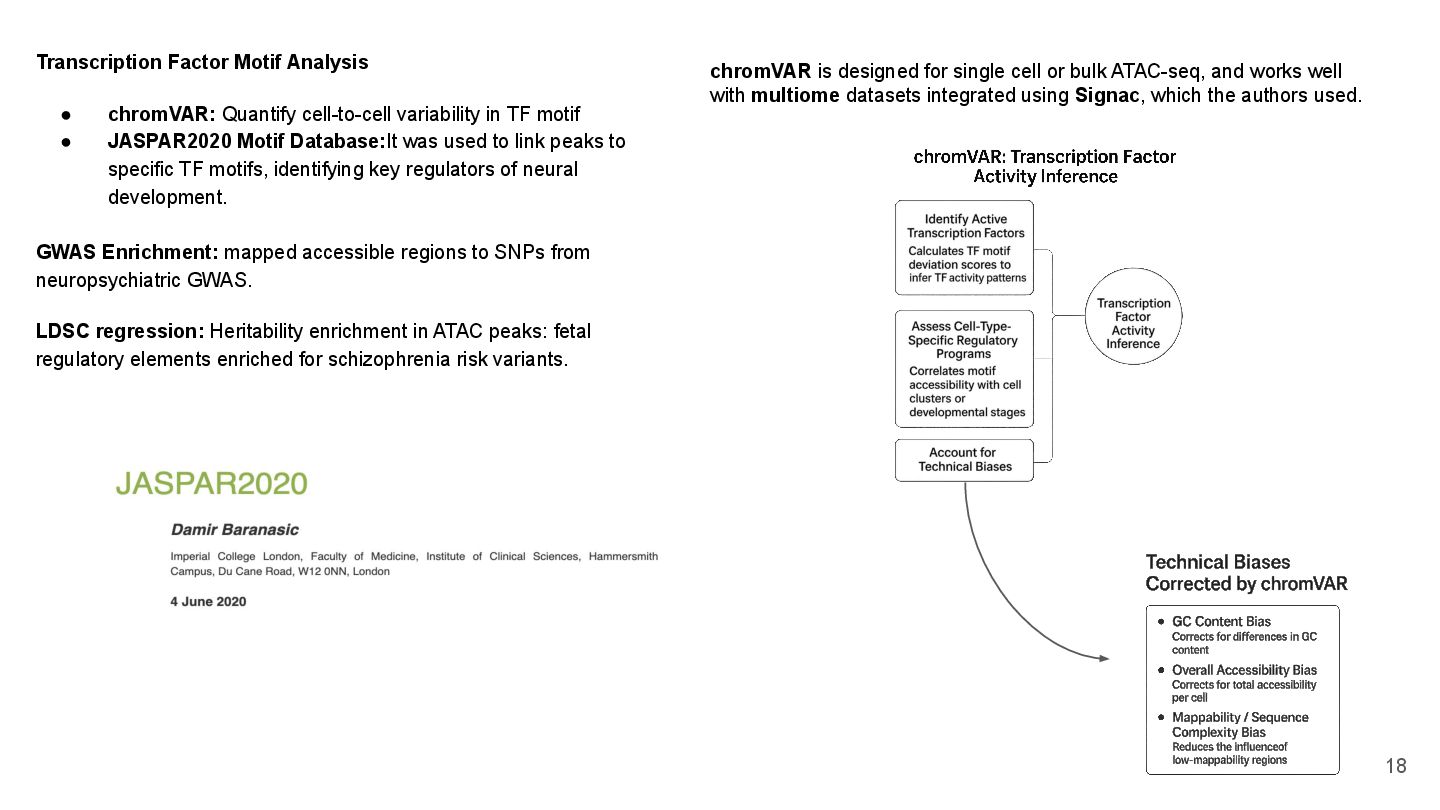
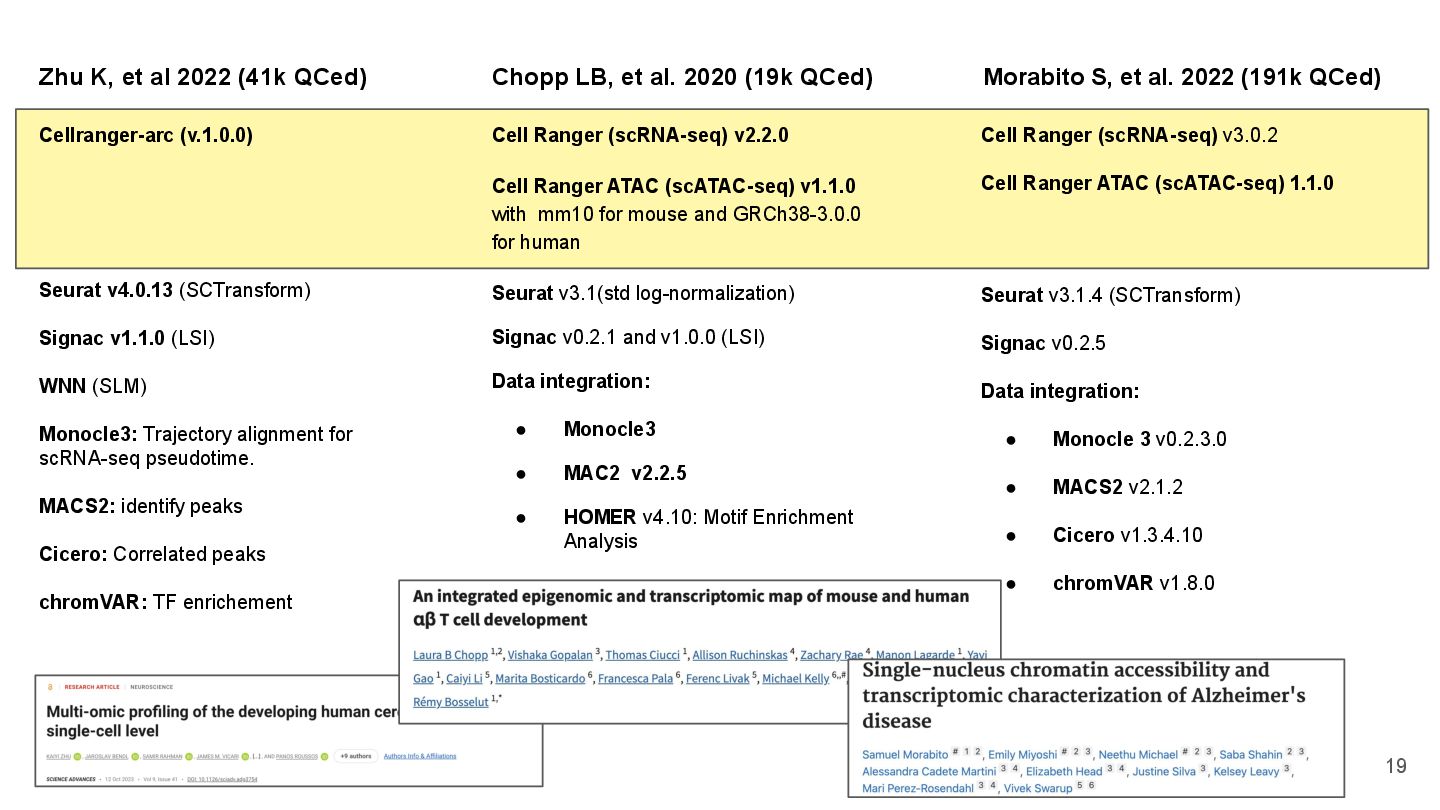
Key tools like Seurat, Signac, MACS2, Cicero, and chromVAR form a powerful framework for data processing, clustering, enhancer-gene linkage, and transcription factor motif analysis.
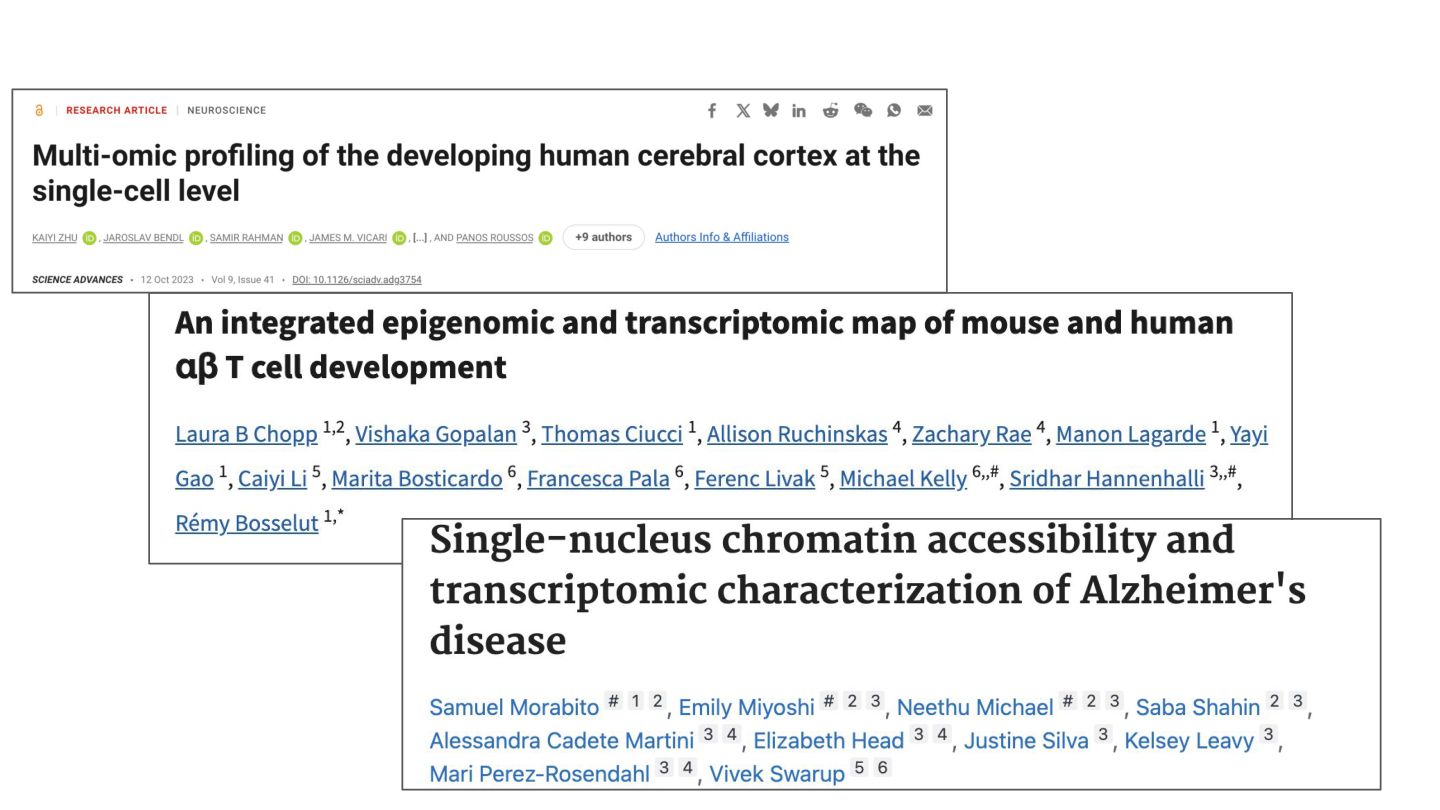
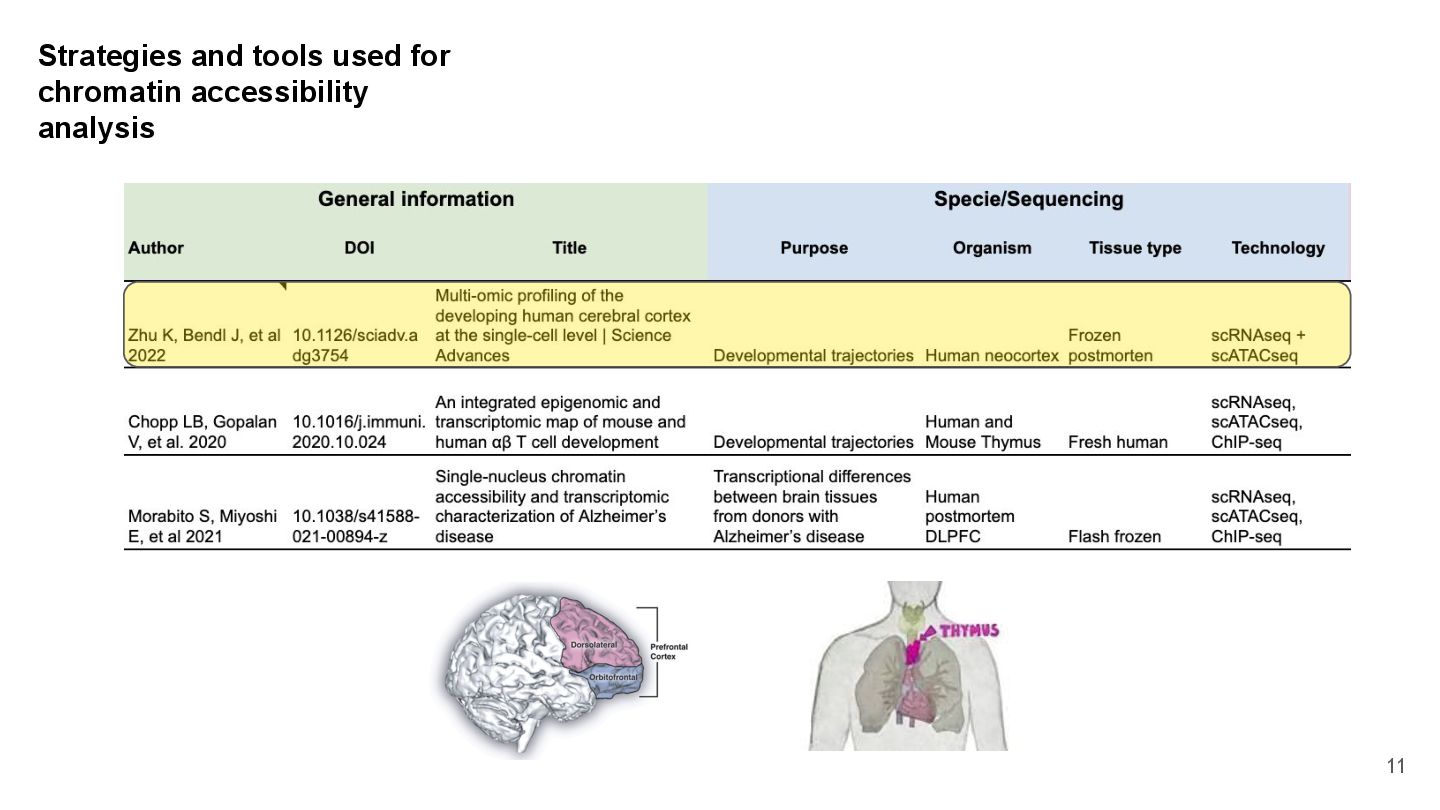
Case studies in brain and immune development demonstrate conserved regulatory logic, cell-type-specific cis-elements, and disease-associated regulatory variants.
The field is rapidly evolving, making it essential to explore new integrative tools and functional assays to map the dynamic regulatory genome.