Upgrade to Pro
— share decks privately, control downloads, hide ads and more …
Speaker Deck
Features
Speaker Deck
PRO
Sign in
Sign up for free
Search
Search
js_charts
Search
Gordon Diggs
June 14, 2013
110
0
Share
Embed
Copy iframe code
Copy JS code
Copy link
Start on current slide
js_charts
Gordon Diggs
June 14, 2013
More Decks by Gordon Diggs
See All by Gordon Diggs
John Coltrane: Lessons in Leadership
gordondiggs
2
310
The Customer Gap
gordondiggs
1
120
Picking Records with JavaScript and a Button
gordondiggs
0
89
Kafka Partitioning Algorithm
gordondiggs
0
160
Supbutton
gordondiggs
0
96
Rayons
gordondiggs
0
100
Sous Vide
gordondiggs
0
120
Dev Events & Internal Tools at Paperless Post
gordondiggs
0
130
The Joys and Pains of Working With an Old Codebase
gordondiggs
0
160
Featured
See All Featured
Bioeconomy Workshop: Dr. Julius Ecuru, Opportunities for a Bioeconomy in West Africa
akademiya2063
PRO
1
180
Technical Leadership for Architectural Decision Making
baasie
3
440
Discover your Explorer Soul
emna__ayadi
2
1.2k
SERP Conf. Vienna - Web Accessibility: Optimizing for Inclusivity and SEO
sarafernandez
2
1.5k
VelocityConf: Rendering Performance Case Studies
addyosmani
333
25k
The Success of Rails: Ensuring Growth for the Next 100 Years
eileencodes
47
8.2k
Stop Working from a Prison Cell
hatefulcrawdad
274
21k
Practical Tips for Bootstrapping Information Extraction Pipelines
honnibal
25
2k
Performance Is Good for Brains [We Love Speed 2024]
tammyeverts
12
1.7k
Marketing to machines
jonoalderson
1
5.6k
Leveraging LLMs for student feedback in introductory data science courses - posit::conf(2025)
minecr
1
320
Designing for Timeless Needs
cassininazir
1
400
Transcript
Javascript Chart Libraries Gordon Diggs PP Dev Lightning Talks 130614
Friday, June 14, 13
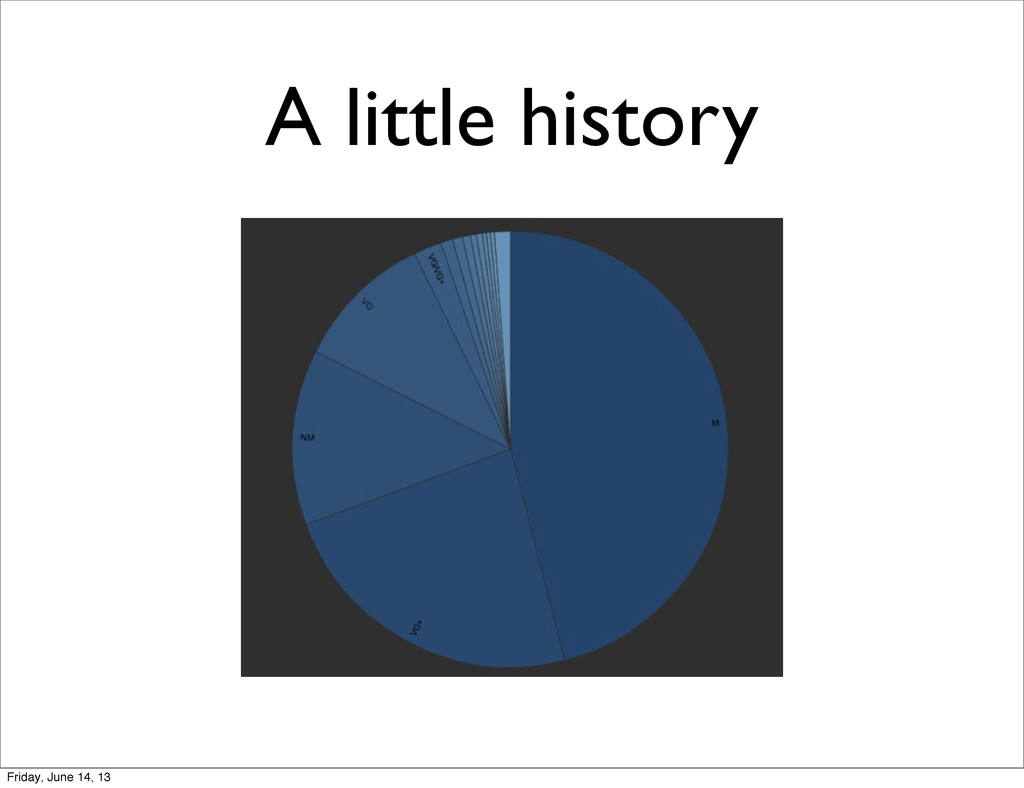
A little history Friday, June 14, 13
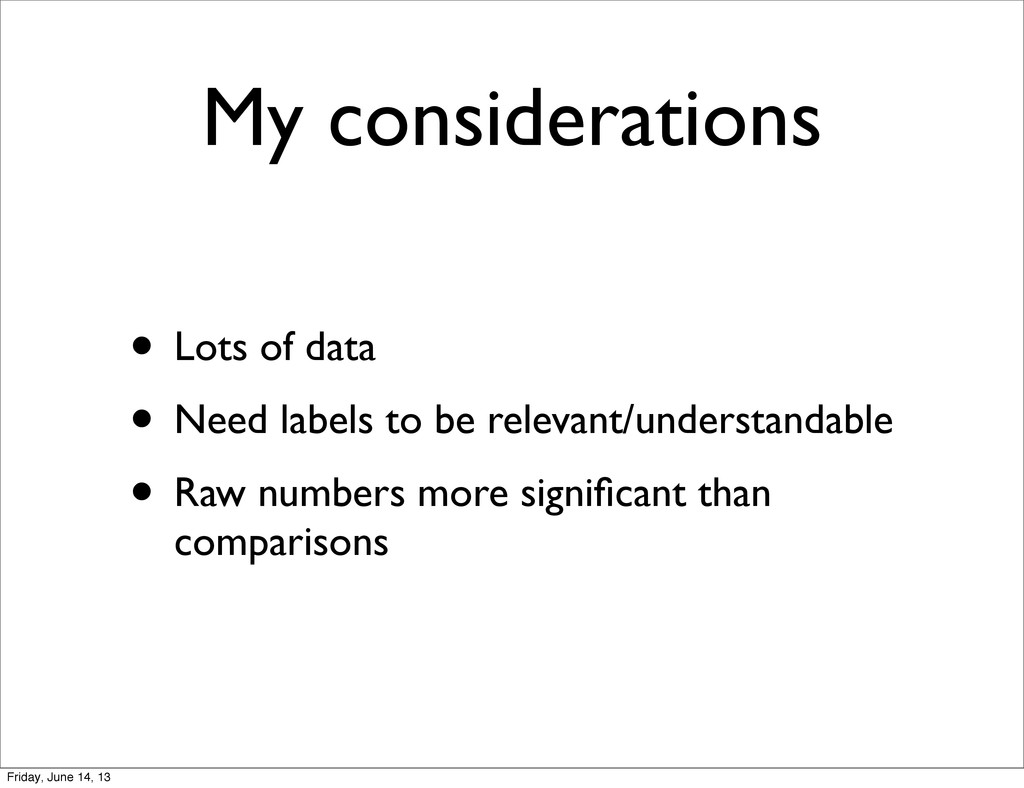
My considerations • Lots of data • Need labels to
be relevant/understandable • Raw numbers more significant than comparisons Friday, June 14, 13
d3.js / rickshaw probably amazing. Friday, June 14, 13
A chronological look at the ones I’ve used Friday, June
14, 13
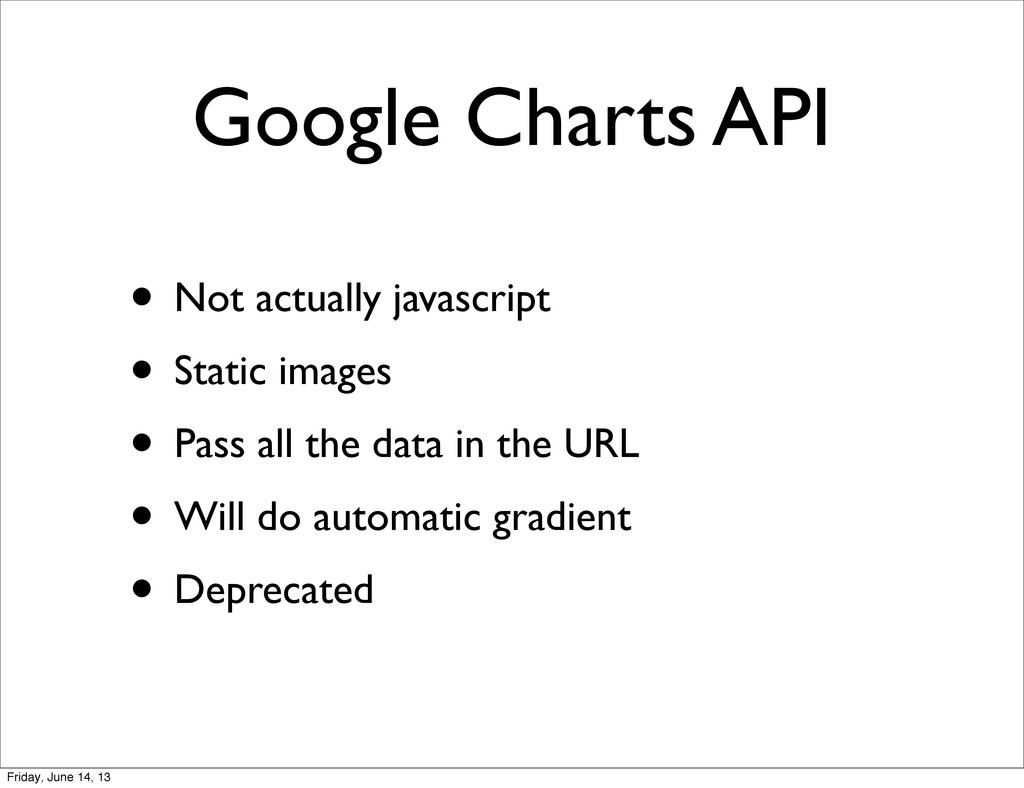
Google Charts API • Not actually javascript • Static images
• Pass all the data in the URL • Will do automatic gradient • Deprecated Friday, June 14, 13
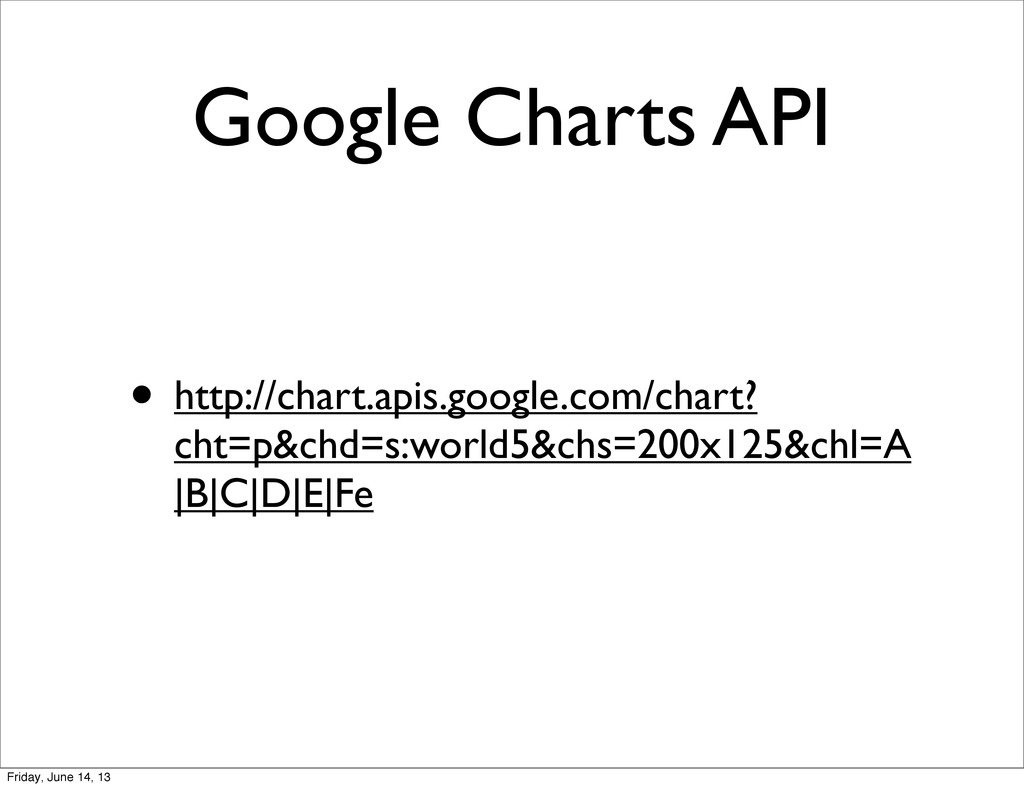
Google Charts API • http://chart.apis.google.com/chart? cht=p&chd=s:world5&chs=200x125&chl=A |B|C|D|E|Fe Friday, June 14,
13
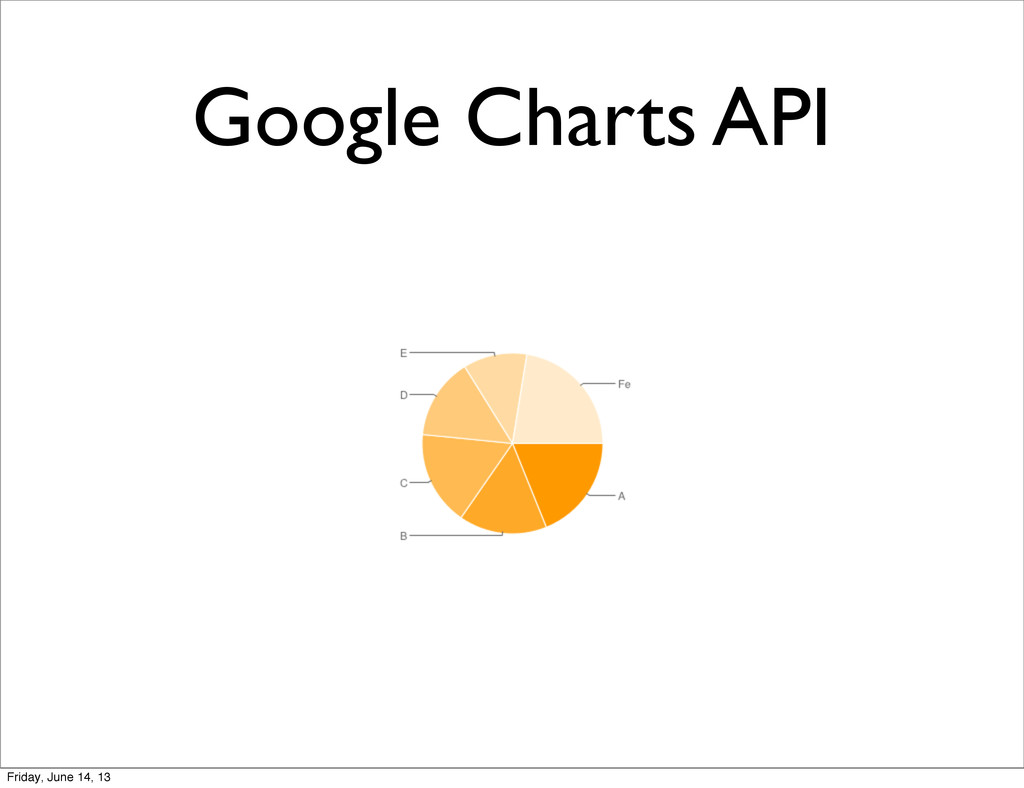
Google Charts API Friday, June 14, 13
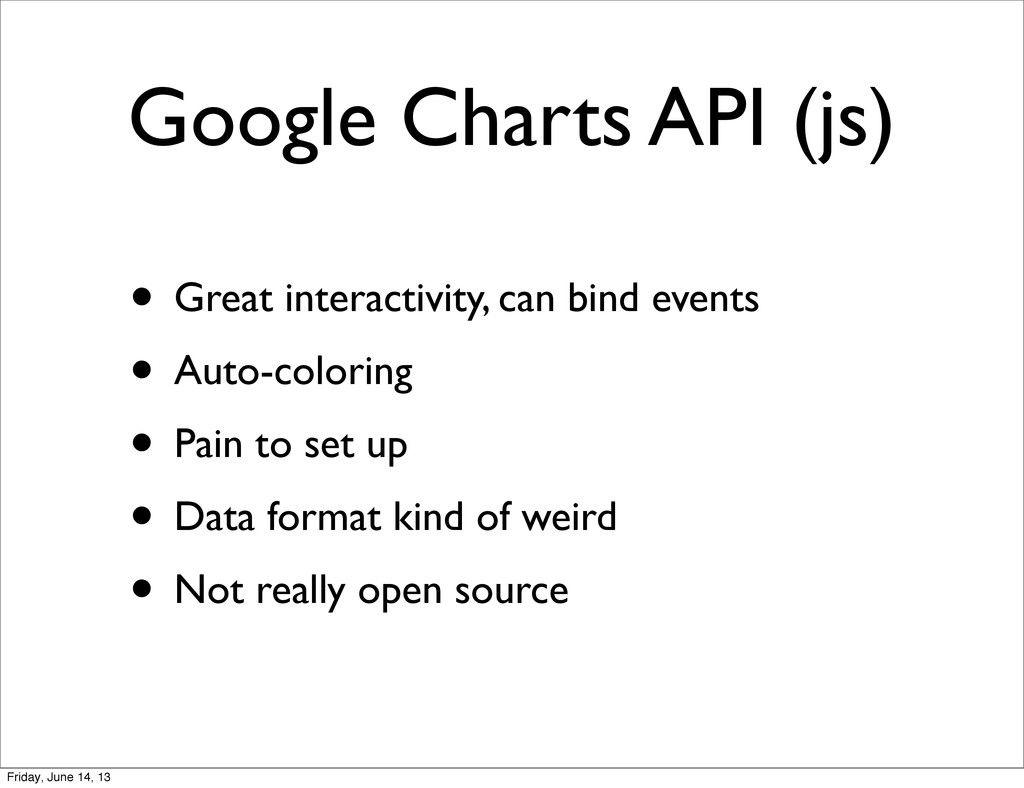
Google Charts API (js) • Great interactivity, can bind events
• Auto-coloring • Pain to set up • Data format kind of weird • Not really open source Friday, June 14, 13
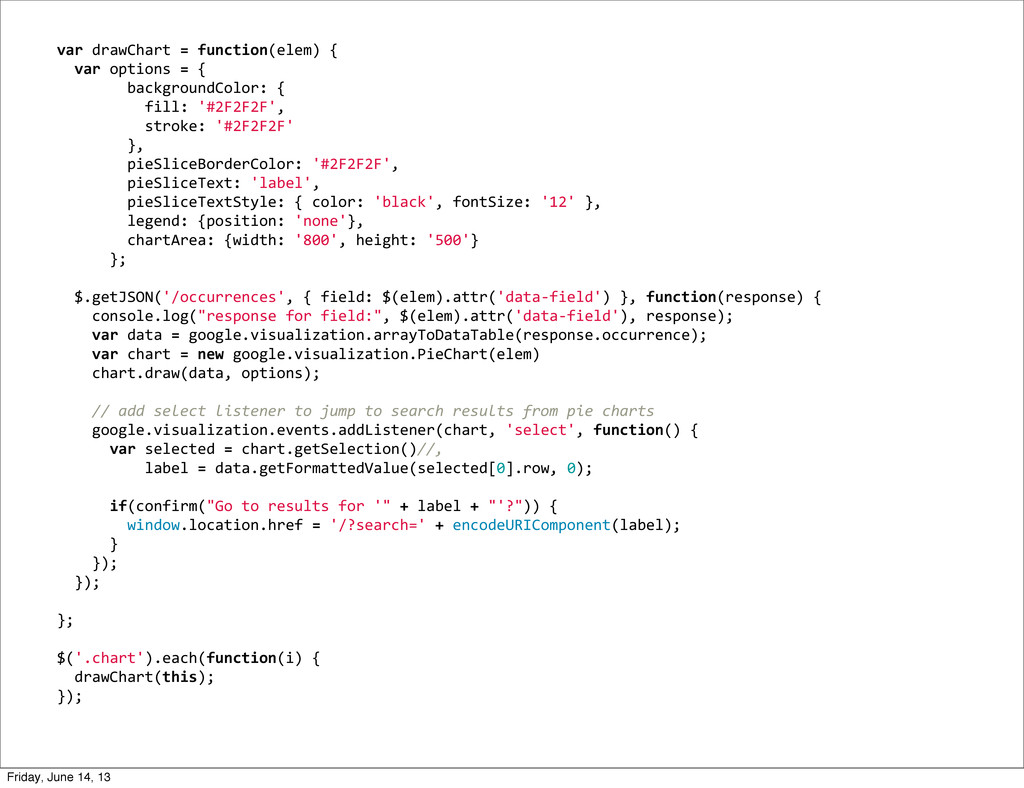
var drawChart = function(elem) {
var options = { backgroundColor: { fill: '#2F2F2F', stroke: '#2F2F2F' }, pieSliceBorderColor: '#2F2F2F', pieSliceText: 'label', pieSliceTextStyle: { color: 'black', fontSize: '12' }, legend: {position: 'none'}, chartArea: {width: '800', height: '500'} }; $.getJSON('/occurrences', { field: $(elem).attr('data-‐field') }, function(response) { console.log("response for field:", $(elem).attr('data-‐field'), response); var data = google.visualization.arrayToDataTable(response.occurrence); var chart = new google.visualization.PieChart(elem) chart.draw(data, options); // add select listener to jump to search results from pie charts google.visualization.events.addListener(chart, 'select', function() { var selected = chart.getSelection()//, label = data.getFormattedValue(selected[0].row, 0); if(confirm("Go to results for '" + label + "'?")) { window.location.href = '/?search=' + encodeURIComponent(label); } }); }); }; $('.chart').each(function(i) { drawChart(this); }); Friday, June 14, 13
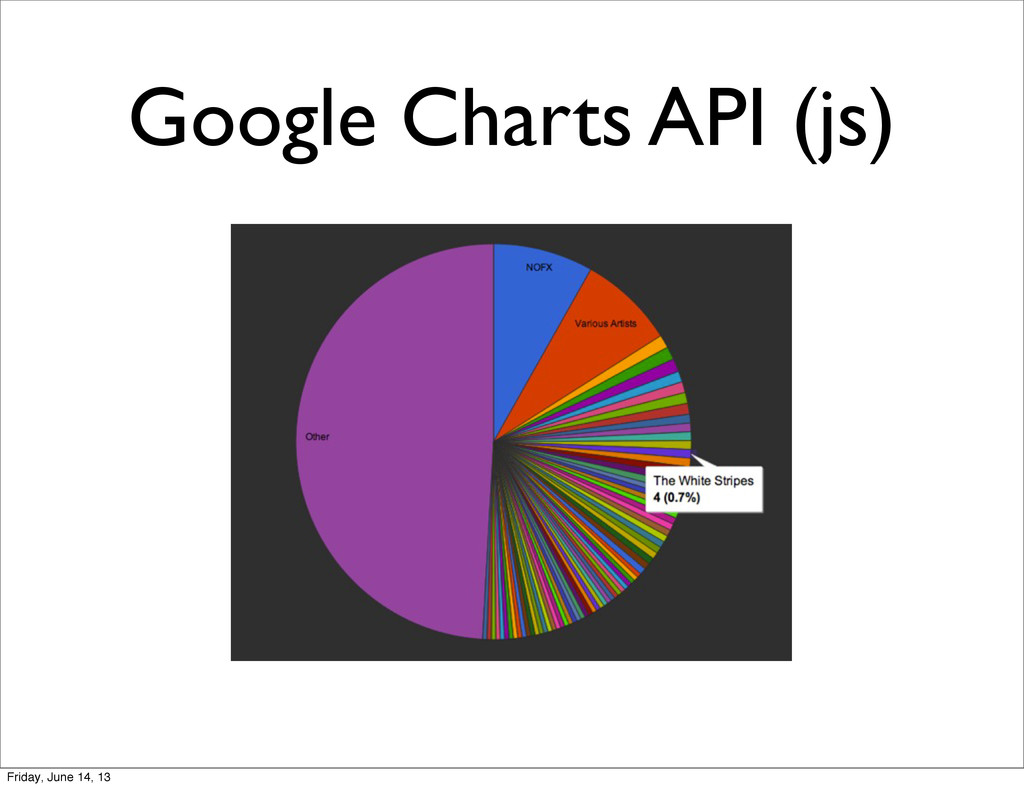
Google Charts API (js) Friday, June 14, 13
Google Charts API (js) • https://developers.google.com/chart/ Friday, June 14, 13
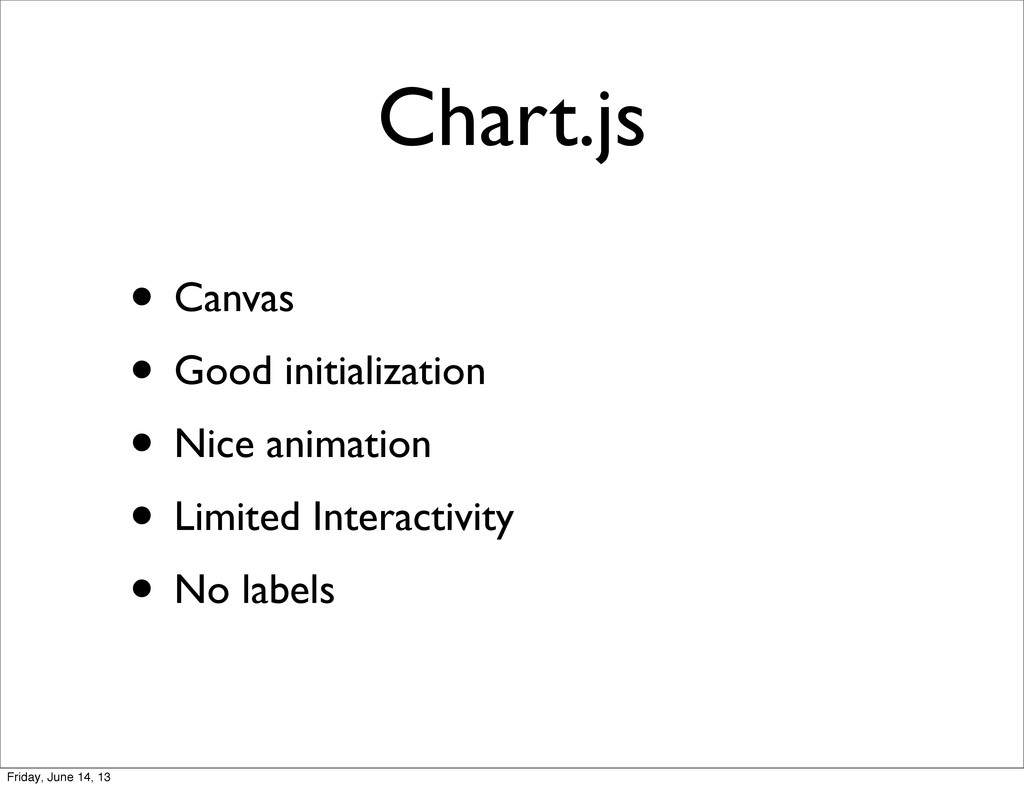
Chart.js • Canvas • Good initialization • Nice animation •
Limited Interactivity • No labels Friday, June 14, 13
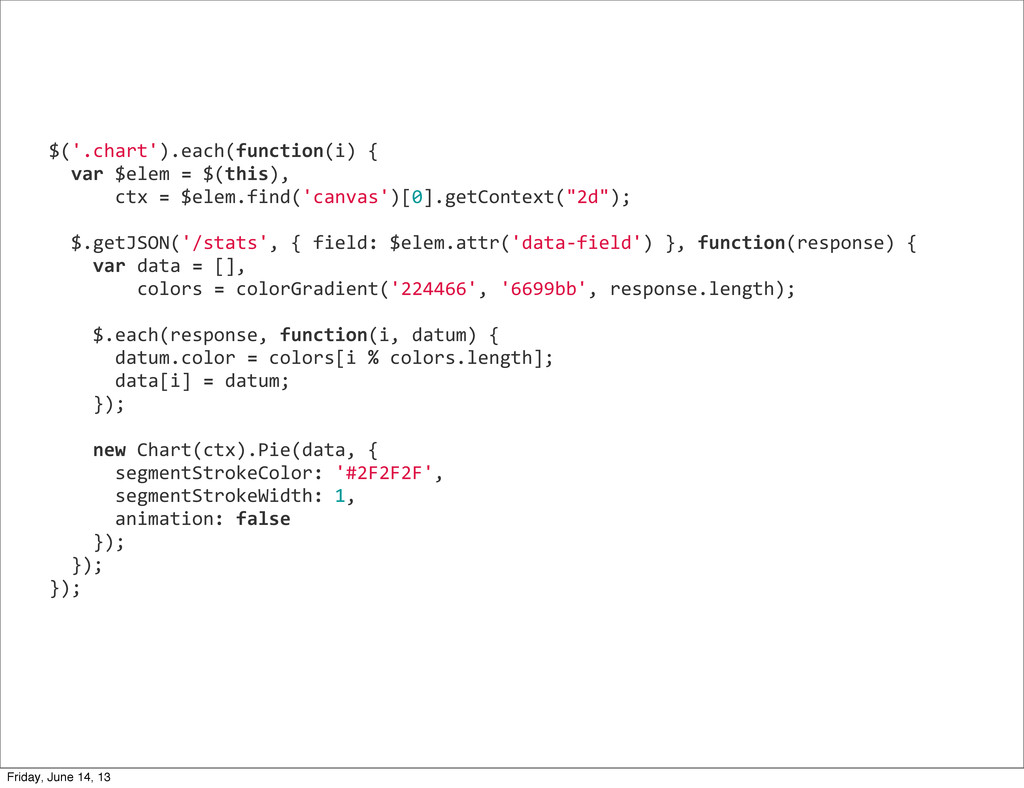
$('.chart').each(function(i) {
var $elem = $(this), ctx = $elem.find('canvas')[0].getContext("2d"); $.getJSON('/stats', { field: $elem.attr('data-‐field') }, function(response) { var data = [], colors = colorGradient('224466', '6699bb', response.length); $.each(response, function(i, datum) { datum.color = colors[i % colors.length]; data[i] = datum; }); new Chart(ctx).Pie(data, { segmentStrokeColor: '#2F2F2F', segmentStrokeWidth: 1, animation: false }); }); }); Friday, June 14, 13
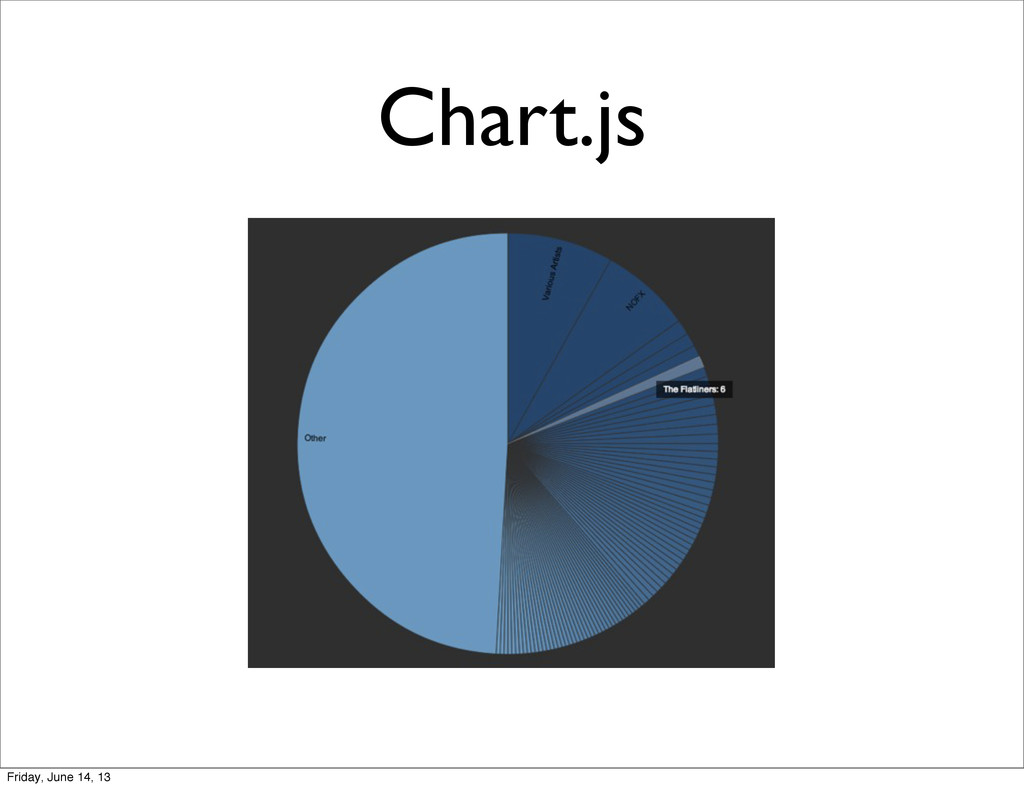
Chart.js Friday, June 14, 13
Chart.js • http://www.chartjs.org Friday, June 14, 13
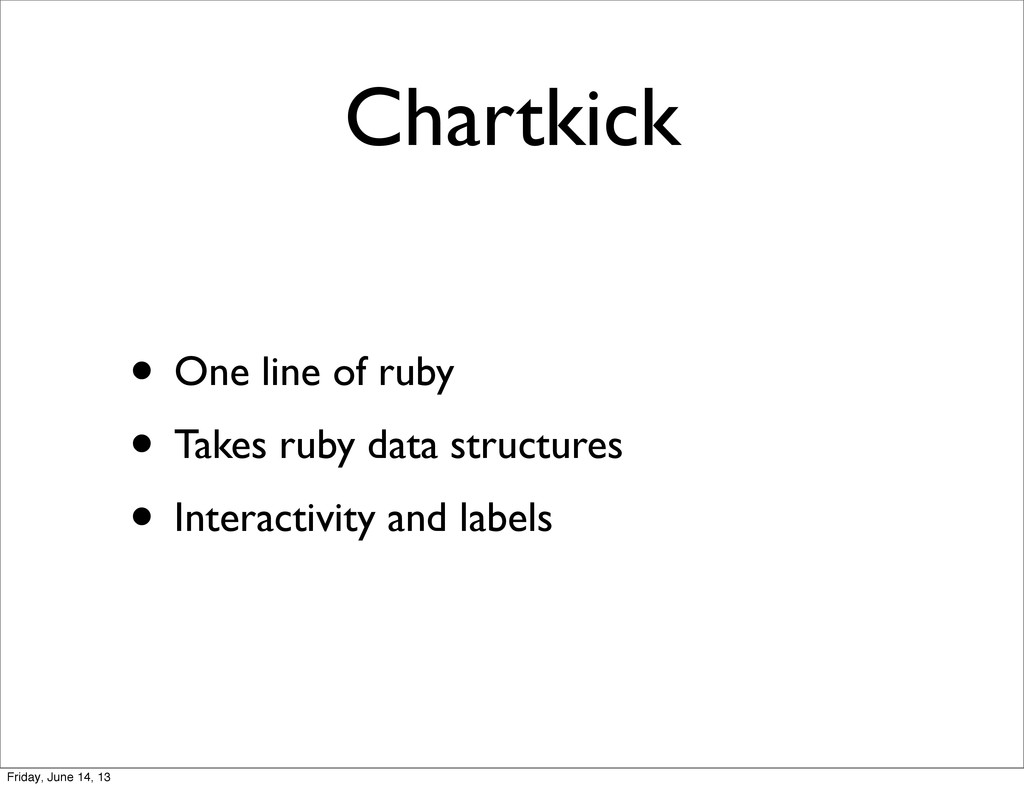
Chartkick • One line of ruby • Takes ruby data
structures • Interactivity and labels Friday, June 14, 13
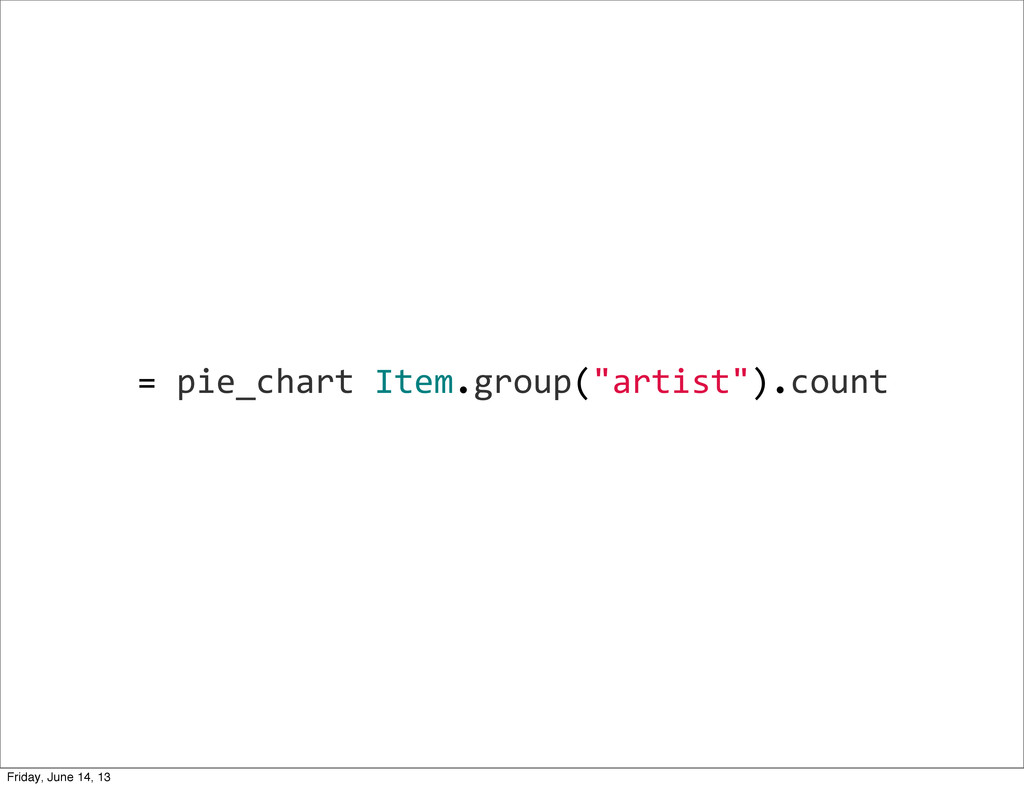
= pie_chart Item.group("artist").count Friday, June 14, 13
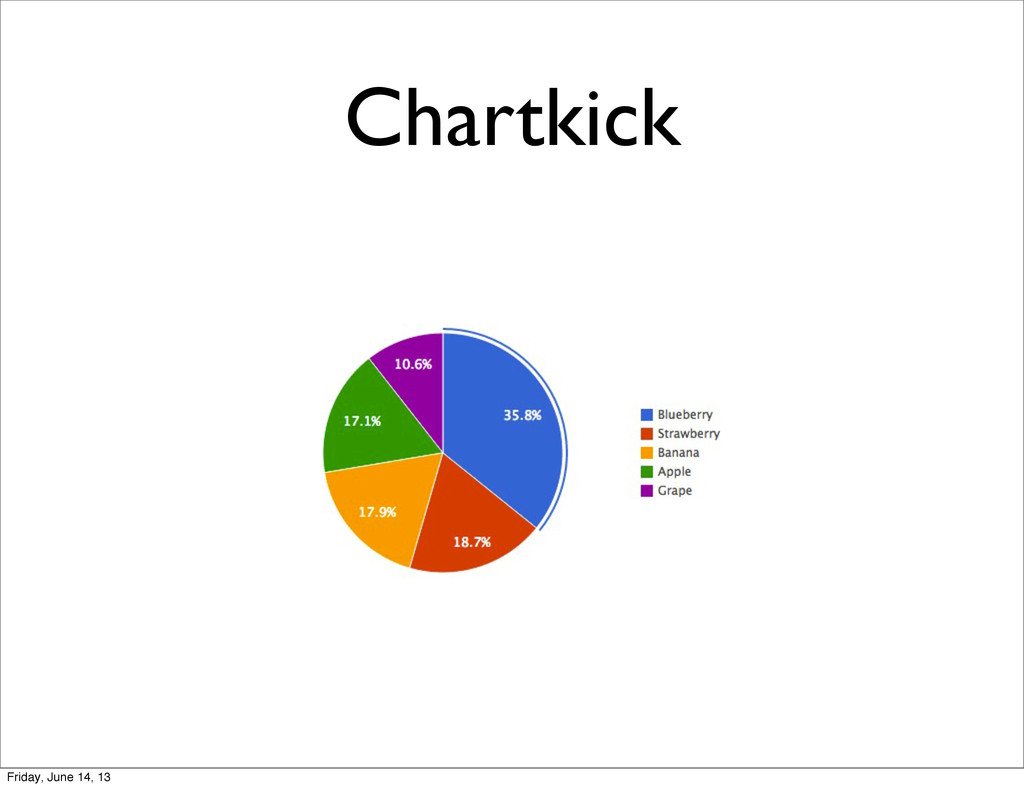
Chartkick Friday, June 14, 13
Chartkick • http://ankane.github.io/chartkick/ Friday, June 14, 13
BONUS: jqcloud • Easy way to make word clouds with
jQuery Friday, June 14, 13
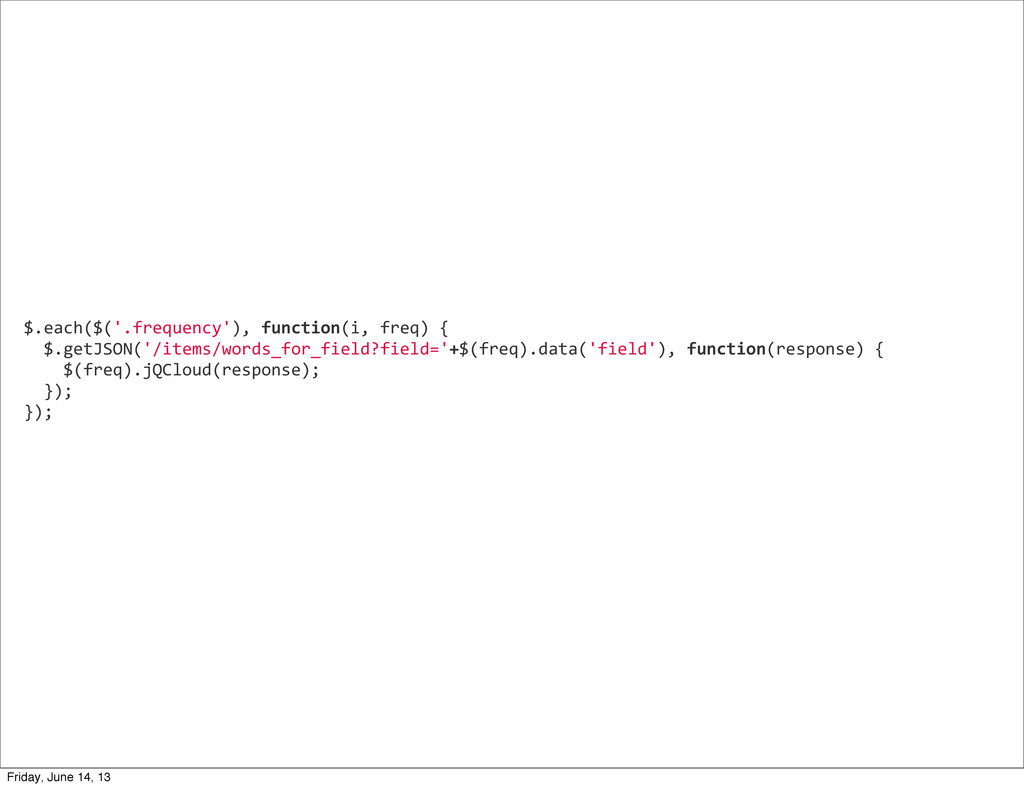
$.each($('.frequency'), function(i, freq) { $.getJSON('/items/words_for_field?field='+$(freq).data('field'), function(response)
{ $(freq).jQCloud(response); }); }); Friday, June 14, 13
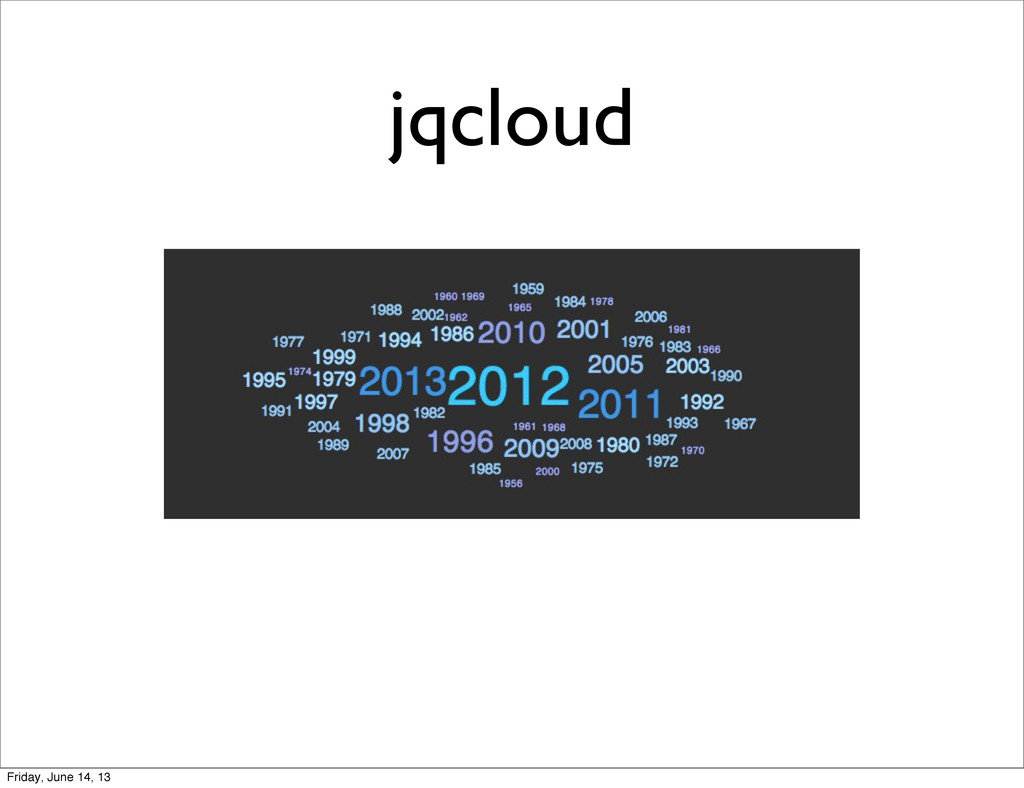
jqcloud Friday, June 14, 13
jqcloud • https://github.com/lucaong/jQCloud Friday, June 14, 13
Thanks! Friday, June 14, 13